Stockbuilding (% of GDP) Forecast for Brazil · and stay there, we forecast that the BCB will...
13
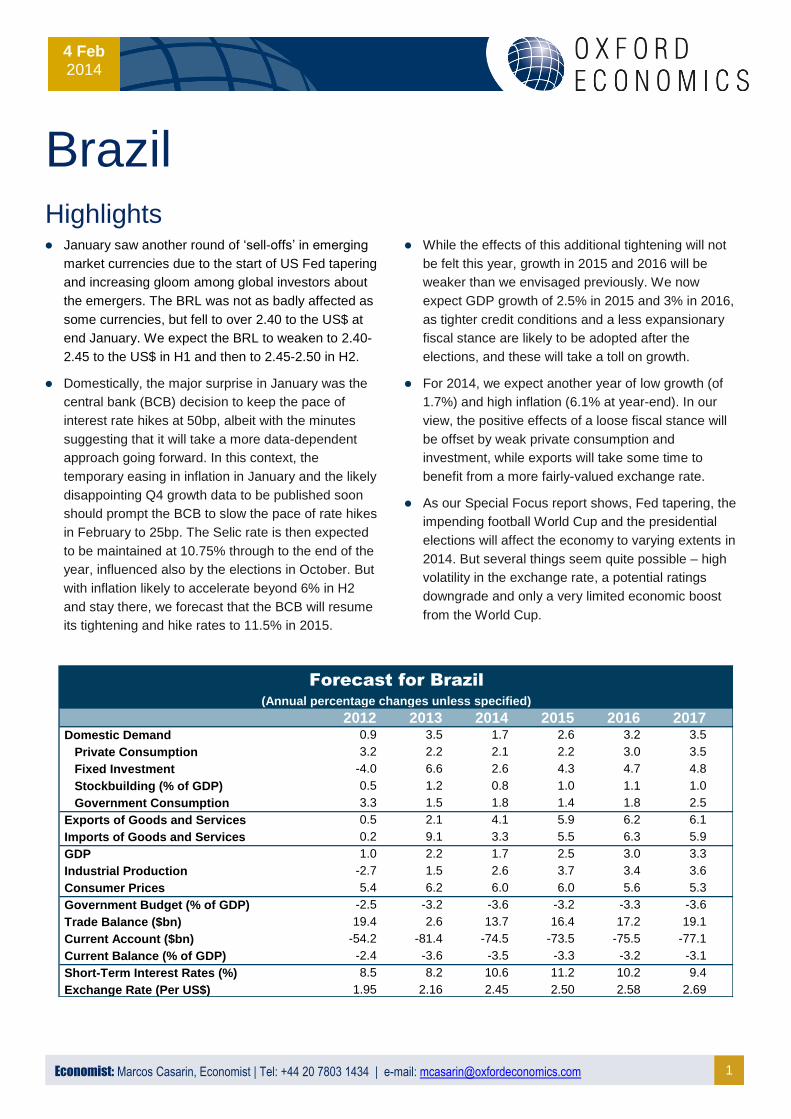
1 Economist: Marcos Casarin, Economist | Tel: +44 20 7803 1434 | e-mail: [email protected] 4 Feb 2014 Brazil Highlights January saw another round of ‘sell-offs’ in emerging market currencies due to the start of US Fed tapering and increasing gloom among global investors about the emergers. The BRL was not as badly affected as some currencies, but fell to over 2.40 to the US$ at end January. We expect the BRL to weaken to 2.40- 2.45 to the US$ in H1 and then to 2.45-2.50 in H2. Domestically, the major surprise in January was the central bank (BCB) decision to keep the pace of interest rate hikes at 50bp, albeit with the minutes suggesting that it will take a more data-dependent approach going forward. In this context, the temporary easing in inflation in January and the likely disappointing Q4 growth data to be published soon should prompt the BCB to slow the pace of rate hikes in February to 25bp. The Selic rate is then expected to be maintained at 10.75% through to the end of the year, influenced also by the elections in October. But with inflation likely to accelerate beyond 6% in H2 and stay there, we forecast that the BCB will resume its tightening and hike rates to 11.5% in 2015. While the effects of this additional tightening will not be felt this year, growth in 2015 and 2016 will be weaker than we envisaged previously. We now expect GDP growth of 2.5% in 2015 and 3% in 2016, as tighter credit conditions and a less expansionary fiscal stance are likely to be adopted after the elections, and these will take a toll on growth. For 2014, we expect another year of low growth (of 1.7%) and high inflation (6.1% at year-end). In our view, the positive effects of a loose fiscal stance will be offset by weak private consumption and investment, while exports will take some time to benefit from a more fairly-valued exchange rate. As our Special Focus report shows, Fed tapering, the impending football World Cup and the presidential elections will affect the economy to varying extents in 2014. But several things seem quite possible – high volatility in the exchange rate, a potential ratings downgrade and only a very limited economic boost from the World Cup. 2012 2013 2014 2015 2016 2017 Domestic Demand 0.9 3.5 1.7 2.6 3.2 3.5 Private Consumption 3.2 2.2 2.1 2.2 3.0 3.5 Fixed Investment -4.0 6.6 2.6 4.3 4.7 4.8 Stockbuilding (% of GDP) 0.5 1.2 0.8 1.0 1.1 1.0 Government Consumption 3.3 1.5 1.8 1.4 1.8 2.5 Exports of Goods and Services 0.5 2.1 4.1 5.9 6.2 6.1 Imports of Goods and Services 0.2 9.1 3.3 5.5 6.3 5.9 GDP 1.0 2.2 1.7 2.5 3.0 3.3 Industrial Production -2.7 1.5 2.6 3.7 3.4 3.6 Consumer Prices 5.4 6.2 6.0 6.0 5.6 5.3 Government Budget (% of GDP) -2.5 -3.2 -3.6 -3.2 -3.3 -3.6 Trade Balance ($bn) 19.4 2.6 13.7 16.4 17.2 19.1 Current Account ($bn) -54.2 -81.4 -74.5 -73.5 -75.5 -77.1 Current Balance (% of GDP) -2.4 -3.6 -3.5 -3.3 -3.2 -3.1 Short-Term Interest Rates (%) 8.5 8.2 10.6 11.2 10.2 9.4 Exchange Rate (Per US$) 1.95 2.16 2.45 2.50 2.58 2.69 Forecast for Brazil (Annual percentage changes unless specified)
Transcript of Stockbuilding (% of GDP) Forecast for Brazil · and stay there, we forecast that the BCB will...
1 Economist: Marcos Casarin, Economist | Tel: +44 20 7803 1434 | e-mail: [email protected]
4 Feb 2014
Brazil Highlights
January saw another round of ‘sell-offs’ in emerging
market currencies due to the start of US Fed tapering
and increasing gloom among global investors about
the emergers. The BRL was not as badly affected as
some currencies, but fell to over 2.40 to the US$ at
end January. We expect the BRL to weaken to 2.40-
2.45 to the US$ in H1 and then to 2.45-2.50 in H2.
Domestically, the major surprise in January was the
central bank (BCB) decision to keep the pace of
interest rate hikes at 50bp, albeit with the minutes
suggesting that it will take a more data-dependent
approach going forward. In this context, the
temporary easing in inflation in January and the likely
disappointing Q4 growth data to be published soon
should prompt the BCB to slow the pace of rate hikes
in February to 25bp. The Selic rate is then expected
to be maintained at 10.75% through to the end of the
year, influenced also by the elections in October. But
with inflation likely to accelerate beyond 6% in H2
and stay there, we forecast that the BCB will resume
its tightening and hike rates to 11.5% in 2015.
While the effects of this additional tightening will not
be felt this year, growth in 2015 and 2016 will be
weaker than we envisaged previously. We now
expect GDP growth of 2.5% in 2015 and 3% in 2016,
as tighter credit conditions and a less expansionary
fiscal stance are likely to be adopted after the
elections, and these will take a toll on growth.
For 2014, we expect another year of low growth (of
1.7%) and high inflation (6.1% at year-end). In our
view, the positive effects of a loose fiscal stance will
be offset by weak private consumption and
investment, while exports will take some time to
benefit from a more fairly-valued exchange rate.
As our Special Focus report shows, Fed tapering, the
impending football World Cup and the presidential
elections will affect the economy to varying extents in
2014. But several things seem quite possible – high
volatility in the exchange rate, a potential ratings
downgrade and only a very limited economic boost
from the World Cup.
2012 2013 2014 2015 2016 2017Domestic Demand 0.9 3.5 1.7 2.6 3.2 3.5
Private Consumption 3.2 2.2 2.1 2.2 3.0 3.5
Fixed Investment -4.0 6.6 2.6 4.3 4.7 4.8
Stockbuilding (% of GDP) 0.5 1.2 0.8 1.0 1.1 1.0
Government Consumption 3.3 1.5 1.8 1.4 1.8 2.5
Exports of Goods and Services 0.5 2.1 4.1 5.9 6.2 6.1
Imports of Goods and Services 0.2 9.1 3.3 5.5 6.3 5.9
GDP 1.0 2.2 1.7 2.5 3.0 3.3
Industrial Production -2.7 1.5 2.6 3.7 3.4 3.6
Consumer Prices 5.4 6.2 6.0 6.0 5.6 5.3
Government Budget (% of GDP) -2.5 -3.2 -3.6 -3.2 -3.3 -3.6
Trade Balance ($bn) 19.4 2.6 13.7 16.4 17.2 19.1
Current Account ($bn) -54.2 -81.4 -74.5 -73.5 -75.5 -77.1
Current Balance (% of GDP) -2.4 -3.6 -3.5 -3.3 -3.2 -3.1
Short-Term Interest Rates (%) 8.5 8.2 10.6 11.2 10.2 9.4
Exchange Rate (Per US$) 1.95 2.16 2.45 2.50 2.58 2.69
Forecast for Brazil
(Annual percentage changes unless specified)
2 Economist: Marcos Casarin, Economist | Tel: +44 20 7803 1434 | e-mail: [email protected]
4 Feb 2014
Special Focus Top 5 predictions for Brazil in 2014
The year began with the US Fed beginning to taper its asset-purchasing programme (QE) and a
number of adverse developments in several emergers. This prompted renewed volatility in
emerging market currencies, and has affected the Brazilian real (BRL), albeit it has not fallen to the
same extent as some currencies. Later this year, Brazil will host the football World Cup in June-
July, while presidential elections will be held in October. How will these events affect the outlook for
2014? Here are our ‘Top 5’ predictions for this year.
QE tapering, World Cup and elections…how
do they affect the outlook?
US Fed tapering, Brazil’s hosting of the football World
Cup and the country’s presidential elections in October
are all likely to affect the economic outlook in 2014,
though to varying extents and through different channels.
Here are five likely consequences.
1. Fed tapering will lead to a weaker BRL
The combination of the US Fed reducing its monetary
stimulus by tapering its QE programme and a deepening
gloom about the health of the emerging economies – fed
by a succession of adverse developments in particular
countries – has led to a further sell-off in emerging
market currencies this year. This has led to another
round of depreciation (and volatility) for the BRL, albeit its
decline has been quite modest compared with some
currencies, protected to some extent by the country’s
high interest rates.
But with US monetary policy starting to move towards
normalisation, leading to a gradual withdrawal of excess
liquidity in the global economy, investors will be more
focused on fundamentals when allocating their portfolios.
In this context, the deterioration of Brazil’s public finances
(and the lack of transparency surrounding them), as well
as the country’s large current account deficit, suggest
that money will continue to flow out of the country in
2014. Hence, we expect the BRL to depreciate
throughout the year, with peaks of volatility ahead of
COPOM and FOMC meetings and, of course, the
elections in October. We expect the BRL to trade
between 2.40 and 2.45 per US$ in H1, and 2.45 and 2.50
in H2, compared to a 2013 average level of 2.16. That
said, we do not see a currency crisis in the pipeline as
the central bank, with its daily currency-intervention
programme and US$350bn of foreign exchange
reserves, has enough tools to counter a pronounced
attack on the BRL. The good news for Brazil is that the
depreciating trend will lead to the country regaining some
competitiveness in export markets, as the BRL will move
closer to its long-run ‘equilibrium’ value. This will help to
induce an adjustment of Brazil’s external imbalances. We
expect the current account deficit will narrow to US$74bn
in 2014, from a peak of US$81bn in 2013.
2. World Cup will not boost growth
This year Brazil will host football’s World Cup, for the first
time since 1950. For a country known for its passion for
football, most would expect a big ‘party’ to take place for
at least several months. However, constant public
protests against the use of taxpayer money to build (or
refurbish) 12 expensive world-class stadiums to the
possible detriment of improving the country’s
infrastructure ahead of the tournament suggest that
tourists may expect to find a more demanding and (a
little) less cheerful crowd.
We forecast the economic impacts from the World Cup to
be very limited. One would have expected to see a surge
in investment in the years prior to the tournament, as the
government promised not only new stadiums, but also
modernised airports, extended underground transport
and more bus lines in the host cities. As it has turned out,
the current administration has really struggled to
3 Economist: Marcos Casarin, Economist | Tel: +44 20 7803 1434 | e-mail: [email protected]
4 Feb 2014
implement new infrastructure projects and the authorities
will barely deliver the stadiums prior to the World Cup.
Overall, the aggregate numbers for investment show that
it has actually fallen as a share of GDP since 2010,
suggesting that expensive and inefficient public
investment may have crowded out private expenditure.
And while the arrival of hundreds of thousands of tourists
during the tournament will probably boost retail trade
figures in Q2 and Q3, and lead to a smaller deficit on the
services trade balance, the impact will be temporary.
Overall, the World Cup will only have a very limited effect
on the Brazilian economy.
3. Uncertainty ahead of the elections
Although recent opinion polls suggest that President
Dilma Rousseff, from the Worker’s Party (PT), will be re-
elected in October, there is considerable uncertainty
about the possible economic environment. As the
economic programmes of the candidates have not yet
been announced, businesses still do not know what to
expect for the next four years. Brazilians are not even
clear about the incumbent’s policy agenda in the likely
event of her re-election: whether she will move towards a
more market-friendly agenda or not may well depend on
the margin of her victory in the election. In the meantime,
the general feeling of uncertainty is another factor
dampening private investment. Our Special Focus report
for December examined the fall in business confidence
over the last few quarters and the sharp decline in
expectations of GDP growth for this year. Heightened
uncertainty, a volatile exchange rate and a very fragile
equity market all point to sluggish growth of private
investment this year, further amplifying the economic
slowdown.
The one certainty, perhaps, this year is a deterioration in
public finances. Against a backdrop of weak revenue
growth, the government will struggle to achieve its target
of delivering a primary surplus of 2% of GDP this year.
With half of the government’s primary spending linked to
an increasing minimum salary, Brazil has very limited
room to trim its budget. As such, we forecast the primary
surplus will fall to 1.2% of GDP this year, from an
estimated 1.8% in 2013. While this will be just enough to
stabilise the debt-to-GDP ratio, it may not be enough to
avert a downgrade in Brazil’s sovereign credit rating. And
though this would not mean a loss of its investment-
grade status, a downgrade in an election year could dent
Ms Rousseff’s credibility and popularity, and have
implications for policy after October.
4. Inflation will stay around 6%
Despite a tighter monetary policy stance, the outlook for
inflation remains grim. This is because monetary policy
only affects free-market prices, not those regulated by
the government. Due to a deliberate policy of trying to
control prices last year via discretionary subsidies to
electricity tariffs, bus fares and petrol prices, regulated
prices rose by an exceptionally low rate of 1.5% on the
year in December. Free-market prices, on the other
hand, rose by 7.3%, taking headline inflation to 5.9%. But
during this year, regulated prices will rise by at least 3%
as petrol prices will have to be raised and cash-strapped
municipalities will not be able to afford another year of
frozen bus fares. In addition, there will be the pass-
through of a 15% depreciation of the BRL and price
increases to hotel tariffs, flight tickets and other services
related to the World Cup; this will result in another year of
inflation around 6%. And while fiscal policy may become
slightly less expansionary after the elections, efforts to
tame inflation will depend on the central bank. We now
expect an additional phase of rate hikes in early-2015,
taking the Selic rate to a three-year high of 11.50% in the
first year of the next administration.
5. Growth will disappoint – again!
As a result of tighter credit conditions, stubborn inflation
and shrinking household purchasing power, private
consumption – the main engine of the economy for much
of the last decade – will fail to support growth. With
household spending forecast to grow by a meagre 2.1%
this year and business investment not expected to take
off, economic growth is bound to disappoint again this
year. We forecast GDP growth of just 1.7% in 2014,
taking the average pace of expansion during the
Rousseff administration to only 1.9% pa – the worst
performance since the late 1980s. Considering that
previous presidents have had to deal with problems like
ending hyperinflation, several Brazil-specific crises in the
late 1990s and in 2002, and the global crisis of 2007-09,
Ms Rousseff’s track-record does not look that good and
is not an argument for her agenda of more state
intervention, no structural reforms and excessively loose
macroeconomic policies.
However, 2014 will hopefully serve as a lesson for
Brazilian policy makers. The country risks entering an era
where 2% GDP growth and 6% inflation becomes “the
new normal” unless Brazil moves away from an
exhausted consumption-led growth model based on
subsidised credit.
4 Economist: Marcos Casarin, Economist | Tel: +44 20 7803 1434 | e-mail: [email protected]
4 Feb 2014
Forecast Overview
Higher interest rates, lower growth…
The main change to our baseline forecast this month
relates to monetary policy and its effects on the economy.
In January, the central bank surprisingly maintained the
pace of interest rate hikes by raising the Selic rate 50bp
to 10.5%. This has prompted us to review our forecast for
monetary policy in 2014 and 2015, which will in turn affect
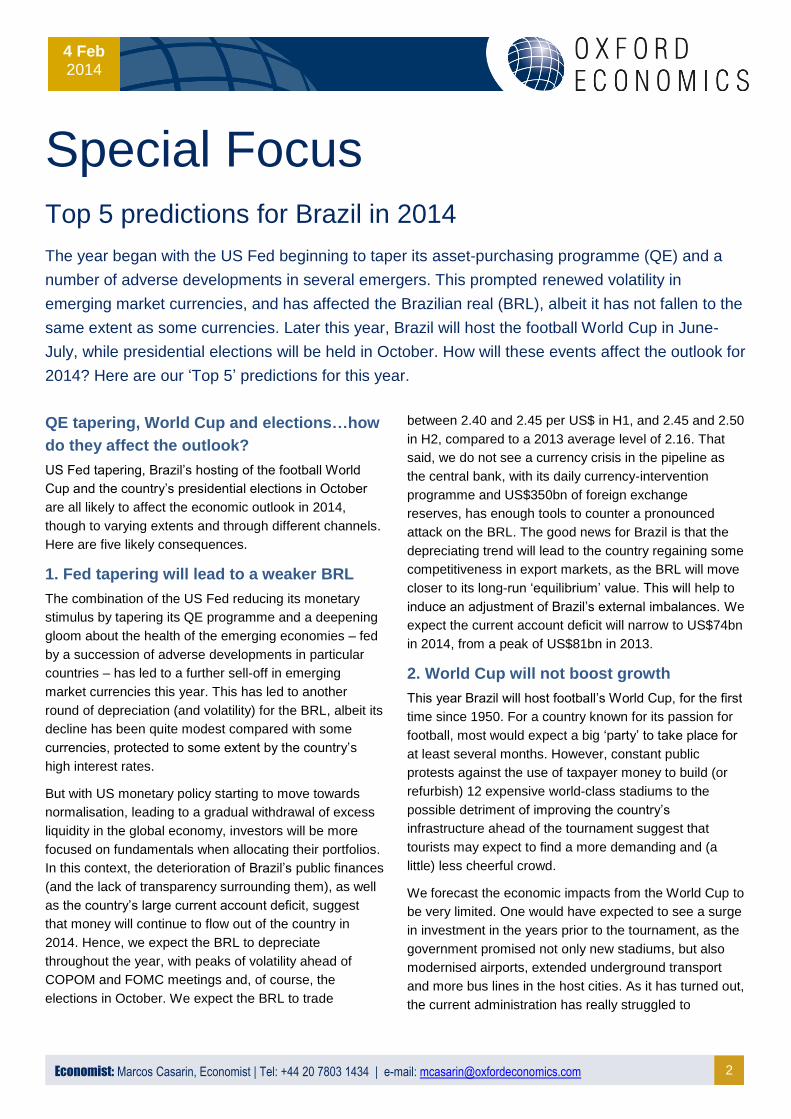
growth further out in the business cycle. We now expect
GDP growth of 2.5% in 2015 and 3% in 2016, down from
2.7% and 3.2% previously. However, our 2014 growth
forecast is unchanged from last month. Overall, the
outlook will be affected by:
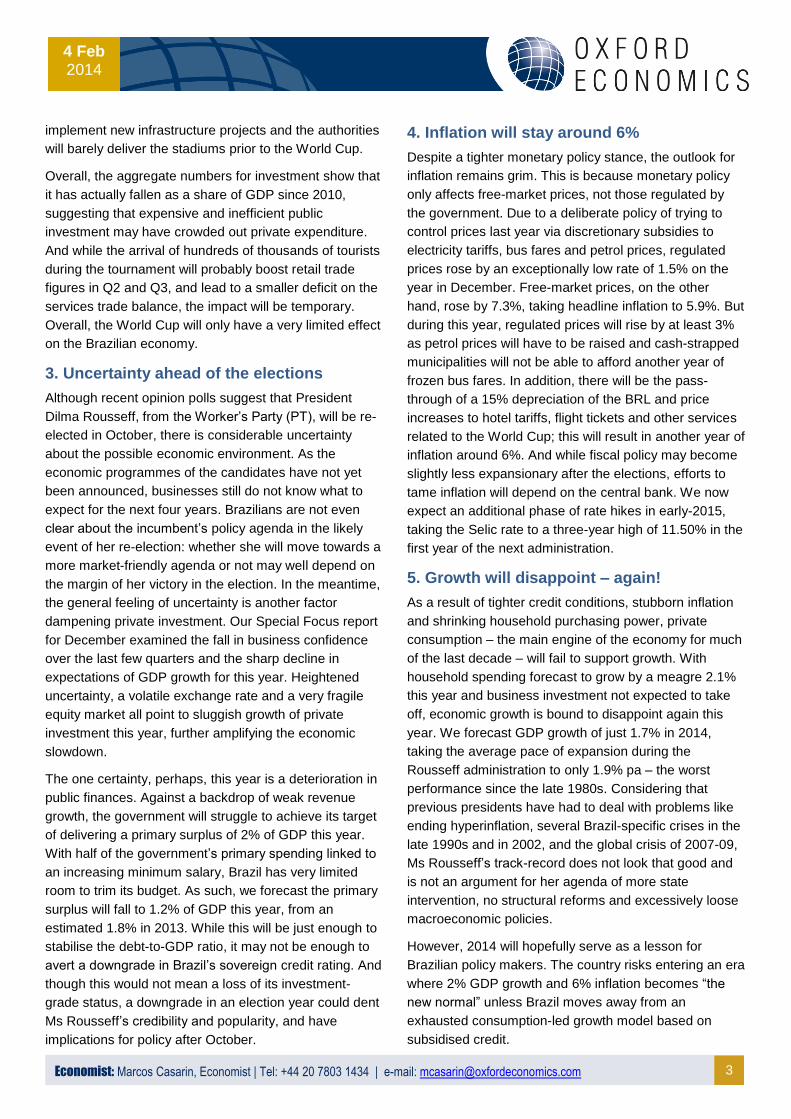
Higher interest rates – we now expect the Selic rate
to end 2014 at 10.75%, after an expected rate hike of
25bp in February. But given that inflation is likely to
accelerate above 6% in H2 2014 and persist at that
level, we now expect an addition tightening phase to
take place in H1 2015, taking the Selic rate to 11.5%.
Although this will restore some of the central bank’s
lost credibility by underlying its commitment to price
stability, it will not be enough to bring inflation back to
the 4.5% target as pricing pressures will persist given
a loose fiscal policy, exchange rate depreciation, and
likely rising trend in regulated prices.
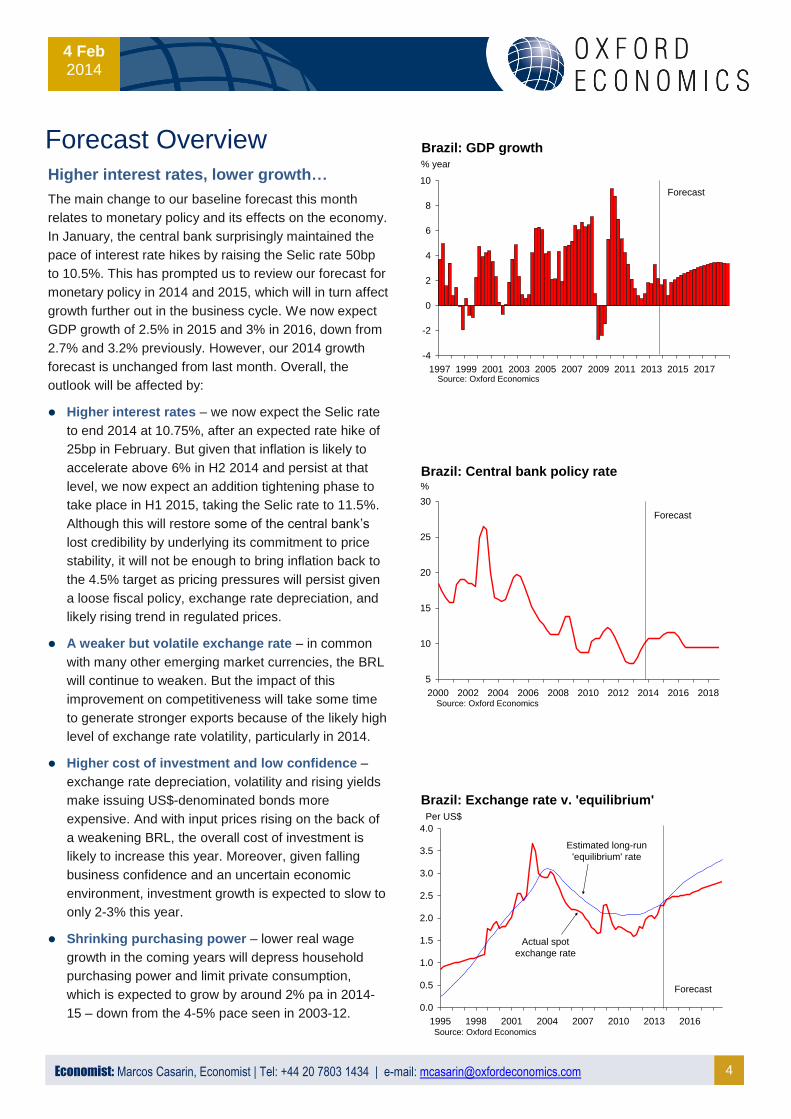
A weaker but volatile exchange rate – in common
with many other emerging market currencies, the BRL
will continue to weaken. But the impact of this
improvement on competitiveness will take some time
to generate stronger exports because of the likely high
level of exchange rate volatility, particularly in 2014.
Higher cost of investment and low confidence –
exchange rate depreciation, volatility and rising yields
make issuing US$-denominated bonds more
expensive. And with input prices rising on the back of
a weakening BRL, the overall cost of investment is
likely to increase this year. Moreover, given falling
business confidence and an uncertain economic
environment, investment growth is expected to slow to
only 2-3% this year.
Shrinking purchasing power – lower real wage
growth in the coming years will depress household
purchasing power and limit private consumption,
which is expected to grow by around 2% pa in 2014-
15 – down from the 4-5% pace seen in 2003-12.
-4
-2
0
2
4
6
8
10
1997 1999 2001 2003 2005 2007 2009 2011 2013 2015 2017Source: Oxford Economics
% year
Brazil: GDP growth
Forecast
0.0
0.5
1.0
1.5
2.0
2.5
3.0
3.5
4.0
1995 1998 2001 2004 2007 2010 2013 2016Source: Oxford Economics
Brazil: Exchange rate v. 'equilibrium'
Forecast
Estimated long-run
'equilibrium' rate
Actual spot
exchange rate
Per US$
5
10
15
20
25
30
2000 2002 2004 2006 2008 2010 2012 2014 2016 2018
%
Source: Oxford Economics
Brazil: Central bank policy rate
Forecast
5 Economist: Marcos Casarin, Economist | Tel: +44 20 7803 1434 | e-mail: [email protected]
4 Feb 2014
No reforms, slow growth in the medium term
Since mid-2013 we have lowered our medium-term
outlook for the key emerging economies in the light of
various structural problems. For Brazil, we forecast GDP
growth of 3.1% pa in 2015-18. Although the economy has
a wealth of natural resources and favourable population
growth, its expansion is still hampered by:
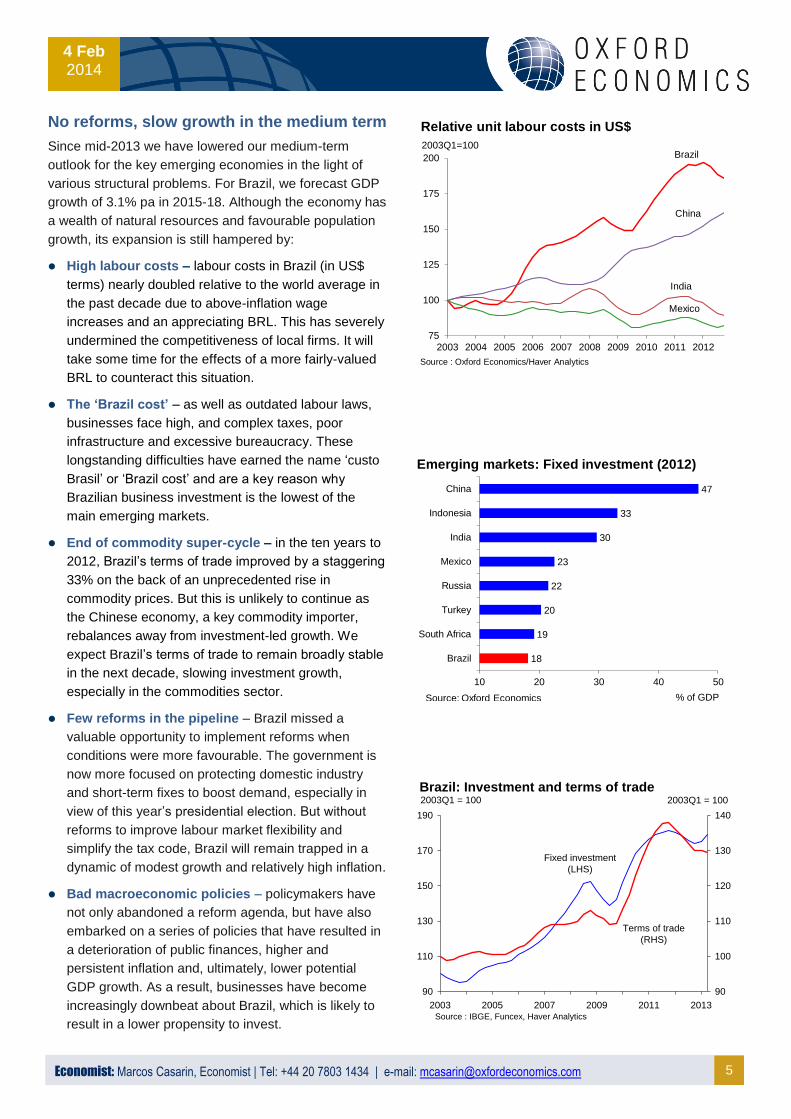
High labour costs – labour costs in Brazil (in US$
terms) nearly doubled relative to the world average in
the past decade due to above-inflation wage
increases and an appreciating BRL. This has severely
undermined the competitiveness of local firms. It will
take some time for the effects of a more fairly-valued
BRL to counteract this situation.
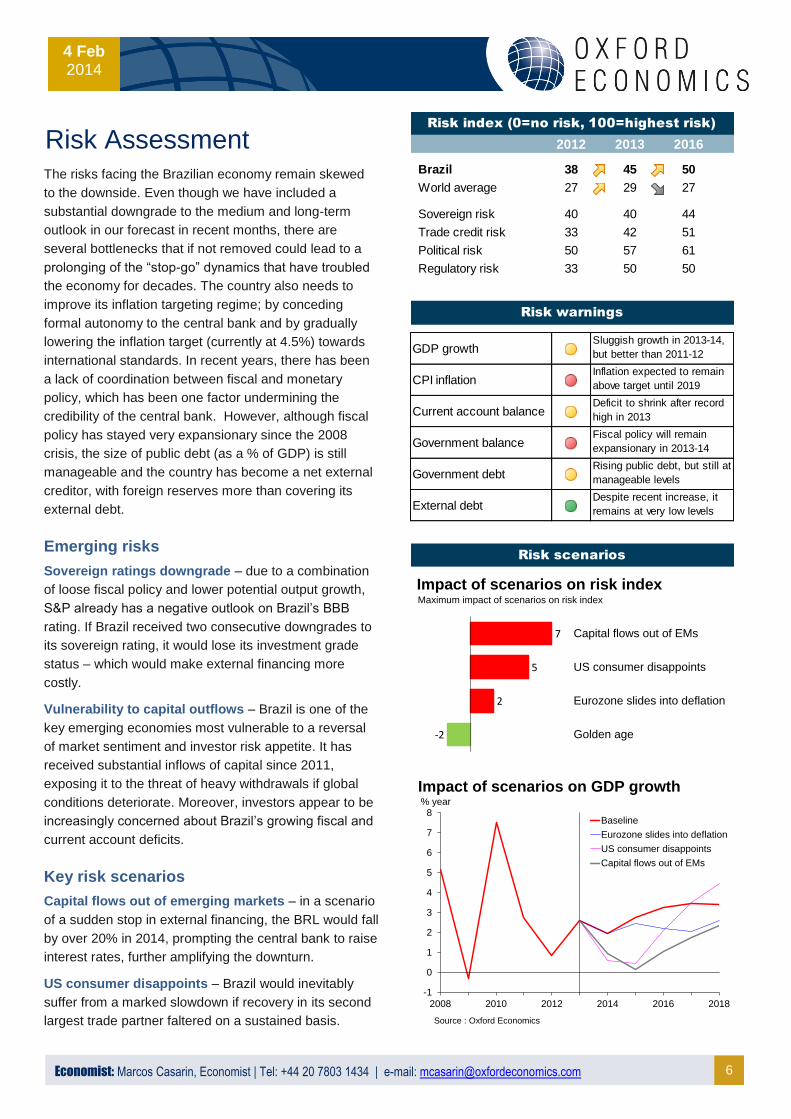
The ‘Brazil cost’ – as well as outdated labour laws,
businesses face high, and complex taxes, poor
infrastructure and excessive bureaucracy. These
longstanding difficulties have earned the name ‘custo
Brasil’ or ‘Brazil cost’ and are a key reason why
Brazilian business investment is the lowest of the
main emerging markets.
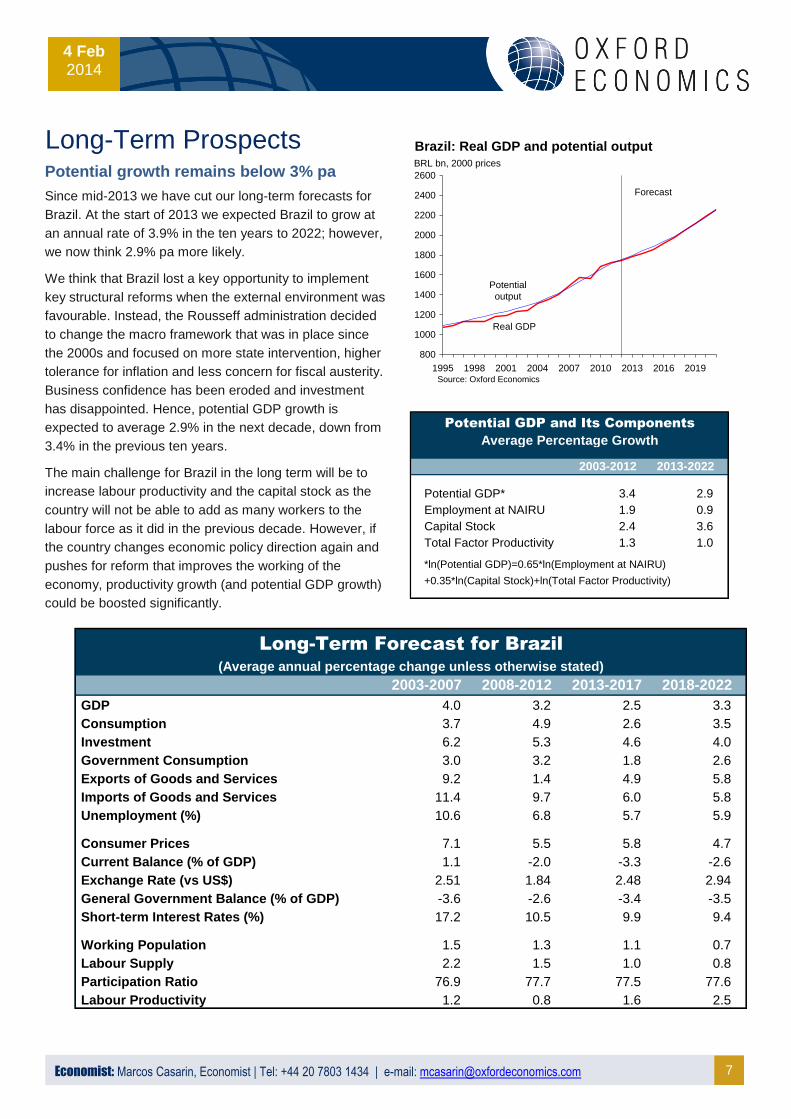
End of commodity super-cycle – in the ten years to
2012, Brazil’s terms of trade improved by a staggering
33% on the back of an unprecedented rise in
commodity prices. But this is unlikely to continue as
the Chinese economy, a key commodity importer,
rebalances away from investment-led growth. We
expect Brazil’s terms of trade to remain broadly stable
in the next decade, slowing investment growth,
especially in the commodities sector.
Few reforms in the pipeline – Brazil missed a
valuable opportunity to implement reforms when
conditions were more favourable. The government is
now more focused on protecting domestic industry
and short-term fixes to boost demand, especially in
view of this year’s presidential election. But without
reforms to improve labour market flexibility and
simplify the tax code, Brazil will remain trapped in a
dynamic of modest growth and relatively high inflation.
Bad macroeconomic policies – policymakers have
not only abandoned a reform agenda, but have also
embarked on a series of policies that have resulted in
a deterioration of public finances, higher and
persistent inflation and, ultimately, lower potential
GDP growth. As a result, businesses have become
increasingly downbeat about Brazil, which is likely to
result in a lower propensity to invest.
75
100
125
150
175
200
2003 2004 2005 2006 2007 2008 2009 2010 2011 2012
Source : Oxford Economics
India
Mexico
China
Brazil2003Q1=100
Source : Oxford Economics/Haver Analytics
Relative unit labour costs in US$
18
19
20
22
23
30
33
47
10 20 30 40 50
Brazil
South Africa
Turkey
Russia
Mexico
India
Indonesia
China
Source: Oxford Economics % of GDP
Emerging markets: Fixed investment (2012)
90
110
130
150
170
190
2003 2005 2007 2009 2011 2013
90
100
110
120
130
140
Brazil: Investment and terms of trade2003Q1 = 100
Source : IBGE, Funcex, Haver Analytics
Fixed investment
(LHS)
Terms of trade
(RHS)
2003Q1 = 100
6 Economist: Marcos Casarin, Economist | Tel: +44 20 7803 1434 | e-mail: [email protected]
4 Feb 2014
Risk Assessment
The risks facing the Brazilian economy remain skewed
to the downside. Even though we have included a
substantial downgrade to the medium and long-term
outlook in our forecast in recent months, there are
several bottlenecks that if not removed could lead to a
prolonging of the “stop-go” dynamics that have troubled
the economy for decades. The country also needs to
improve its inflation targeting regime; by conceding
formal autonomy to the central bank and by gradually
lowering the inflation target (currently at 4.5%) towards
international standards. In recent years, there has been
a lack of coordination between fiscal and monetary
policy, which has been one factor undermining the
credibility of the central bank. However, although fiscal
policy has stayed very expansionary since the 2008
crisis, the size of public debt (as a % of GDP) is still
manageable and the country has become a net external
creditor, with foreign reserves more than covering its
external debt.
Emerging risks
Sovereign ratings downgrade – due to a combination
of loose fiscal policy and lower potential output growth,
S&P already has a negative outlook on Brazil’s BBB
rating. If Brazil received two consecutive downgrades to
its sovereign rating, it would lose its investment grade
status – which would make external financing more
costly.
Vulnerability to capital outflows – Brazil is one of the
key emerging economies most vulnerable to a reversal
of market sentiment and investor risk appetite. It has
received substantial inflows of capital since 2011,
exposing it to the threat of heavy withdrawals if global
conditions deteriorate. Moreover, investors appear to be
increasingly concerned about Brazil’s growing fiscal and
current account deficits.
Key risk scenarios
Capital flows out of emerging markets – in a scenario
of a sudden stop in external financing, the BRL would fall
by over 20% in 2014, prompting the central bank to raise
interest rates, further amplifying the downturn.
US consumer disappoints – Brazil would inevitably
suffer from a marked slowdown if recovery in its second
largest trade partner faltered on a sustained basis.
2012 2013 2016
Brazil 38 45 50
World average 27 29 27
Sovereign risk 40 40 44
Trade credit risk 33 42 51
Political risk 50 57 61
Regulatory risk 33 50 50
Fiscal policy will remain
expansionary in 2013-14
Rising public debt, but still at
manageable levels
Despite recent increase, it
remains at very low levels
Risk scenarios
GDP growth
CPI inflation
Current account balance
Government balance
Government debt
External debt
Risk index (0=no risk, 100=highest risk)
Risk warnings
Sluggish growth in 2013-14,
but better than 2011-12
Inflation expected to remain
above target until 2019
Deficit to shrink after record
high in 2013
-2
2
5
7
Golden age
Eurozone slides into deflation
US consumer disappoints
Capital flows out of EMs
Impact of scenarios on risk indexMaximum impact of scenarios on risk index
-1
0
1
2
3
4
5
6
7
8
2008 2010 2012 2014 2016 2018
Baseline
Eurozone slides into deflation
US consumer disappoints
Capital flows out of EMs
% year
Source : Oxford Economics
Impact of scenarios on GDP growth
7 Economist: Marcos Casarin, Economist | Tel: +44 20 7803 1434 | e-mail: [email protected]
4 Feb 2014
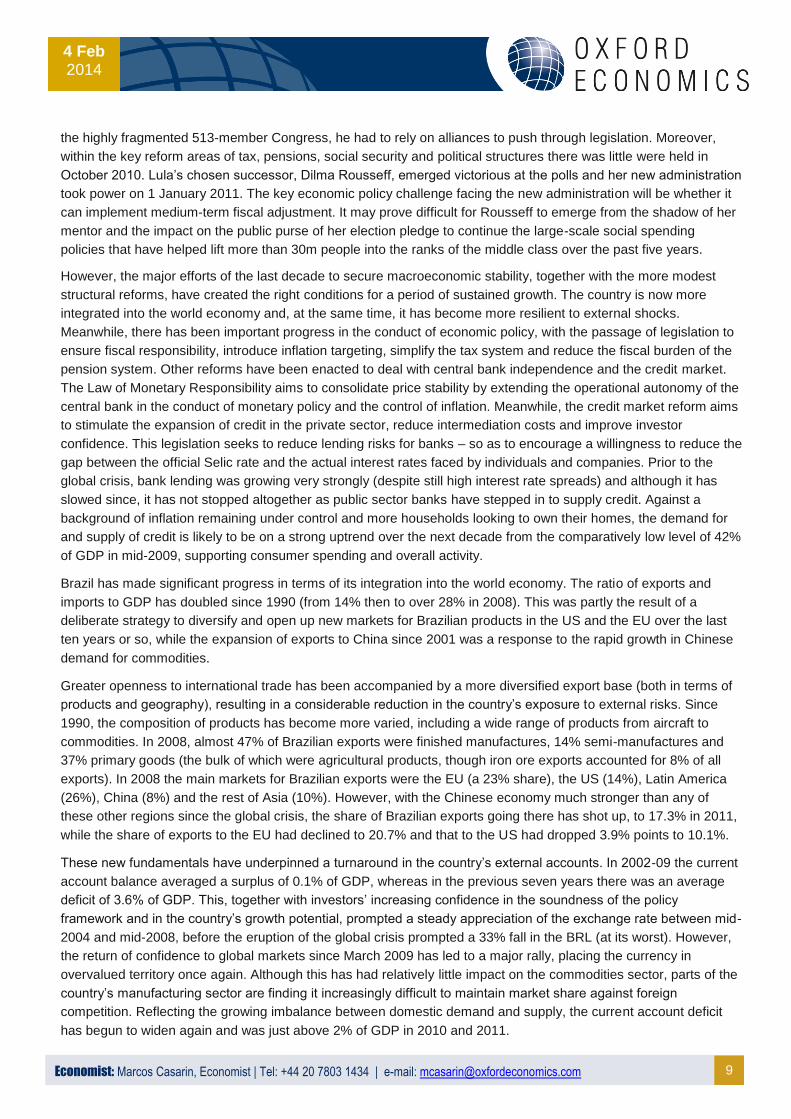
Long-Term Prospects
Potential growth remains below 3% pa
Since mid-2013 we have cut our long-term forecasts for
Brazil. At the start of 2013 we expected Brazil to grow at
an annual rate of 3.9% in the ten years to 2022; however,
we now think 2.9% pa more likely.
We think that Brazil lost a key opportunity to implement
key structural reforms when the external environment was
favourable. Instead, the Rousseff administration decided
to change the macro framework that was in place since
the 2000s and focused on more state intervention, higher
tolerance for inflation and less concern for fiscal austerity.
Business confidence has been eroded and investment
has disappointed. Hence, potential GDP growth is
expected to average 2.9% in the next decade, down from
3.4% in the previous ten years.
The main challenge for Brazil in the long term will be to
increase labour productivity and the capital stock as the
country will not be able to add as many workers to the
labour force as it did in the previous decade. However, if
the country changes economic policy direction again and
pushes for reform that improves the working of the
economy, productivity growth (and potential GDP growth)
could be boosted significantly.
800
1000
1200
1400
1600
1800
2000
2200
2400
2600
1995 1998 2001 2004 2007 2010 2013 2016 2019
BRL bn, 2000 prices
Real GDP
Potential
output
Source: Oxford Economics
Forecast
Brazil: Real GDP and potential output
2003-2012 2013-2022
Potential GDP* 3.4 2.9
Employment at NAIRU 1.9 0.9
Capital Stock 2.4 3.6
Total Factor Productivity 1.3 1.0
*ln(Potential GDP)=0.65*ln(Employment at NAIRU)
+0.35*ln(Capital Stock)+ln(Total Factor Productivity)
Potential GDP and Its Components
Average Percentage Growth
2003-2007 2008-2012 2013-2017 2018-2022
GDP 4.0 3.2 2.5 3.3
Consumption 3.7 4.9 2.6 3.5
Investment 6.2 5.3 4.6 4.0
Government Consumption 3.0 3.2 1.8 2.6
Exports of Goods and Services 9.2 1.4 4.9 5.8
Imports of Goods and Services 11.4 9.7 6.0 5.8
Unemployment (%) 10.6 6.8 5.7 5.9
Consumer Prices 7.1 5.5 5.8 4.7
Current Balance (% of GDP) 1.1 -2.0 -3.3 -2.6
Exchange Rate (vs US$) 2.51 1.84 2.48 2.94
General Government Balance (% of GDP) -3.6 -2.6 -3.4 -3.5
Short-term Interest Rates (%) 17.2 10.5 9.9 9.4
Working Population 1.5 1.3 1.1 0.7
Labour Supply 2.2 1.5 1.0 0.8
Participation Ratio 76.9 77.7 77.5 77.6
Labour Productivity 1.2 0.8 1.6 2.5
(Average annual percentage change unless otherwise stated)
Long-Term Forecast for Brazil

8 Economist: Marcos Casarin, Economist | Tel: +44 20 7803 1434 | e-mail: [email protected]
4 Feb 2014
Background
With a GDP of about US$2.5 trillion in 2011 according to IMF data, and over 195m people, Brazil is now the sixth
largest economy in the world and by far the largest in Latin America. In the last 15 years, the country has pursued a
strategy of export-led growth and regional integration. The economy is relatively well diversified with a strong
manufacturing and agricultural base, and mineral riches. But economic activity is still concentrated in the southeast,
particularly in the state of São Paulo, and income inequality remains high.
During the period 1950-80, the economy grew by an average yearly rate of 7.4%. This was achieved through an
inward-looking strategy of industrialisation (ISI) led by the state. However, eventually this model of development
generated high inflation, sustained external and fiscal deficits and growing public debt. Already in the 1970s the ISI
began to show signs of exhaustion, but trade liberalisation did not begin in earnest until 1990. The recent economic
history of the country is dominated by three crises linked to the balance of payments.
The 1982 debt crisis, and the shrinkage of capital inflows that followed, was a major shock for the Brazilian
economy. A period of macroeconomic instability and hyperinflation ensued, prompting a series of unsuccessful
stabilisation plans from 1986 to 1994 – the name of the currency was changed four times during the period. Only in
1994 did the Real Plan restore macroeconomic stability to the economy. This plan, devised by Fernando Henrique
Cardoso (later to become president during the period 1994-2002), used the nominal exchange rate as an anchor for
domestic prices, as in previous stabilisation attempts, but this time it was underpinned by the opening up of the
economy to global influences and a reform of public finances.
The 1997-98 Asian and Russian crises found Brazil with rising public debt and large current account deficits,
exposing its economy to swings in investor sentiment and speculative attacks against the BRL (a crawling peg was
then in place). At the start of 1999 there were doubts over fiscal sustainability following the rejection by Congress of
an IMF adjustment package. This, together with a debt moratorium declared by the state of Minas Gerais, prompted
speculative pressures that forced the central bank to float the BRL, causing an immediate depreciation of 30%
against the US$. However, the maxi-devaluation did not lead to high inflation and the introduction of inflation
targeting in June 1999 helped to support the transition to the new exchange rate regime.
Again in 2002, the increasing likelihood of a new government led by the left-wing candidate Luiz Ignacio “Lula” da
Silva threw the markets into turmoil (exacerbated by weak global financial sentiment). The electoral risk, a fragile
public debt structure and perverse debt dynamics, and the increased risk aversion of international capital markets
were major sources of instability for the economy at this time. Over 80% of domestic debt was linked to either the
Selic interest rate (the key monetary policy instrument) or to the US dollar, meaning that any major decline in the
currency would result in a higher burden of interest payments and a rise in the domestic value of the public debt.
Moreover the average maturity of the domestic debt was only three years, so vast sums needed to be rolled over
every year. As a result, Brazil was walking a tightrope.
But contrary to excessively pessimistic market expectations, one of the main achievements of President Da Silva’s
first-term administration was a strengthening of fiscal discipline, needed to honour debt payments and improve
investor confidence. The debt structure is now much less exposed to currency fluctuations and its maturity has been
lengthened (although about 30% is still linked to the Selic rate). This has improved the debt profile significantly. In
2004 and 2005 Brazil ran primary fiscal surpluses (excluding interest payments) of over 4.25% of GDP per year,
and the surpluses were only marginally lower between 3.8% and 4.1% during 2006-08. However, the government’s
control over the overall nominal deficit is limited by high interest payments, which account for over 5% of GDP (even
though they have fallen significantly over the last five years). Despite only implementing a relatively modest fiscal
boost in the wake of the global crisis, the primary surplus fell sharply to 2% of GDP in 2009.
President Lula comfortably won a second term in office in the 2006 elections and promised to boost economic
growth and to narrow the gap between rich and poor. But with his left-wing Workers’ Party (PT) having lost seats in
9 Economist: Marcos Casarin, Economist | Tel: +44 20 7803 1434 | e-mail: [email protected]
4 Feb 2014
the highly fragmented 513-member Congress, he had to rely on alliances to push through legislation. Moreover,
within the key reform areas of tax, pensions, social security and political structures there was little were held in
October 2010. Lula’s chosen successor, Dilma Rousseff, emerged victorious at the polls and her new administration
took power on 1 January 2011. The key economic policy challenge facing the new administration will be whether it
can implement medium-term fiscal adjustment. It may prove difficult for Rousseff to emerge from the shadow of her
mentor and the impact on the public purse of her election pledge to continue the large-scale social spending
policies that have helped lift more than 30m people into the ranks of the middle class over the past five years.
However, the major efforts of the last decade to secure macroeconomic stability, together with the more modest
structural reforms, have created the right conditions for a period of sustained growth. The country is now more
integrated into the world economy and, at the same time, it has become more resilient to external shocks.
Meanwhile, there has been important progress in the conduct of economic policy, with the passage of legislation to
ensure fiscal responsibility, introduce inflation targeting, simplify the tax system and reduce the fiscal burden of the
pension system. Other reforms have been enacted to deal with central bank independence and the credit market.
The Law of Monetary Responsibility aims to consolidate price stability by extending the operational autonomy of the
central bank in the conduct of monetary policy and the control of inflation. Meanwhile, the credit market reform aims
to stimulate the expansion of credit in the private sector, reduce intermediation costs and improve investor
confidence. This legislation seeks to reduce lending risks for banks – so as to encourage a willingness to reduce the
gap between the official Selic rate and the actual interest rates faced by individuals and companies. Prior to the
global crisis, bank lending was growing very strongly (despite still high interest rate spreads) and although it has
slowed since, it has not stopped altogether as public sector banks have stepped in to supply credit. Against a
background of inflation remaining under control and more households looking to own their homes, the demand for
and supply of credit is likely to be on a strong uptrend over the next decade from the comparatively low level of 42%
of GDP in mid-2009, supporting consumer spending and overall activity.
Brazil has made significant progress in terms of its integration into the world economy. The ratio of exports and
imports to GDP has doubled since 1990 (from 14% then to over 28% in 2008). This was partly the result of a
deliberate strategy to diversify and open up new markets for Brazilian products in the US and the EU over the last
ten years or so, while the expansion of exports to China since 2001 was a response to the rapid growth in Chinese
demand for commodities.
Greater openness to international trade has been accompanied by a more diversified export base (both in terms of
products and geography), resulting in a considerable reduction in the country’s exposure to external risks. Since
1990, the composition of products has become more varied, including a wide range of products from aircraft to
commodities. In 2008, almost 47% of Brazilian exports were finished manufactures, 14% semi-manufactures and
37% primary goods (the bulk of which were agricultural products, though iron ore exports accounted for 8% of all
exports). In 2008 the main markets for Brazilian exports were the EU (a 23% share), the US (14%), Latin America
(26%), China (8%) and the rest of Asia (10%). However, with the Chinese economy much stronger than any of
these other regions since the global crisis, the share of Brazilian exports going there has shot up, to 17.3% in 2011,
while the share of exports to the EU had declined to 20.7% and that to the US had dropped 3.9% points to 10.1%.
These new fundamentals have underpinned a turnaround in the country’s external accounts. In 2002-09 the current
account balance averaged a surplus of 0.1% of GDP, whereas in the previous seven years there was an average
deficit of 3.6% of GDP. This, together with investors’ increasing confidence in the soundness of the policy
framework and in the country’s growth potential, prompted a steady appreciation of the exchange rate between mid-
2004 and mid-2008, before the eruption of the global crisis prompted a 33% fall in the BRL (at its worst). However,
the return of confidence to global markets since March 2009 has led to a major rally, placing the currency in
overvalued territory once again. Although this has had relatively little impact on the commodities sector, parts of the
country’s manufacturing sector are finding it increasingly difficult to maintain market share against foreign
competition. Reflecting the growing imbalance between domestic demand and supply, the current account deficit
has begun to widen again and was just above 2% of GDP in 2010 and 2011.

10 Economist: Marcos Casarin, Economist | Tel: +44 20 7803 1434 | e-mail: [email protected]
4 Feb 2014
Data & Forecasts
Industrial Retail CPI Wholesale Unemploy- Public Export Trade
prod. (s.a.) sales (IPCA) prices ment Debt value in $ balance
% m-o-m % m-o-m % Real bn ($ mn)
Dec 0.0 6.7 5.8 0.7 4.6 1,550 -10.8 2,243
2013
Jan 3.0 4.2 6.2 0.0 5.4 1,563 -1.1 -4,040
Feb -2.6 3.6 6.3 0.1 5.6 1,594 -13.8 -1,279
Mar 0.9 3.3 6.6 0.1 5.7 1,596 -7.6 162
Apr 1.8 3.2 6.5 -0.4 5.8 1,603 5.4 -989
May -2.0 4.2 6.5 0.0 5.8 1,584 -6.0 763
Jun 1.9 3.0 6.7 0.9 6.0 1,580 9.2 2,308
Jul -2.0 4.6 6.3 0.2 5.6 1,574 -0.9 -1,898
Aug 0.2 5.3 6.1 0.6 5.3 1,573 -4.3 1,223
Sep 0.6 5.6 5.9 1.9 5.4 1,636 5.0 2,143
Oct 0.6 5.1 5.8 0.7 5.2 1,655 4.9 -225
Nov -0.2 5.8 5.8 0.1 4.6 1,614 1.9 1,739
Dec - - 5.9 0.8 4.3 1,626 5.6 2,654
Key Indicators: Brazil
Percentage changes on a year earlier unless otherwise stated
Selic rate Short-rate Money Exchange Exchange Primary Asset Reserves
(actual) 60 days supply M3 rate rate balance price (end-month)
% % Real/Euro
avg.
Real/$ avg. Real mn (Bovespa) $ mn
Dec 7.16 6.1 16.1 2.725 2.077 -22,252 59,583 373,147
2013
Jan 7.11 6.5 15.1 2.695 2.028 -30,251 61,534 373,417
Feb 7.13 6.6 14.2 2.636 1.973 3,031 57,878 373,742
Mar 7.15 6.6 13.3 2.572 1.984 -3,500 56,798 376,934
Apr 7.26 6.8 12.8 2.607 2.001 -10,328 54,759 378,665
May 7.42 7.2 13.0 2.644 2.036 -5,681 55,457 374,417
Jun 7.90 8.3 12.1 2.866 2.173 -5,429 49,605 369,402
Jul 8.23 8.2 11.0 2.945 2.252 -2,287 47,070 371,966
Aug 8.45 8.3 10.0 3.115 2.341 432 50,062 367,002
Sep 8.90 8.8 9.8 3.022 2.264 9,048 53,635 368,654
Oct 9.25 8.7 8.7 2.984 2.188 -6,188 54,172 364,505
Nov 9.45 - 7.7 3.098 2.296 -29,745 52,816 362,410
Dec 9.90 - 8.6 3.216 2.347 -10,407 50,820 358,808
Financial Indicators: Brazil
Percentage changes on a year earlier unless otherwise stated

11 Economist: Marcos Casarin, Economist | Tel: +44 20 7803 1434 | e-mail: [email protected]
4 Feb 2014
BRAZIL TABLE 1 SUMMARY ITEMS Annual Percentage Changes, Unless Otherwise Specified
CONSUMERS TOTAL TOTAL REAL INDUSTRIAL UNEMPLOY- AVERAGE WHOLE COMPETIT- PRODUCER CONSUMER
EXPENDITURE FINAL FIXED GDP PRODUCTION MENT RATE EARNINGS ECONOMY IVENESS PRICES PRICES
EXPENDITURE INVESTMENT (%) PRODUCT- (2008=100)
IVITY
(C) (TFE) (IF) (GDP) (IP) (UP) (ER) (GDP/ET) (WCR) (PPI) (CPI)
YEARS BEGINNING Q1
2011 4.10 3.82 4.71 2.73 0.39 5.98 9.39 0.66 126.46 9.43 6.64 2012 3.22 0.90 -3.99 1.03 -2.67 5.50 9.84 -1.10 120.22 5.89 5.40 2013 2.19 3.33 6.55 2.21 1.47 5.39 8.01 1.17 111.98 6.08 6.20 2014 2.06 1.97 2.61 1.69 2.56 5.46 8.41 0.96 105.41 6.19 5.98 2015 2.22 3.01 4.32 2.49 3.69 5.71 8.65 1.65 108.28 5.22 5.96 2016 2.99 3.58 4.74 2.98 3.43 5.81 7.94 2.07 108.18 4.84 5.61 2017 3.51 3.81 4.76 3.34 3.60 5.91 7.38 2.39 105.44 4.84 5.26
2011
I 6.01 5.54 8.84 4.24 2.19 6.33 10.75 1.85 127.99 13.75 6.10 II 5.62 5.01 6.19 3.31 1.02 6.33 9.87 0.92 125.96 11.02 6.59 III 2.80 2.73 2.48 2.12 0.26 6.00 9.64 0.15 128.91 8.22 7.14
IV 2.15 2.19 1.99 1.37 -1.90 5.23 7.45 -0.20 122.98 5.21 6.70 2012
I 2.79 1.64 -2.14 0.80 -3.60 5.80 10.03 -1.03 132.36 2.25 5.77 II 2.23 0.71 -3.79 0.55 -4.50 5.90 10.62 -1.50 118.25 4.26 5.00 III 3.58 -0.31 -5.63 0.94 -1.97 5.37 8.19 -0.76 115.39 8.71 5.24
IV 4.24 1.59 -4.21 1.83 -0.54 4.93 10.57 -1.10 114.90 8.27 5.61 2013
I 2.26 2.67 3.22 1.75 1.43 5.57 8.33 -0.12 121.29 9.06 6.35 II 2.56 4.01 9.07 3.28 3.14 5.87 7.96 2.74 112.85 6.38 6.57 III 2.31 3.98 7.26 2.16 0.41 5.43 7.48 1.21 104.70 3.50 6.07
IV 1.64 2.64 6.57 1.66 0.93 4.70 8.26 0.85 109.08 5.60 5.84 2014
I 2.19 2.16 2.99 2.08 0.89 5.49 8.32 1.30 107.03 6.27 5.79 II 2.36 1.19 0.30 0.80 1.31 5.79 8.38 0.08 103.50 6.36 5.90 III 1.80 2.25 3.55 1.86 3.69 5.39 8.43 1.21 102.61 6.33 6.11
IV 1.90 2.29 3.61 2.05 4.35 5.19 8.49 1.28 108.51 5.81 6.11 2015
I 2.01 2.61 3.99 2.27 4.23 5.79 8.61 1.45 110.64 5.52 6.09 II 2.10 2.91 4.26 2.43 3.85 6.09 8.71 1.60 106.31 5.27 6.00 III 2.28 3.15 4.44 2.56 3.41 5.59 8.73 1.71 105.90 5.11 5.92
IV 2.49 3.33 4.57 2.69 3.28 5.39 8.57 1.82 110.28 4.97 5.83 2016
I 2.69 3.44 4.67 2.81 3.25 5.89 8.36 1.93 112.20 4.84 5.74 II 2.89 3.54 4.73 2.93 3.32 6.19 8.02 2.03 106.66 4.84 5.66 III 3.09 3.63 4.77 3.03 3.50 5.69 7.78 2.12 105.23 4.84 5.57
IV 3.28 3.69 4.78 3.13 3.65 5.49 7.63 2.20 108.64 4.84 5.48 2017
I 3.43 3.72 4.79 3.22 3.71 5.99 7.47 2.27 109.56 4.84 5.40 II 3.52 3.78 4.78 3.30 3.67 6.29 7.38 2.35 103.93 4.84 5.30 III 3.56 3.84 4.76 3.39 3.56 5.79 7.35 2.44 102.48 4.84 5.21
IV 3.55 3.88 4.73 3.45 3.46 5.59 7.32 2.50 105.80 4.84 5.12
COPYRIGHT (C) , OXFORD ECONOMICS
BRAZIL TABLE 2 SUMMARY ITEMS
TRADE CURRENT CURRENT GOVERNMENT GOVERNMENT SHORT-TERM SPREAD REAL EQUILIBRIUM EXCHANGE
BALANCE ACCOUNT ACCOUNT FINANCIAL FINANCIAL INTEREST OVER US SHORT-TERM EXCHANGE RATE PER
($ BN) ($ BN) (% OF GDP) BALANCE BALANCE RATE SHORT-TERM INTEREST RATE PER US
(REAL TRN) (% OF GDP) RATE RATE US DOLLAR DOLLAR
(BVI$/ (BCU$/ (BCUR%) (GB/1000) (GB*100 (RSH) (RSH - (Note 1) (RXEQUIL) (RXD)
1000) 1000) /GDP!) RSH US)
YEARS BEGINNING Q1
2011 29.8 -52.5 -2.1 -108.0 -2.6 11.7 11.3 5.0 2.07 1.68 2012 19.4 -54.2 -2.4 -108.9 -2.5 8.5 8.1 3.1 2.15 1.96 2013 2.6 -81.4 -3.6 -151.5 -3.2 8.2 7.9 2.0 2.29 2.16 2014 13.7 -74.5 -3.6 -187.4 -3.6 10.6 10.3 4.6 2.52 2.46 2015 16.4 -73.5 -3.3 -180.5 -3.2 11.2 10.8 5.3 2.76 2.50 2016 17.2 -75.5 -3.2 -201.1 -3.3 10.2 9.1 4.5 2.95 2.58 2017 19.1 -77.1 -3.1 -243.2 -3.6 9.4 7.5 4.1 3.10 2.69
2011
I 3.1 -14.8 -2.6 -19.7 -2.0 11.2 10.9 5.1 2.07 1.67 II 9.8 -11.3 -1.7 -21.9 -2.1 11.9 11.7 5.3 2.07 1.60 III 10.1 -10.6 -1.7 -31.3 -3.0 12.2 11.9 5.1 2.07 1.64
IV 6.7 -15.8 -2.6 -35.1 -3.2 11.3 10.8 4.6 2.08 1.80 2012
I 2.4 -12.1 -2.1 -13.0 -1.3 10.3 9.8 4.5 2.10 1.77 II 4.6 -13.2 -2.3 -32.4 -2.9 8.9 8.4 3.9 2.13 1.96 III 8.6 -8.9 -1.6 -40.2 -3.7 7.8 7.4 2.5 2.16 2.03
IV 3.7 -20.1 -3.5 -23.3 -2.0 7.2 6.9 1.6 2.19 2.06 2013
I -5.2 -24.8 -4.4 -31.5 -2.8 7.1 6.8 0.8 2.22 2.00 II 2.1 -18.5 -3.2 -34.4 -2.8 7.5 7.2 1.0 2.26 2.07 III 1.5 -17.1 -3.2 -66.3 -5.5 8.5 8.3 2.4 2.31 2.29
IV 4.2 -21.0 -3.8 -19.2 -1.5 9.5 9.3 3.7 2.36 2.28 2014
I -3.6 -25.2 -5.1 -45.0 -3.7 10.3 10.0 4.5 2.42 2.42 II 5.3 -16.2 -3.0 -38.3 -2.9 10.7 10.4 4.7 2.49 2.44 III 4.9 -14.0 -2.7 -55.6 -4.2 10.7 10.3 4.5 2.55 2.49
IV 7.2 -19.2 -3.5 -48.5 -3.6 10.7 10.3 4.5 2.62 2.47 2015
I -2.7 -24.6 -4.7 -49.8 -3.8 10.9 10.6 4.8 2.68 2.48 II 6.5 -15.3 -2.7 -36.9 -2.6 11.3 10.9 5.3 2.74 2.50 III 5.2 -14.1 -2.5 -52.1 -3.7 11.4 10.9 5.5 2.79 2.51
IV 7.4 -19.5 -3.3 -41.6 -2.8 11.4 10.6 5.6 2.85 2.52 2016
I -3.1 -25.4 -4.5 -49.1 -3.4 11.2 10.3 5.4 2.89 2.53 II 6.8 -15.6 -2.6 -40.0 -2.6 10.4 9.4 4.7 2.94 2.56 III 5.5 -14.6 -2.4 -61.0 -3.9 9.7 8.5 4.1 2.97 2.59
IV 8.0 -19.8 -3.2 -51.1 -3.2 9.4 8.1 3.9 3.01 2.62 2017
I -3.3 -26.5 -4.5 -59.6 -3.8 9.4 8.0 4.0 3.05 2.65 II 7.4 -15.7 -2.5 -50.1 -3.0 9.4 7.8 4.1 3.09 2.68 III 6.2 -14.9 -2.4 -72.7 -4.3 9.4 7.5 4.2 3.12 2.71
IV 8.8 -19.9 -3.1 -60.7 -3.5 9.4 7.0 4.3 3.16 2.73 Note 1 : REAL INTEREST RATE = Nominal interest rate (RSH) - % change in CPI
COPYRIGHT (C) , OXFORD ECONOMICS
12
4 Feb 2014
Economist: Marcos Casarin, Economist | Tel: +44 20 7803 1434 | e-mail: [email protected]
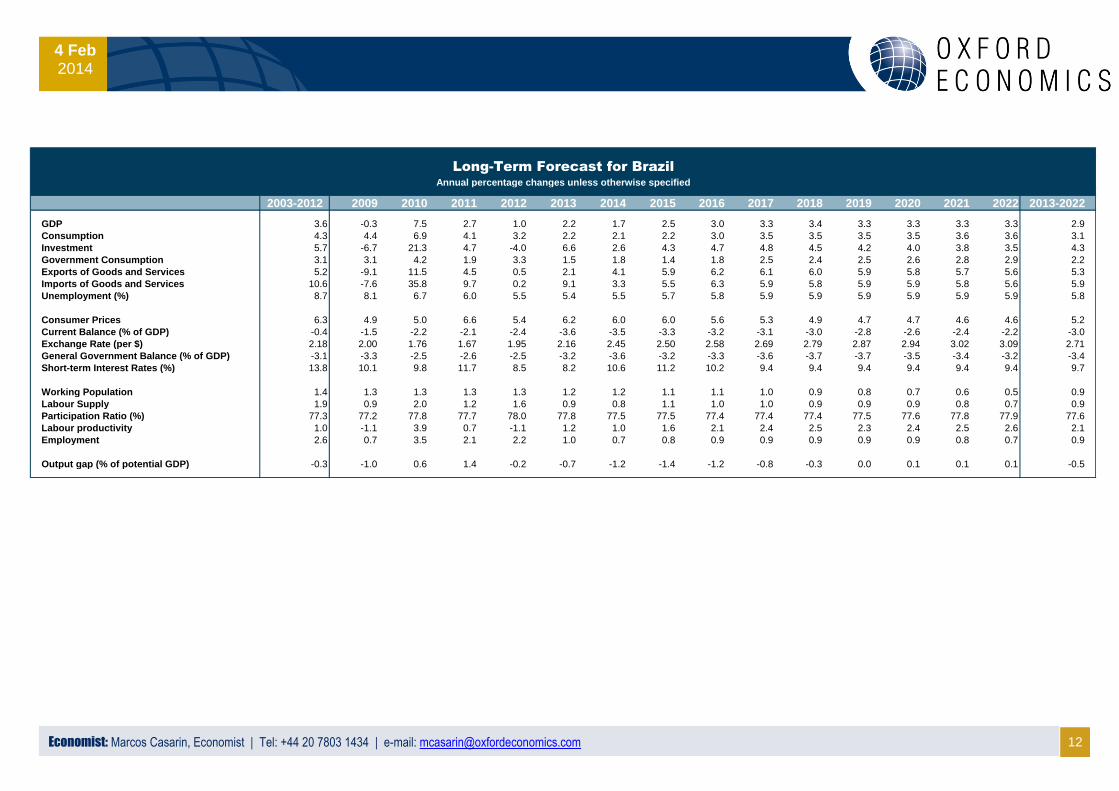
2003-2012 2009 2010 2011 2012 2013 2014 2015 2016 2017 2018 2019 2020 2021 2022 2013-2022
GDP 3.6 -0.3 7.5 2.7 1.0 2.2 1.7 2.5 3.0 3.3 3.4 3.3 3.3 3.3 3.3 2.9
Consumption 4.3 4.4 6.9 4.1 3.2 2.2 2.1 2.2 3.0 3.5 3.5 3.5 3.5 3.6 3.6 3.1
Investment 5.7 -6.7 21.3 4.7 -4.0 6.6 2.6 4.3 4.7 4.8 4.5 4.2 4.0 3.8 3.5 4.3
Government Consumption 3.1 3.1 4.2 1.9 3.3 1.5 1.8 1.4 1.8 2.5 2.4 2.5 2.6 2.8 2.9 2.2
Exports of Goods and Services 5.2 -9.1 11.5 4.5 0.5 2.1 4.1 5.9 6.2 6.1 6.0 5.9 5.8 5.7 5.6 5.3
Imports of Goods and Services 10.6 -7.6 35.8 9.7 0.2 9.1 3.3 5.5 6.3 5.9 5.8 5.9 5.9 5.8 5.6 5.9
Unemployment (%) 8.7 8.1 6.7 6.0 5.5 5.4 5.5 5.7 5.8 5.9 5.9 5.9 5.9 5.9 5.9 5.8
Consumer Prices 6.3 4.9 5.0 6.6 5.4 6.2 6.0 6.0 5.6 5.3 4.9 4.7 4.7 4.6 4.6 5.2
Current Balance (% of GDP) -0.4 -1.5 -2.2 -2.1 -2.4 -3.6 -3.5 -3.3 -3.2 -3.1 -3.0 -2.8 -2.6 -2.4 -2.2 -3.0
Exchange Rate (per $) 2.18 2.00 1.76 1.67 1.95 2.16 2.45 2.50 2.58 2.69 2.79 2.87 2.94 3.02 3.09 2.71
General Government Balance (% of GDP) -3.1 -3.3 -2.5 -2.6 -2.5 -3.2 -3.6 -3.2 -3.3 -3.6 -3.7 -3.7 -3.5 -3.4 -3.2 -3.4
Short-term Interest Rates (%) 13.8 10.1 9.8 11.7 8.5 8.2 10.6 11.2 10.2 9.4 9.4 9.4 9.4 9.4 9.4 9.7
Working Population 1.4 1.3 1.3 1.3 1.3 1.2 1.2 1.1 1.1 1.0 0.9 0.8 0.7 0.6 0.5 0.9
Labour Supply 1.9 0.9 2.0 1.2 1.6 0.9 0.8 1.1 1.0 1.0 0.9 0.9 0.9 0.8 0.7 0.9
Participation Ratio (%) 77.3 77.2 77.8 77.7 78.0 77.8 77.5 77.5 77.4 77.4 77.4 77.5 77.6 77.8 77.9 77.6
Labour productivity 1.0 -1.1 3.9 0.7 -1.1 1.2 1.0 1.6 2.1 2.4 2.5 2.3 2.4 2.5 2.6 2.1
Employment 2.6 0.7 3.5 2.1 2.2 1.0 0.7 0.8 0.9 0.9 0.9 0.9 0.9 0.8 0.7 0.9
Output gap (% of potential GDP) -0.3 -1.0 0.6 1.4 -0.2 -0.7 -1.2 -1.4 -1.2 -0.8 -0.3 0.0 0.1 0.1 0.1 -0.5
Annual percentage changes unless otherwise specified
Long-Term Forecast for Brazil
13 13
4 Feb 2014
Economist: Marcos Casarin, Economist | Tel: +44 20 7803 1434 | e-mail: [email protected]
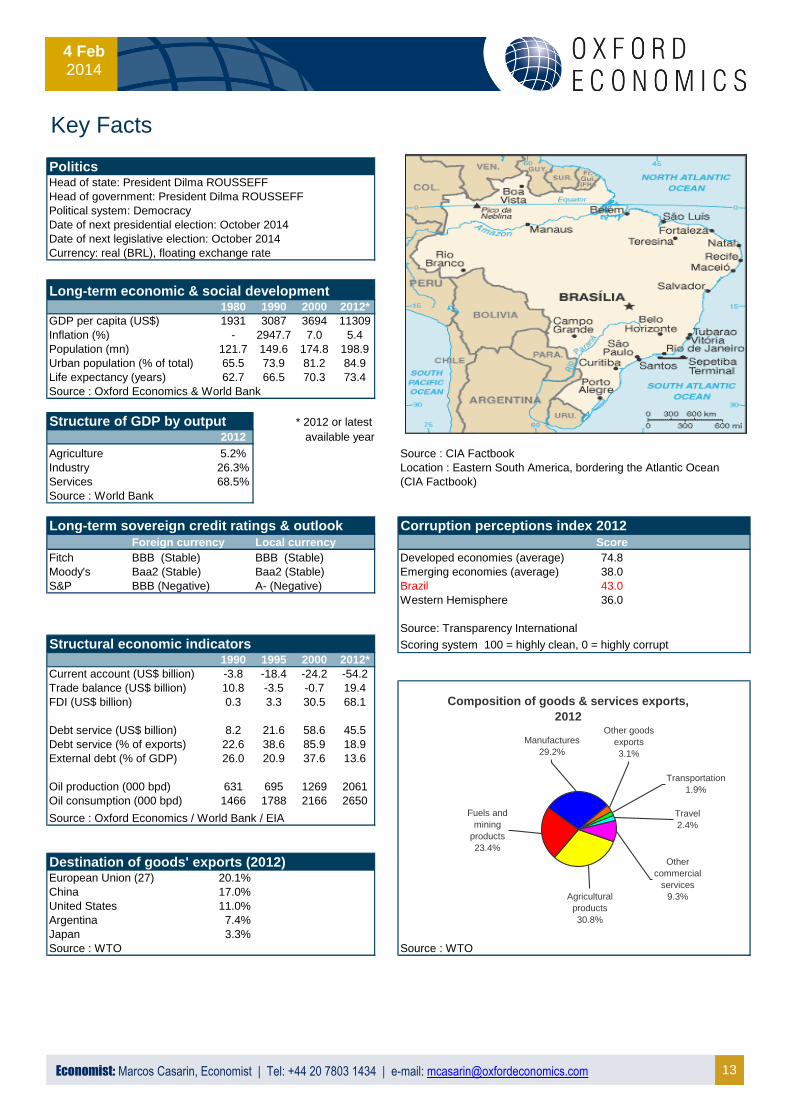
Key Facts
PoliticsHead of state: President Dilma ROUSSEFF
Head of government: President Dilma ROUSSEFF
Political system: Democracy
Date of next presidential election: October 2014
Date of next legislative election: October 2014
Currency: real (BRL), floating exchange rate
Long-term economic & social development1980 1990 2000 2012*
GDP per capita (US$) 1931 3087 3694 11309
Inflation (%) - 2947.7 7.0 5.4
Population (mn) 121.7 149.6 174.8 198.9
Urban population (% of total) 65.5 73.9 81.2 84.9
Life expectancy (years) 62.7 66.5 70.3 73.4
Source : Oxford Economics & World Bank
Structure of GDP by output * 2012 or latest
2012 available year
Agriculture 5.2% Source : CIA Factbook
Industry 26.3% Location : Eastern South America, bordering the Atlantic Ocean
Services 68.5% (CIA Factbook)
Source : World Bank
Long-term sovereign credit ratings & outlook Corruption perceptions index 2012Foreign currency Local currency Score
Fitch BBB (Stable) BBB (Stable) Developed economies (average) 74.8
Moody's Baa2 (Stable) Baa2 (Stable) Emerging economies (average) 38.0
S&P BBB (Negative) A- (Negative) Brazil 43.0
Western Hemisphere 36.0
Source: Transparency International
Structural economic indicators Scoring system 100 = highly clean, 0 = highly corrupt
1990 1995 2000 2012*
Current account (US$ billion) -3.8 -18.4 -24.2 -54.2
Trade balance (US$ billion) 10.8 -3.5 -0.7 19.4
FDI (US$ billion) 0.3 3.3 30.5 68.1
Debt service (US$ billion) 8.2 21.6 58.6 45.5
Debt service (% of exports) 22.6 38.6 85.9 18.9
External debt (% of GDP) 26.0 20.9 37.6 13.6
Oil production (000 bpd) 631 695 1269 2061
Oil consumption (000 bpd) 1466 1788 2166 2650
Source : Oxford Economics / World Bank / EIA
Destination of goods' exports (2012)European Union (27) 20.1%
China 17.0%
United States 11.0%
Argentina 7.4%
Japan 3.3%
Source : WTO Source : WTO
Composition of goods & services exports,
2012
Agricultural
products
30.8%
Fuels and
mining
products
23.4%
Manufactures
29.2%
Other goods
exports
3.1%
Transportation
1.9%
Travel
2.4%
Other
commercial
services
9.3%