Stock Market Reports for the Week (27th - 31st December - 2010)
4
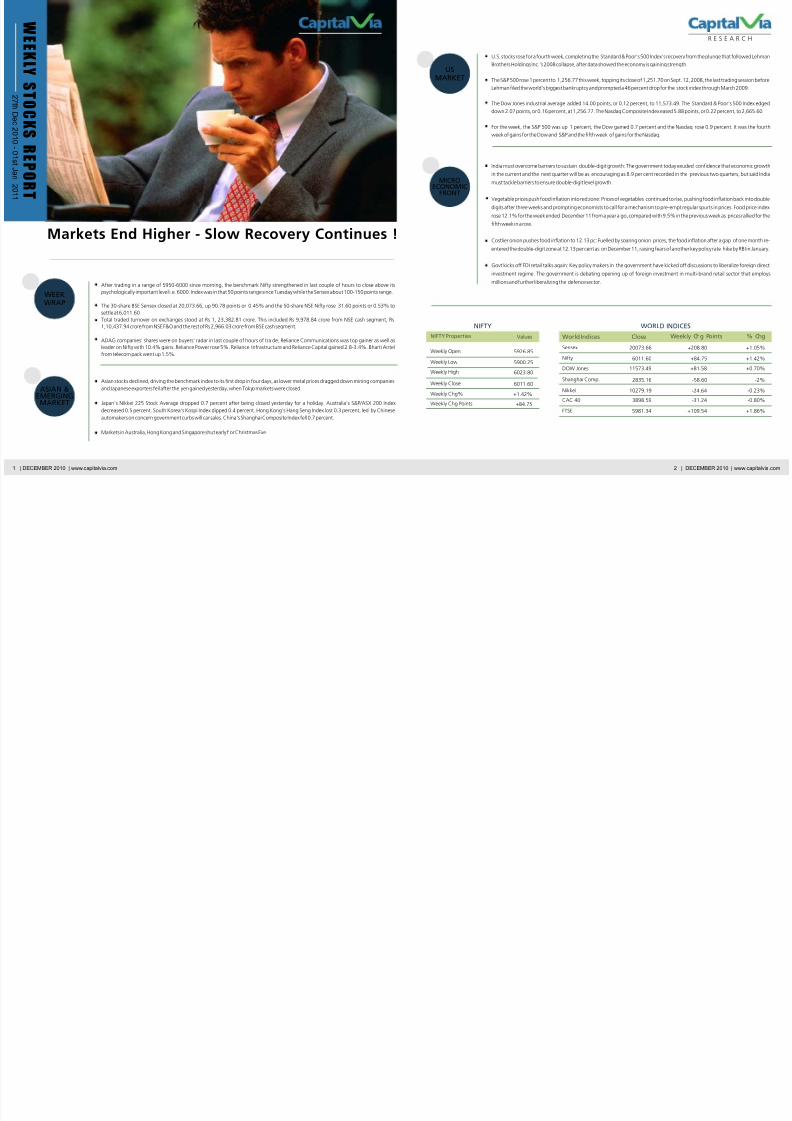
RESEARCH Markets End Higher - Slow Recovery Continues ! 18th Oct 2010 to 23rd Oct 2010 Asian stocks declined, driving the benchmark index to its first drop in four days, as lower metal prices dragged down mining companies and Japanese exporters fell after the yen gained yesterday, when Toky o markets were closed. Japan's Nikkei 225 Stock Average dropped 0.7 percent after being closed yesterday for a holiday. Australia's S&P/ASX 200 Index decreased 0.5 percent. South Korea's Kospi Index dipped 0.4 percent. Hong Kong's Hang Seng Index lost 0.3 percent, led by Chinese automakers on concern government curbs will car sales. China's Shanghai Composite Index fell 0.7 percent. Markets in Australia, Hong Kong and Singapore shut early f or Christmas Eve. U.S. stocks rose for a fourth week, completing the Standard & Poor's 500 Index's recovery from the plunge that followed Lehman Brothers Holdings Inc.'s 2008 collapse, after data showed the economy is gaining strength. The S&P 500 rose 1 percent to 1,256.77 this week, topping its close of 1,251.70 on Sept. 12, 2008, the last trading session before Lehman filed the world's biggest bankruptcy and prompted a 46 percent drop for the stock index through March 2009. The Dow Jones industrial average added 14.00 points, or 0.12 percent, to 11,573.49. The Standard & Poor's 500 Index edged down 2.07 points, or 0.16 percent, at 1,256.77. The Nasdaq Composite Index eased 5.88 points, or 0.22 percent, to 2,665.60. For the week, the S&P 500 was up 1 percent, the Dow gained 0.7 percent and the Nasdaq rose 0.9 percent. It was the fourth week of gains for the Dow and S&P and the fifth week of gains for the Nasdaq. India must overcome barriers to sustain double-digit growth: The government today exuded confidence that economic growth in the current and the next quarter will be as encouraging as 8.9 per cent recorded in the previous two quarters, but said India must tackle barriers to ensure double-digit level growth. Vegetable prices push food inflation into red zone: Prices of vegetables continued to rise, pushing food inflation back into double digits after three weeks and prompting economists to call for a mechanism to pre-empt regular spurts in prices. Food price index rose 12.1% for the week ended December 11 from a year a go, compared with 9.5% in the previous week as prices rallied for the fifth week in a row. Costlier onion pushes food inflation to 12.13 pc: Fuelled by soaring onion prices, the food inflation after a gap of one month re- entered the double-digit zone at 12.13 per cent as on December 11, raising fears of another key policy rate hike by RBI in January. Govt kicks off FDI retail talks again: Key policy makers in the government have kicked off discussions to liberalize foreign direct investment regime. The government is debating opening up of foreign investment in multi-brand retail sector that employs millions and further liberalizing the defence sector. After trading in a range of 5950-6000 since morning, the benchmark Nifty strengthened in last couple of hours to close above its psychologically important level i.e. 6000. Index was in that 50 points range since Tuesday while the Sensex about 100-150 points range. The 30-share BSE Sensex closed at 20,073.66, up 90.78 points or 0.45% and the 50-share NSE Nifty rose 31.60 points or 0.53% to settle at 6,011.60. Total traded turnover on exchanges stood at Rs 1, 23,382.81 crore. This included Rs 9,978.84 crore from NSE cash segment, Rs 1,10,437.94 crore from NSE F&O and the rest of Rs 2,966.03 crore from BSE cash segment. ADAG companies' shares were on buyers' radar in last couple of hours of tra de; Reliance Communications was top gainer as well as leader on Nifty with 10.4% gains. Reliance Power rose 5%. Reliance Infrastructure and Reliance Capital gained 2.8-3.4%. Bharti Airtel from telecom pack went up 1.5%. WEEK WRAP ASIAN & EMERGING MARKET 1 | DECEMBER 2010 | www.capitalvia.com 2 | DECEMBER 2010 | www.capitalvia.com NIFTY WORLD INDICES Shanghai Comp. DOW Jones 20073.66 6011.60 2835.16 11573.49 5981.34 10279.19 3898.59 Sensex Nifty FTSE Nikkei CAC 40 +208.80 +84.75 -58.60 +81.58 +109.54 -24.64 -31.24 +1.05% +1.42% -2% +0.70% +1.86% -0.23% -0.80% Weekly Open Weekly Low Weekly High Weekly Close Weekly Chg% Weekly Chg Points NIFTY Properties 5926.85 5900.25 6023.80 6011.60 +1.42% +84.75 Values Close World Indices Weekly C hg P oints % C hg US MARKET MICRO ECONOMIC FRONT GLOBAL RESEARCH LIMITED W E E K L Y S T O C K S R E P O R T 2 7 t h D e c 2 0 1 0 - 0 1 s t J a n 2 0 1 1
Transcript of Stock Market Reports for the Week (27th - 31st December - 2010)
8/8/2019 Stock Market Reports for the Week (27th - 31st December - 2010)
http://slidepdf.com/reader/full/stock-market-reports-for-the-week-27th-31st-december-2010 1/4
Markets End Higher - Slow Recovery Continues !
18th Oct 2010 to 23rd Oct 2010
Asian stocks declined, driving the benchmark index to its first drop in four days, as lower metal prices dragged down mining companies
and Japanese exporters fell after the yen gained yesterday, when Tokyo markets were closed.
Japan's Nikkei 225 Stock Average dropped 0.7 percent after being closed yesterday for a holiday. Australia's S&P/ASX 200 Index
decreased 0.5 percent. South Korea's Kospi Index dipped 0.4 percent. Hong Kong's Hang Seng Index lost 0.3 percent, led by Chinese
automakers on concern government curbs will car sales. China's Shanghai Composite Index fell 0.7 percent.
Markets in Australia, Hong Kong and Singapore shut early f or Christmas Eve.
U.S. stocks rose for a fourth week, completing the Standard & Poor's 500 Index's recov
Brothers Holdings Inc.'s 2008 collapse, after data showed the economy is gaining stre
The S&P 500 rose 1 percent to 1,256.77 this week, topping its close of 1,251.70 on Se
Lehman filed the world's biggest bankruptcy and prompted a 46 percent drop for the
The Dow Jones industrial average added 14.00 points, or 0.12 percent, to 11,573.4
down 2.07 points, or 0.16 percent, at 1,256.77. The Nasdaq Composite Index eased 5
For the week, the S&P 500 was up 1 percent, the Dow gained 0.7 percent and the N
week of gains for the Dow and S&P and the fifth week of gains for the Nasdaq.
India must overcome barriers to sustain double-digit growth: The government today
in the current and the next quarter will be as encouraging as 8.9 per cent recorded i
must tackle barriers to ensure double-digit level growth.
Vegetable prices push food inflation into red zone: Prices of vegetables continued to r
digits after three weeks and prompting economists to call for a mechanism to pre-em
rose 12.1% for the week ended December 11 from a year a go, compared with 9.5%
fifth week in a row.
Costlier onion pushes food inflation to 12.13 pc: Fuelled by soaring onion prices, the
entered the double-digit zone at 12.13 per cent as on December 11, raising fears of an
Govt kicks off FDI retail talks again: Key policy makers in the government have kicke
investment regime. The government is debating opening up of foreign investmenmillions and further liberalizing the defence sector.
After trading in a range of 5950-6000 since morning, the benchmark Nifty strengthened in last couple of hours to close above its
psychologically important level i.e. 6000. Index was in that 50 points range since Tuesday while the Sensex about 100-150 points range.
The 30-share BSE Sensex closed at 20,073.66, up 90.78 points or 0.45% and the 50-share NSE Nifty rose 31.60 points or 0.53% to
settle at 6,011.60.
Total traded turnover on exchanges stood at Rs 1, 23,382.81 crore. This included Rs 9,978.84 crore from NSE cash segment, Rs
1,10,437.94 crore from NSE F&O and the rest of Rs 2,966.03 crore from BSE cash segment.
ADAG companies' shares were on buyers' radar in last couple of hours of tra de; Reliance Communications was top gainer as well as
leader on Nifty with 10.4% gains. Reliance Power rose 5%. Reliance Infrastructure and Reliance Capital gained 2.8-3.4%. Bharti Airtel
from telecom pack went up 1.5%.
WEEKWRAP
ASIAN &EMERGINGMARKET
1 | DECEMBER 2010 | www.capitalvia.com 2
NIFTY WORLD IND
Shanghai Comp.
DOW Jones
20073.66
6011.60
2835.16
11573.49
5981.34
10279.19
3898.59
Sensex
Nifty
FTSE
Nikkei
CAC 40
Weekly Open
Weekly Low
Weekly High
Weekly Close
Weekly Chg%
Weekly Chg Points
NIFTY Properties
5926.85
5900.25
6023.80
6011.60
+1.42%
+84.75
Values CloseWorld Indices We
USMARKET
MICROECONOMIC
FRONT
GLOBAL RESEARCH LIMITED
WE E K L Y S T O C K
S R E P O R T
2 7 t h D e c 2 0
1 0 - 0 1 s t J an
2 0 1 1
8/8/2019 Stock Market Reports for the Week (27th - 31st December - 2010)
http://slidepdf.com/reader/full/stock-market-reports-for-the-week-27th-31st-december-2010 2/4
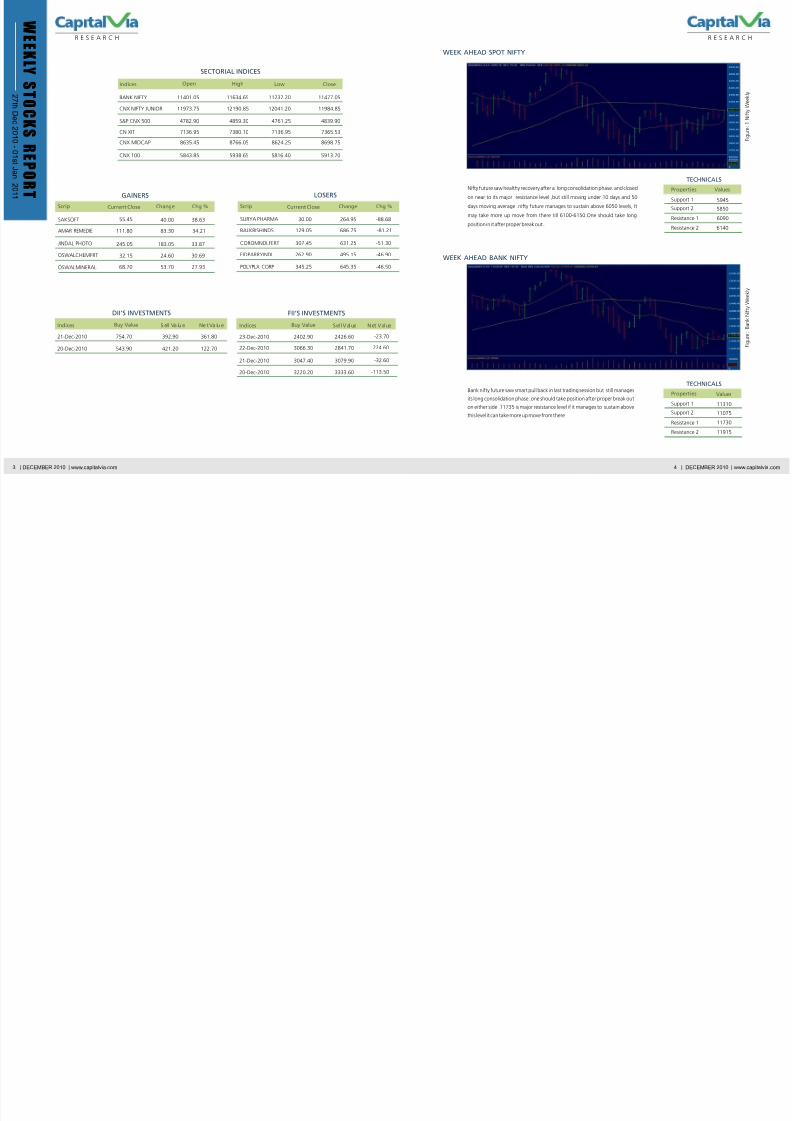
Nifty future saw healthy recovery after a long consolidation phase. and closed
on near to its major resistance level ,but still moving under 10 days and 50
days moving average .nifty future manages to sustain above 6050 levels, It
may take more up move from there till 6100-6150.One should take long
position in it after proper break out .
Bank nifty future saw smart pull back in last trading session but still manages
its long consolidation phase .one should take position after proper break out
on either side .11735 is major resistance level if it manages to sustain above
this level it can take more up move from there .
WEEK AHEAD BANK NIFTY
23-Dec-2010 2402.90 2426.60
22-Dec-2010 3066.30 2841.70
21-Dec-2010 3047.40 3079.90
20-Dec-2010 3220.20 3333.60
FII’S INVESTMENTS
-23.70
224.60
-32.60
-113.50
21-Dec-2010 754.70 392.90 361.80
DII’S INVESTMENTS
Indices Buy Value S ell Va lu e Ne t Va lu e Indices Buy Value Sel l Value Net Value
BANK NIFTY
CNX NIFTY JUNIOR
S&P CNX 500
CN XIT
CNX MIDCAP
CNX 100
11973.75
11401.05
4782.90
7136.95
8635.45
5843.85
12190.85
11634.65
4859.30
7380.10
8766.05
5938.65
12041.20
11237.20
4761.25
7136.95
8624.25
5816.40
11984.85
11477.05
4839.90
7365.53
8698.75
5913.70
Indices Open High Low Close
SECTORIAL INDICES
WEEK AHEAD SPOT NIFTY
R E S E A R C H
SURYA PHARMA
BALKRISHINDS
COROMNDLFERT
EIDPARRYINDI
POLYPLX CORP
129.05
30.00
307.45
262.90
345.25
686.75
264.95
631.25
495.15
645.35
-81.21
-88.68
-51.30
-46.90
-46.50
Scrip Current Close Change Chg %
LOSERS
SAKSOFT
JINDAL PHOTO
55.45
245.05
OSWALMINERAL 68.70
AMAR REMEDIE 111.80
OSWALCHEMFRT 32.15
40.00
183.05
53.70
83.30
24.60
38.63
33.87
27.93
34.21
30.69
GAINERS
Scrip Current Close Change Chg %
Su
Su
Re
Re
Pro
Su
Su
Re
Re
Pro
WE E K L Y S T O C K
S R E P O R T
20-Dec-2010 543.90 421.20 122.70
2 7 t h D e c 2 0
1 0 - 0 1 s t J an
2 0 1 1
3 | DECEMBER 2010 | www.capitalvia.com 4
8/8/2019 Stock Market Reports for the Week (27th - 31st December - 2010)
http://slidepdf.com/reader/full/stock-market-reports-for-the-week-27th-31st-december-2010 3/4
W
H Y
C A N
S L I M
?
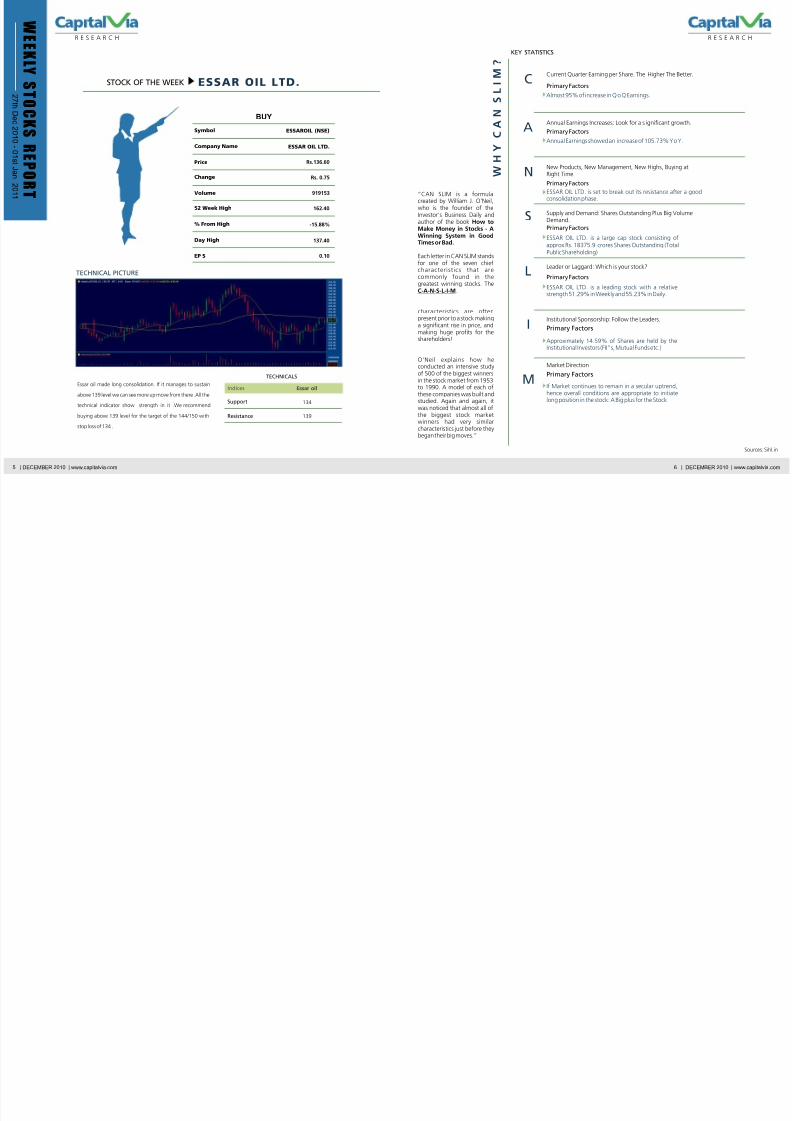
“CAN SLIM is a formulacreated by William J. O'Neil,who is the founder of theInvestor's Business Daily andauthor of the book How toMake Money in Stocks - AWinning System in GoodTimes or Bad.
Each letter in CAN SLIM standsfor one of the seven chiefcharacter ist ics that are
commonly found in thegreatest winning stocks. TheC-A-N-S-L-I-M.
characteristics are oftenpresent prior to a stock makinga significant rise in price, andmaking huge profits for theshareholders!
O'Neil explains how heconducted an intensive studyof 500 of the biggest winnersin the stock market from 1953to 1990. A model of each ofthese companies was built andstudied. Again and again, itwas noticed that almost all of
the biggest stock marketwinners had very similarcharacteristics just before theybegan their big moves.”
Primary Factors
Almost 95% of increase in Q o Q Earnings.
KEY STATISTICS
CCurrent Quarter Earning per Share. The Higher The
Primary Factors
Annual Earnings showed an increase of 105.73% Y o
A
Primary Factors
ESSAR OIL LTD. is set to break out its resistance aftconsolidation phase.
N
Primary Factors
ESSAR OIL LTD. is a large cap stock consisting ofapprox Rs. 18375.9 crores Shares Outstanding (TotaPublic Shareholding)
S Supply and Demand: Shares Outstanding Plus Big VoDemand.
Primary Factors
ESSAR OIL LTD. is a leading stock with a relativestrength 51.29% in Weekly and 55.23% in Daily.
L
Leader or Laggard: Which is your stock?
Primary Factors
Approximately 14.59% of Shares are held by theInstitutional Investors (FII”s, Mutual Funds etc.)
IInstitutional Sponsorship: Follow the Leaders.
Primary Factors
If Market continues to remain in a secular uptrend,hence overall conditions are appropriate to initiatelong position in the stock: A Big plus for the Stock
M
Market Direction
Annual Earnings Increases: Look for a s ignificant gro
New Products, New Management, New Highs, BuyinRight Time.
TECHNICAL PICTURE
Company Name
52 Week High
% From High
Essar oil made long consolidation. If it manages to sustain
above 139 level we can see more up move from there .All the
technical indicator show strength in it .We recommend
buying above 139 level for the target of the 144/150 with
stop loss of 134 .
TECHNICALS
Support
Resistance
134
139
Essar oilIndices
STOCK OF THE WEEK
R E S E A R C H
BUY
Symbol
Change
Volume
Day High
EP S
ESSAR OIL LTD.
162.40
-15.88%
ESSAROIL (NSE)
Rs. 0.75
919153
137.40
0.10
Rs.136.60Price
WE E K L Y S T O C K
S R E P O R T
ESSAR OIL LTD.2 7 t h D e c 2 0
1 0 - 0 1 s t J an
2 0 1 1
5 | DECEMBER 2010 | www.capitalvia.com 6

8/8/2019 Stock Market Reports for the Week (27th - 31st December - 2010)
http://slidepdf.com/reader/full/stock-market-reports-for-the-week-27th-31st-december-2010 4/4
The information and views in this report, our website & all the service we provide are believed to be
reliable, but we do not accept any responsibility (or liability) for errors of fa ct or opinion. Users have the
right to choose the product/s that suits them the most.
Sincere efforts have been made to present the right
investment perspective. The information contained herein is based on analysis and up on sources that
we consider reliable.This material is for personal information and based
upon it & take no responsibility
The stock price projections shown are not necessarily indicative of future price performance. The
information herein, together with all estimates and forecasts, can change without notice.
Analyst or any person related to CapitalVia might be holding positions in the stocks recommended.
It is understood that anyone who is browsing through the site has done so at his free will and does not
read any views expressed as a recommendation for which either the site or its owners or anyone can be
held responsible for.
Any surfing and reading of the information is the a cceptance of this disclaimer.
All Rights Reserved.
Investment in Stocks has its own risks.
We, however, do not vouch for the accuracy or the completeness thereof.we are not responsible for any loss incurred
whatsoever for any financial profits or loss which may arise from
the recommendations above.
CapitalVia does not purport to be an invitation or an offer to buy or sell any financial
instrument.
Our Clients (Paid Or Unpaid), Any third party or anyone else have no rights to forward or share
our calls or SMS or Report or Any Information Provided by us to/with anyone which is
received directly or indirectly by them. If found so then Serious Legal Actions can be taken.
D
I
S
C
L
A
I
M
E
R
R E S E A R C H
Contact Number:
Hotline: +91-91790-02828
Landline: +91-731-668000
Fax: +91-731-4238027
No. 99, 1st Floor, Surya Complex
R. V. Road, Basavangudi
Opposite Lalbagh West Gate
Bangalore - 560004
Corporate Office Address:
India:
CapitalVia Global Research Limited
No. 506 West, Corporate House
169, R. N. T. Marg, Near D. A. V. V.
Indore - 452001
Singapore:
CapitalVia Global Research Pvt. Ltd.
Block 2 Balestier Road
#04-665 Balestier Hill
Shopping Centre
Singapore - 320002
Contact Us
WE E K L Y S T O C K
S R E P O R T
2 7 t h D e c 2 0
1 0 - 0 1 s t J an
2 0 1 1
7 | DECEMBER 2010 | www.capitalvia.com 8