Stock Market Liberalization and the Information ... Choy, Jean-Claude Cosset, Vihang Errunza, Andrew...
39
Stock Market Liberalization and the Information Environment Kee-Hong Bae, Warren Bailey, and Connie X. Mao * Queen’s University, Cornell University, and Temple University 5th November 2005 Abstract We document beneficial associations between the information environment in emerging stock markets and changes in openness to foreign equity investors reflected in legal, regulatory, and cross-listing events, the fraction of stock available to foreign investors, and the size of U.S. portfolio flows. Increased openness is associated with increases in firm-specific information, analyst coverage, and analyst value-added, and decreases in earnings management. In particular, foreign analysts increase their presence, activity, and contribution to the information environment after openness increases. Across a detailed sample of Korean firms, however, such effects are dampened for firms that rate poorly on governance. JEL Classifications: D82, F02, F36, G15 Keywords: Stock market liberalization, international portfolio flows, emerging markets * Corresponding author: Warren Bailey, Johnson Graduate School of Management, Cornell University, Sage Hall, Ithaca, NY 14853-6201, 607-255-4627, fax 607-255-4627, [email protected] . We thank Vidhi Chhaochharia, Helen Choy, Jean-Claude Cosset, Vihang Errunza, Andrew Karolyi, Dong-Cheol Kim, Haitao Li, Alfredo Mendiola, Randall Morck, Dilip Patro, Kate Phylaktis (the editor), Mark Seasholes, Hyun-Han Shin, Bernard Yeung, and workshop participants at Fordham, Korea University, Korean Finance Association, McGill, Rutgers, Ohio State, University of California at Riverside, Waseda University, the 2004 Western Finance Association meetings in Vancouver, and the 2004 Northern Finance Meetings in St. John’s for comments or other assistance. Special thanks to WFA discussant Campbell Harvey for many detailed and helpful comments. We are grateful to Thomson Financial for access to their Institutional Brokers Estimate System (I/B/E/S) provided as part of a broad academic program to encourage earnings expectations research. Bae acknowledges financial support from the Asian Institute of Corporate Governance at Korea University. © 2003, 2004, 2005 Kee-Hong Bae, Warren Bailey, and Connie X. Mao.
Transcript of Stock Market Liberalization and the Information ... Choy, Jean-Claude Cosset, Vihang Errunza, Andrew...

Stock Market Liberalization and the Information Environment
Kee-Hong Bae, Warren Bailey, and Connie X. Mao *
Queen’s University, Cornell University, and Temple University
5th November 2005
Abstract
We document beneficial associations between the information environment in emerging stock
markets and changes in openness to foreign equity investors reflected in legal, regulatory, and
cross-listing events, the fraction of stock available to foreign investors, and the size of U.S.
portfolio flows. Increased openness is associated with increases in firm-specific information,
analyst coverage, and analyst value-added, and decreases in earnings management. In particular,
foreign analysts increase their presence, activity, and contribution to the information
environment after openness increases. Across a detailed sample of Korean firms, however, such
effects are dampened for firms that rate poorly on governance.
JEL Classifications: D82, F02, F36, G15 Keywords: Stock market liberalization, international portfolio flows, emerging markets * Corresponding author: Warren Bailey, Johnson Graduate School of Management, Cornell University, Sage Hall, Ithaca, NY 14853-6201, 607-255-4627, fax 607-255-4627, [email protected]. We thank Vidhi Chhaochharia, Helen Choy, Jean-Claude Cosset, Vihang Errunza, Andrew Karolyi, Dong-Cheol Kim, Haitao Li, Alfredo Mendiola, Randall Morck, Dilip Patro, Kate Phylaktis (the editor), Mark Seasholes, Hyun-Han Shin, Bernard Yeung, and workshop participants at Fordham, Korea University, Korean Finance Association, McGill, Rutgers, Ohio State, University of California at Riverside, Waseda University, the 2004 Western Finance Association meetings in Vancouver, and the 2004 Northern Finance Meetings in St. John’s for comments or other assistance. Special thanks to WFA discussant Campbell Harvey for many detailed and helpful comments. We are grateful to Thomson Financial for access to their Institutional Brokers Estimate System (I/B/E/S) provided as part of a broad academic program to encourage earnings expectations research. Bae acknowledges financial support from the Asian Institute of Corporate Governance at Korea University.
© 2003, 2004, 2005 Kee-Hong Bae, Warren Bailey, and Connie X. Mao.
1
1. Introduction
A key theme in restructuring economies in the developing world is opening stock markets to
foreign portfolio investment. This can be accomplished by permitting foreign investors to enter the local
stock market directly or by allowing local assets to trade in overseas stock markets. Global economic
developments have sometimes raised doubts about the benefits of foreign portfolio investment. For
example, in the wake of the Asian economic crisis that began in 1997, Malaysia’s outspoken former
Prime Minister Mahathir has argued that, “All in all, the present system, if there is a system at all, is
messy, unreliable and destructive.” 1 However, a growing body of empirical evidence strongly suggests
that openness to foreign stock market investors is beneficial, permitting developing economy firms to tap
the global pool of capital to undertake useful investments that generate profits and employment. In
particular, the cost of capital appears to decline significantly after market liberalizations (Henry, 2000;
Bekaert and Harvey, 2000) and after cross listings of individual foreign securities on U.S. exchanges
(Foerster and Karolyi, 1999; Miller, 1999; Errunza and Miller, 2000).
In addition to lowering the cost of capital, the scrutiny of foreign investors, foreign equity
analysts, and foreign stock market listing standards can help resolve information and agency problems,
effectively transmitting higher quality disclosure and governance standards2 to developing-country firms
(Obstfeld, 1998; Stulz, 1999). Better information contributes to the decision-making processes of
investors and managers, facilitates corporate discipline, and adds value.3 By listing overseas and adopting
foreign standards of reporting, regulation, and law, a company can benefit by submitting to what Admati
and Pfleiderer (2000) call “voluntary disclosure.” Country-wide liberalization can pressure an entire
1 Excerpt from his speech entitled “Revitalization of Japanese and East Asian Economies” at the Fifth Symposium of the Institute for International Monetary Affairs, in Tokyo, 2 June 1998. 2 Doidge (2004), for example, finds that cross-listing in the U.S. affords greater protection to minority shareholders. 3 Wurgler (2000) and Durnev, Morck, and Yeung (2004), for example, find that an enhanced information environment for a firm contributes to efficient capital allocation decisions.
2
economy to adopt higher legal, regulatory, and disclosure standards desired by foreign investors from
more developed environments.
In this paper, we explore the relationship between openness to foreign equity investment and the
information environment. Our study is the first to comprehensively investigate the changes in the
information environment that result from increased access by foreign investors. We create an array of
indicators of the information environment of emerging-market firms based on market, disclosure, and
analyst activity. We study associations between these indicators and three measures of openness to
foreign stock market investment based on explicit official liberalizations and equity cross listings, the
fraction of the local stock market available to foreigners, and the flow of U.S. equity investment in and
out of the local stock market. While most previous studies focus on ADRs, we study both cross-listings of
individual foreign companies and several measures of changes in openness to direct foreign participation
in the local stock market.
We also conduct a case study of firms from one country, Korea, for which we have particularly
detailed data on firm characteristics which allow us to examine associations between openness,
information environment, and corporate governance. We focus on emerging markets because the
contribution of increased openness to the quality of the capital market is likely to be most dramatic and
significant in less developed countries. While earlier studies detect a few facets of the relationship
between openness and the information environment,4 our range of openness measures, information
indicators, and emerging market environments offers a comprehensive view of the importance of foreign
portfolio flows to improving disclosure, information production, and other facets of the information
environment in emerging economies.
We find much evidence that increased openness to foreign equity investors improves the
information environment. Our findings are robust across a variety of univariate tests, regression
4 Baker, Nofsinger, and Weaver (2002) and Lang, Lins, and Miller (2003) report increased analyst coverage, forecast accuracy, and news stories after individual firms cross list. Doidge, Karolyi, and Stulz (2004) document the importance of cross listing for companies from countries with poor disclosure standards while Bailey, Karolyi, and Salva (2005) explore the impact of earnings announcements on ADR and non ADR firms. Li, Morck, Yang, and Yeung (2003) suggest that firm-specific information is related to a proxy for openness to capital flows.
3
specifications, and control variables. Two of our results are particularly novel and notable. First, foreign
analysts increase their presence, activity, and contribution to the information environment after openness
increases. Second, our Korean sub-sample indicates that the association between openness and the
information environment depends on corporate governance. Thus, our work plainly demonstrates that an
enhanced information environment is another benefit that increased openness to foreign portfolio
investment brings to developing economies
The paper is organized as follows. Section 2 details our hypotheses while Section 3 describes our
data. Section 4 presents empirical results while Section 5 is a summary, discussion, and outline for further
research.
2. Testable hypotheses
Our null hypothesis is that increased openness to foreign portfolio investment conveys substantial
benefits to an emerging market economy by improving the quality of the information environment faced
by local firms. Previous authors report evidence that the quality of corporate disclosure increases. For
example, Leuz, Nanda, and Wysocki (2003) show that the quality of reported earnings is higher in
environments that impose higher legal, regulatory, and disclosure standards on local firms. Lang, Raedy,
and Yetman (2003) find that non-U.S. firms newly cross-listed in the U.S. supply higher quality
disclosures that result in larger market responses. Cross-listed firms may offer less smooth, more
immediate reporting of economic losses to stave off the threat of legal or regulatory penalties (Ball,
Kothari, and Robin, 2000). Increased market-wide openness may prompt local firms to supply better
disclosure to attract and retain foreign investors, even among firms that are not cross listed.
Our first specific prediction is as follows. As an emerging market opens to foreign investment,
increased foreign investor access and interest spurs more research by analysts, brokerages, traders, and
other local and foreign participants. Therefore:
H1: The number of analysts following local firms increases as an emerging economy becomes
more open to foreign portfolio investment.

4
The resources devoted to analyzing local firms should increase when an emerging stock market becomes
more open to foreign portfolio investment. Increased foreign investor access and interest spurs more
information production by analysts, brokerages, traders, and other local and foreign participants in an
emerging stock market. This prompts local firms to produce more disclosures and adhere more strongly
to international norms of corporate governance, spurring local interest and investment in the local stock
market as well.
Our second prediction is that more resources devoted to studying local companies by exploring
and processing information yields more firm-specific information. Thus the firm-specific component of
return volatility, a proxy for firm-specific information, increases:
H2: Firm-specific return volatility increases as an emerging economy becomes more open to
foreign portfolio investment.
Firm-specific volatility can be measured by regressing individual stock returns on common economic
factors, and Roll (1988) suggests that the resulting low r-squared coefficients for U.S. firms represent
substantial private firm-specific information. However, a large “firm-specific volatility”, that is, one
minus the r-squared as discussed by Roll (1988), may also represent noise trading. Morck, Yeung, and Yu
(2000) relate country-average firm-specific volatility cross-sectionally to country characteristics. They
find that firm-specific return volatility is larger in countries with better investor protection, disclosure, and
overall market quality. This suggests that a higher quality environment offers greater incentives to
produce firm-specific information and trade on it. Their evidence confirms the interpretation of the firm-
specific volatility as a measure of firm-specific information, rather than a measure of noise trading. They
argue that higher firm-specific volatility can indicate the willingness of analysts and other market
participants to produce firm-specific information. Indeed, Xu and Malkiel (2003) find that firm-specific
volatility typically increases with the proportion of a firm that is owned by institutional investors,

5
suggesting that firm-specific volatility is associated with the scrutiny and trading of professional
investors. Furthermore, Durnev, Morck, Yeung, and Zarowin (2003) find that high firm-specific return
volatility is associated with stronger correlation between stock returns and future earnings while Xu and
Malkiel (2003) find a generally positive association between firm-specific volatility and earnings growth.
This again confirms an association between firm-specific return volatility and firm-specific disclosure and
analysis.
Our third prediction is that higher quality disclosures imply that earnings management and
manipulation are less prevalent and earnings are less smooth, therefore:
H3a: Reported earnings become more volatile as an emerging economy becomes more open to
foreign portfolio investment.
H3b: Earnings management decreases as an emerging economy becomes more open to foreign
portfolio investment.
H3 is a consequence of the notion that increased openness spurs the release of more accurate and useful
information. If earnings management or other practices become less acceptable in the presence of foreign
investors, aggressive earnings management becomes less prevalent and earnings releases supply more
genuine surprises to the market. This implies that the absolute value of time-series earnings forecast errors
(that is, naïve forecasts based on historical earnings) increases as an emerging economy becomes more
open to foreign portfolio investment.
Fourth, in response to increased openness of an emerging stock market to foreign equity
investment, listed firms may supply more pre announcement disclosures to guide analysts’ forecasts.
Therefore, analysts can produce more accurate earnings forecasts, and thereby decrease forecast errors.
While the absolute value of time-series earnings forecast errors increases (H3), the absolute value of
analyst forecast errors might decrease if the impact of more diligent research and increased disclosure
outweighs the increased volatility of raw earnings after an increase in market openness:

6
H4: The analyst information advantage improves as an emerging economy becomes more open
to foreign portfolio investment.
The analyst information advantage is defined as the difference between naïve and analyst forecasts. It
measures the “value added” by analysts (Bailey, Li, Mao, and Zhong, 2003).
Fifth, we formulate two competing predictions using the intuition from models such as those of
Kim and Verrecchia (1991, 1994). These models balance the greater precision and greater disagreement
or “difference of opinion” resulting from more information and information processing:
H5a: Earnings forecast dispersion decreases with openness because better disclosure and
information processing increase the precision and unanimity of analyst forecasts.
H5b: Earnings forecast dispersion increases with openness because better disclosure and
information processing increase disagreement and “difference of opinion” among analysts.
As in Harris and Raviv (1993), volatility can indicate a healthy, competitive information environment in
the capital market. We can imagine similar competing effects for analyst forecast errors as increased
precision conflicts with increased earnings volatility and difference of opinion.
3. Data
We begin with the component firms of the Standard and Poor’s Emerging Markets Database
(EMDB). They represent significant firms from a cross-section of over forty emerging economies.
However, data restrictions, as discussed subsequently, limit the number of countries we are able to use.
For example, the lack of sufficient Datastream or I/B/E/S records for such countries as Bahrain, Egypt,
Morocco, Nigeria, Oman, Saudi Arabia, and Zimbabwe leads us to exclude them from our sample. We
use as many countries, firms, and time periods as possible, and, as detailed below, check for robustness
over different sub samples of the available data.
7
3.1. Proxies for openness to cross border portfolio flows
We compute several proxies for the openness of a particular developing country to foreign
portfolio investment. They are based on liberalization and cross listing events, the fraction of local
market capitalization that is legally available to foreign investors, and the size of portfolio flows between
a particular developing country and the U.S.
For a sample of openness events, we collect for each sample country dates of explicit official
liberalizations, cross listing of domestic company shares on U.S. and U.K. stock markets, and listing of
closed-end country funds on U.S. and U.K. stock markets. Such events can ease access to the local stock
market by foreign investors, and a variety of studies associate such events with decreases in the cost of
capital. Table 1 lists (a detailed appendix is available upon request) our sample of official liberalization,
cross listings, and closed end fund listing events and dates. “Official liberalization events”
[Insert Table 1 about here]
are announcements of changes in legislation and regulation that ease foreign access to a country’s local
stock market. We restrict events to major liberalizations involving the stock market or affecting the
ability of foreigners to buy and sell local equities. We also include “de-liberalization” events, that is,
events that raised, rather than loosened, foreign investment restrictions.5 While we could find only a
handful of such events, they allow us to see if the effect of raising capital barriers is opposite in sign to the
effect of lowering such barriers. A second group of “openness” events consists of overseas listings of
stocks or closed end country funds. Table 1 details the construction of these sets of events from various
sources.
In addition to explicit liberalization and cross listing events, we adopt the structural breakpoints
in net monthly U.S. equity portfolio flows estimated by Bekaert and Harvey (2000). As discussed
subsequently, we employ the gross portfolio flow series as a time-series explanatory variable in some of
our tests. However, the Bekaert and Harvey breakpoints serve as alternative dates around which “before
5 In July 1995, for example, Chile imposed new restrictions on ADR trading, including a 3% fee and requiring investors to place 30% of investment in non-interest bearing accounts for one year.

8
versus after” tests can be constructed, in a manner similar to what we do with explicit liberalization and
listing events. This alternative set of “events” is important because the effective dates of changes in
openness may differ substantially from the formal dates of explicit liberalization events. As Bekaert and
Harvey (2000) and other authors have indicated, identifying effective liberalization dates is problematic,
and our use of alternative sets of events helps address this concern.
Table 1 displays our five sets of liberalization and openness events. In addition to “official”,
“cross listing or country fund listing”, “breakpoint”, and “de-liberalization” events as previously
described, we include a set entitled “earliest feasible liberalization”. These are the earliest official
liberalization dates, cross-listing or country fund listing dates, and estimated breakpoints in net U.S.
capital flows for which both pre- and post-event information is available from IBES and Datastream. In
particular, data restrictions can, in some cases, cause us to exclude the earliest explicit events and
structural break-points from our sample. Bekaert and Harvey (2000) show that the earliest cross listing of
stock from a particular country can have more impact than subsequent listings. However, this is not a
problem for our time-series measures of openness described below.
For time-series measures of openness to investment flows, the Emerging Markets Database
(EMDB) of Standard and Poor’s (formerly from the International Finance Corporation of The World
Bank) reports the percentage of each firm’s equity available to foreign investors.6 Based on the sequence
of legal, regulatory, and company-specific restrictions on foreign ownership, the proportion of the equity
of the EMDB firms in a particular market that is available to foreign investors serves as our “investibility”
openness measure. Time-variation in each country’s proportion occurs as foreign ownership limits and
other controls on foreign investment vary with changes in local laws and regulations. Thus, it is a very
specific indicator of the impact of legal limitations on foreign ownership of local equities.
6 Bae, Chan, and Ng (2004) discuss problems such as survivorship bias and lags in updating the foreign ownership restrictions in the EMDB database, and find that corrections to the EMDB methodology do not alter their finding that investibility is associated with higher return volatility and higher correlation with global factors.

9
To represent actual portfolio flows, our final openness measure is computed from the size of
portfolio flows between the U.S. and each country in our sample. U.S. investors represent a significant
fraction of the portfolio capital flows to and from emerging markets. Furthermore, comparable data is not
available from other countries. The monthly flow of portfolio capital between the U.S. and virtually every
country in the world is made available online by the U.S. Treasury Department starting with 1988 data.7
The sum of monthly inward and outward flows of U.S. stock market investors (scaled by the market’s
capitalization) is a proxy for the amount of foreign portfolio activity for each country-month. While the
previously defined “event” and “investibility” measures indicate the potential openness of the local
capital market, the flow of portfolio capital represents the actual capital movements across an emerging
market’s borders.
3.2. Proxies for the information environment
We create several measures of the information environment faced by the emerging market firms
in our sample. These measures will be related to the “openness” measures previously described.
To measure firm-specific volatility, we follow Morck, Yeung, and Yu (2000) and compute the
proportion of firm-specific volatility from monthly EMDB returns. For each firm-window, a regression
of returns on local index returns is estimated. The r-squared coefficients from such regressions measure
how much of the stock’s return is due to market-wide influences and, therefore, one minus the r-squared
is a measure of the firm-specific volatility. We take the logarithm of one minus the r-squared to convert
the figure (which is bounded by zero and one) into a suitable form for subsequent statistical tests. To
check robustness, tests involving firm-specific volatility are based on a variety of windows (ranging from
12 to 36 months), data frequencies (weekly and monthly), and currencies (local versus dollar). Also
following Morck, Yeung, and Yu (2000), we compute the firm-specific volatility from a specification
including both the EMDB value-weighted local index for a country and either the S&P 500 index
representing U.S. index returns or the MSCI World index representing global stock returns, but find that
7 The data was downloaded from http://www.treas.gov/tic/country-longterm.html. Across our sample of emerging market countries, only Sri Lanka lacks data from this source.

10
these variations do not alter our empirical results described below that employ the “local index only”
firm-specific volatility.
Additional information environment measures are derived from data related to earnings
announcements obtained from I/B/E/S. The number of analysts counts analysts providing forecasts of the
particular earnings event. It proxies for the amount of resources devoted to following the firm. The
absolute time-series forecast error, a proxy for naïve forecast precision, is the absolute value of the
seasonal change in a firm’s annual earnings. The absolute consensus forecast error, a proxy for analyst
forecast precision, is the absolute value of the difference between reported annual earnings and the
median of most recent analyst forecasts for that earnings release. The analyst information advantage is the
difference between a particular absolute time series forecast error and the corresponding absolute
consensus forecast error. The forecast dispersion is the standard deviation of individual analyst most
recent forecasts of a firm’s annual earnings. It is a proxy for pre-announcement disagreement. All
forecast error and forecast dispersion variables are scaled by the absolute value of median forecasts. We
also scale the forecast variables using the stock price, and the results are qualitatively similar.
Finally, we adopt several earnings opacity measures to detect the extent to which companies
manipulate earnings releases. Following Bhattacharya, Daouk, and Welker (2004), we compute three
earnings opacity measures: earnings aggressiveness (accruals scaled by lagged total assets), loss
avoidance (ratio of number of firms with small positive earnings minus the number of firms with small
negative earnings divided by their sum), and earnings smoothing (cross sectional correlation between
change in accruals and change in cash flows, both scaled by lagged total assets). Because loss avoidance
and earnings smoothing are computed across all firms of a given country, we have only one observation
per country-year for those variables.
4. Empirical results
In this section, we report results of a variety of tests relating changes in openness to changes in
the information environment.
4.1. Overview of the data

11
Some highlights of summary statistics (unreported but available on request) on the country
openness measures and firm-specific volatility, the earnings-related information variables, and the
earnings opacity measures are as follows. Because investibility and portfolio flow are available monthly,
we compute their summary statistics using monthly data. In contrast, the firm-specific volatility, earnings-
related information variables, and earnings opacity measures are constructed on an annual basis so their
summary statistics are computed on annual observations.
First, median investibility, the fraction of market capitalization available to foreign investors,
ranges from almost 100% (Argentina, Turkey, Poland, South Africa) to much lower levels for several
countries (China, India, Korea, Taiwan) with a history of substantial foreign ownership restrictions.8 The
cross sectional and time variation in investibility is substantial. Second, total U.S. portfolio flow identifies
the countries (Argentina, Brazil, Korea, Malaysia, and Mexico) that appear to be the dominant targets of
U.S. equity portfolio investment. Taiwan is a particularly interesting case as it features low investibility
but high U.S. equity portfolio flows. Aside from indicating how popular the country has been with U.S.
investors in spite of investment restrictions, this also shows that investibility and portfolio flows are not
exactly the same. Third, there is substantial variation in mean and median firm-specific volatility across
countries, confirms that the information environment differs widely across our sample countries.
Across the information variables derived from earnings announcement related data, two notable
facts emerge. First, the median number of analysts per firm ranges widely, from 3 for Venezuela to 21 for
Brazil and Mexico. Korea, a relatively developed market, features a median of only 7 analysts per firm.
Thus, there is great variation in this variable across countries, and the variable is less than perfectly
correlated with the state of economic development. Second, the Russian market displays the highest
median absolute time series forecast error and forecast dispersion, and second and third highest median
analyst information advantage and absolute time series forecast error, respectively. Again, this suggests a
8 See Bailey, Chung, and Kang (1996, 1999) on foreign ownership restrictions across countries.
12
rich cross section of country characteristics in the sample. In particular, data limitations do not entirely
exclude volatile and interesting markets that have only recently emerged.
Finally, differences in earnings opacity are evident across our sample countries. “Earnings
aggressiveness” is a measure of the extent to which companies use accruals to delay recognition of losses
or speed recognition of gains. Larger numbers indicate more manipulation, expressed as a fraction of the
lagged book value of assets. “Loss avoidance” measures the number of firms that report small positive
earnings relative to small negative earnings. In the absence of earnings manipulation, we would expect
these numbers to be roughly equal, but the proportion of firms that report small positive earnings is much
greater in size than those who report small negative earnings. “Earnings smoothing” is measured as the
correlation between cash flow and accruals across companies for each country-year. If a firm tries to
offset poor cash flow with increased accruals, their correlation will be negative. Thus, the more negative
is the correlation, the more a firm smoothes (or manipulates) earnings. There is much evidence of this
practice in the summary statistics for all the countries. All of the mean and median correlation
coefficients are negative. For some countries, earnings smoothing is close to negative one. Across all the
measures, the numbers are roughly similar in scale and sign to those reported by Bhattacharya, Daouk,
and Welker (2004).
4.2. “Before versus after” tests
Our sample of explicit (liberalization, cross listing, and country fund) and implicit (estimated
portfolio flow breakpoints) events imply distinct “before” and “after” periods. Therefore, we examine the
changes in firm-specific return volatility, earnings-related variables, and opacity measures using “before”
and “after” dummy variables in regressions.9 To control for potential country-specific and time trend
effects on our information variables, we include terms for country and calendar year fixed effects. Aside
from reflecting the country characteristics used by Morck, Yeung, and Yu (2000), the fixed effects can
control for differing economic growth rates across countries and time periods, and can correct for
9 As indicated in the tables, we define “before” and “after” as two years before and after the event year. This is intended to alleviate problems with announcement versus implementation times. One year after might not be enough time to capture impact of liberalization.

13
potential bias in the computation of the firm-specific volatility measure of the information environment.10
The regressions are estimated by pooling all firms and all countries in the sample. Following Bekaert,
Harvey, and Lundblad (2001), we estimate GLS regressions to correct for autocorrelation and country-
wise heteroskedasticity.
The results are presented in Table 2. In Panel A, the dependent variable is the individual firm
[Insert Table 2 about here]
annual firm-specific volatility. Estimated coefficients on “Official events – before”, “Listing events -
before”, and “Breakpoint – before” are all negative and significant, suggesting that firm-specific volatility
is typically lower before openness events. Coefficients on “Listing events – after”, and “Breakpoint –
after” are typically positive and highly significant, suggesting that firm-specific volatility is higher after
openness events. The table also reports a chi-squared test that slopes on “before” and “after” dummies
are equal (or jointly equal in regression 5). In most specifications (official events, listing events,
breakpoints, and all sets of events included) this is strongly rejected. Even thought we use GLS to correct
for autocorrelation and heteroskedasticity, there may also be issues with small sample properties. To
address this concern, we adopt a Monte Carlo procedure with random liberalization dates to yield
alternative empirical cutoffs for the t-statistics and chi-square statistics. Based on these Monte Carlo
experiments, the null hypothesis that the coefficients on “before” and “after” dummies are equal is
significantly rejected in most specifications. These results indicate that firm-specific volatility increases
significantly after various liberalization events, which supports H2. As for “de-liberalization” events,
there is no evidence that they reduce firm-specific volatility.
In Panel B of Table 2, the dependent variables are the individual firm earnings-related
information variables plus the earnings aggressiveness measure. Note that the two other earnings opacity
variables (loss avoidance and earnings smoothing) cannot be included in these tests because they must be
10 If a particular country has a small number of large companies, the firm-specific volatility will tend to be small as each company comprises a large fraction of the capitalization of the local stock market, and regression of each company’s return on the index return will yield a large r-squared coefficient.

14
computed by country, not for individual firms. Furthermore, the Panel B tests are computed over fewer
types of openness events given data limitations.
For “earliest feasible liberalization” events, coefficients on the “before” dummies are often
significantly negative. Coefficients on the “after” dummies are positive and significant for number of
analysts (H1), 11 time series (H3a) and analyst forecast error, and analyst information advantage (H4), and
marginally significant for forecast dispersion (H5b), which suggests increases in these information
variables in the “after” period. Chi-squared tests and Monte Carlo simulated tests indicate that equality of
“before” and “after” dummy coefficients is significantly rejected, except for earnings aggressiveness.
These results strongly indicate that the earnings-related indicators increase significantly after openness
events. For de-liberalizations, there is less clear evidence.
Our earnings-related data is relatively constrained in that it does not extend as far back in time as
some of our other data and events used for analyzing firm-specific volatility. To assess whether
differences in data availability substantially affect our results, we also examine the changes in firm-
specific volatility over the smaller set of “feasible” events studied in Panel B, and find similar results as
those in Panel A. Furthermore, we also test whether outliers bias our results: we confirm all results with
critical variables winsorized at the 1% and 99% levels.
To understand these results further, we have estimated some additional specifications as follows.
First, we rank each sample country on seven characteristics. These are the “Judicial Efficiency” index,
“English Legal Origin” dummy, and “Accounting Standards” index from La Porta et al (1998), the
“Duration of Eviction Process” and “Duration of Check Collection” from Djankov et al (2002), and
“Private Credit” and “Stock Market Capitalization” from the IMF’s International Financial Statistics and
the International Finance Corporation. For each characteristic, a dummy variable, “High Rank”, is set to
one if the country ranks among the top half of countries on that characteristic. High (low) ranking means
high (low) quality, e.g., high (low) accounting standard is ranked as high (low) quality, short (long)
11 Lang, Lins, and Miller (2003) report similar findings for a sample of developed and emerging countries for 1996.

15
duration of check collection is ranked as high (low) quality. This rank dummy is then interacted with the
“before” and “after” dummies as used in Table 2. The purpose is to examine which group of countries
experiences a larger change in information variables upon changes in openness. Results (unreported but
available upon request) indicate that the change in firm specific volatility and number of analysts after
openness events is the greatest for countries that rank poorly on almost all of the country characteristics.
Put another way, the impact of increased openness is typically greatest for countries with poor quality of
legal, disclosure, and economic environment. The changes in other information variables do not seem to
differ between high and low quality country groups. These results are consistent with the literature that
suggests that poor quality countries should benefit more from market openness (Stulz, 1999).
Second, we replace the fixed and time effects of Table 2 with a set of country-specific and time-
specific variables. The time series variables are the annual OECD GDP growth and inflation rates. The
cross sectional variables are the individual country time-series average annual GDP growth rate, inflation
rate, and GDP per capita. Results (unreported but available upon request) confirm that our results in Table
2 are robust. After controlling for the above variables, market openness is associated with significant
increases in all the information variables except earnings aggressiveness.
On balance, these pooled regressions indicate associations between openness and the information
environment. It is not just official announcements that seem to affect the information environment.
Portfolio flow breakpoints and cross-listing events seem important as well. This reminds us that it is
useful to study a variety of proxies for changes in openness. Furthermore, the results illustrate that
evidence on “volatility” should be interpreted carefully. While there is little evidence that emerging
market stock volatility rises after liberalization (Bekaert and Harvey 2000), our results indicate that firm-
specific volatility rises after liberalizations and other events that increase openness to foreign investment.
However, increased firm-specific volatility suggests a positive effect (greater firm-specific information
production), and is also associated with other beneficial effects (such as increases in analyst coverage and
analyst information advantage) that indicate improvements in the information environment upon further
opening to foreign stock market investors.

16
4.3. Regressions relating information environment to time-series openness measures
Recall that the proportion of market cap available to foreigners and the flow of capital between
the U.S. and a particular country are monthly time series that proxy for stock market openness. While the
previously described “before and after” tests include structural breakpoints in net portfolio flows as
“events”, we can also analyze the relationship between the investibility or portfolio flow variables and the
information variables. Thus, our second set of tests is based on regressing time-series of our information
variables on time-series of “investibility” and “U.S. portfolio flows”.
Specifically, the median value of a particular information variable is computed across all sample
firms of a given country in a given year, yielding one panel of annual observations for each country. This
dependent variable is, in turn, regressed on the “investibility” or U.S. portfolio flow growth matching the
country-year. Other variables are added to control for potential confounding effects and trends. For
example, the number of sample firms and their market capitalization per country-year may correct for
potential bias in the median firm-specific volatility. We use pooled country-year observations in the
regressions rather than pooled country-firm-year observations since the openness variables are the same
for all firms within a country. When firm level observations are correlated, regression t-statistics are
overstated.12
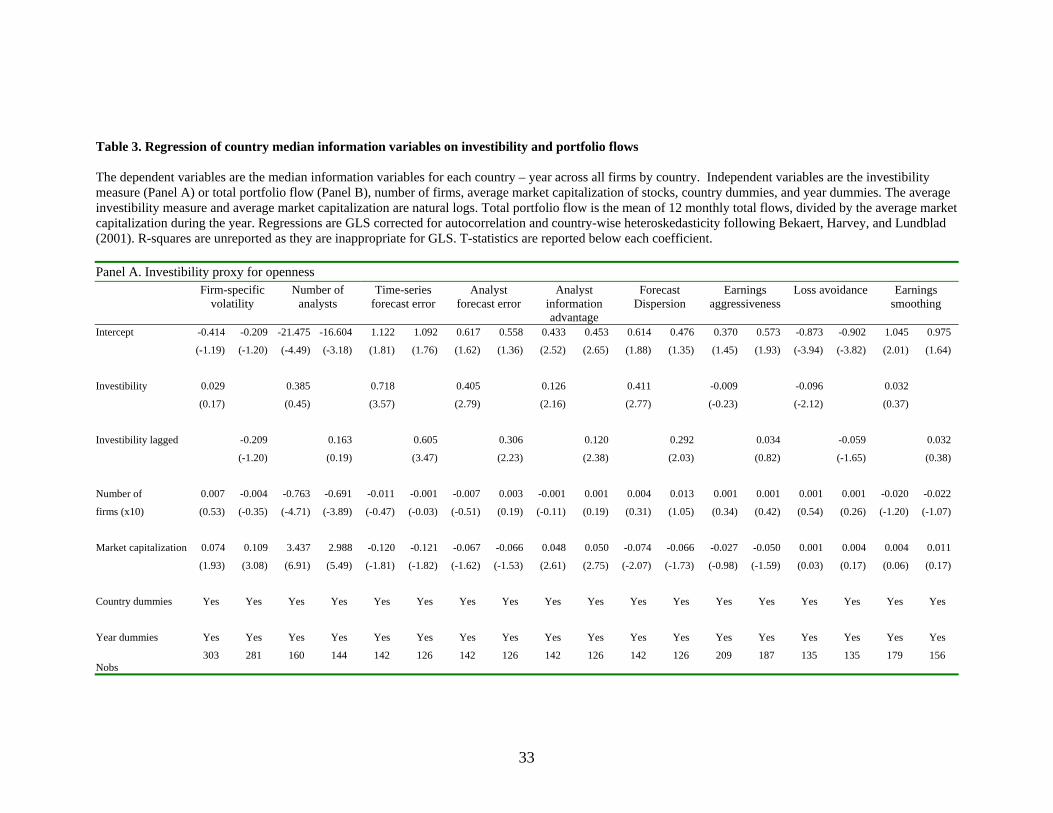
Table 3 reports pooled time-series cross-sectional GLS regressions of country median annual
firm-specific volatility, country median earnings-related variables, and country median earnings opacity
[Insert Table 3 about here]
measures on (contemporaneous or lagged) investibility and gross portfolio flow. Lags are included
because the impact of changes in “openness” on the information environment may be gradual, not
contemporaneous. The necessity of running regressions with annual variables, as described previously,
may facilitate this: One lag of an openness variable provides a window of a year, rather than a month, for
gradual responses of information variables.
12 We repeat using pooled country-firm-year data and find similar results.
17
In Panel A of Table 3, the (contemporaneous or lagged) investibility measure of openness is the
principal explanatory variable. Firm-specific volatility is not statistically significantly related to the
investibility openness measure. Absolute time-series (H3a) and analysts’ forecast errors, forecast
dispersion (H5b), and analyst information advantage (H4) around earnings are strongly positively
correlated with both contemporaneous and lagged investibility. This indicates that changes in the
information environment are associated with increased availability of a country’s equities to foreigners:
earnings announcements are more informative, the value of analyst forecasts relative to naïve forecasts
rises, and pre announcement disagreement is higher. Among the control variables, it is interesting to see
that the number of analysts is negatively correlated with the number of firms in a country. The result is
robust given the use of winsorized series, as is true throughout the paper. Larger market cap is sensibly
associated with a larger number of analysts and greater analyst information advantage. Marginally
significant or significant positive slopes on market capitalization suggest that there is typically more
idiosyncratic information for larger-cap firms. This is particularly strong because we expect firm-specific
volatility to be downward biased, given that large firms can dominate the local stock market index.
Across the earnings opacity variables, there is some evidence that loss avoidance declines significantly
with increased investibility. This is consistent with (H3b).
In Panel B of Table 3, the (contemporaneous or lagged) gross equity portfolio flow measure of
openness is the principal explanatory variable. There is evidence that absolute time series (H3a) and
analyst forecast errors, analyst information advantage (H4), and forecast dispersion (H5b) increase as the
amount of U.S. equity investment flowing across a country’s borders increases. A larger number of listed
firms in a given country are associated with fewer analysts but marginally larger forecast errors and larger
forecast dispersion. Larger market capitalization is associated with more analysts and greater analyst
information advantage but marginally smaller forecast errors and forecast dispersion. Most interestingly,
earnings aggressiveness and loss avoidance decline significantly with contemporaneous portfolio flow.
Earnings smoothing becomes less negative (more positive) as lagged portfolio flow increases, suggesting
decline of earnings smoothing behavior. These results support H3b, suggesting that earnings opacity

18
declines significantly with portfolio flow. Aside from the findings specific to particular testable
hypotheses, these results confirm that the use of several dimensions of the information environment is
valuable for understanding different dimensions of the relationship between openness to foreign
investment and information production.
4.4. A robustness test
To test the robustness of these results, we have estimated an additional specification as follows.
We replace the fixed and time effects of Table 3 with a set of country-specific and time-specific variables.
The time series variables are the annual OECD GDP growth and inflation rates. The cross sectional
variables are the individual country time-series average annual GDP growth rate, inflation rate, and GDP
per capita. Results (unreported but available upon request) are qualitatively similar to those reported in
Table 3.
4.5. More evidence on earnings forecasts and analysts
In this subsection, we present a few additional empirical facts about the changes in analyst
coverage and output around events implying greater openness to foreign portfolio investment.
We wish to understand, in as much detail as possible, the nature of the changes in the information
environment that are associated with increased openness to foreign portfolio investors in our sample of
emerging markets.
Table 4 breaks down previous statistics on changes in numbers of analysts, forecast errors,
[Insert Table 4 about here]
information advantage, and forecast dispersion by “local” versus “foreign” analysts. The number of
foreign analysts grows more than the number of local analysts, as is also true for the analyst information
advantage. This suggests that openness increases the amount of skilled foreign resources applied to the
local capital market. At the same time, the tension between “precision” and “difference of opinion” (H5a

19
versus H5b) is evident. Increases in forecast dispersion and forecast errors after openness events are
greater for foreigners too.13
Table 5 presents two sets of results. On the left side of the table, we repeat previous calculations
[Insert Table 5 about here]
for forecast errors, information advantage, and forecast dispersion for “old” analysts only. By “old”, we
mean those analysts who were providing forecasts for a particular company both before and after the
particular openness event being examined. Most notable are the insignificant changes in analyst
information advantage for these “old” analysts. This suggests that much of the contribution to the local
information environment’s quality after increased openness is due to new entrants, possibly the foreign
analysts identified in Table 4.
On the right side of the table, we present measures of changes in the number of forecasts per
earnings event and the number of forecasts per event per analyst. Each analyst can provide more than one
forecast regarding a particular firm’s annual earnings, depending on how often the analyst revises the
forecast over time. There are significantly more forecasts per annual earnings event after openness events.
Furthermore, each analyst on average provides significantly more annual earnings forecasts each year
after liberalization. These results indicate that increased openness brings more analysis to bear on annual
earnings event and compels each analyst to work harder in collecting information and revising earnings
forecasts on firms they cover. Put another way, increased openness to foreign portfolio flows draws “new
blood” into the production and processing of information. This contributes substantially to the improved
information environment that we document.
4.6. A closer look at a cross section of individual firms from one country
Our tests to this point largely feature variables that have been aggregated across firms and months
within a year. For example, we use country medians of individual firm-specific volatility, rather than the
individual firm-specific volatilities. While this aggregation has many advantages, it also limits our ability
13 Note that our sample consists only of analysts covered by the I/B/E/S records. Omissions may be possible. For example, I/B/E/S analyst coverage of mainland Chinese companies is often more extensive for those companies which offer a class of equity to foreign investors.
20
to control for individual firm characteristics when we relate information variables to indicators of
liberalization or openness to foreign portfolio investment. To address this concern, we produce additional
results for a cross section of individual firms from Korea. The Korean market has several characteristics
that make it particularly suited to our investigation. First, there have been significant changes in foreign
equity investment restrictions., The first Korean closed end fund was listed in the U.S. in 1984,
convertible eurobonds of Korean issuers appeared at about the same time (Bailey, Chung, and Kang,
1996), and direct access by foreigners to the Korean stock market was gradually widened starting in
January 1992. Second, the Korean market is a major target of foreign portfolio investors, ranking third
among our sample countries in terms of U.S. equity portfolio flows. Third, detailed firm-level data are
readily available. In particular, we have access to a variety of governance-related variables, such as
foreign ownership and business group affiliation, that have been used by previous researchers (Bae, Kang,
and Kim, 2002; Baek, Kang, and Park, 2004; Joh, 2003) and, as documented below, can help us
understand interactions between governance and the firm’s information environment. In particular,
Korea’s business groups, referred to as chaebol, are thought to have substantial implications for
governance and performance. We use the Korea Securities Research Institute (KSRI) database for stock
returns and the Listed Company Database of the Korean Listed Companies Association for financial
statements and ownership information.
We estimate GLS regressions of individual firm information variables (that is, the firm-specific
volatility and the earnings-related measures) on openness variables and firm characteristics.14 From all
Korean firms listed during 1987 to 2001, we select non-financial firms with fiscal year ending in
December. This yields approximately 400 to 500 firms for each sample year. For each firm-year, we
compute individual firm information variables and the following firm-specific characteristic variables: the
log of market cap, cash flow (operating income plus depreciation divided by total assets), the fraction of
total assets invested in affiliated firms, a dummy variable for membership in a chaebol business group,
14 The use of the same investibility and flow variables for each firm can bias t-statistics upward because the same observations of explanatory variables enter the regressions many times while regression analysis assumes that every time they enter they provide new information..

21
and the fraction of total equity held by foreign investors. These data are then merged with the annual
portfolio flow and investibility measures. The regression specifications also include interactive
explanatory variables. They are investment in affiliates (converted to a dummy variable to identify firms
that rank above the median on this measure) or chaebol dummy times either the investibility or portfolio
flow measures of openness. Previous research suggests that poorly governed firms may disclose less
useful information. Alternatively, listed firms that comprise a complex collection of businesses or opaque
control structures may be more difficult for financial analysts and other investment professionals to
understand.
Panel A of Table 6 reports pooled time series cross sectional regressions of individual firm-
specific volatility on (contemporaneous or lagged) annual investibility. The results are consistent with our
[Insert Table 6 about here]
predictions and with our earlier results on aggregated variables. The individual firm-specific volatility is
very strongly positively correlated with the contemporaneous and lagged investibility measures (H2).
The individual firm earnings-related measures are also typically significantly positively correlated with
contemporaneous and lagged investibility: Greater openness appears to increase the number of analysts
(H1), the informativeness of earnings releases (H3), the value-added by analysts (H4), and forecast
dispersion (H5b).
There are also associations between information measures and firm characteristics. Firm-specific
volatility is typically smaller for large-cap firms,15 when holdings of shares of affiliated firms are
substantial, or for firms that are chaebol members. This is sensible: previous authors have shown that
such firms are more likely to suffer from relatively poor governance and disclosure. In contrast, firm-
specific volatility is higher when foreign ownership is higher, suggesting that foreign owners produce (or
15 As noted previously, relatively large firms comprise a relatively large fraction of aggregate stock market capitalization and, therefore, their firm-specific volatility may be biased downward. In results on individual Korean firms, we attempt to control for this by including the log of the square of the individual firm’s proportion in the Korean market capitalization as an explanatory variable. Results are robust to this control.

22
demand) more firm-specific information. Among the earnings-related variables, large market cap is
associated with more analysts, smaller time series and analyst forecast errors and forecast dispersion.
Higher profitability (that is, cash flow divided by assets) is associated with smaller time series and analyst
forecast errors and forecast dispersion. Larger foreign ownership is correlated with more analysts,
suggesting that the beneficial impact of openness is magnified for those firms that are heavily covered in
response to foreign investor interest.
There are also interesting associations between openness, information, and governance as
indicated by the slopes of the interactive terms. For firm-specific volatility, the negative slope coefficient
on the chaebol dummy times openness term indicates that the impact of increased openness on the
production of firm-specific information is more muted for chaebol group members. For number of
analysts, the slope coefficients on the interactive terms for both affiliated investments and chaebol are
significantly positive, suggesting that increased openness attracts more analysts for chaebol member
firms. Interestingly, for the time series forecast error, the slope on chaebol*investibility is positive, which
is consistent with improvement in the informativeness of earnings (H3a) for chaebol related firms.16 Panel
B of Table 6 reports similar regressions in which U.S. portfolio flow serves as the “openness”
independent variable, rather than investibility.
There are several potential explanations for these results. Companies ranking poorly on
governance (chaebol member firms) attract more attention (number of analysts) but experience less of an
improvement in information environment (firm-specific volatility) when openness increases. For
example, Hamao, Mei, and Xu (2002) find that the firm-specific volatility of Japanese firms that are
kereitsu group members or that maintain a “main bank” relationship is less sensitive to macroeconomic
ups and downs, suggesting that group or bank relationships shield a firm from economic fluctuations. It
may be the case that groups of poorly governed firms cooperate to weaken the value of disclosure to
shield their true performance, in addition to providing direct economic support to group members.
16 Interestingly, unreported results test whether individual firm cross-listing in the U.S. or U.K. have a similar impact, but the results are largely insignificant.

23
Alternatively, firms with high affiliate investment or chaebol membership are more complex and merely
more difficult for the analysts and markets to understand. Our results suggest that market openness seems
to motivate analyst coverage for these firms. However, the beneficial impact on the firm’s information
environment is not as evident as for those simple non-chaebol member firms.17
5. Summary and conclusions
We have uncovered interesting associations between the state of the information environment and
the degree of openness to foreign equity investment across a sample of emerging markets. Some
highlights are as follows. Openness events such as official liberalizations, cross listing of shares overseas,
or the listing of a closed-end country fund are associated with increases in firm-specific volatility and
most earnings-related proxies for the information environment. In particular, earnings management is less
prevalent, earnings are less smooth and, therefore, more difficult to forecast, analysts produce more
forecasts per earnings event, and pre announcement forecast dispersion is greater. Changes in the number
of analysts and the nature of their output seem larger for foreign analysts. Different facets of the
information environment respond differently to changes in the degree of openness versus the actual extent
of foreign equity flows across an emerging economy’s borders. Results on individual Korean firms
indicate that the effect of increased openness on the quality of the information environment is muted for
firms that score poorly on governance indicators, even though they do draw relatively more analyst
coverage with increased openness.
By employing a variety of proxies for different aspects of the information environment, we enjoy
a detailed look at changes in many facets of that environment. For example, we can view increases in the
number of analysts as an increase in the “inputs” to the information production process. Changes in
forecast dispersion, forecast errors, analyst information advantage, and the frequency of forecast revision
are “outputs” related to a specific type of information event, earnings news. Changes in the firm-specific
volatility reflect the impact on a more general measure of how information is incorporated into firm
17 We control for firm size with the log market capitalization, but correlation between size, affiliate investments, and chaebol membership may complicate our results.
24
value. Changes in openness appear to affect different aspects of the information environment differently.
For example, changes in the number of analysts may precede or predict changes in openness while other
information environment measures appear to be a consequence of openness. Across our sample of
individual Korean firms, openness may prompt more input to information production (the number of
analysts) but yield less potent output (forecast errors) for firms that may be poorly governed or difficult
for analysts to figure out.
Of course, openness may follow changes in the information environment, rather than triggering
changes in the information environment as we theorize. As more information about firms in an emerging
market becomes available, foreign demand for local stocks increases and puts pressure on local
authorities to loosen access. Furthermore, information production may anticipate, rather than follow,
increases in openness. Thus, our results should be treated with caution because of possible endogeneity.
Our own preliminary tests (unreported but available upon request) stack a pair of variables, an
information variable and an openness variable, in a vector autoregression model to determine the lead-lag
associations, but the results are inconclusive. Applying more powerful econometrics techniques and
seeking more imaginative instruments is a challenge for future research on the impact of liberalizations.
Clearly, liberalization and other acts of opening to foreign equity investors have an impact on the
information environment. It is particularly interesting to note the particularly large changes attributed to
foreign analysts who increase their presence, activity, and contribution after openness increases. Thus, we
have succeeded in documenting another facet of the impact of the transition of emerging stock markets to
integration with the global capital market. Opening to foreign portfolio investors does not just lower the
cost of capital but also alters the local environment for disclosure, information production, and the
analysis and use of information, and draws foreign resources, effort, and skill into the capital market.
Indeed, beneficial changes in the information environment, in addition to facilitating cross-border risk
sharing, may contribute to the lower cost of capital after liberalizations and cross-listings documented by
previous authors.

25
References
Admati, A., Pfleiderer, P., 2000. Forcing Firms to Talk: Financial Disclosure and Externalities. Review of
Financial Studies 13 (3), 479-520.
Bae, K.H., Chan, K., Ng, A., 2004. Investibility and Return Volatility. Journal of Financial Economics 71
(2), 239-263.
Bae, K. H., Kang, J. K., Kim, J. M., 2002. Tunneling or Value Added: Evidence from Mergers by Korean
Business Groups. Journal of Finance 57 (6), 2695-2740.
Baek, J. S., Kang, J. K., Park, K. S., 2004. Corporate Governance and Firm Value: Evidence from the Korean
Financial Crisis. Journal of Financial Economics 71 (2), 265-314.
Bailey, W., Chung, Y. P., Kang, J. K., 1996. Investment Restrictions and the Pricing of Korean Convertible
Eurobonds. Pacific Basin Finance Journal 4 (1), 93-111.
Bailey, W., Chung, Y. P., Kang, J. K., 1999. Foreign Ownership Restrictions and Equity Price Premiums: What
Drives the Demand for Cross-Border Investments? Journal of Financial and Quantitative Analysis 34
(4), 489-512.
Bailey, W., Jagtiani, J., 1994. Foreign Ownership Restrictions and Stock Prices in the Thai Capital Market.
Journal of Financial Economics 36 (1), 57-87.
Bailey, W., Karolyi, G. A.., Salva, C., 2005. The Economic Consequences of Increased Disclosure: Evidence
from International Cross-listings. Journal of Financial Economics, forthcoming.
Bailey, W, Li, H., Mao, C. X., Zhong, R., 2003. Regulation Fair Disclosure and Earnings Information: Market,
Analyst, and Corporate Responses. Journal of Finance 58 (6), 2487 – 2514.
Baker, W. K., Nofsinger, J., Weaver, D., 2002. International Cross-listing and Visibility. Journal of Financial
and Quantitative Analysis 37 (3), 495 - 521.
Ball, R., Kothari, S. P, Robin, A., 2000. An Extension of the Effect of International Institutional Factors on the
Properties of Accounting Earnings. Journal of Accounting and Economics 29 (1), 1-51.
Bekaert, G., Harvey, C., 1995. Time-varying world market integration. Journal of Finance 50 (2), 403-444.
Bekaert, G., Harvey, C., 2002. A Chronology of Important Economic, Financial, and Political Events in
Emerging Markets. http://www.duke.edu/~charvey/chronology.htm.

26
Bekaert, G., Harvey, C., 2000. Foreign speculators and emerging equity markets. Journal of Finance 55 (2), 565-
613.
Bekaert, G., Harvey, C., Lumsdaine, R., 2002. Dating the integration of world equity markets. Journal of
Financial Economics 65 (2), 203-248.
Bekaert, G., Urias, M., 1996. Diversification, Integration, and Emerging Market Closed-End Funds. Journal of
Finance 51 (3), 835-870.
Bekaert, G., Harvey, C., Lundblad, C., 2003. Equity Market Liberalization in Emerging Markets. Working
Paper. Duke University, Durham, NC.
Bhattacharya, U., Daouk, H., Welker, M., 2004. The World Price of Earnings Opacity. The Accounting Review
78 (3), 641 – 678.
Djankov, S., La Porta, R., Lopez de Silano, F., Shleifer, A., 2002. Courts: The Lex Mundi Project. Working
paper. Harvard University, Boston, MA.
Doidge, C., 2004. U.S. Cross-listings and the Private Benefits of Control: Evidence from Dual-Class Firms.
Journal of Financial Economics 72 (3), 519-553.
Doidge, C., Karolyi, G. A., Stulz, R., 2004. Why are foreign firms listed in the U.S. worth more? Journal of
Financial Economics 71 (2), 205-238.
Durnev, A., Morck, R., Yeung, B., 2004. Value-Enhancing Capital Budgeting and Firm-Specific Stock Return
Variation. Journal of Finance 59 (1), 65-105.
Durnev, A., Morck, R., Yeung, B., Zarowin, P., 2003. Does Greater Firm-Specific Return Variation Mean More
or Less Informed Stock Pricing? Journal of Accounting Research 41 (5), 797-836.
Errunza, V., Miller, D., 2000. Market segmentation and the cost of capital in international equity markets.
Journal of Financial and Quantitative Analysis 35 (4), 577-600.
Foerster, S., Karolyi, G. A., 1999. The effects of market segmentation and illiquidity on asset prices: Evidence
from foreign stocks listing in the U.S. Journal of Finance 54 (3), 981-1013.
Hamao, Y., Mei, J. P., Xu, Y., 2002. Idiosyncratic Risk and Creative Destruction in Japan. Working Paper.
University of Southern California, Los Angeles, CA.

27
Harris, M., Raviv, A., 1993. Differences of Opinion Make a Horse Race. Review of Financial Studies 6 (3),
473-506.
Henry, P., 2000. Stock market liberalization, economic reform, and emerging market equity prices. Journal of
Finance 55 (2), 529-564.
Huddart, S., Hughes, J., Brunnermeier, M., 1999. Disclosure Requirements and Stock Exchange Listing Choice
In An International Context. Journal of Accounting and Economics 26 (1-3), 237-269.
Joh, S. W., 2003. Corporate governance and firm profitability: Evidence from Korea before the economic crisis.
Journal of Financial Economics 68 (2), 287-322.
Kandel, E., Pearson, N., 1995. Differential interpretation of public signals and trade in speculative markets.
Journal of Political Economy 103 (5), 831-872.
Kim, O., Verrecchia, R., 1991. Trading Volume and Price Reactions to Public Announcements. Journal of
Accounting Research 29 (2), 302-321.
Kim, O., Verrecchia, R., 1991. Market Reaction to Anticipated Announcements. Journal of Financial Economics
30 (2), 273-310.
Kim, O., Verrecchia, R., 1994. Market liquidity and volume around earnings announcements. Journal of
Accounting and Economics 17 (1-2), 41-67.
Lang, M., Lins, K., Miller, D., 2003. ADRs, Analysts, and Accuracy: Does Cross Listing in the U.S. Improve a
Firm’s Information Environment and Increase Market Value? Journal of Accounting Research 41 (2),
317-346.
Lang, M., Raedy, J., Yetman, M., 2003. How Representative are Firms that Cross-Listed? An Analysis of
Accounting Quality. Journal of Accounting Research 41 (2), 363-386.
Leuz, C., Nanda, D., Wysocki, P., 2003. Earnings Management and Investor Protection: An International
Comparison. Journal of Financial Economics 69 (3), 505-528.
Li, K., Morck, R., Yang, F., Yeung, B., 2003. Firm-Specific Variation and Openness in Emerging Markets.
Review of Economics and Statistics, forthcoming.
Miller, D., 1999. The market reaction to international cross-listings: Evidence from Depositary Receipts. Journal
of Financial Economics 51 (1), 103-123

28
Morck, R., Yeung, B., Yu, W., 2000. The information content of stock markets: Why do emerging markets have
synchronous stock price movements? Journal of Financial Economics 58 (1-2), 215-260.
Obstfeld, M., 1998. The Global Capital Market: Benefactor or Menace? Journal of Economic Perspectives 12
(4), 9-30.
Patro, D., 2002. Stock Market Liberalization and Emerging Market Country Fund Premiums. Journal of
Business 78 (1), 135 – 168.
Roll, R., 1988. R2. Journal of Finance 43 (3), 541-566.
Stulz, R., 1999. Globalization of Capital Markets and the Cost of Capital. Journal of Applied Corporate Finance
12 (3), 8-25.
Wurgler, J., 2000. Financial Markets and the Allocation of Capital. Journal of Financial Economics 58 (1-2),
187-214.
Xu, Y., Malkiel, B., 2003. Investigating the Behavior of Idiosyncratic Volatility. Journal of Business 76 (4),
613-644.

29
Table 1. Sequence of liberalizations and changes in openness Official liberalization events (I) are from Bekaert and Harvey (2000) through 1995, and updated through 2002 and extended to additional countries using and other sources. Cross-listing or country fund listing event (II) are from Urias (1996), Patro (2002), and Bekaert and Harvey (2002). Initial trading dates for cross-listings in the U.S. or U.K. are from stock exchange web pages. If cross listing or country fund listing date is within a year of our official liberalization event, then the next such event is selected. Estimated breakpoints of growth in net US equity portfolio capital flows (III) is from Bekaert and Harvey (2000). Given data constraints, earliest feasible liberalization events (V) are, for each country, the earliest event of any type for which both pre- and post-liberalization information is available from IBES in addition to Datastream. “-“ indicates no useful event available.
I II III IV V Country Official
liberalization Cross-listing or
country fund listing
Estimate of break in growth of net US capital flow
De-liberalization
Earliest feasible liberalization
Argentina 89.11 91.10 93.04 02.01 - Brazil 91.05 92.05 88.06 - 96.10 Chile 92.01 - 88.01 95.07 92.01 China - 97.03 - - 97.03 Colombia 91.02 95.07 93.08 - 95.07 Czech Rep - 95.07 - - - Greece 87.12 97.06 86.12 - 97.06 Hungary 96.01 97.11 - - 97.11 India 92.11 99.03 93.04 - 99.03 Indonesia - 94.10 93.06 - - Korea 92.01 94.10 93.03 - 92.01 Malaysia 88.12 90.02 92.04 94.02 90.02 Mexico 89.05 - 90.05 - - Pakistan 91.02 93.12 93.04 - 93.12 Peru - 94.09 - - - Philippines 91.06 94.10 90.01 - - Poland - 97.07 - - 97.07 Portugal - 89.11 94.08 - 95.06 Russia - 96.11 - 97.05 - South Africa - 94.03 - - - Sri Lanka 00.01 - - - - Taiwan 91.01 95.04 92.08 - 91.01 Thailand 87.09 - 88.07 97.06 92.05 Turkey 89.08 90.08 89.12 94.06 - Venezuela 90.01 91.11 94.02 - -

30
Table 2. Regressions of individual firm information variables on liberalization, cross-listing, and portfolio flow breakpoint, and de-liberalization event dummy variables In Panel A, the dependent variable is the annual firm-specific volatility obtained from a market model run for each firm in each country each year starting from 1986 to 2002. Each regression uses 12 return observations in each year and is not overlapped. Independent variables are dummy variables indicating time periods at least two years before or after the year of a liberalization event. In Panel B, the dependent variables are annual individual firm earnings-related measures. Given data limitations, this panel focuses on “earliest feasible events”. T-statistics are in parentheses while p-values are in brackets. χ2-test checks whether the pair of “before” and “after” dummy variables are equal. In specifications with more than one pair of “before” and “after” dummies, χ2-test checks that the coefficients are jointly equal. Regressions are GLS corrected for autocorrelation and country-wise heteroskedasticity following Bekaert, Harvey, and Lundblad (2001). R-squares are unreported as they are inappropriate for GLS. A Monte Carlo procedure with random liberalization dates yields alternative empirical cutoffs for the t-statistics and χ2-statistics. Asterisk next to the p-value of the χ2 test indicates simulation confirms the χ2 test is significant at the 5% level.

31
Table 2 continued.
Panel A: Dependent variable is individual firm annual firm-specific volatility 1 2 3 4 5 Intercept 0.589 0.579 0.586 0.584 0.587 (213.61) (200.54) (210.44) (221.69) (182.21) Official event (I) Before -0.092 -0.078 (-8.80) (-7.48) After 0.001 0.009 (0.06) (0.98) Listing event (II) Before -0.028 -0.029 (-3.18) (-3.29) After 0.052 0.047 (6.90) (6.29) Breakpoint (III) Before -0.076 -0.058 (-7.69) (-5.70) After 0.026 0.021 (3.07) (2.39) De-liberalization (IV) Before -0.049 -0.067 (-2.78) (-3.88) After -0.013 -0.018 (0.13) (-1.23) Country dummies Yes Yes Yes Yes Yes Year dummies Yes Yes Yes Yes Yes χ2 test: Before=After [0.00]* [0.00]* [0.00]* [0.11] [0.00]* Number of observations 17425 17425 17425 17425 17425

32
Table 2 continued.
Panel B: Dependent variables are individual firm earnings-related measures of information environment Number of analysts Time-series
forecast error Analyst forecast
error Analyst information
advantage Forecast dispersion Earnings
Aggressiveness 1 2 1 2 1 2 1 2 1 2 1 2 Intercept 9.633 8.648 3.838 4.051 2.395 2.594 1.039 1.050 0.930 1.116 -0.053 -0.043 (28.22) (23.59) (7.01) (6.79) (5.98) (5.93) (3.92) (3.61) (3.25) (3.54) (-2.46) (-1.98) Earliest feasible events (V) Before -0.106 0.470 -1.158 -1.243 -0.960 -1.033 -0.177 -0.181 -0.495 -0.558 -0.050 -0.057 (-0.24) (1.07) (-2.28) (-2.41) (-2.09) (-2.36) (-0.78) (-0.78) (-2.03) (-2.25) (-2.15) (-2.44) After 0.830 1.234 1.992 2.008 1.137 1.132 0.769 0.758 0.622 0.622 -0.037 -0.041 (2.59) (3.81) (2.68) (2.66) (2.29) (2.25) (2.35) (2.27) (1.77) (1.75) (-1.87) (-2.06) De-liberalization (IV) Before 1.7041 0.159 -0.059 -0.093 -0.092 -0.099 (1.56) (0.14) (-0.08) (-0.18) (-0.17) (-3.13) After 3.492 -1.953 -1.468 0.028 -1.238 -0.008 (4.31) (-1.57) (-1.72) (0.05) (-2.08) (-0.29) Country dummies Yes Yes Yes Yes Yes Yes Yes Yes Yes Yes Yes Yes Year dummies Yes Yes Yes Yes Yes Yes Yes Yes Yes Yes Yes Yes χ2 test: Before = after [0.039]* [0.00]* [0.044]* [0.00]* [0.055]* [0.00]* [0.047]* [0.00]* [0.067]* [0.00]* [0.62] [0.12] Number of observations 3059 3059 2549 2549 2549 2549 2549 2549 2549 2549 3149 3149
33
Table 3. Regression of country median information variables on investibility and portfolio flows The dependent variables are the median information variables for each country – year across all firms by country. Independent variables are the investibility measure (Panel A) or total portfolio flow (Panel B), number of firms, average market capitalization of stocks, country dummies, and year dummies. The average investibility measure and average market capitalization are natural logs. Total portfolio flow is the mean of 12 monthly total flows, divided by the average market capitalization during the year. Regressions are GLS corrected for autocorrelation and country-wise heteroskedasticity following Bekaert, Harvey, and Lundblad (2001). R-squares are unreported as they are inappropriate for GLS. T-statistics are reported below each coefficient. Panel A. Investibility proxy for openness Firm-specific
volatility Number of
analysts Time-series
forecast error Analyst
forecast error Analyst
information advantage
Forecast Dispersion
Earnings aggressiveness
Loss avoidance Earnings smoothing
Intercept -0.414 -0.209 -21.475 -16.604 1.122 1.092 0.617 0.558 0.433 0.453 0.614 0.476 0.370 0.573 -0.873 -0.902 1.045 0.975
(-1.19) (-1.20) (-4.49) (-3.18) (1.81) (1.76) (1.62) (1.36) (2.52) (2.65) (1.88) (1.35) (1.45) (1.93) (-3.94) (-3.82) (2.01) (1.64)
Investibility 0.029 0.385 0.718 0.405 0.126 0.411 -0.009 -0.096 0.032
(0.17) (0.45) (3.57) (2.79) (2.16) (2.77) (-0.23) (-2.12) (0.37)
Investibility lagged -0.209 0.163 0.605 0.306 0.120 0.292 0.034 -0.059 0.032
(-1.20) (0.19) (3.47) (2.23) (2.38) (2.03) (0.82) (-1.65) (0.38)
Number of 0.007 -0.004 -0.763 -0.691 -0.011 -0.001 -0.007 0.003 -0.001 0.001 0.004 0.013 0.001 0.001 0.001 0.001 -0.020 -0.022
firms (x10) (0.53) (-0.35) (-4.71) (-3.89) (-0.47) (-0.03) (-0.51) (0.19) (-0.11) (0.19) (0.31) (1.05) (0.34) (0.42) (0.54) (0.26) (-1.20) (-1.07)
Market capitalization 0.074 0.109 3.437 2.988 -0.120 -0.121 -0.067 -0.066 0.048 0.050 -0.074 -0.066 -0.027 -0.050 0.001 0.004 0.004 0.011
(1.93) (3.08) (6.91) (5.49) (-1.81) (-1.82) (-1.62) (-1.53) (2.61) (2.75) (-2.07) (-1.73) (-0.98) (-1.59) (0.03) (0.17) (0.06) (0.17)
Country dummies Yes Yes Yes Yes Yes Yes Yes Yes Yes Yes Yes Yes Yes Yes Yes Yes Yes Yes
Year dummies Yes Yes Yes Yes Yes Yes Yes Yes Yes Yes Yes Yes Yes Yes Yes Yes Yes Yes
Nobs
303 281 160 144 142 126 142 126 142 126 142 126 209 187 135 135 179 156
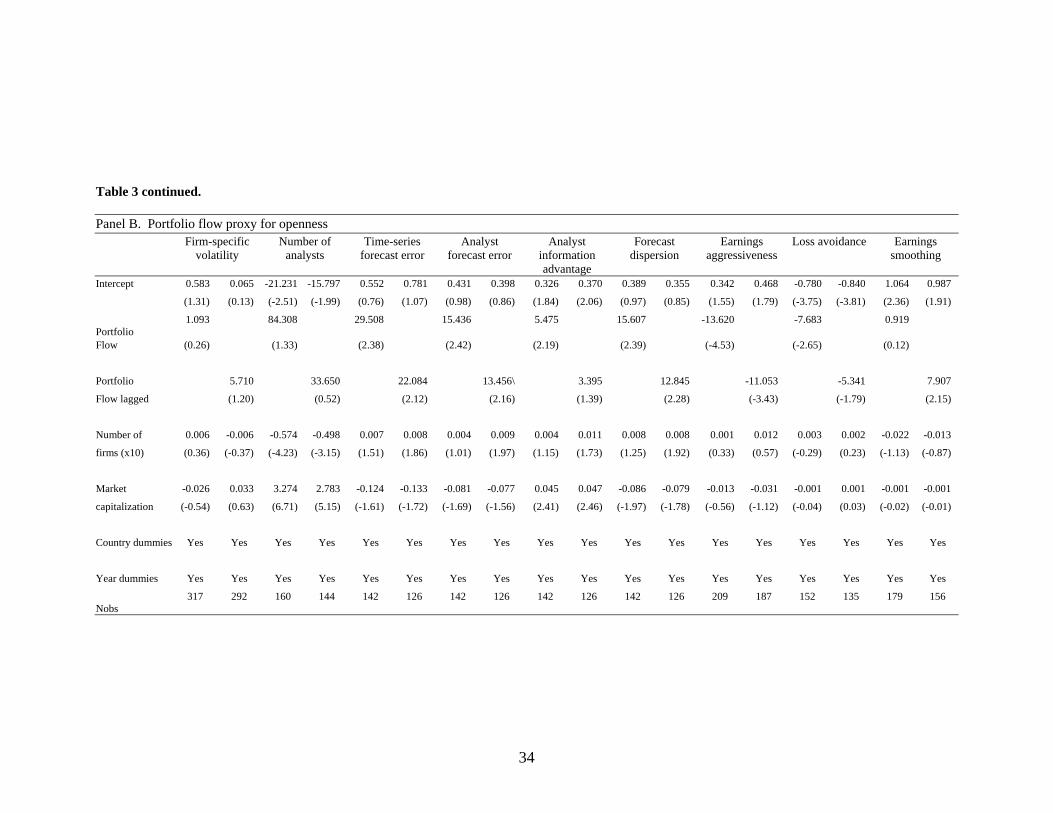
34
Table 3 continued. Panel B. Portfolio flow proxy for openness Firm-specific
volatility Number of
analysts Time-series
forecast error Analyst
forecast error Analyst
information advantage
Forecast dispersion
Earnings aggressiveness
Loss avoidance Earnings smoothing
Intercept 0.583 0.065 -21.231 -15.797 0.552 0.781 0.431 0.398 0.326 0.370 0.389 0.355 0.342 0.468 -0.780 -0.840 1.064 0.987
(1.31) (0.13) (-2.51) (-1.99) (0.76) (1.07) (0.98) (0.86) (1.84) (2.06) (0.97) (0.85) (1.55) (1.79) (-3.75) (-3.81) (2.36) (1.91)
Portfolio
1.093 84.308 29.508 15.436 5.475 15.607 -13.620 -7.683 0.919
Flow (0.26) (1.33) (2.38) (2.42) (2.19) (2.39) (-4.53) (-2.65) (0.12)
Portfolio 5.710 33.650 22.084 13.456\ 3.395 12.845 -11.053 -5.341 7.907
Flow lagged (1.20) (0.52) (2.12) (2.16) (1.39) (2.28) (-3.43) (-1.79) (2.15)
Number of 0.006 -0.006 -0.574 -0.498 0.007 0.008 0.004 0.009 0.004 0.011 0.008 0.008 0.001 0.012 0.003 0.002 -0.022 -0.013
firms (x10) (0.36) (-0.37) (-4.23) (-3.15) (1.51) (1.86) (1.01) (1.97) (1.15) (1.73) (1.25) (1.92) (0.33) (0.57) (-0.29) (0.23) (-1.13) (-0.87)
Market -0.026 0.033 3.274 2.783 -0.124 -0.133 -0.081 -0.077 0.045 0.047 -0.086 -0.079 -0.013 -0.031 -0.001 0.001 -0.001 -0.001
capitalization (-0.54) (0.63) (6.71) (5.15) (-1.61) (-1.72) (-1.69) (-1.56) (2.41) (2.46) (-1.97) (-1.78) (-0.56) (-1.12) (-0.04) (0.03) (-0.02) (-0.01)
Country dummies Yes Yes Yes Yes Yes Yes Yes Yes Yes Yes Yes Yes Yes Yes Yes Yes Yes Yes
Year dummies Yes Yes Yes Yes Yes Yes Yes Yes Yes Yes Yes Yes Yes Yes Yes Yes Yes Yes
Nobs
317 292 160 144 142 126 142 126 142 126 142 126 209 187 152 135 179 156
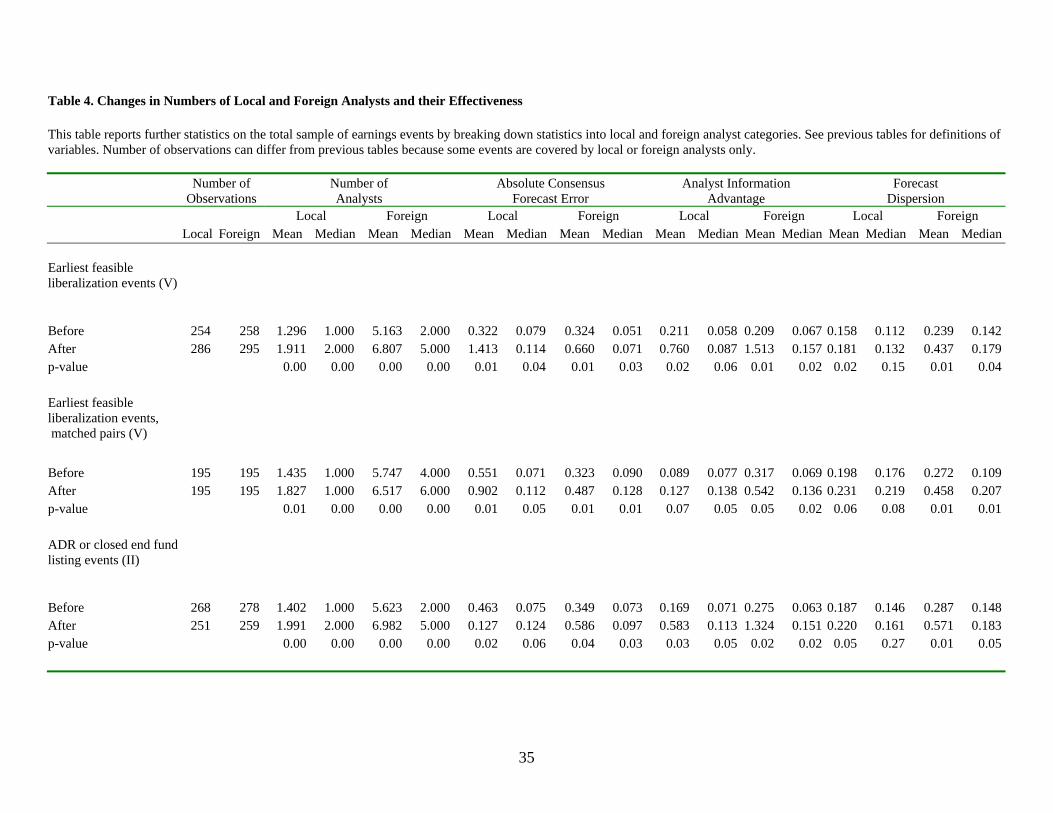
35
Table 4. Changes in Numbers of Local and Foreign Analysts and their Effectiveness This table reports further statistics on the total sample of earnings events by breaking down statistics into local and foreign analyst categories. See previous tables for definitions of variables. Number of observations can differ from previous tables because some events are covered by local or foreign analysts only. Number of
Observations Number of Analysts
Absolute Consensus Forecast Error
Analyst Information Advantage
Forecast Dispersion
Local Foreign Local Foreign Local Foreign Local Foreign Local Foreign Mean Median Mean Median Mean Median Mean Median Mean Median Mean Median Mean Median Mean Median Earliest feasible liberalization events (V)
Before 254 258 1.296 1.000 5.163 2.000 0.322 0.079 0.324 0.051 0.211 0.058 0.209 0.067 0.158 0.112 0.239 0.142 After 286 295 1.911 2.000 6.807 5.000 1.413 0.114 0.660 0.071 0.760 0.087 1.513 0.157 0.181 0.132 0.437 0.179 p-value 0.00 0.00 0.00 0.00 0.01 0.04 0.01 0.03 0.02 0.06 0.01 0.02 0.02 0.15 0.01 0.04 Earliest feasible liberalization events, matched pairs (V)
Before 195 195 1.435 1.000 5.747 4.000 0.551 0.071 0.323 0.090 0.089 0.077 0.317 0.069 0.198 0.176 0.272 0.109 After 195 195 1.827 1.000 6.517 6.000 0.902 0.112 0.487 0.128 0.127 0.138 0.542 0.136 0.231 0.219 0.458 0.207 p-value 0.01 0.00 0.00 0.00 0.01 0.05 0.01 0.01 0.07 0.05 0.05 0.02 0.06 0.08 0.01 0.01 ADR or closed end fund listing events (II)
Before 268 278 1.402 1.000 5.623 2.000 0.463 0.075 0.349 0.073 0.169 0.071 0.275 0.063 0.187 0.146 0.287 0.148 After 251 259 1.991 2.000 6.982 5.000 0.127 0.124 0.586 0.097 0.583 0.113 1.324 0.151 0.220 0.161 0.571 0.183 p-value 0.00 0.00 0.00 0.00 0.02 0.06 0.04 0.03 0.03 0.05 0.02 0.02 0.05 0.27 0.01 0.05

36
Table 5. Additional Measures of the Impact of Openness Events on Earnings-Related Variables. “Old” analysts are those who, for the particular liberalization or listing event, were supplying forecasts both before and after the event. The affiliation of each analyst is determined by the I/B/E/S Translations File. The table reports averages for each variable. Inference drawn from (unreported) medians is very similar. “Old” Analysts only Average Number of Forecasts for All Analysts Nobs Absolute Time
Series Forecast Error
Absolute Consensus
Forecast Error
Analyst Information Advantage
Forecast Dispersion
Nobs Per Earnings Event
Per Analyst Per Earnings
Event Earliest feasible liberalization events (V)
Before 248 0.479 0.361 0.118 0.223 262 26.726 1.782 After 277 0.983 1.043 -0.06 0.314 295 34.882 1.995 p-value 0.06 0.03 0.35 0.04 0.00 0.00 Earliest feasible liberalization events, matched pairs (V)
Before 186 0.598 0.474 0.124 0.338 195 27.259 1.818 After 186 1.385 1.129 0.256 0.479 195 35.137 1.987 p-value 0.06 0.05 0.08 0.05 0.00 0.04 ADR or closed end fund listing events (II)
Before 255 0.509 0.434 0.075 0.384 283 27.046 1.764 After 279 0.930 0.808 0.122 0.517 299 35.629 1.979 p-value 0.08 0.09 0.11 0.04 0.00 0.00
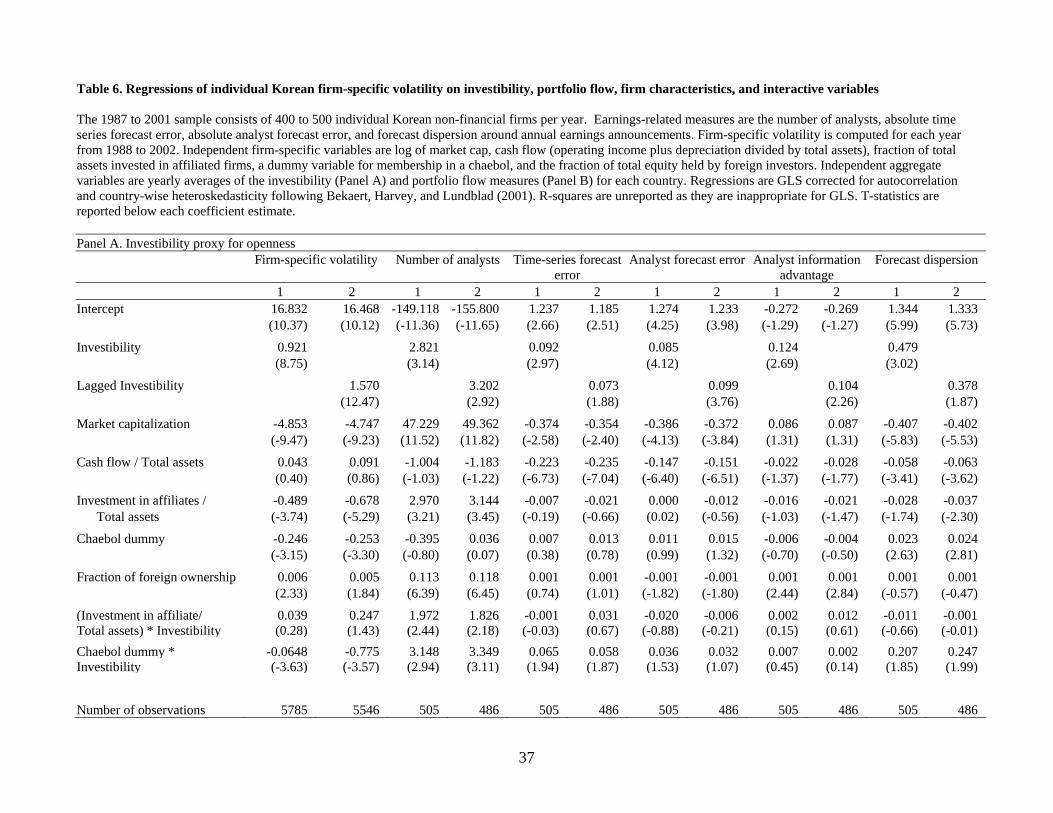
37
Table 6. Regressions of individual Korean firm-specific volatility on investibility, portfolio flow, firm characteristics, and interactive variables The 1987 to 2001 sample consists of 400 to 500 individual Korean non-financial firms per year. Earnings-related measures are the number of analysts, absolute time series forecast error, absolute analyst forecast error, and forecast dispersion around annual earnings announcements. Firm-specific volatility is computed for each year from 1988 to 2002. Independent firm-specific variables are log of market cap, cash flow (operating income plus depreciation divided by total assets), fraction of total assets invested in affiliated firms, a dummy variable for membership in a chaebol, and the fraction of total equity held by foreign investors. Independent aggregate variables are yearly averages of the investibility (Panel A) and portfolio flow measures (Panel B) for each country. Regressions are GLS corrected for autocorrelation and country-wise heteroskedasticity following Bekaert, Harvey, and Lundblad (2001). R-squares are unreported as they are inappropriate for GLS. T-statistics are reported below each coefficient estimate. Panel A. Investibility proxy for openness Firm-specific volatility Number of analysts Time-series forecast
error Analyst forecast error Analyst information
advantage Forecast dispersion
1 2 1 2 1 2 1 2 1 2 1 2 Intercept 16.832 16.468 -149.118 -155.800 1.237 1.185 1.274 1.233 -0.272 -0.269 1.344 1.333 (10.37) (10.12) (-11.36) (-11.65) (2.66) (2.51) (4.25) (3.98) (-1.29) (-1.27) (5.99) (5.73)
Investibility 0.921 2.821 0.092 0.085 0.124 0.479 (8.75) (3.14) (2.97) (4.12) (2.69) (3.02)
Lagged Investibility 1.570 3.202 0.073 0.099 0.104 0.378 (12.47) (2.92) (1.88) (3.76) (2.26) (1.87)
Market capitalization -4.853 -4.747 47.229 49.362 -0.374 -0.354 -0.386 -0.372 0.086 0.087 -0.407 -0.402 (-9.47) (-9.23) (11.52) (11.82) (-2.58) (-2.40) (-4.13) (-3.84) (1.31) (1.31) (-5.83) (-5.53)
Cash flow / Total assets 0.043 0.091 -1.004 -1.183 -0.223 -0.235 -0.147 -0.151 -0.022 -0.028 -0.058 -0.063 (0.40) (0.86) (-1.03) (-1.22) (-6.73) (-7.04) (-6.40) (-6.51) (-1.37) (-1.77) (-3.41) (-3.62)
Investment in affiliates / -0.489 -0.678 2.970 3.144 -0.007 -0.021 0.000 -0.012 -0.016 -0.021 -0.028 -0.037 Total assets (-3.74) (-5.29) (3.21) (3.45) (-0.19) (-0.66) (0.02) (-0.56) (-1.03) (-1.47) (-1.74) (-2.30)
Chaebol dummy -0.246 -0.253 -0.395 0.036 0.007 0.013 0.011 0.015 -0.006 -0.004 0.023 0.024 (-3.15) (-3.30) (-0.80) (0.07) (0.38) (0.78) (0.99) (1.32) (-0.70) (-0.50) (2.63) (2.81)
Fraction of foreign ownership 0.006 0.005 0.113 0.118 0.001 0.001 -0.001 -0.001 0.001 0.001 0.001 0.001 (2.33) (1.84) (6.39) (6.45) (0.74) (1.01) (-1.82) (-1.80) (2.44) (2.84) (-0.57) (-0.47)
(Investment in affiliate/ 0.039 0.247 1.972 1.826 -0.001 0.031 -0.020 -0.006 0.002 0.012 -0.011 -0.001Total assets) * Investibility (0.28) (1.43) (2.44) (2.18) (-0.03) (0.67) (-0.88) (-0.21) (0.15) (0.61) (-0.66) (-0.01)Chaebol dummy * -0.0648 -0.775 3.148 3.349 0.065 0.058 0.036 0.032 0.007 0.002 0.207 0.247Investibility (-3.63) (-3.57) (2.94) (3.11) (1.94) (1.87) (1.53) (1.07) (0.45) (0.14) (1.85) (1.99)
Number of observations 5785 5546 505 486 505 486 505 486 505 486 505 486

38
Table 6 continued. Panel B. Portfolio flow proxy for openness Firm-specific volatility Number of analysts Time-series forecast
error Analyst forecast error Analyst information
advantage Forecast dispersion
1 2 1 2 1 2 1 2 1 2 1 2 Intercept 16.983 16.480 -154.619 -158.370 1.077 1.139 1.167 1.214 -0.283 -0.292 1.284 1.299 (10.41) (9.93) (-11.82) (-12.17) (2.33) (2.44) (3.93) (3.92) (-1.34) (-1.38) (5.76) (5.65)
Portfolio flow 52.366 217.322 8.496 6.810 1.777 4.008 (6.75) (3.27) (3.52) (4.35) (1.94) (3.25)
Lagged Portfolio flow 70.179 266.959 7.989 7.199 1.924 3.817 (7.82) (3.59) (2.95) (3.97) (2.01) (2.73)
Market capitalization -4.901 -4.741 48.890 50.057 -0.328 -0.345 -0.355 -0.369 0.088 0.092 -0.390 -0.394 (-9.52) (-9.04) (11.98) (12.32) (-2.28) (-2.37) (-3.83) (-3.82) (1.35) (1.40) (-5.62) (-5.49)
Cash flow / Total assets 0.045 0.050 -0.661 -0.797 -0.212 -0.221 -0.146 -0.147 -0.022 -0.022 -0.057 -0.058 (0.42) (0.47) (-0.68) (-0.84) (-6.44) (-6.68) (-6.45) (-6.27) (-1.41) (-1.39) (-3.39) (-3.36)
Investment in affiliates / -0.494 -0.542 2.271 2.853 -0.014 -0.009 -0.018 -0.002 -0.006 -0.015 -0.031 -0.033 Total assets (-3.44) (-3.78) (2.23) (2.88) (-0.38) (-0.24) (-0.76) (-0.08) (-0.34) (-0.95) (-1.77) (-1.87)
Chaebol dummy -0.289 -0.279 -0.920 -0.583 -0.002 0.001 0.008 0.007 -0.009 -0.008 0.019 0.021 (-3.24) (-3.15) (-1.61) (-1.08) (-0.10) (0.03) (0.58) (0.57) (-0.96) (-0.88) (1.84) (2.12)
Fraction of foreign ownership 0.006 0.006 0.101 0.108 0.005 0.001 -0.001 -0.0008 0.001 0.001 -0.001 -0.001 (2.29) (2.16) (5.67) (6.04) (0.16) (0.61) (-2.49) (-1.95) (2.37) (2.39) (-1.07) (-0.76)
(Investment in affiliate/ 3.337 5.661 154.760 110.469 -0.106 -0.150 -0.106 -1.359 1.072 0.241 -0.567 -0.464 Total assets) * Portfolio flow (0.32) (0.47) (2.28) (1.95) (-0.04) (-0.05) (-0.06) (-0.67) (0.89) (0.17) (-0.45) (-0.31) Chaebol dummy * -27.993 -40.789 319.876 342.761 4.984 5.702 2.636 3.167 0.998 0.961 1.819 1.881 Portfolio flow (-2.11) (-2.63) (3.99) (3.82) (1.78) (1.86) (1.44) (1.49) (0.75) (0.66) (1.28) (1.17)
Number of observations 5785 5546 409 359 409 359 409 359 409 359 409 359


![Words Appearing with Moderate Frequency (C-G) · 2019-12-10 · cosmozoic cossette n X/@`Ra F [has homonyms: cassette, cosset] a strip or slice (as of sugar beet or potato) : chip.](https://static.fdocuments.us/doc/165x107/5e3e1123be6c77221f5961ef/words-appearing-with-moderate-frequency-c-g-2019-12-10-cosmozoic-cossette-n.jpg)