Stock Guide Spring 2017 - MarketSmith · learn from their stories so you can find greater investing...
28
Transcript of Stock Guide Spring 2017 - MarketSmith · learn from their stories so you can find greater investing...


FREE ONE-TO-ONE PRODUCT COACHINGMarketSmith product coaches are professionally trained in investment research and acti vely use MarketSmith for their personal investment analysis.
Jump-start your investi ng success, schedule your personal coaching session today.
(800) 831-2525
WE ARE COMMITTED TO YOUR
INVESTING SUCCESS

Spring Stock Guide // 2017 Q2
We’re excited to share some new changes to the MarketSmith Stock Guide. We surveyed our customers and asked what they found useful and what they’d like to see in future issues. Overwhelmingly, customers asked how other MarketSmith users discover new stock ideas. They wanted more screens, previews of new features, and ongoing tips and information to improve their investing research. We decided to focus this edition completely on customer success stories and asked one of our favorite MarketSmith users to help tell them. Amy Smith, IBD Market Commentator and author of How to Make Money in Stocks Success Stories, talked with three MarketSmith users about their recent stock successes and the screening criteria they use to surface winning stocks. Amy will be a permanent addition to our Stock Guide content team and will be sharing more success stories from MarketSmith users. We hope you learn from their stories so you can find greater investing success. As always, if you have any questions or comments about your investing research or any MarketSmith features, please call one of our product coaches at (800) 831-2525 or email us at [email protected]. We’re here to help you make more money in the market. Best Returns, The MarketSmith Team
Download the MarketSmith App
2
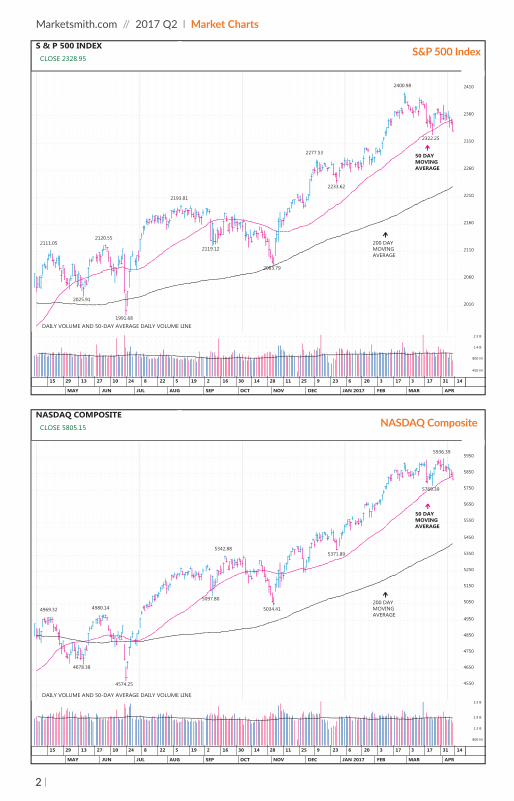
Marketsmith.com // 2017 Q2 l Market Charts
S & P 500 INDEXCLOSE 2328.95
2111.052120.55
2193.81
2277.53
2400.98
2025.91
1991.68
2119.12
2083.79
2233.62
2322.25
50 DAY MOVING AVERAGE
200 DAY MOVING AVERAGE
AVERAGEAVERAGE
2322.25
50 DAY MOVING AVERAGE
2322.25
50 DAY MOVING AVERAGE
50 DAY MOVING MOVING AVERAGE
2400.982400.98
200 DAY MOVING AVERAGE
200 DAY MOVING AVERAGE
200 DAY MOVING AVERAGE
2233.622233.62
2277.532277.53
2083.792083.79
2119.122119.12
2193.812193.812193.812193.81
1991.681991.681991.681991.681991.681991.68
2120.552120.55
2025.912025.91
2111.052111.05
2193.812193.81
2010
2060
2110
2160
2210
2260
2310
2360
2410
DAILY VOLUME AND 50-DAY AVERAGE DAILY VOLUME LINE
450 M
800 M
1.4 B
2.3 B
14311731732062392511281430162195228241027132915
APRMARFEBJAN 2017DECNOVOCTSEPAUGJULJUNMAY
NASDAQ COMPOSITECLOSE 5805.15
4969.32 4980.14
5342.88
5936.39
4678.38
4574.25
5097.80
5034.41
5371.89
5769.39
50 DAY MOVING AVERAGE
200 DAY MOVING AVERAGE
5936.395936.39
5769.395769.39
AVERAGEAVERAGE
5769.39
50 DAY MOVING AVERAGE
5769.39
50 DAY MOVING AVERAGE
50 DAY 50 DAY MOVING AVERAGE
200 DAY MOVING MOVING AVERAGE
200 DAY MOVING MOVING AVERAGE
200 DAY MOVING MOVING AVERAGE
5371.895371.895371.89
5034.415034.415034.415034.41
5342.885342.885342.885342.88
5097.805097.805097.805097.805097.805097.80
4574.254574.25
4980.144980.144980.14
4678.384678.38
4969.324969.32
4574.25
200 DAY
5371.895371.895371.895371.89
5769.395769.395769.395769.395769.395769.395769.39
4550
4650
4750
4850
4950
5050
5150
5250
5350
5450
5550
5650
5750
5850
5950
DAILY VOLUME AND 50-DAY AVERAGE DAILY VOLUME LINE
800 M
1.3 B
1.9 B
3.3 B
14311731732062392511281430162195228241027132915
APRMARFEBJAN 2017DECNOVOCTSEPAUGJULJUNMAY
S&P 500 Index
NASDAQ Composite
3
*All screen results are computer-generated and were run on April 13, 2017.
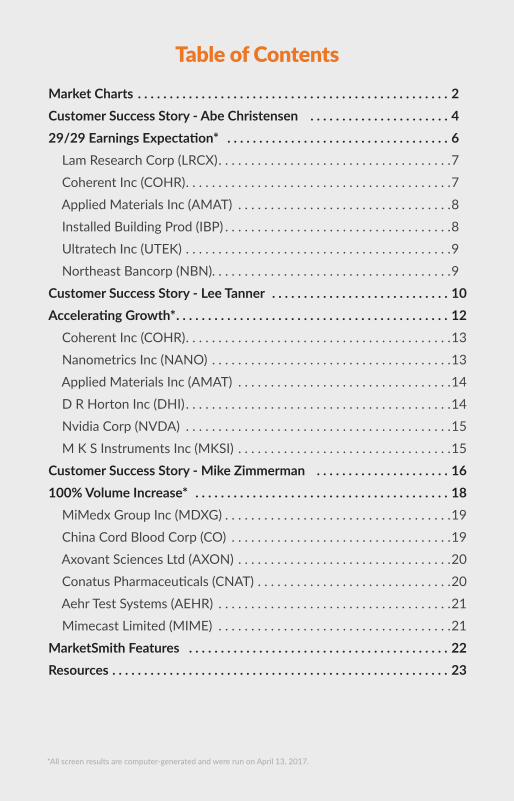
Market Charts . . . . . . . . . . . . . . . . . . . . . . . . . . . . . . . . . . . . . . . . . . . . . . . . . 2Customer Success Story - Abe Christensen . . . . . . . . . . . . . . . . . . . . . . 4 29/29 Earnings Expectation* . . . . . . . . . . . . . . . . . . . . . . . . . . . . . . . . . . . 6 Lam Research Corp (LRCX) . . . . . . . . . . . . . . . . . . . . . . . . . . . . . . . . . . . .7 Coherent Inc (COHR) . . . . . . . . . . . . . . . . . . . . . . . . . . . . . . . . . . . . . . . . .7 Applied Materials Inc (AMAT) . . . . . . . . . . . . . . . . . . . . . . . . . . . . . . . . .8 Installed Building Prod (IBP) . . . . . . . . . . . . . . . . . . . . . . . . . . . . . . . . . . .8 Ultratech Inc (UTEK) . . . . . . . . . . . . . . . . . . . . . . . . . . . . . . . . . . . . . . . . .9 Northeast Bancorp (NBN). . . . . . . . . . . . . . . . . . . . . . . . . . . . . . . . . . . . .9Customer Success Story - Lee Tanner . . . . . . . . . . . . . . . . . . . . . . . . . . . . 10 Accelerating Growth* . . . . . . . . . . . . . . . . . . . . . . . . . . . . . . . . . . . . . . . . . . . 12 Coherent Inc (COHR) . . . . . . . . . . . . . . . . . . . . . . . . . . . . . . . . . . . . . . . . .13 Nanometrics Inc (NANO) . . . . . . . . . . . . . . . . . . . . . . . . . . . . . . . . . . . . .13 Applied Materials Inc (AMAT) . . . . . . . . . . . . . . . . . . . . . . . . . . . . . . . . .14 D R Horton Inc (DHI) . . . . . . . . . . . . . . . . . . . . . . . . . . . . . . . . . . . . . . . . .14 Nvidia Corp (NVDA) . . . . . . . . . . . . . . . . . . . . . . . . . . . . . . . . . . . . . . . . .15 M K S Instruments Inc (MKSI) . . . . . . . . . . . . . . . . . . . . . . . . . . . . . . . . .15Customer Success Story - Mike Zimmerman . . . . . . . . . . . . . . . . . . . . . 16 100% Volume Increase* . . . . . . . . . . . . . . . . . . . . . . . . . . . . . . . . . . . . . . . . 18 MiMedx Group Inc (MDXG) . . . . . . . . . . . . . . . . . . . . . . . . . . . . . . . . . . .19 China Cord Blood Corp (CO) . . . . . . . . . . . . . . . . . . . . . . . . . . . . . . . . . .19 Axovant Sciences Ltd (AXON) . . . . . . . . . . . . . . . . . . . . . . . . . . . . . . . . .20 Conatus Pharmaceuticals (CNAT) . . . . . . . . . . . . . . . . . . . . . . . . . . . . . .20 Aehr Test Systems (AEHR) . . . . . . . . . . . . . . . . . . . . . . . . . . . . . . . . . . . .21 Mimecast Limited (MIME) . . . . . . . . . . . . . . . . . . . . . . . . . . . . . . . . . . . .21MarketSmith Features . . . . . . . . . . . . . . . . . . . . . . . . . . . . . . . . . . . . . . . . . 22Resources . . . . . . . . . . . . . . . . . . . . . . . . . . . . . . . . . . . . . . . . . . . . . . . . . . . . . 23
Table of Contents

4
Marketsmith.com // 2017 Q2 l Success Stories
Abe Christensen is one of the IBD Meetup Leaders from Sausalito, California and has used MarketSmith since it launched in September 2010. Abe has been an avid investor for many years, using IBD and Daily Graphs prior to MarketSmith.
Abe has always looked for new, reliable data points to help him find solid growth stocks. After trying a variety of screening criteria, Abe’s success finding market winners really picked up when he added these parameters:
Always looking to improve his results, Abe was inspired to buy Apple’s powerful breakout in 2004. With a Composite Rating at a paltry 57, Abe created a screen that would capture a stock that didn’t necessarily have a high Composite Rating but still had great potential.
After several screening iterations, Abe developed the 29/29 screen. He uses 29% expected EPS growth for the next quarter and 29% expected growth for the next year. To refine the list a bit, Abe also added 20% increase in revenues for the most recent quarter.
In June, 2016, Mobileye had been struggling for several quarters and
Customer Success Story: ABE CHRISTENSEN
Apple’s Low Composite Rating Inspired This Investor’s Winning Screen
• Composite Rating of 99
• Using MarketSmith’s Pattern Recognition, stocks near a pivot in a first or second stage base
• Relative strength line in new high ground ahead of the price

5
the Composite Rating was lackluster. But it had earnings projections above 29% for the 2nd quarter and for the full year. This earned Mobileye a spot on Abe’s watchlist and when it began to rally up off its lows in March/April, 2016, Abe began looking for a proper buy point.
Following a first stage eight-week double bottom base, Mobileye shot up through its 50 DMA on June 17. Volume was 52% greater than average and the RS line tilted up sharply around the 1 o’clock position. Abe bought his full position that day and the next.
Of course, buying is just half the battle. Knowing when to sell a stock and lock in profits is important for successful investing. Abe used a sell rule found in How to Make Money in Stocks, by William O’Neil, “the first short term correction”. Using MarketSmith Pattern Recognition to support his decision-making, Abe sold Mobileye on July 28 when it achieved a 20% gain.
_________________________________________________________________________________ “As IBD Founder William O’Neil often said,
‘Never stop learning.” – Abe Christensen
*All screen results are computer-generated and were run on April 13, 2017.
6
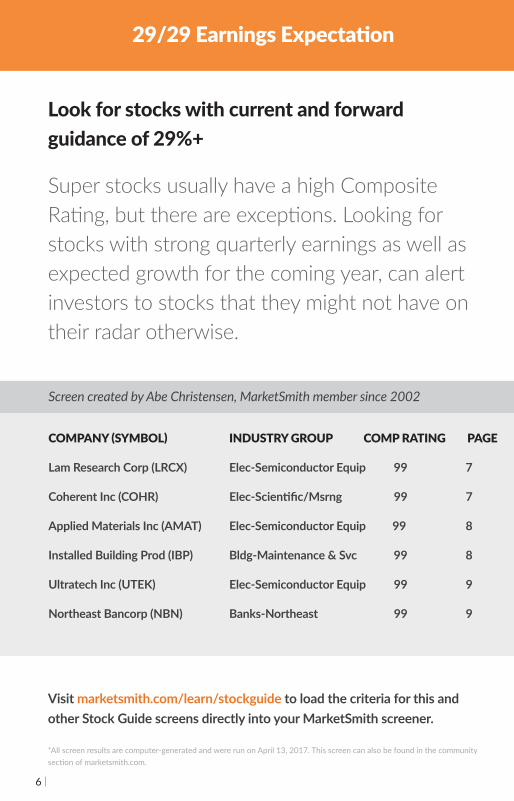
Look for stocks with current and forward guidance of 29%+
Super stocks usually have a high Composite Rati ng, but there are excepti ons. Looking for stocks with strong quarterly earnings as well as expected growth for the coming year, can alert investors to stocks that they might not have on their radar otherwise.
29/29 Earnings Expectati on
COMPANY (SYMBOL) INDUSTRY GROUP COMP RATING PAGE
Lam Research Corp (LRCX) Elec-Semiconductor Equip 99 7
Coherent Inc (COHR) Elec-Scienti fi c/Msrng 99 7
Applied Materials Inc (AMAT) Elec-Semiconductor Equip 99 8
Installed Building Prod (IBP) Bldg-Maintenance & Svc 99 8
Ultratech Inc (UTEK) Elec-Semiconductor Equip 99 9
Northeast Bancorp (NBN) Banks-Northeast 99 9
Visit marketsmith.com/learn/stockguide to load the criteria for this and other Stock Guide screens directly into your MarketSmith screener.
*All screen results are computer-generated and were run on April 13, 2017. This screen can also be found in the community secti on of marketsmith.com.
Screen created by Abe Christensen, MarketSmith member since 2002

7
Marketsmith.com // 2017 Q2 l ScreensLam Research Corp (LRCX)
Coherent Inc (COHR)
* LAM RESEARCH CORP(LRCX) NASDAQ 162.8 SHRS / 161.2 FLT / AVG VOL 1.54MIL $125.17(OH -3%)ELEC-SEMICONDUCTOR EQUIP lamresearch.com
MANUFACTURES ETCH AND CLEANING SYSTEMS USED IN WAFER FABRICATION EQUIPMENT FOR THE SEMICONDUCTOR INDUSTRY.
7/16 EXPECTS Q1 FY17 NON-GAAP EARNINGS OF $1.67 TO $1.87 PER DILUTED SHARE ON REVENUES OF $1.550 BIL TO 1.700 BIL.
SHORT INT 7.6 DAYS -4%OPTIONS ON AM/MSUP/DOWN 1.2EX-DIV 3/6YIELD 1.4%
GROWTH RATE +30%EARNINGS STAB 21EPS RANK 89PE 18 (0.9XS&P)5 YR PE 10 - 25
DEBT 57%NEW CEOTIMELINESS AACC/DIST BSMR RATING A
3.46 X BK VALUEINVENTORY TO. 6.1XR&D 15.5%RET ON EQUITY 20%CASH FLOW $7.77
FUNDS 54%BANKS 2%MGMT 0%ALPHA 0.1BETA 1.45
83.83
93.8095.77
102.44
119.14
130.13
72.00
79.15
88.1389.80
93.69
113.20
92
QTR 2QTR 1
QTR 4
QTR 3
DIVINC
DIVINC
-O
60
70
80
90
100
110
120
130
PRICE SCALE
99COMPOSITE RATING(W)(C)
11$ 5.86 $ 59 3412 2.08 45 3113 2.22 55 3514 4.36 85 4815 4.97 84 6116 6.29 110 6317 9.27 EST +47% ↑18 8.79 EST -5% ↑
EARNINGS (JUN) HI LOUltraClean UCTT 99 77Aehr Test AEHR 99 21BrooksAuto BRKS 97 81Ichor Hldn ICHR 97 80Xcerra Cor XCRA 96 52
GROUP REL STR 99 RS EPS
143117317320623925112814301621952282410271329APRMARFEBJAN 17DECNOVOCTSEPAUGJULJUNMAY
EARNINGS $SALES MIL. $DIVIDEND-PE
1.18 VS 1.40 -16%1314 VS 1393 -6%$0.30 13X -- 10X
1.80 VS 1.50 +20%1546 VS 1481 +4%$0.30 14X -- 12X
1.81 VS 1.82 -1%1632 VS 1600 +2%$0.30 15X -- 13X
2.24 VS 1.57 +43%1882 VS 1425 +32%$0.45 17X -- 15X
EPS DUE*4/20 QUARTER ENDED MAR 31,16 QUARTER ENDED JUN 30,16 QUARTER ENDED SEP 30,16 QUARTER ENDED DEC 31,16
R S LINE VS SP500
VOLUME
900 K
1.9 M
4.5 M
COHERENT INC(COHR) NASDAQ 24.6 SHRS / 24.1 FLT / AVG VOL 389810 $192.79(OH -7%)ELEC-SCIENTIFIC/MSRNG coherent.com
MANUFACTURES LASERS, MEASUREMENT INSTRUMENTS, PRECISION OPTICS, AND OTHER PHOTONICS-RELATED PRODUCTS
3/16 TO ACQUIRE ROFIN-SINAR TECHNOLOGIES INC, FOR $32.50 PER SHARE IN CASH OR ABOUT $942 MIL.
SHORT INT 2 DAYS -36%OPTIONS ON PSUP/DOWN 0.9EX-DIVYIELD
GROWTH RATE +8%EARNINGS STAB 12EPS RANK 92PE 31 (1.5XS&P)5 YR PE 12 - 29
DEBT 0%NEW CEOTIMELINESS AACC/DIST BSMR RATING A
5.20 X BK VALUEINVENTORY TO. 4.6XR&D 9.5%RET ON EQUITY 14%CASH FLOW $5.83
FUNDS 53%BANKS 1%MGMT 1%ALPHA 0.24BETA 1.26
99.82 98.49
112.09 113.83
200.53
208.62
81.0086.32
101.24 100.01
179.60
98
QTR 2QTR 1
QTR 4
QTR 3
-O
-O
-O
-O
-O
-O
-O
-O
-O
60
80
100
120
140
160
180
200
PRICE SCALE
99COMPOSITE RATING
11$ 3.46 $ 65 3812 3.28 59 3913 3.56 74 4814 3.19 76 5415 3.89 69 5216 4.75 139 5617 9.86 EST +108% ↑18 11.37 EST +15% ↑
EARNINGS (SEP) HI LOCognex CGNX 97 98Novanta NOVT 95 92MOCON MOCO 93 83IPGPhoton IPGP 90 90ESCOTech ESE 85 63
GROUP REL STR 92 RS EPS
143117317320623925112814301621952282410271329APRMARFEBJAN 17DECNOVOCTSEPAUGJULJUNMAY
EARNINGS $SALES MIL. $DIVIDEND-PE
1.04 VS 0.94 +11%199.9 VS 203.7 -2%
N/A 23X -- 15X
1.07 VS 0.82 +30%218.8 VS 188.5 +16%
N/A 25X -- 20X
1.65 VS 1.25 +32%248.5 VS 209.6 +19%
N/A 26X -- 22X
2.57 VS 0.99 +160%346.1 VS 190.3 +82%
N/A 29X -- 21X
EPS DUE*4/28 QUARTER ENDED MAR 31,16 QUARTER ENDED JUN 30,16 QUARTER ENDED SEP 30,16 QUARTER ENDED DEC 31,16
R S LINE VS SP500
VOLUME
88 K
300 K
1 M

8
Applied Materials Inc (AMAT)
Installed Building Prod (IBP)
APPLIED MATERIALS INC(AMAT) NASDAQ 1,079.8 SHRS / 1,069.0 FLT / AVG VOL 9.17MIL $37.52(OH -5%)ELEC-SEMICONDUCTOR EQUIP appliedmaterials.com
MANUFACTURES DEPOSITION, INSPECTION AND ETCHING AND CLEANINGEQUIPMENT USED IN IC AND FLAT PANEL DISPLAY FABRICATION.
3/17 NAMED THOMAS J. IANNOTTI CHRMN, EFFECTIVE IMMEDIATELY, REPLACING WILLEM P. ROELANDTS WHO RETIRED.
SHORT INT 1.5 DAYS -6%OPTIONS ON AM/MSUP/DOWN 1.5EX-DIV 5/23YIELD 1.1%
GROWTH RATE +19%EARNINGS STAB 30EPS RANK 97PE 17 (0.9XS&P)5 YR PE 10 - 40
DEBT 44%NEW CEOTIMELINESS AACC/DIST BSMR RATING A
5.61 X BK VALUEINVENTORY TO. 5.6XR&D 14.2%RET ON EQUITY 26%CASH FLOW $2.17
FUNDS 42%BANKS 2%MGMT 0%ALPHA 0.16BETA 1.46
24.65
31.07
39.8139.81
19.46
22.17
28.5327.56
31.66
93
QTR 2QTR 1
QTR 4
QTR 3
-O
-O
-O
-O
-O
15
20
25
30
35
40
PRICE SCALE
99COMPOSITE RATING
11$ 1.30 $ 16 912 0.75 13 913 0.59 18 1114 1.07 25 1615 1.19 25 1416 1.75 33 1517 2.66 EST +52% ↑18 2.85 EST +7% ↑
EARNINGS (OCT) HI LOUltraClean UCTT 99 77Aehr Test AEHR 99 21BrooksAuto BRKS 97 81Ichor Hldn ICHR 97 80Xcerra Cor XCRA 96 52
GROUP REL STR 99 RS EPS
143117317320623925112814301621952282410271329APRMARFEBJAN 17DECNOVOCTSEPAUGJULJUNMAY
EARNINGS $SALES MIL. $DIVIDEND-PE
0.34 VS 0.29 +17%2450 VS 2442 0%$0.10 19X -- 13X
0.50 VS 0.33 +52%2821 VS 2490 +13%$0.10 22X -- 16X
0.66 VS 0.29 +128%3297 VS 2368 +39%$0.10 23X -- 20X
0.67 VS 0.26 +158%3278 VS 2257 +45%$0.10 22X -- 17X
EPS DUE 5/19 QUARTER ENDED APR 30,16 QUARTER ENDED JUL 31,16 QUARTER ENDED OCT 31,16 QUARTER ENDED JAN 31,17
R S LINE VS SP500
VOLUME
5 M
12 M
25 M
* INSTALLED BUILDING PROD(IBP) NYSE 31.8 SHRS / 27.0 FLT / AVG VOL 155040 $50.60(OH -4%)BLDG-MAINTENANCE & SVC installedbuildingproducts.com
PROVIDES NEW RESIDENTIAL INSULATION INSTALLATION SERVICES WITH OVER 100 LOCATIONS SERVING CUSTOMERS IN 48 STATES.
3/17 TO ACQUIRE CUSTOM GLASS ATLANTA INC, ATLANTA COMMERCIAL GLAZING, AND 5 BRANCHES THROUGHOUT THE SOUTHEASTERN U.S..
SHORT INT 3.8 DAYS -14%OPTIONS ONUP/DOWN 2.1EX-DIVYIELD
GROWTH RATE +88%EARNINGS STAB 10EPS RANK 98PE 38 (1.8XS&P)5 YR PE 22 - 70
DEBT 93%NEW CEOTIMELINESS AACC/DIST ASMR RATING A
10.44 X BK VALUEINVENTORY TO. 24.8XR&D N/ARET ON EQUITY 32%CASH FLOW $2.13
FUNDS 37%BANKS 0%MGMT 1%ALPHA 0.19BETA 1.51
35.59
38.9737.44
36.65
44.3043.30
53.00
26.00
32.91
30.16 30.75
39.95 40.00
95
QTR 2QTR 1
QTR 4
QTR 3
20
30
40
50
PRICE SCALE
99COMPOSITE RATING$11.00IPO 2/13/14
11$ -0.24 $12 -0.14∆13 0.2514 0.54 18 1015 0.93 29 1616 1.38 44 1717 2.22 EST +61% ↑18 2.71 EST +22% ↑
EARNINGS (DEC) HI LOMYRGrp MYRG 93 82Rollins ROL 85 84ABMIndust ABM 76 54IES IESC 74 80Servicemst SERV 64 94
GROUP REL STR 87 RS EPS
143117317320623925112814301621952282410271329APRMARFEBJAN 17DECNOVOCTSEPAUGJULJUNMAY
EARNINGS $SALES MIL. $DIVIDEND-PE
0.21 VS 0.05 +320%191.7 VS 130.0 +48%
N/A 31X -- 22X
0.34 VS 0.23 +48%211.9 VS 159.7 +33%
N/A 33X -- 26X
0.38 VS 0.32 +19%225.4 VS 181.6 +24%
N/A 35X -- 25X
0.44 VS 0.34 +29%234.0 VS 191.5 +22%
N/A 35X -- 24X
EPS DUE*5/5 QUARTER ENDED MAR 31,16 QUARTER ENDED JUN 30,16 QUARTER ENDED SEP 30,16 QUARTER ENDED DEC 31,16
R S LINE VS SP500 VOLUME
64 K
134 K
300 K
9
Marketsmith.com // 2017 Q2 l ScreensUltratech Inc (UTEK)
Northeast Bancorp (NBN)
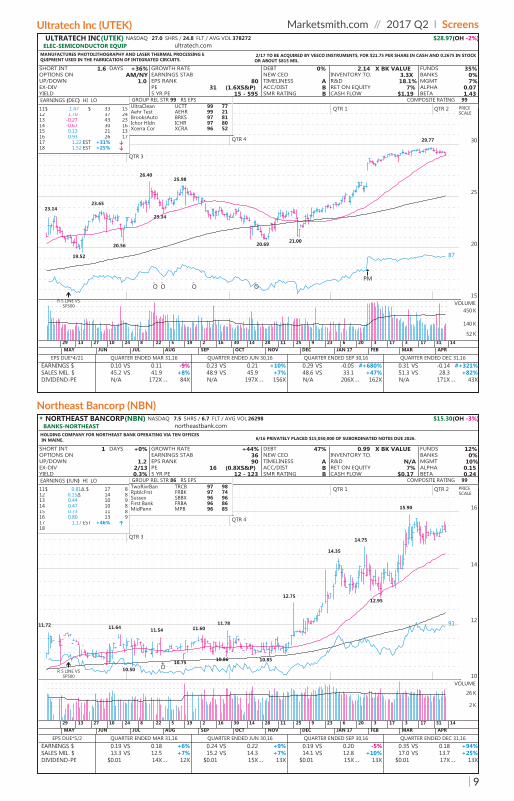
ULTRATECH INC(UTEK) NASDAQ 27.0 SHRS / 24.8 FLT / AVG VOL 378272 $28.97(OH -2%)ELEC-SEMICONDUCTOR EQUIP ultratech.com
MANUFACTURES PHOTOLITHOGRAPHY AND LASER THERMAL PROCESSING EQUIPMENT USED IN THE FABRICATION OF INTEGRATED CIRCUITS.
2/17 TO BE ACQUIRED BY VEECO INSTRUMENTS, FOR $21.75 PER SHARE IN CASH AND 0.2675 IN STOCK OR ABOUT $815 MIL.
SHORT INT 1.6 DAYS +36%OPTIONS ON AM/NYUP/DOWN 1.0EX-DIVYIELD
GROWTH RATEEARNINGS STABEPS RANK 80PE 31 (1.6XS&P)5 YR PE 15 - 595
DEBT 0%NEW CEOTIMELINESS AACC/DIST BSMR RATING B
2.14 X BK VALUEINVENTORY TO. 3.3XR&D 18.1%RET ON EQUITY 7%CASH FLOW $1.19
FUNDS 35%BANKS 0%MGMT 7%ALPHA 0.07BETA 1.43
23.1423.65
26.4025.98
29.77
19.52
20.56
23.34
20.6921.00
87
QTR 2QTR 1
QTR 4
QTR 3
PM-O
-O
-O
-O
15
20
25
30
PRICE SCALE
99COMPOSITE RATING
11$ 1.47 $ 33 1512 1.70 37 2413 -0.27 43 2314 -0.67 30 1615 0.13 21 1316 0.93 26 1717 1.22 EST +31% ↓18 1.52 EST +25% ↓
EARNINGS (DEC) HI LOUltraClean UCTT 99 77Aehr Test AEHR 99 21BrooksAuto BRKS 97 81Ichor Hldn ICHR 97 80Xcerra Cor XCRA 96 52
GROUP REL STR 99 RS EPS
143117317320623925112814301621952282410271329APRMARFEBJAN 17DECNOVOCTSEPAUGJULJUNMAY
EARNINGS $SALES MIL. $DIVIDEND-PE
0.10 VS 0.11 -9%45.2 VS 41.9 +8%N/A 172X -- 84X
0.23 VS 0.21 +10%48.9 VS 45.9 +7%N/A 197X -- 156X
0.29 VS -0.05 #+680%48.6 VS 33.1 +47%N/A 206X -- 162X
0.31 VS -0.14 #+321%51.3 VS 28.3 +82%N/A 171X -- 43X
EPS DUE*4/21 QUARTER ENDED MAR 31,16 QUARTER ENDED JUN 30,16 QUARTER ENDED SEP 30,16 QUARTER ENDED DEC 31,16
R S LINE VS SP500 VOLUME
52 K
140 K
450 K
* NORTHEAST BANCORP(NBN) NASDAQ 7.5 SHRS / 6.7 FLT / AVG VOL 26298 $15.30(OH -3%)BANKS-NORTHEAST northeastbank.com
HOLDING COMPANY FOR NORTHEAST BANK OPERATING VIA TEN OFFICESIN MAINE. 6/16 PRIVATELY PLACED $15,050,000 OF SUBORDINATED NOTES DUE 2026.
SHORT INT 1 DAYS +0%OPTIONS ONUP/DOWN 1.2EX-DIV 2/13YIELD 0.3%
GROWTH RATE +44%EARNINGS STAB 36EPS RANK 90PE 16 (0.8XS&P)5 YR PE 12 - 123
DEBT 47%NEW CEOTIMELINESS AACC/DIST BSMR RATING B
0.99 X BK VALUEINVENTORY TO.R&D N/ARET ON EQUITY 7%CASH FLOW $0.17
FUNDS 12%BANKS 0%MGMT 10%ALPHA 0.15BETA 0.24
11.72 11.64 11.54 11.6011.78
12.75
14.35
14.75
15.90
10.5010.75 10.86 10.85
12.95
91
QTR 2QTR 1
QTR 4
QTR 3
+O
10
12
14
16
PRICE SCALE
99COMPOSITE RATING
11$ 0.81∆ $ 17 812 0.15∆ 14 813 0.44 10 914 0.47 10 815 0.73 11 816 0.80 13 917 1.17 EST +46% ↑18
EARNINGS (JUN) HI LOTwoRivrBan TRCB 97 98RpblcFrst FRBK 97 74Sussex SBBX 96 96First Bank FRBA 96 86MidPenn MPB 96 85
GROUP REL STR 86 RS EPS
143117317320623925112814301621952282410271329APRMARFEBJAN 17DECNOVOCTSEPAUGJULJUNMAY
EARNINGS $SALES MIL. $DIVIDEND-PE
0.19 VS 0.18 +6%13.3 VS 12.5 +7%
$0.01 14X -- 12X
0.24 VS 0.22 +9%15.2 VS 14.3 +7%
$0.01 15X -- 13X
0.19 VS 0.20 -5%14.1 VS 12.8 +10%
$0.01 15X -- 13X
0.35 VS 0.18 +94%17.0 VS 13.7 +25%
$0.01 17X -- 13X
EPS DUE*5/2 QUARTER ENDED MAR 31,16 QUARTER ENDED JUN 30,16 QUARTER ENDED SEP 30,16 QUARTER ENDED DEC 31,16
R S LINE VS SP500
VOLUME
2 K
26 K

10
Marketsmith.com // 2017 Q2 l Success Stories
Lee Tanner became interested in stock investing in 1985. His father had been a big fan of IBD Founder William O’Neil and Lee soon became an IBD and Daily Graphs subscriber. Lee heads up the Petaluma, California IBD Meetup group.
Lee began using MarketSmith when it launched in September 2010. It was through the MarketSmith forum that Lee met Abe Christensen from the Saulsalito IBD Meetup and the two friends have been exchanging investing tips ever since. Since the two Meetup groups are within 30 miles of each other, Abe is also a regular contributor to Lee’s group.
In fact, Lee has been using Abe’s 29/29 stock screen on a regular basis to find high growth stocks. It was at the end of March 2016 that Lee first noticed Weibo on the 29/29 screen.
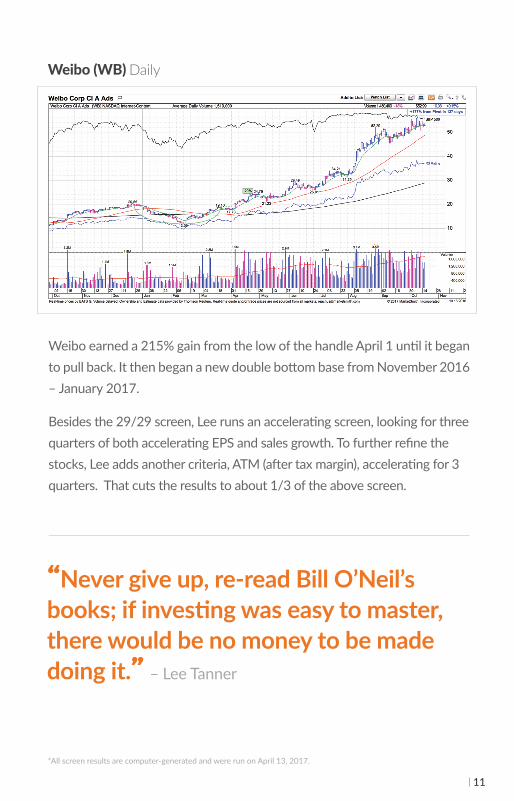
The stock was forming a cup-shaped base. It was a bit deep at 41%, but this was due to a market correction. Lee bought the stock early based on quiet trading in the low of the handle April 1. He based the buy rule from The Successful Investor by William O’Neil, which states that “professional money managers get in even earlier around the bottom pullback point of the handle when volume has subsided substantially.”
Weibo’s fundamental data was very strong, and the RS line had been moving into new high ground. In addition, there were two weekly spikes in volume showing professional buying the weeks of March 4 and March 11. Lee had been anxious to own this stock and made note of the quarterly triple-digit earnings and high double digit sales numbers.
Curious About Weibo, This Investor Knew to Wait for the Proper Base
Customer Success Story: LEE TANNER
11
Weibo earned a 215% gain from the low of the handle April 1 until it began to pull back. It then began a new double bottom base from November 2016 – January 2017.
Besides the 29/29 screen, Lee runs an accelerating screen, looking for three quarters of both accelerating EPS and sales growth. To further refine the stocks, Lee adds another criteria, ATM (after tax margin), accelerating for 3 quarters. That cuts the results to about 1/3 of the above screen.
_________________________________________________________________________________
“Never give up, re-read Bill O’Neil’s books; if investing was easy to master, there would be no money to be made doing it.” – Lee Tanner
*All screen results are computer-generated and were run on April 13, 2017.
Daily

12
Find stocks experiencing growth in revenue and earnings
Historically, some of the market’s leading stocks will show not only a strong EPS growth rate, but an accelerati on in both earnings and sales. In Bill O’Neil’s book, How to Make Money in Stocks, he writes “take parti cular note if the growth of both sales and earnings has accelerated for the last three quarters.”
Accelerati ng Growth
COMPANY (SYMBOL) INDUSTRY GROUP COMP RATING PAGE
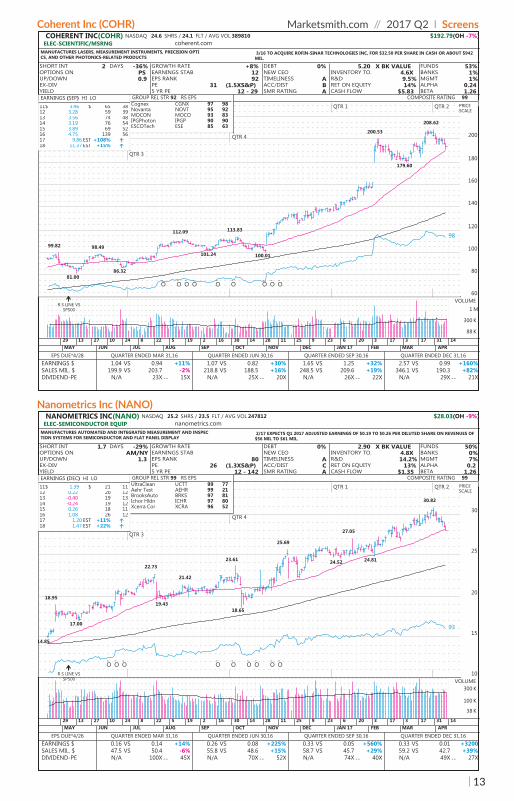
Coherent Inc (COHR) Elec-Scienti fi c/Msrng 99 13
Nanometrics Inc (NANO) Elec-Semiconductor Equip 99 13
Applied Materials Inc (AMAT) Elec-Semiconductor Equip 99 14
D R Horton Inc (DHI) Bldg-Resident/Comml 99 14
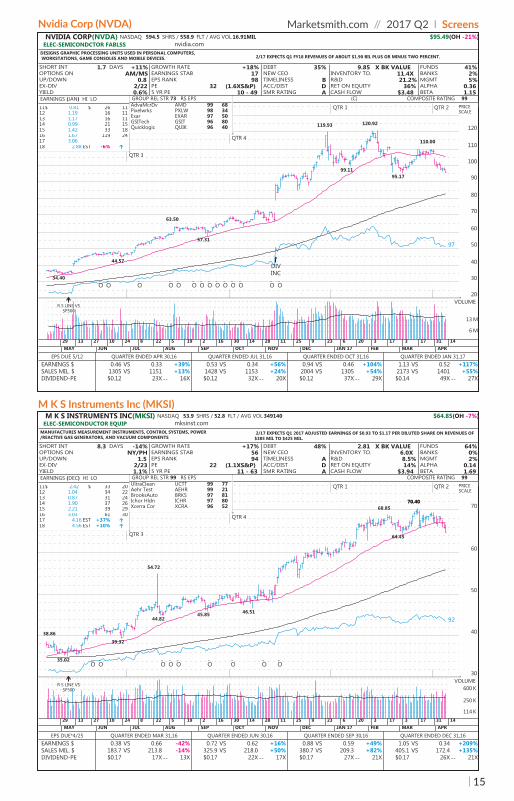
Nvidia Corp (NVDA) Elec-Semicondctor Fablss 99 15
M K S Instruments Inc (MKSI) Elec-Semiconductor Equip 99 15
Visit marketsmith.com/learn/stockguide to load the criteria for this and other Stock Guide screens directly into your MarketSmith screener.
*All screen results are computer-generated and were run on April 13, 2017. This screen can also be found in the community secti on of marketsmith.com.
Screen created by Lee Tanner, MarketSmith member since 2001
13
Marketsmith.com // 2017 Q2 l ScreensCoherent Inc (COHR)
Nanometrics Inc (NANO)
COHERENT INC(COHR) NASDAQ 24.6 SHRS / 24.1 FLT / AVG VOL 389810 $192.79(OH -7%)ELEC-SCIENTIFIC/MSRNG coherent.com
MANUFACTURES LASERS, MEASUREMENT INSTRUMENTS, PRECISION OPTICS, AND OTHER PHOTONICS-RELATED PRODUCTS
3/16 TO ACQUIRE ROFIN-SINAR TECHNOLOGIES INC, FOR $32.50 PER SHARE IN CASH OR ABOUT $942 MIL.
SHORT INT 2 DAYS -36%OPTIONS ON PSUP/DOWN 0.9EX-DIVYIELD
GROWTH RATE +8%EARNINGS STAB 12EPS RANK 92PE 31 (1.5XS&P)5 YR PE 12 - 29
DEBT 0%NEW CEOTIMELINESS AACC/DIST BSMR RATING A
5.20 X BK VALUEINVENTORY TO. 4.6XR&D 9.5%RET ON EQUITY 14%CASH FLOW $5.83
FUNDS 53%BANKS 1%MGMT 1%ALPHA 0.24BETA 1.26
99.82 98.49
112.09 113.83
200.53
208.62
81.0086.32
101.24 100.01
179.60
98
QTR 2QTR 1
QTR 4
QTR 3
-O
-O
-O
-O
-O
-O
-O
-O
-O
60
80
100
120
140
160
180
200
PRICE SCALE
99COMPOSITE RATING
11$ 3.46 $ 65 3812 3.28 59 3913 3.56 74 4814 3.19 76 5415 3.89 69 5216 4.75 139 5617 9.86 EST +108% ↑18 11.37 EST +15% ↑
EARNINGS (SEP) HI LOCognex CGNX 97 98Novanta NOVT 95 92MOCON MOCO 93 83IPGPhoton IPGP 90 90ESCOTech ESE 85 63
GROUP REL STR 92 RS EPS
143117317320623925112814301621952282410271329APRMARFEBJAN 17DECNOVOCTSEPAUGJULJUNMAY
EARNINGS $SALES MIL. $DIVIDEND-PE
1.04 VS 0.94 +11%199.9 VS 203.7 -2%
N/A 23X -- 15X
1.07 VS 0.82 +30%218.8 VS 188.5 +16%
N/A 25X -- 20X
1.65 VS 1.25 +32%248.5 VS 209.6 +19%
N/A 26X -- 22X
2.57 VS 0.99 +160%346.1 VS 190.3 +82%
N/A 29X -- 21X
EPS DUE*4/28 QUARTER ENDED MAR 31,16 QUARTER ENDED JUN 30,16 QUARTER ENDED SEP 30,16 QUARTER ENDED DEC 31,16
R S LINE VS SP500
VOLUME
88 K
300 K
1 M
NANOMETRICS INC(NANO) NASDAQ 25.2 SHRS / 23.5 FLT / AVG VOL 247812 $28.03(OH -9%)ELEC-SEMICONDUCTOR EQUIP nanometrics.com
MANUFACTURES AUTOMATED AND INTEGRATED MEASUREMENT AND INSPECTION SYSTEMS FOR SEMICONDUCTOR AND FLAT PANEL DISPLAY
2/17 EXPECTS Q1 2017 ADJUSTED EARNINGS OF $0.19 TO $0.26 PER DILUTED SHARE ON REVENUES OF $56 MIL TO $61 MIL.
SHORT INT 1.7 DAYS -29%OPTIONS ON AM/NYUP/DOWN 1.3EX-DIVYIELD
GROWTH RATEEARNINGS STABEPS RANK 80PE 26 (1.3XS&P)5 YR PE 12 - 142
DEBT 0%NEW CEOTIMELINESS AACC/DIST CSMR RATING A
2.90 X BK VALUEINVENTORY TO. 4.8XR&D 14.2%RET ON EQUITY 13%CASH FLOW $1.35
FUNDS 50%BANKS 0%MGMT 7%ALPHA 0.2BETA 1.26
18.95
22.73
21.42
23.61
25.69
27.05
30.82
14.85
17.00
19.4318.65
24.52 24.81
93
QTR 2QTR 1
QTR 4
QTR 3
-O
-O
-O
-O
-O
-O
-O
-O
-O
10
15
20
25
30
PRICE SCALE
99COMPOSITE RATING
11$ 1.39 $ 21 1112 0.22 20 1213 -0.40 19 1314 -0.24 19 1215 0.26 18 1116 1.08 26 1217 1.20 EST +11% ↑18 1.47 EST +22% ↑
EARNINGS (DEC) HI LOUltraClean UCTT 99 77Aehr Test AEHR 99 21BrooksAuto BRKS 97 81Ichor Hldn ICHR 97 80Xcerra Cor XCRA 96 52
GROUP REL STR 99 RS EPS
143117317320623925112814301621952282410271329APRMARFEBJAN 17DECNOVOCTSEPAUGJULJUNMAY
EARNINGS $SALES MIL. $DIVIDEND-PE
0.16 VS 0.14 +14%47.5 VS 50.4 -6%N/A 100X -- 45X
0.26 VS 0.08 +225%55.8 VS 48.6 +15%N/A 70X -- 52X
0.33 VS 0.05 +560%58.7 VS 45.7 +29%N/A 74X -- 40X
0.33 VS 0.01 +320059.2 VS 42.7 +39%N/A 49X -- 27X
EPS DUE*4/26 QUARTER ENDED MAR 31,16 QUARTER ENDED JUN 30,16 QUARTER ENDED SEP 30,16 QUARTER ENDED DEC 31,16
R S LINE VS SP500 VOLUME
38 K
100 K
300 K

14
Applied Materials Inc (AMAT)
D R Horton Inc (DHI)
APPLIED MATERIALS INC(AMAT) NASDAQ 1,079.8 SHRS / 1,069.0 FLT / AVG VOL 9.17MIL $37.52(OH -5%)ELEC-SEMICONDUCTOR EQUIP appliedmaterials.com
MANUFACTURES DEPOSITION, INSPECTION AND ETCHING AND CLEANINGEQUIPMENT USED IN IC AND FLAT PANEL DISPLAY FABRICATION.
3/17 NAMED THOMAS J. IANNOTTI CHRMN, EFFECTIVE IMMEDIATELY, REPLACING WILLEM P. ROELANDTS WHO RETIRED.
SHORT INT 1.5 DAYS -6%OPTIONS ON AM/MSUP/DOWN 1.5EX-DIV 5/23YIELD 1.1%
GROWTH RATE +19%EARNINGS STAB 30EPS RANK 97PE 17 (0.9XS&P)5 YR PE 10 - 40
DEBT 44%NEW CEOTIMELINESS AACC/DIST BSMR RATING A
5.61 X BK VALUEINVENTORY TO. 5.6XR&D 14.2%RET ON EQUITY 26%CASH FLOW $2.17
FUNDS 42%BANKS 2%MGMT 0%ALPHA 0.16BETA 1.46
24.65
31.07
39.8139.81
19.46
22.17
28.5327.56
31.66
93
QTR 2QTR 1
QTR 4
QTR 3
-O
-O
-O
-O
-O
15
20
25
30
35
40
PRICE SCALE
99COMPOSITE RATING
11$ 1.30 $ 16 912 0.75 13 913 0.59 18 1114 1.07 25 1615 1.19 25 1416 1.75 33 1517 2.66 EST +52% ↑18 2.85 EST +7% ↑
EARNINGS (OCT) HI LOUltraClean UCTT 99 77Aehr Test AEHR 99 21BrooksAuto BRKS 97 81Ichor Hldn ICHR 97 80Xcerra Cor XCRA 96 52
GROUP REL STR 99 RS EPS
143117317320623925112814301621952282410271329APRMARFEBJAN 17DECNOVOCTSEPAUGJULJUNMAY
EARNINGS $SALES MIL. $DIVIDEND-PE
0.34 VS 0.29 +17%2450 VS 2442 0%$0.10 19X -- 13X
0.50 VS 0.33 +52%2821 VS 2490 +13%$0.10 22X -- 16X
0.66 VS 0.29 +128%3297 VS 2368 +39%$0.10 23X -- 20X
0.67 VS 0.26 +158%3278 VS 2257 +45%$0.10 22X -- 17X
EPS DUE 5/19 QUARTER ENDED APR 30,16 QUARTER ENDED JUL 31,16 QUARTER ENDED OCT 31,16 QUARTER ENDED JAN 31,17
R S LINE VS SP500
VOLUME
5 M
12 M
25 M
* D R HORTON INC(DHI) NYSE 373.4 SHRS / 343.5 FLT / AVG VOL 3.81MIL $33.69(OH -2%)BLDG-RESIDENT/COMML drhorton.com
BUILDS SINGLE-FAMILY DETACHED HOMES FOR FIRST-TIME AND MOVE-UP HOME BUYERS IN 26 STATES AND 78 U.S. METROPOLITAN MARKETS 1/17 REAFFIRMED FY17 REVENUES GUIDANCE OF $13.4 BIL TO $13.8 BIL.
SHORT INT 2.5 DAYS -8%OPTIONS ON AM/MSUP/DOWN 1.2EX-DIV 2/1YIELD 1.2%
GROWTH RATE +46%EARNINGS STAB 31EPS RANK 96PE 13 (0.7XS&P)5 YR PE 11 - 78
DEBT 48%NEW CEOTIMELINESS BACC/DIST BSMR RATING B
1.85 X BK VALUEINVENTORY TO. 1.5XR&D N/ARET ON EQUITY 14%CASH FLOW $2.55
FUNDS 40%BANKS 1%MGMT 7%ALPHA -0.03BETA 1.3
32.5132.10
34.56
33.26
29.69
31.90
34.0634.06
28.8229.14
26.6927.15 27.21 74
QTR 2QTR 1
QTR 4
QTR 3
DIVINC
-O
-O
-O
24
26
28
30
32
34
36
38
PRICE SCALE
99COMPOSITE RATING(C)
11$ 0.04∆ $ 13 812 0.67∆ 22 1213 1.33 27 1714 1.50 25 1915 1.98∆ 33 2216 2.36∆ 34 2217 2.74 EST +16% ↑18 2.99 EST +9% ↑
EARNINGS (SEP) HI LOCenturyCom CCS 91 97KBHome KBH 89 73Nvr NVR 88 91TaylorMori TMHC 87 94PulteGrp PHM 87 93
GROUP REL STR 96 RS EPS
143117317320623925112814301621952282410271329APRMARFEBJAN 17DECNOVOCTSEPAUGJULJUNMAY
EARNINGS $SALES MIL. $DIVIDEND-PE
0.52 VS 0.40 +30%2767 VS 2795 -1%$0.08 16X -- 11X
0.66 VS 0.60 +10%3231 VS 2950 +10%$0.08 16X -- 13X
0.75∆ VS 0.60∆ +25%3741 VS 3172 +18%$0.08 16X -- 13X
0.55 VS 0.42 +31%2904 VS 2416 +20%$0.10 14X -- 11X
EPS DUE*4/21 QUARTER ENDED MAR 31,16 QUARTER ENDED JUN 30,16 QUARTER ENDED SEP 30,16 QUARTER ENDED DEC 31,16
R S LINE VS SP500
VOLUME
1.3 M
3 M
6.5 M
15
Marketsmith.com // 2017 Q2 l ScreensNvidia Corp (NVDA)
M K S Instruments Inc (MKSI)
NVIDIA CORP(NVDA) NASDAQ 594.5 SHRS / 558.9 FLT / AVG VOL 16.91MIL $95.49(OH -21%)ELEC-SEMICONDCTOR FABLSS nvidia.com
DESIGNS GRAPHIC PROCESSING UNITS USED IN PERSONAL COMPUTERS,WORKSTATIONS, GAME CONSOLES AND MOBILE DEVICES. 2/17 EXPECTS Q1 FY18 REVENUES OF ABOUT $1.90 BIL PLUS OR MINUS TWO PERCENT.
SHORT INT 1.7 DAYS +11%OPTIONS ON AM/MSUP/DOWN 0.8EX-DIV 2/22YIELD 0.6%
GROWTH RATE +18%EARNINGS STAB 17EPS RANK 98PE 32 (1.6XS&P)5 YR PE 10 - 49
DEBT 35%NEW CEOTIMELINESS BACC/DIST DSMR RATING A
9.85 X BK VALUEINVENTORY TO. 11.4XR&D 21.2%RET ON EQUITY 36%CASH FLOW $3.48
FUNDS 41%BANKS 2%MGMT 5%ALPHA 0.36BETA 1.15
63.50
119.93 120.92
110.00
34.40
44.57
57.31
99.1195.17
97
QTR 2QTR 1
QTR 4
QTR 3
-O
-O
DIVINC
-O
-O
-O
-O
-O
-O
-O
-O
-O
-O
-O
-O
20
30
40
50
60
70
80
90
100
110
120
PRICE SCALE
99COMPOSITE RATING(C)
11$ 0.81 $ 26 1112 1.19 16 1113 1.17 16 1114 0.99 21 1515 1.42 33 1816 1.67 119 2417 3.0618 2.88 EST -6% ↑
EARNINGS (JAN) HI LOAdvaMcrDv AMD 99 68Pixelwrks PXLW 98 34Exar EXAR 97 50GSITech GSIT 96 80Quicklogic QUIK 96 40
GROUP REL STR 73 RS EPS
143117317320623925112814301621952282410271329APRMARFEBJAN 17DECNOVOCTSEPAUGJULJUNMAY
EARNINGS $SALES MIL. $DIVIDEND-PE
0.46 VS 0.33 +39%1305 VS 1151 +13%$0.12 23X -- 16X
0.53 VS 0.34 +56%1428 VS 1153 +24%$0.12 32X -- 20X
0.94 VS 0.46 +104%2004 VS 1305 +54%$0.12 37X -- 29X
1.13 VS 0.52 +117%2173 VS 1401 +55%$0.14 49X -- 27X
EPS DUE 5/12 QUARTER ENDED APR 30,16 QUARTER ENDED JUL 31,16 QUARTER ENDED OCT 31,16 QUARTER ENDED JAN 31,17
R S LINE VS SP500
VOLUME
6 M
13 M
M K S INSTRUMENTS INC(MKSI) NASDAQ 53.9 SHRS / 52.8 FLT / AVG VOL 349140 $64.85(OH -7%)ELEC-SEMICONDUCTOR EQUIP mksinst.com
MANUFACTURES MEASUREMENT INSTRUMENTS, CONTROL SYSTEMS, POWER/REACTIVE GAS GENERATORS, AND VACUUM COMPONENTS
2/17 EXPECTS Q1 2017 ADJUSTED EARNINGS OF $0.93 TO $1.17 PER DILUTED SHARE ON REVENUES OF $385 MIL TO $425 MIL.
SHORT INT 8.3 DAYS -14%OPTIONS ON NY/PHUP/DOWN 1.5EX-DIV 2/23YIELD 1.1%
GROWTH RATE +17%EARNINGS STAB 56EPS RANK 94PE 22 (1.1XS&P)5 YR PE 11 - 63
DEBT 48%NEW CEOTIMELINESS AACC/DIST DSMR RATING A
2.81 X BK VALUEINVENTORY TO. 6.0XR&D 8.5%RET ON EQUITY 14%CASH FLOW $3.94
FUNDS 64%BANKS 0%MGMT 2%ALPHA 0.14BETA 1.69
38.86
54.72
68.8570.4070.40
35.02
39.32
44.8245.85 46.51
64.45
92
QTR 2QTR 1
QTR 4
QTR 3
-O
-O
-O
-O
-O
-O
-O
-O
-O
30
40
50
60
70
PRICE SCALE
99COMPOSITE RATING
11$ 2.42 $ 33 2012 1.04 34 2213 0.87 31 2414 1.90 37 2615 2.21 39 2916 3.03 61 3017 4.16 EST +37% ↑18 4.56 EST +10% ↑
EARNINGS (DEC) HI LOUltraClean UCTT 99 77Aehr Test AEHR 99 21BrooksAuto BRKS 97 81Ichor Hldn ICHR 97 80Xcerra Cor XCRA 96 52
GROUP REL STR 99 RS EPS
143117317320623925112814301621952282410271329APRMARFEBJAN 17DECNOVOCTSEPAUGJULJUNMAY
EARNINGS $SALES MIL. $DIVIDEND-PE
0.38 VS 0.66 -42%183.7 VS 213.8 -14%$0.17 17X -- 13X
0.72 VS 0.62 +16%325.9 VS 218.0 +50%$0.17 22X -- 17X
0.88 VS 0.59 +49%380.7 VS 209.3 +82%$0.17 27X -- 21X
1.05 VS 0.34 +209%405.1 VS 172.4 +135%$0.17 26X -- 21X
EPS DUE*4/25 QUARTER ENDED MAR 31,16 QUARTER ENDED JUN 30,16 QUARTER ENDED SEP 30,16 QUARTER ENDED DEC 31,16
R S LINE VS SP500
VOLUME
114 K
250 K
600 K
16
Marketsmith.com // 2017 Q2 l Success Stories
An active investor, Mike Zimmerman leads the IBD Meetup in St. Louis Missouri and began using MarketSmith in September 2010. Mike likes using MarketSmith’s Pattern Recognition as it makes it easy to identify big breakouts or secondary buy points.
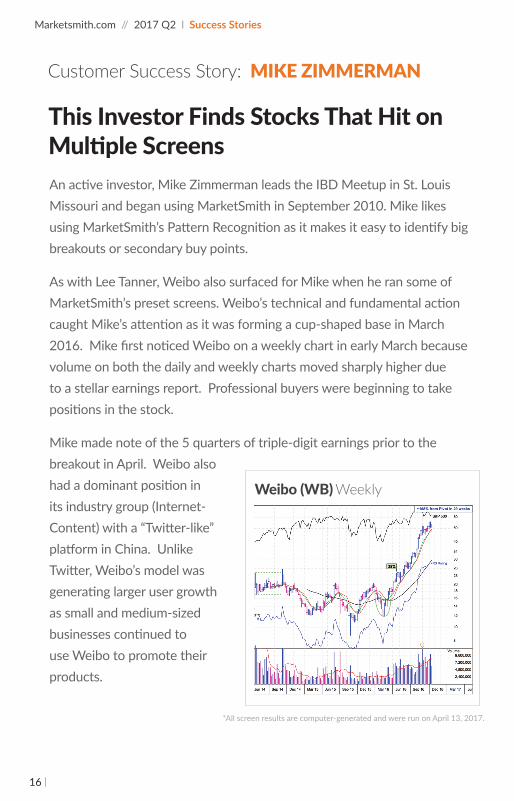
As with Lee Tanner, Weibo also surfaced for Mike when he ran some of MarketSmith’s preset screens. Weibo’s technical and fundamental action caught Mike’s attention as it was forming a cup-shaped base in March 2016. Mike first noticed Weibo on a weekly chart in early March because volume on both the daily and weekly charts moved sharply higher due to a stellar earnings report. Professional buyers were beginning to take positions in the stock.
Mike made note of the 5 quarters of triple-digit earnings prior to the breakout in April. Weibo also had a dominant position in its industry group (Internet-Content) with a “Twitter-like” platform in China. Unlike Twitter, Weibo’s model was generating larger user growth as small and medium-sized businesses continued to use Weibo to promote their products.
This Investor Finds Stocks That Hit on Multiple Screens
*All screen results are computer-generated and were run on April 13, 2017.
Customer Success Story: MIKE ZIMMERMAN
17
“I’m always looking for strength, and I tweak the parameters slightly on a daily basis with some of the screens based on how the market is acting.” – Mike Zimmerman
*All screen results are computer-generated and were run on April 13, 2017.
Unfortunately, Mike learned an important lesson when he forgot to set an alert and missed the actual breakout. It was still in the buy range so he bought it the next day and held the position until it broke the 10-week moving average in late October 2016. He sold half his position at that point, and waited to see if Weibo would hold the 40-week line.
______________________________________________________________________________
18
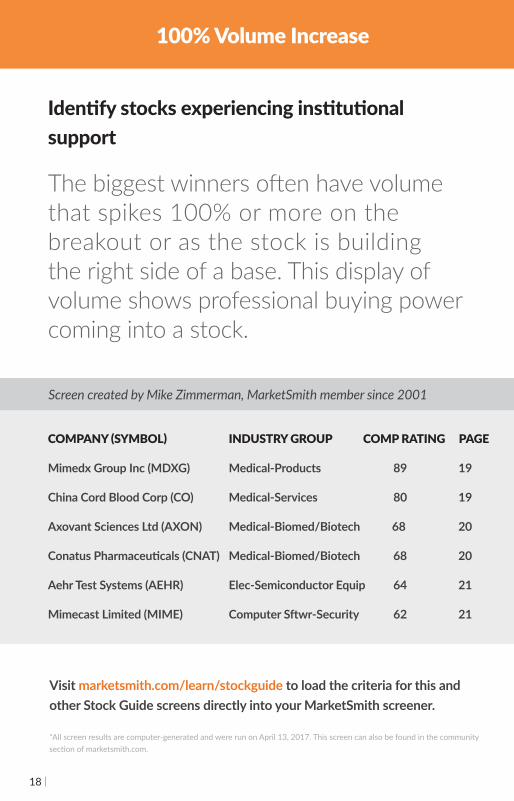
Identi fy stocks experiencing insti tuti onal support
The biggest winners oft en have volume that spikes 100% or more on the breakout or as the stock is building the right side of a base. This display of volume shows professional buying power coming into a stock.
COMPANY (SYMBOL) INDUSTRY GROUP COMP RATING PAGE
Mimedx Group Inc (MDXG) Medical-Products 89 19
China Cord Blood Corp (CO) Medical-Services 80 19
Axovant Sciences Ltd (AXON) Medical-Biomed/Biotech 68 20
Conatus Pharmaceuti cals (CNAT) Medical-Biomed/Biotech 68 20
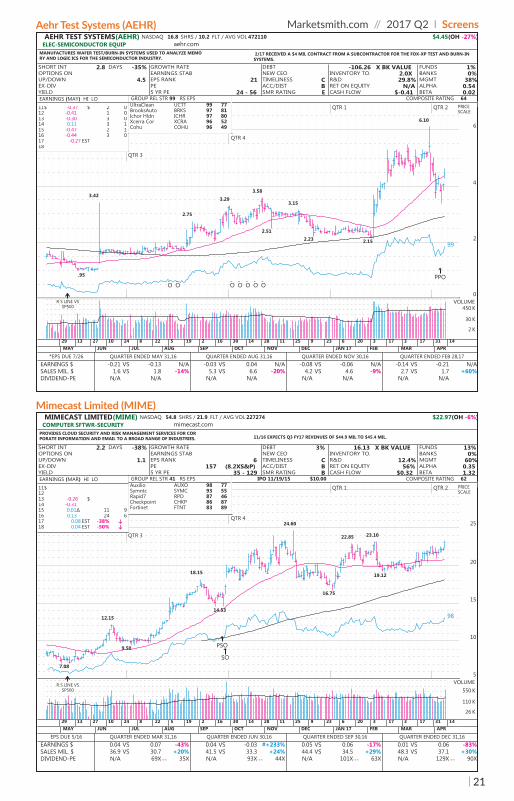
Aehr Test Systems (AEHR) Elec-Semiconductor Equip 64 21
Mimecast Limited (MIME) Computer Sft wr-Security 62 21
Visit marketsmith.com/learn/stockguide to load the criteria for this and other Stock Guide screens directly into your MarketSmith screener.
*All screen results are computer-generated and were run on April 13, 2017. This screen can also be found in the community secti on of marketsmith.com.
100% Volume Increase
Screen created by Mike Zimmerman, MarketSmith member since 2001
19
Marketsmith.com // 2017 Q2 l ScreensMimedx Group Inc (MDXG)
China Cord Blood Corp (CO)
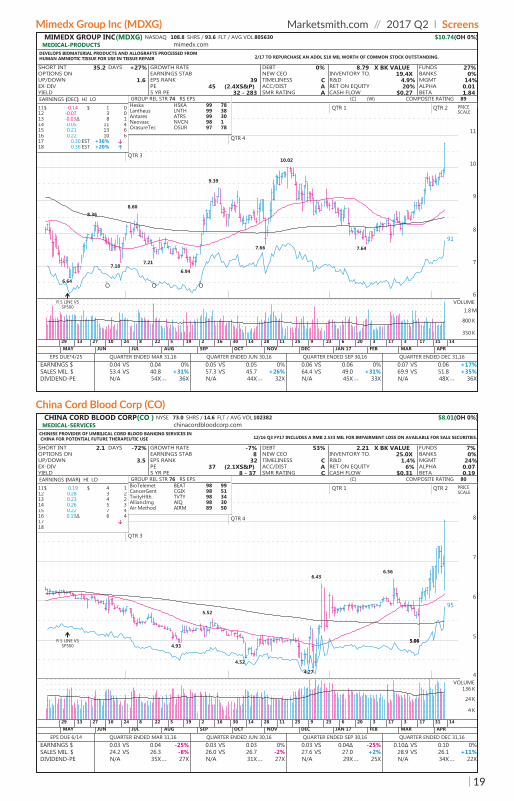
MIMEDX GROUP INC(MDXG) NASDAQ 108.8 SHRS / 93.6 FLT / AVG VOL 805630 $10.74(OH 0%)MEDICAL-PRODUCTS mimedx.com
DEVELOPS BIOMATERIAL PRODUCTS AND ALLOGRAFTS PROCESSED FROM HUMAN AMNIOTIC TISSUE FOR USE IN TISSUE REPAIR 2/17 TO REPURCHASE AN ADDL $10 MIL WORTH OF COMMON STOCK OUTSTANDING.
SHORT INT 35.2 DAYS +27%OPTIONS ONUP/DOWN 1.6EX-DIVYIELD
GROWTH RATEEARNINGS STABEPS RANK 39PE 45 (2.4XS&P)5 YR PE 32 - 283
DEBT 0%NEW CEOTIMELINESS CACC/DIST ASMR RATING A
8.79 X BK VALUEINVENTORY TO. 19.4XR&D 4.9%RET ON EQUITY 20%CASH FLOW $0.27
FUNDS 27%BANKS 0%MGMT 14%ALPHA 0.01BETA 1.84
8.368.60
9.39
10.02
6.64
7.107.21
6.94
7.66 7.64
91
QTR 2QTR 1
QTR 4
QTR 3
-O
-O
-O
6
7
8
9
10
11
PRICE SCALE
89COMPOSITE RATING(W)(C)
11$ -0.14 $ 1 012 -0.07 3 013 -0.03∆ 8 114 0.05 11 415 0.21 13 616 0.22 10 617 0.30 EST +36% ↓18 0.36 EST +20% ↑
EARNINGS (DEC) HI LOHeska HSKA 99 78Lantheus LNTH 99 38Antares ATRS 99 30Neovasc NVCN 98 1OrasureTec OSUR 97 78
GROUP REL STR 74 RS EPS
143117317320623925112814301621952282410271329APRMARFEBJAN 17DECNOVOCTSEPAUGJULJUNMAY
EARNINGS $SALES MIL. $DIVIDEND-PE
0.04 VS 0.04 0%53.4 VS 40.8 +31%N/A 54X -- 36X
0.05 VS 0.05 0%57.3 VS 45.7 +26%N/A 44X -- 32X
0.06 VS 0.06 0%64.4 VS 49.0 +31%N/A 45X -- 33X
0.07 VS 0.06 +17%69.9 VS 51.8 +35%N/A 48X -- 36X
EPS DUE*4/25 QUARTER ENDED MAR 31,16 QUARTER ENDED JUN 30,16 QUARTER ENDED SEP 30,16 QUARTER ENDED DEC 31,16
R S LINE VS SP500
VOLUME
350 K
800 K
1.8 M
CHINA CORD BLOOD CORP(CO ) NYSE 73.0 SHRS / 14.6 FLT / AVG VOL 102382 $8.01(OH 0%)MEDICAL-SERVICES chinacordbloodcorp.com
CHINESE PROVIDER OF UMBILICAL CORD BLOOD BANKING SERVICES INCHINA FOR POTENTIAL FUTURE THERAPEUTIC USE 12/16 Q3 FY17 INCLUDES A RMB 2.533 MIL FOR IMPAIRMENT LOSS ON AVAILABLE FOR SALE SECURITIES.
SHORT INT 2.1 DAYS -72%OPTIONS ONUP/DOWN 3.5EX-DIVYIELD
GROWTH RATE -7%EARNINGS STAB 8EPS RANK 32PE 37 (2.1XS&P)5 YR PE 8 - 37
DEBT 53%NEW CEOTIMELINESS CACC/DIST ASMR RATING C
2.21 X BK VALUEINVENTORY TO. 25.0XR&D 1.4%RET ON EQUITY 6%CASH FLOW $0.31
FUNDS 7%BANKS 0%MGMT 24%ALPHA 0.07BETA 0.19
5.52
6.436.56
4.93
4.52
4.27
5.065.06
95
QTR 2QTR 1
QTR 4
QTR 3
4
5
6
7
8
PRICE SCALE
80COMPOSITE RATING(C)
11$ 0.19 $ 4 112 0.28 3 213 0.23 4 214 0.26 5 315 0.22 7 416 0.19∆ 6 417 ↓18
EARNINGS (MAR) HI LOBioTelemet BEAT 98 99CancerGent CGIX 98 51TivityHlth TVTY 98 34AlliancImg AIQ 98 30Air Method AIRM 89 50
GROUP REL STR 76 RS EPS
143117317320623925112814301621952282410271329APRMARFEBJAN 17DECNOVOCTSEPAUGJULJUNMAY
EARNINGS $SALES MIL. $DIVIDEND-PE
0.03 VS 0.04 -25%24.2 VS 26.3 -8%N/A 35X -- 27X
0.03 VS 0.03 0%26.0 VS 26.7 -2%N/A 31X -- 27X
0.03 VS 0.04∆ -25%27.6 VS 27.0 +2%N/A 29X -- 25X
0.10∆ VS 0.10 0%28.9 VS 26.1 +11%N/A 34X -- 22X
EPS DUE 6/14 QUARTER ENDED MAR 31,16 QUARTER ENDED JUN 30,16 QUARTER ENDED SEP 30,16 QUARTER ENDED DEC 31,16
R S LINE VS SP500
VOLUME
4 K
24 K
136 K
20
Axovant Sciences Ltd (AXON)
Conatus Pharmaceuticals (CNAT)
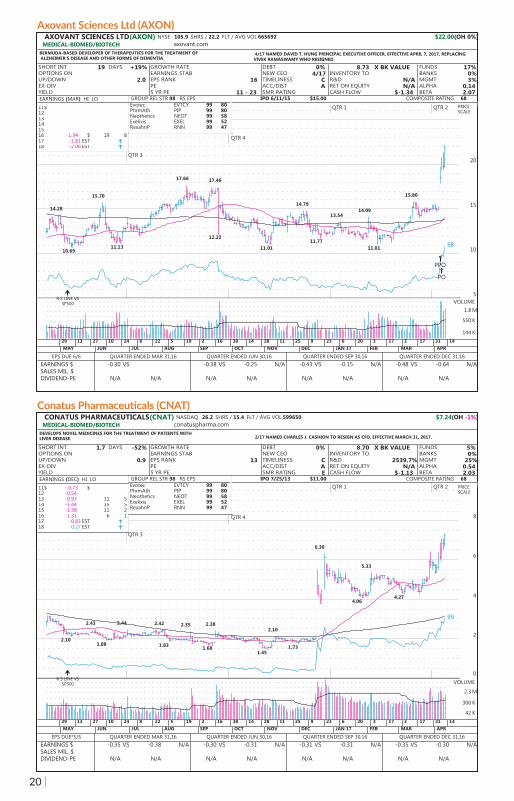
AXOVANT SCIENCES LTD(AXON) NYSE 105.9 SHRS / 22.2 FLT / AVG VOL 665692 $22.00(OH 0%)MEDICAL-BIOMED/BIOTECH axovant.com
BERMUDA-BASED DEVELOPER OF THERAPEUTICS FOR THE TREATMENT OFALZHEIMER'S DISEASE AND OTHER FORMS OF DEMENTIA.
4/17 NAMED DAVID T. HUNG PRINCIPAL EXECUTIVE OFFICER, EFFECTIVE APRIL 7, 2017, REPLACING VIVEK RAMASWAMY WHO RESIGNED.
SHORT INT 19 DAYS +19%OPTIONS ONUP/DOWN 2.0EX-DIVYIELD
GROWTH RATEEARNINGS STABEPS RANK 16PE5 YR PE 11 - 23
DEBT 0%NEW CEO 4/17TIMELINESS CACC/DIST ASMR RATING
8.73 X BK VALUEINVENTORY TO.R&D N/ARET ON EQUITY N/ACASH FLOW $-1.34
FUNDS 17%BANKS 0%MGMT 3%ALPHA 0.14BETA 2.07
14.28
15.70
17.66 17.46
14.79
13.5414.09
15.80
10.6911.13
12.22
11.0111.77
11.01 98
QTR 2QTR 1
QTR 4
QTR 3
PO
PPO
5
10
15
20
PRICE SCALE
68COMPOSITE RATING$15.00IPO 6/11/15
11$1213141516 -1.34 $ 19 817 -1.81 EST ↑18 -2.06 EST ↑
EARNINGS (MAR) HI LOEvotec EVTCY 99 80PhrmAth PIP 99 80Neothetics NEOT 99 58Exelixis EXEL 99 52RexahnP RNN 99 47
GROUP REL STR 98 RS EPS
143117317320623925112814301621952282410271329APRMARFEBJAN 17DECNOVOCTSEPAUGJULJUNMAY
EARNINGS $SALES MIL. $DIVIDEND-PE
-0.30 VS
N/A N/A
-0.38 VS -0.25 N/A
N/A N/A
-0.43 VS -0.15 N/A
N/A N/A
-0.48 VS -0.64 N/A
N/A N/A
EPS DUE 6/6 QUARTER ENDED MAR 31,16 QUARTER ENDED JUN 30,16 QUARTER ENDED SEP 30,16 QUARTER ENDED DEC 31,16
R S LINE VS SP500 VOLUME
144 K
550 K
1.8 M
CONATUS PHARMACEUTICALS(CNAT) NASDAQ 26.2 SHRS / 15.4 FLT / AVG VOL 599650 $7.24(OH -1%)MEDICAL-BIOMED/BIOTECH conatuspharma.com
DEVELOPS NOVEL MEDICINES FOR THE TREATMENT OF PATIENTS WITH LIVER DISEASE. 2/17 NAMED CHARLES J. CASHION TO RESIGN AS CFO, EFFECTIVE MARCH 31, 2017.
SHORT INT 1.7 DAYS -52%OPTIONS ONUP/DOWN 0.9EX-DIVYIELD
GROWTH RATEEARNINGS STABEPS RANK 13PE5 YR PE
DEBT 0%NEW CEOTIMELINESS CACC/DIST ASMR RATING E
8.70 X BK VALUEINVENTORY TO.R&D 2539.7%RET ON EQUITY N/ACASH FLOW $-1.13
FUNDS 5%BANKS 0%MGMT 25%ALPHA 0.54BETA 2.03
2.43 2.44 2.42 2.35 2.382.10
6.30
5.33
2.101.88 1.83 1.68
1.451.73
4.064.27
99
QTR 2QTR 1
QTR 4
QTR 3
0
2
4
6
8
PRICE SCALE
68COMPOSITE RATING$11.00IPO 7/25/13
11$ -0.73 $12 -0.5413 -0.97 11 514 -1.44 15 515 -1.30 11 216 -1.31 6 117 -0.83 EST ↑18 0.27 EST ↑
EARNINGS (DEC) HI LOEvotec EVTCY 99 80PhrmAth PIP 99 80Neothetics NEOT 99 58Exelixis EXEL 99 52RexahnP RNN 99 47
GROUP REL STR 98 RS EPS
143117317320623925112814301621952282410271329APRMARFEBJAN 17DECNOVOCTSEPAUGJULJUNMAY
EARNINGS $SALES MIL. $DIVIDEND-PE
-0.35 VS -0.38 N/A
N/A N/A
-0.30 VS -0.31 N/A
N/A N/A
-0.31 VS -0.31 N/A
N/A N/A
-0.35 VS -0.30 N/A
N/A N/A
EPS DUE*5/5 QUARTER ENDED MAR 31,16 QUARTER ENDED JUN 30,16 QUARTER ENDED SEP 30,16 QUARTER ENDED DEC 31,16
R S LINE VS SP500 VOLUME
42 K
300 K
2.3 M
21
Marketsmith.com // 2017 Q2 l ScreensAehr Test Systems (AEHR)
Mimecast Limited (MIME)
AEHR TEST SYSTEMS(AEHR) NASDAQ 16.8 SHRS / 10.2 FLT / AVG VOL 472110 $4.45(OH -27%)ELEC-SEMICONDUCTOR EQUIP aehr.com
MANUFACTURES WAFER TEST/BURN-IN SYSTEMS USED TO ANALYZE MEMORY AND LOGIC ICS FOR THE SEMICONDUCTOR INDUSTRY.
2/17 RECEIVED A $4 MIL CONTRACT FROM A SUBCONTRACTOR FOR THE FOX-XP TEST AND BURN-IN SYSTEMS.
SHORT INT 2.8 DAYS -35%OPTIONS ONUP/DOWN 4.5EX-DIVYIELD
GROWTH RATEEARNINGS STABEPS RANK 21PE5 YR PE 24 - 56
DEBTNEW CEOTIMELINESS CACC/DIST BSMR RATING E
-106.26 X BK VALUEINVENTORY TO. 2.0XR&D 29.8%RET ON EQUITY N/ACASH FLOW $-0.41
FUNDS 1%BANKS 0%MGMT 38%ALPHA 0.54BETA 0.02
3.42
2.75
3.29
3.58
3.15
6.10
.95
2.512.23 2.15 99
QTR 2QTR 1
QTR 4
QTR 3
PPO-O
-O
-O
-O
-O
-O
-O
0
2
4
6
PRICE SCALE
64COMPOSITE RATING
11$ -0.37 $ 2 012 -0.41 1 013 -0.30 3 014 0.11 3 115 -0.47 2 116 -0.44 3 017 -0.27 EST18
EARNINGS (MAY) HI LOUltraClean UCTT 99 77BrooksAuto BRKS 97 81Ichor Hldn ICHR 97 80Xcerra Cor XCRA 96 52Cohu COHU 96 49
GROUP REL STR 99 RS EPS
143117317320623925112814301621952282410271329APRMARFEBJAN 17DECNOVOCTSEPAUGJULJUNMAY
EARNINGS $SALES MIL. $DIVIDEND-PE
-0.21 VS -0.13 N/A1.6 VS 1.8 -14%
N/A N/A
-0.03 VS 0.04 N/A5.3 VS 6.6 -20%
N/A N/A
-0.08 VS -0.06 N/A4.2 VS 4.6 -9%
N/A N/A
-0.14 VS -0.21 N/A2.7 VS 1.7 +60%
N/A N/A
*EPS DUE 7/26 QUARTER ENDED MAY 31,16 QUARTER ENDED AUG 31,16 QUARTER ENDED NOV 30,16 QUARTER ENDED FEB 28,17
R S LINE VS SP500
VOLUME
2 K
30 K
450 K
MIMECAST LIMITED(MIME) NASDAQ 54.8 SHRS / 21.9 FLT / AVG VOL 227274 $22.97(OH -6%)COMPUTER SFTWR-SECURITY mimecast.com
PROVIDES CLOUD SECURITY AND RISK MANAGEMENT SERVICES FOR CORPORATE INFORMATION AND EMAIL TO A BROAD RANGE OF INDUSTRIES. 11/16 EXPECTS Q3 FY17 REVENUES OF $44.9 MIL TO $45.4 MIL.
SHORT INT 2.2 DAYS -38%OPTIONS ONUP/DOWN 1.1EX-DIVYIELD
GROWTH RATEEARNINGS STABEPS RANK 6PE 157 (8.2XS&P)5 YR PE 35 - 129
DEBT 3%NEW CEOTIMELINESS CACC/DIST BSMR RATING B
16.13 X BK VALUEINVENTORY TO.R&D 12.4%RET ON EQUITY 56%CASH FLOW $0.32
FUNDS 13%BANKS 0%MGMT 60%ALPHA 0.35BETA 1.32
12.15
18.15
24.60
22.85 23.10
7.08
9.50
14.53
16.75
19.12
98
QTR 2QTR 1
QTR 4
QTR 3
SO
PSO
5
10
15
20
25
PRICE SCALE
62COMPOSITE RATING$10.00IPO 11/19/15
11$1213 -0.26 $14 -0.3115 0.01∆ 11 916 0.13 24 617 0.08 EST -38% ↓18 0.04 EST -50% ↓
EARNINGS (MAR) HI LOAuxilio AUXO 98 77Symntc SYMC 93 55Rapid7 RPD 87 46Checkpoint CHKP 86 87Fortinet FTNT 83 89
GROUP REL STR 41 RS EPS
143117317320623925112814301621952282410271329APRMARFEBJAN 17DECNOVOCTSEPAUGJULJUNMAY
EARNINGS $SALES MIL. $DIVIDEND-PE
0.04 VS 0.07 -43%36.9 VS 30.7 +20%N/A 69X -- 35X
0.04 VS -0.03 #+233%41.5 VS 33.3 +24%N/A 93X -- 44X
0.05 VS 0.06 -17%44.4 VS 34.5 +29%N/A 101X -- 63X
0.01 VS 0.06 -83%48.3 VS 37.1 +30%N/A 129X -- 90X
EPS DUE 5/16 QUARTER ENDED MAR 31,16 QUARTER ENDED JUN 30,16 QUARTER ENDED SEP 30,16 QUARTER ENDED DEC 31,16
R S LINE VS SP500
VOLUME
26 K
110 K
550 K

22
Marketsmith.com // 2017 Q2 l MarketSmith Features
MarketSmith has expanded its alerts capability with our newest feature called Smart Alerts. Customers can add up to 200 individual stocks to the Smart Alert lists to help them monitor daily acti on.
Our fi rst Smart Alert is Pullback to 10-week and is designed to identi fy the fi rst or second pullback to the 10-week line. This signal helps investors identi fy a good point they might add to their positi ons when the market is in a solid uptrend.
The second Smart Alert is the 50-Day Break on Volume and is more defensive in nature. It is designed to detect a break of the 50-day moving average. The alert will trigger if a stock falls 5% below the 50-day and the volume is 50% or more above average. The 50-day Break alert only triggers for stocks that have broken out of a proper base and had been in an uptrend prior to the break.
The MarketSmith team added this new alert to help customers recognize when a stock may be breaking down and sending a sell signal.
Another ti mely MarketSmith feature is the Earnings Gap Up and Gap Down email. Earnings have become a quarter-by-quarter game, so it’s vital to stay on top of your stocks that could gap up or down on their earnings reports.
While the list came out in August 2016, subscribers can now get these noti fi cati ons via email, desktop alerts and mobile app noti fi cati ons. The reports are also available through the Stock Ideas butt on on the desktop platf orm and the Reports secti on in the List Manager.
MarketSmith Features Highlight

23
Marketsmith.com // 2017 Q2 l Resources
Resources
Webinars to Sharpen Your Investi ng SkillsFrom fundamental analysis to technical chart reading, our webinars take your investment skills to the next level. Hosted by product coaches, topics include breakaway gaps, analyzing growth stocks and more. Watch webinars at: Investors.com/mswebinars__________________________________________________________________________________
Weekly Market Updates
Don’t miss our Take on the Market video hosted by senior product coaches discussing current market acti vity, the behavior of leading stocks, and strategies for staying on the right side of the acti on.
View every Friday at: marketsmith.investors.com/takeonthemarket__________________________________________________________________________________
Free Stock Trading SummitsAtt end complimentary investi ng summit to learn about swing trading, growth investi ng and advanced screening techniques. Get ti ps on essenti al investi ng strategies and how to streamline your stock research. Check our schedule for a Trading Summit near you.
Register now: Call (800) 831-2525 or visit Investors.com/TradingSummit __________________________________________________________________________________
Connect with usFollow us for exclusive off ers, giveaways, and stock investi ng ti ps.
View every Friday at:
MarketSmith’s iPad and iPhone apps deliver our powerful
stock research tool beyond the desktop, with exceptional
speed and clarity - and at no additional cost. Go ahead,
take your charts with you.
Marketsmith.com (800) 831-2525
MarketSmithis Mobile
®

Copyright © 2017 Investor’s Business Daily, Inc., Investor’s Business Daily, IBD, CAN SLIM, and corresponding logos are registered trademarks owned by Investor’s Business Daily, Inc. MarketSmith is a registered trademark of MarketSmith, Incorporated.
The material contained herein is not to be reproduced, redistributed, published, stored in a retrieval system, or transmitted in any form or by any means, electronic mechanical, photocopying, recording, or otherwise, without prior written permission of Investor’s Business Daily, Inc. and MarketSmith Incorporated.
Data provided under license agreement by William O’Neil + Co. Incorporated. All material presented here has been obtained or derived from sources believed to be accurate, but Investor’s Business Daily, Inc., MarketSmith Inc., and William O’Neil + Company, Inc. do not guarantee its accuracy and it may possibly be incomplete and/or condensed. The contents are based on the study and interpretation of available data as it relates to our historical models of the best performing stocks. This is not a prospectus; no effort on our part with respect to sale or purchase of any securities is intended or implied. Any chart appearing in this material is for educational purposes and is not, and should not be construed as a recommendation or rating to buy or sell any security. It is possible that at this date or some subsequent date the officers, directors and/or shareholders of William O’Neil + Company, Inc., MarketSmith Inc. and Investor’s Business Daily, Inc. and their affiliates own securities or buy or sell securities listed in the following pages or those not mentioned.
Standard & Poor’s US Index Data
Copyright © 2017, Standard & Poor’s Financial Services LLC (“S&P”). Reproduction of S&P US Index Data in any form is prohibited except with the prior written permission of S&P. Because of the possibility of human or mechanical error by S&P’s sources, S&P or others, S&P does not guarantee the accuracy, adequacy, completeness, timeliness or availability of any information and is not responsible for any errors or omissions or for the results obtained from the use of such information. S&P GIVES NO EXPRESS OR IMPLIED WARRANTIES, INCLUDING, BUT NOT LIMITED TO, ANY WARRANTIES OF MERCHANTABILITY OR FITNESS FOR A PARTICULAR PURPOSE OR USE. In no event shall S&P or its affiliates be liable for any indirect, special or consequential damages in connection with subscriber’s or others’ use of S&P US Index Data. (2012)
MarketSmithis Mobile

1265
5 Be
atric
e St
reet
Los
Ange
les,
CA
9006
6
CO
NN
ECT
WIT
H U
S
STO
CK G
UID
E //
201
7 Q
2
CUST
OM
ER
SUCC
ESS
ST
ORI
ES