Stock Fund PAIJX Stock Fund–Advisor Class...
56
October 31, 2017 ANNUAL REPORT Emerging Markets Value Stock Fund Emerging Markets Value Stock Fund–Advisor Class Emerging Markets Value Stock Fund–I Class T. ROWE PRICE The fund invests in multi-cap companies that appear to be out of favor or undervalued in emerging markets. PRIJX PAIJX REVIX
Transcript of Stock Fund PAIJX Stock Fund–Advisor Class...

Proof #6
October 31, 2017
ANNuAlREPORT
Emerging Markets Value Stock Fund
Emerging Markets Value Stock Fund–Advisor Class
Emerging Markets Value Stock Fund–I Class
T. ROwE PRICE
The fund invests in multi-cap companies thatappear to be out of favor or undervalued inemerging markets.
PRIJX
PAIJX
REVIX

Proof #6
REPORTS ON THE WEB
Sign up for our Email Program, and you can begin to receive updated fund reports and prospectuses online rather than through the mail. Log in to your account at troweprice.com for more information.
HIGHLIGHTS
• Emergingmarketsstocksralliedoverthepast12monthsastheglobaleconomicrecoverybroadenedanddemandforhigher-riskassetsstayedstrong.
• TheEmergingMarketsValueStockFundreturned26.85%overitsfiscalyearendedOctober31,2017,inlinewiththeMSCIEmergingMarketsIndex.
• Valuestockshavelaggedgrowthstocksinemergingmarketsin2017asinvestorspiledintolarge-captechnologyandconsumerdiscretionarynames.Therotationintohigh-growthcompanieshasnotfavoredourstyleofinvesting,butithascreatedopportunitiesinrelativelylessexpensivecyclicalsectors.
• Thevaluationgapbetweengrowthandvaluestocksisverywide,andwebelievethatouropportunitysetexhibitsattractiverisk/rewardcharacteristics.Weareconfidentthatourextensiveresearchanddisciplinedstockselectionprocesswillhelpusgeneratevalueforshareholdersovertime.
TheviewsandopinionsinthisreportwerecurrentasofOctober31,2017.They are not guarantees of performance or investment results andshouldnotbe takenas investmentadvice. Investmentdecisionsreflectavarietyof factors,and themanagers reserve the right tochange theirviews about individual stocks, sectors, and the markets at any time.As a result, the views expressed should not be relied upon as a fore-castof the fund’s future investment intent.Thereport iscertifiedunderthe Sarbanes-Oxley Act, which requiresmutual funds and other publiccompanies to affirm that, to the best of their knowledge, the informa-tionintheirfinancialreportsisfairlyandaccuratelystatedinallmaterialrespects.
T. Rowe Price Emerging Markets Value Stock Fund

Proof #6
T. Rowe Price Emerging Markets Value Stock Fund
Manager’s Letter
1
Fellow Shareholders
Emerging markets stocks rallied over our fiscal year as investor sentiment
unexpectedly rebounded. Signs of improving demand worldwide, rising corporate
earnings, and surprisingly strong growth in China revived investors’ confidence in
the global outlook following a sell-off in the asset class sparked by last November’s
U.S. presidential election. Against this positive backdrop, the Emerging Markets Value
Stock Fund posted a double-digit gain in line with its benchmark.
The Emerging Markets Value Stock Fund returned 13.63% and 26.85% for the six and 12 months ended October 31, 2017, versus 16.40% and 26.91%, respectively, for the MSCI Emerging Markets Index. (Returns for the Advisor Class and I Class reflect their different fees.) For the 12-month period, Russia was the top contributor to relative performance, driven
by strong performance in select companies that are not included in our benchmark. On the other hand, stock selection in South Africa detracted the most from relative returns.
The Emerging Markets Value Stock Fund invests in undervalued companies in developing countries with potential for better performance. Our investment philosophy derives from a few key observations stemming from T. Rowe Price’s decades of experience in emerging markets investing. First, the market forces that typically drive stock prices back toward their historical averages can often fail
TotalReturnPeriodsEnded10/31/17 6Months 12Months
EmergingMarketsValueStockFund 13.63% 26.85%
EmergingMarketsValueStockFund–AdvisorClass 13.49 26.60
EmergingMarketsValueStockFund–IClass 13.78 18.62*
MSCIEmergingMarketsIndex 16.40 26.91
*Sinceinception3/6/17.
Performance Comparison

Proof #6
2
to materialize in developing countries, making a classic value investing approach used in developed markets less effective. Additionally, we believe that more work is required to identify catalysts for change in emerging markets, where simply picking cheap stocks is not enough to generate outperformance.
We use a contrarian approach to identify “forgotten” companies, or those that have fallen out of favor with most investors, but have catalysts for change that could unlock value in the near term. Such catalysts typically include new management, a shift toward more disciplined capital spending, an improving economy, or any event that can help drive a company’s stock price to fair value. To find the best investments for your fund, we rely on T. Rowe Price’s global emerging markets equity analysts, who travel extensively around the world to conduct research and visit hundreds of companies in the emerging markets universe.
MaRkET ENvIRONMENT
Emerging markets stocks plunged at the start of our fiscal year amid worries about protectionist rhetoric and inflationary policies under the incoming U.S. administration. But starting in 2017, unexpectedly strong growth in China and other indicators signaling rising demand restored investor confidence in the asset class. Stronger corporate earnings and evidence of newfound capital spending discipline in many markets also supported buying sentiment. Aside from last
November’s postelection sell-off and a modest decline in September, the MSCI Emerging Markets Index rose in every single month during our fiscal year and hit a six-year high shortly before our period ended. The rally in emerging markets came even as the Federal Reserve raised short-term interest rates twice in 2017 as it continued to unwind its accommodative monetary policy in place
PeriodsEnded10/31/17 TotalReturn(InU.S.DollarTerms) 6Months 12Months
China 28.61% 41.30%
SouthKorea 21.56 41.09
Thailand 16.08 27.00
Taiwan 15.16 26.70
Russia 4.69 17.54
SouthAfrica 4.62 11.93
Brazil 11.10 9.99
Mexico -0.19 2.62
Source:RIMESOnline,usingMSCIindexes.
Market Performance

Proof #6
3
since the 2008 financial crisis. Most individual emerging markets advanced over the past 12 months. China and South Korea led advancers with returns exceeding 40%. Russia and South Africa generated double-digit returns yet lagged the benchmark. Mexico rose the least with a low single-digit gain.
PORTfOLIO REvIEW
We are pleased to report that your fund kept pace with its benchmark in a difficult environment for value investors. Over the past year, value stocks lagged growth stocks in the emerging markets universe as risk-seeking investors flocked to technology, Internet, and consumer discretionary companies and bypassed traditionally cyclical sectors such as financials, materials, energy, and industrial and business services. This rotation into “growthier” companies has not been favorable to our investment style. However, it has created buying opportunities in relatively cheaper areas of the market that could bolster our long-term performance once investors turn their attention back to cyclical stocks.
In Latin America, Brazil remains the largest overweight country against the benchmark, but our exposure declined over the period. We maintained a relatively large position in investment bank Banco BTG Pactual, which made headlines in 2015 after its founder and chief executive was arrested in a widespread corruption probe surrounding state oil firm Petrobras. The arrest sparked a sell-off in BTG’s shares and forced the bank to sell assets and slash jobs worldwide. While the ongoing investigation into BTG’s founder continues to deter investors, we think that management’s recent actions will allow BTG to function reasonably well and that a ruling in the corruption case will be a positive catalyst for BTG shares. Elsewhere in the region, we added to Mexican petrochemicals company Mexichem, which fit our criteria for being a “neglected” stock and is well positioned to benefit from an upturn in the plastics industry. Chemical companies worldwide are benefiting from supply discipline in China. Additionally, Mexichem recently finished an investment and restructuring cycle lasting several years, and we believe that the company’s efforts will improve its free cash flow and returns to an extent that is underappreciated by the market. (Please refer to the portfolio of investments for a complete list of holdings and the amount each represents in the portfolio.)

Proof #6
4
In Asia, our China allocation rose following a rally in Chinese stocks and a few large purchases over the period. China’s economy has beat expectations in 2017, and our research trips throughout the mainland have supported our view that the momentum will be sustained for some time. While we are mindful of the potential
risks brought on by China’s rapid credit growth in recent years, we are encouraged by Beijing’s firm stance in pledging to deleverage the financial system and to reform state-owned enterprises, which should pave the way for fundamentally stronger companies. Moreover, the formation of new nonperforming loans has declined as a result of slowing credit growth. In light of our increased confidence in China’s deleveraging goals, we initiated positions in Industrial & Commercial Bank of China and Agricultural Bank of China, both attractively valued banks that stand to benefit from the cyclical upturn in the economy. We eliminated Hong Kong-based laminates manufacturer Kingboard Chemical after strong performance and used proceeds to purchase Huaneng Power International, a state-owned, coal-based independent power producer that should benefit from Beijing’s recent focus on supply-side reform and restrictions on the expansion of thermal coal power plants.
In Southeast Asia, we eliminated our holdings in Malaysian cigarette maker British American Tobacco Bhd to help finance a new position in LT Group, a family-run conglomerate in the Philippines whose businesses range from banking to liquor. LT Group shares have underperformed the Philippine stock market for several years, and its board of directors stands out for being very conservative—qualities that underscore its perception as a “forgotten” stock. However, the company is now under the control of the founder’s son, who has proved to be a competent manager and is slowly turning around the various businesses. We believe that LT Group has strong upside potential in the next few years.
Based on net assets as of 10/31/17.
Geographic Diversification
Europe11%
Middle Eastand Africa
11%
Pacific ex Japan60%
Other andReserves2%
LatinAmerica
16%

Proof #6
5
Our allocations to markets in emerging Europe, Middle East, and Africa stayed broadly unchanged. Russia was the fund’s top contributor to relative performance thanks to stock selection in names such as Internet company Mail.Ru and state-controlled lender Sberbank, which both generated outsized returns. Conversely, our stock selection was weakest in South Africa, which weighed the most on relative performance. Our position in South African investment company Brait was the biggest detractor in absolute terms as investors fretted about
weak performance in a women’s clothing chain it operates in the UK. We took advantage of the declines and increased our position in Brait, whose stock price we think is undervalued given that the company’s other businesses appear to be in solid shape.
OuTLOOk
Our outlook for emerging markets has brightened over the past 12 months. Stronger activity in emerging markets has coincided with a growth pickup in developed markets, pointing to “the broadest synchronized upswing the world economy has experienced in the last decade,” as the International Monetary Fund stated in July.
At the stock level, we are encouraged by a recovery in earnings and cash flow as many companies have grown more focused on increasing revenue and disciplined in their capital spending. For example, companies in Asia are exhibiting stronger fundamentals across the board as greater management discipline has produced a structural uptrend in free cash flow generation. Reforms are also gaining traction
PercentofNetAssets 4/30/17 10/31/17
Financials 35.1% 39.1%
InformationTechnology 18.4 16.6
TelecommunicationServices 10.8 10.2
Materials 7.6 8.5
IndustrialsandBusinessServices 7.3 8.1
RealEstate 4.8 4.4
Energy 3.1 3.5
Utilities 3.4 3.0
ConsumerDiscretionary 3.1 2.8
ConsumerStaples 2.5 1.5
HealthCare 0.0 0.0
OtherandReserves 3.9 2.3
Total 100.0% 100.0%
Historicalweightingsreflectcurrentindustry/sectorclassifications.
Sector Diversification

Proof #6
6
in several markets. In China, we are encouraged to see that some state-owned enterprises have lately introduced management incentives and special dividends.
Risks to our outlook include a shift toward protectionism in the U.S., which could restrain global trade and investment flows. North Korea is a grave concern following the buildup in tensions with the U.S. However, sovereign analysts at T. Rowe Price believe that the near-term risk of a nuclear war with North Korea is low and that further negotiations or a Cold War-style deterrence are the more likely outcomes of the current escalation.
China continues to stoke fears of a financial crisis owing to its rapid credit growth in recent years. While China’s economy faces many structural challenges, we are encouraged by official efforts to kick-start various changes as Beijing seeks to rebalance the drivers of economic growth. The timeline for implementing various reforms is uncertain, however, and we continue to monitor developments on the mainland to make sure that leaders do not backpedal on recent reforms.
Value stocks in emerging markets still trade at a large discount relative to the broad emerging markets universe even after the past year’s strong performance, and we continue to see upside potential in markets across the developing world. Thanks to T. Rowe Price’s longstanding strengths in fundamental research and the hard work of our global emerging markets equity team, we believe that we are well positioned to continue generating value for our shareholders over the long term.
Thank you for investing with T. Rowe Price.
Respectfully submitted,
Ernest YeungPortfolio manager and chairman of the fund’s Investment Advisory Committee
November 15, 2017
The committee chairman has day-to-day responsibility for managing the portfolio and works with committee members in developing and executing its investment program.
Proof #6
7
T. Rowe Price Emerging Markets Value Stock Fund
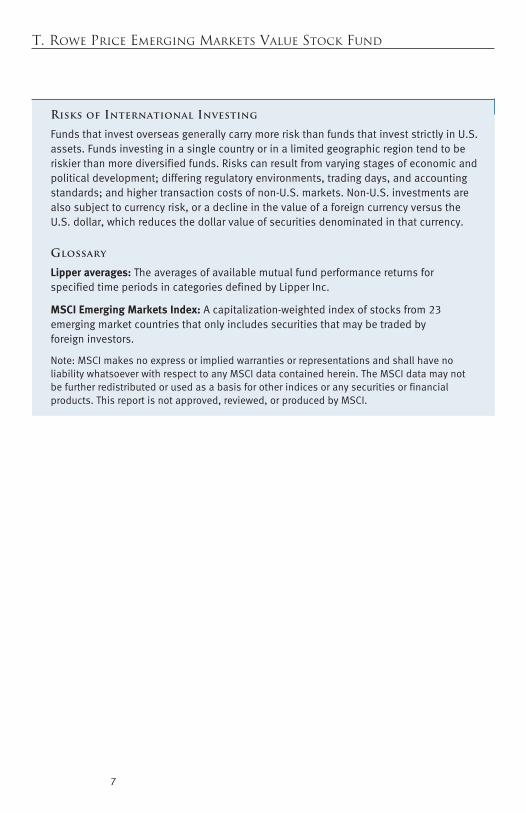
Risks of International Investing
FundsthatinvestoverseasgenerallycarrymoreriskthanfundsthatinveststrictlyinU.S.assets.Fundsinvestinginasinglecountryorinalimitedgeographicregiontendtoberiskierthanmorediversifiedfunds.Riskscanresultfromvaryingstagesofeconomicandpoliticaldevelopment;differingregulatoryenvironments,tradingdays,andaccountingstandards;andhighertransactioncostsofnon-U.S.markets.Non-U.S.investmentsarealsosubjecttocurrencyrisk,oradeclineinthevalueofaforeigncurrencyversustheU.S.dollar,whichreducesthedollarvalueofsecuritiesdenominatedinthatcurrency.
Glossary
Lipper averages:TheaveragesofavailablemutualfundperformancereturnsforspecifiedtimeperiodsincategoriesdefinedbyLipperInc.
MSCI Emerging Markets Index:Acapitalization-weightedindexofstocksfrom23emergingmarketcountriesthatonlyincludessecuritiesthatmaybetradedbyforeigninvestors.
Note:MSCImakesnoexpressorimpliedwarrantiesorrepresentationsandshallhavenoliabilitywhatsoeverwithrespecttoanyMSCIdatacontainedherein.TheMSCIdatamaynotbefurtherredistributedorusedasabasisforotherindicesoranysecuritiesorfinancialproducts.Thisreportisnotapproved,reviewed,orproducedbyMSCI.

Proof #6
8
T. Rowe Price Emerging Markets Value Stock Fund
TWENTY-fIvE LaRGEST HOLDINGS
Percentof NetAssets 10/31/17
SamsungElectronics,SouthKorea 7.2%TaiwanSemiconductorManufacturingCo.,Taiwan 2.5PICCProperty&Casualty,China 2.5BancoBTGPactual,Brazil 2.5ChinaLifeInsurance,China 2.4
AgriculturalBankofChina,China 2.3YY,China 2.2KunlunEnergy,China 2.2AnhuiConchCement,China 2.1Industrial&CommercialBankofChina,China 2.1
Mail.Ru,Russia 2.1Land&Houses,Thailand 2.0StandardChartered,UnitedKingdom 2.0INGLifeInsuranceKorea,SouthKorea 1.9ICICIBank,India 1.8
Mexichem,Mexico 1.8AbuDhabiCommercialBank,UnitedArabEmirates 1.8FosunInternational,China 1.7CathayFinancialHolding,Taiwan 1.7VEON,Russia 1.7
ChinaUnicomHongKong,China 1.7POSCO,SouthKorea 1.7ChinaInternationalMarineContainers,China 1.7Sberbank,Russia 1.7CIMBGroupHoldingsBerhad,Malaysia 1.7
Total 55.0%
Note:Theinformationshowndoesnotreflectanyexchange-tradedfunds(ETFs),cashreserves,orcollateralforsecuritieslendingthatmaybeheldintheportfolio.
Portfolio Highlights
Proof #6
9
T. Rowe Price Emerging Markets Value Stock Fund
Performance and Expenses
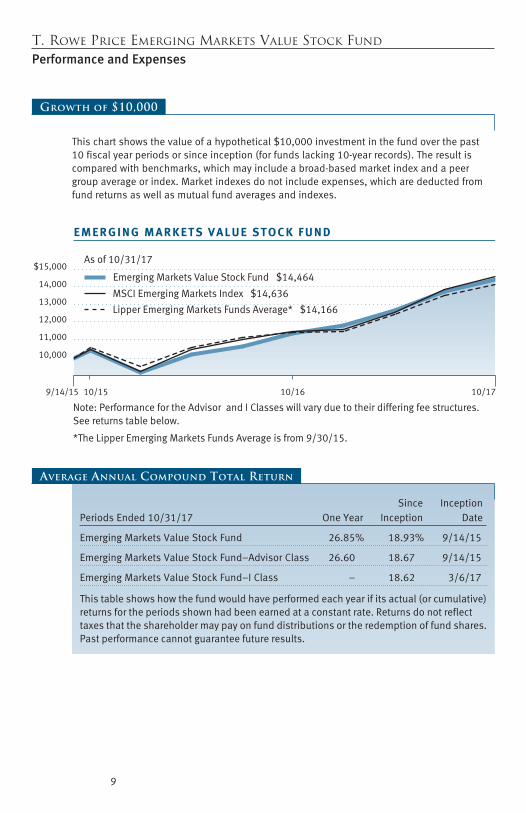
Growth of $10,000
Thischartshowsthevalueofahypothetical$10,000investmentinthefundoverthepast10fiscalyearperiodsorsinceinception(forfundslacking10-yearrecords).Theresultiscomparedwithbenchmarks,whichmayincludeabroad-basedmarketindexandapeergroupaverageorindex.Marketindexesdonotincludeexpenses,whicharedeductedfromfundreturnsaswellasmutualfundaveragesandindexes.
Since InceptionPeriodsEnded10/31/17 OneYear Inception Date
EmergingMarketsValueStockFund 26.85% 18.93% 9/14/15
EmergingMarketsValueStockFund–AdvisorClass 26.60 18.67 9/14/15
EmergingMarketsValueStockFund–IClass – 18.62 3/6/17
Thistableshowshowthefundwouldhaveperformedeachyearifitsactual(orcumulative)returnsfortheperiodsshownhadbeenearnedataconstantrate.Returnsdonotreflecttaxesthattheshareholdermaypayonfunddistributionsortheredemptionoffundshares.Pastperformancecannotguaranteefutureresults.
Average Annual Compound Total Return
MSCI Emerging Markets Index $14,636
Emerging Markets Value Stock Fund $14,464
As of 10/31/17
9/14/15 10/1610/15 10/17
E M E R G I N G M A R K E T S V A L U E S T O C K F U N D
$15,000
14,000
13,000
12,000
11,000
10,000
Lipper Emerging Markets Funds Average* $14,166
Note: Performance for the Advisor and I Classes will vary due to their differing fee structures. See returns table below.
*The Lipper Emerging Markets Funds Average is from 9/30/15.

Proof #6
10
T. Rowe Price Emerging Markets Value Stock Fund
Fund Expense Example
Asamutualfundshareholder,youmayincurtwotypesofcosts:(1)transactioncosts,suchasredemptionfeesorsalesloads,and(2)ongoingcosts,includingmanagementfees,distributionandservice(12b-1)fees,andotherfundexpenses.Thefollowingexampleisintendedtohelpyouunderstandyourongoingcosts(indollars)ofinvestinginthefundandtocomparethesecostswiththeongoingcostsofinvestinginothermutualfunds.Theexampleisbasedonaninvestmentof$1,000investedatthebeginningofthemostrecentsix-monthperiodandheldfortheentireperiod.
Pleasenotethatthefundhasthreeshareclasses:Theoriginalshareclass(InvestorClass)chargesnodistributionandservice(12b-1)fee,theAdvisorClasssharesareofferedonlythroughunaffiliatedbrokersandotherfinancialintermediariesandchargea0.25%12b-1fee,andIClasssharesareavailabletoinstitutionallyorientedclientsandimposeno12b-1oradministrativefeepayment.Eachshareclassispresentedseparatelyinthetable.
actual ExpensesThefirstlineofthefollowingtable(Actual)providesinformationaboutactualaccountvaluesandexpensesbasedonthefund’sactualreturns.Youmayusetheinformationonthisline,togetherwithyouraccountbalance,toestimatetheexpensesthatyoupaidovertheperiod.Simplydivideyouraccountvalueby$1,000(forexample,an$8,600accountvaluedividedby$1,000=8.6),thenmultiplytheresultbythenumberonthefirstlineundertheheading“ExpensesPaidDuringPeriod”toestimatetheexpensesyoupaidonyouraccountduringthisperiod.
Hypothetical Example for Comparison PurposesTheinformationonthesecondlineofthetable(Hypothetical)isbasedonhypotheticalaccountvaluesandexpensesderivedfromthefund’sactualexpenseratioandanassumed5%peryearrateofreturnbeforeexpenses(notthefund’sactualreturn).Youmaycomparetheongoingcostsofinvestinginthefundwithotherfundsbycontrastingthis5%hypotheticalexampleandthe5%hypotheticalexamplesthatappearintheshareholderreportsoftheotherfunds.Thehypotheticalaccountvaluesandexpensesmaynotbeusedtoestimatetheactualendingaccountbalanceorexpensesyoupaidfortheperiod.
Note:T.RowePricechargesanannualaccountservicefeeof$20,generallyforaccountswithlessthan$10,000.ThefeeiswaivedforanyinvestorwhoseT.RowePricemutualfundaccountstotal$50,000ormore;accountselectingtoreceiveelectronicdeliveryofaccountstatements,transactionconfirmations,prospectuses,andshareholderreports;oraccountsofaninvestorwhoisaT.RowePricePersonalServicesorEnhancedPersonalServicesclient(enrollmentintheseprogramsgenerallyrequiresT.RowePriceassetsofatleast$250,000).Thisfeeisnotincludedintheaccompanyingtable.Ifyouaresubjecttothefee,keepitinmindwhenyouareestimatingtheongoingexpensesofinvestinginthefundandwhencomparingtheexpensesofthisfundwithotherfunds.
Youshouldalsobeawarethattheexpensesshowninthetablehighlightonlyyourongoingcostsanddonotreflectanytransactioncosts,suchasredemptionfeesorsalesloads.Therefore,thesecondlineofthetableisusefulincomparingongoingcostsonlyandwillnothelpyoudeterminetherelativetotalcostsofowningdifferentfunds.Totheextentafundchargestransactioncosts,however,thetotalcostofowningthatfundishigher.

Proof #6
11
T. Rowe Price Emerging Markets Value Stock Fund
Fund Expense Example (continued)
Beginning Ending ExpensesPaid AccountValue AccountValue DuringPeriod* 5/1/17 10/31/17 5/1/17to10/31/17
Investor ClassActual $1,000.00 $1,136.30 $8.08
Hypothetical(assumes5%returnbeforeexpenses) 1,000.00 1,017.64 7.63
advisor ClassActual 1,000.00 1,134.90 8.88
Hypothetical(assumes5%returnbeforeexpenses) 1,000.00 1,016.89 8.39
I ClassActual 1,000.00 1,137.80 5.93
Hypothetical(assumes5%returnbeforeexpenses) 1,000.00 1,019.66 5.60
*Expensesareequaltothefund’sannualizedexpenseratioforthe6-monthperiod,multipliedbytheaverageaccountvalueovertheperiod,multipliedbythenumberofdaysinthemostrecentfiscalhalfyear(184),anddividedbythedaysintheyear(365)toreflectthehalf-yearperiod.TheannualizedexpenseratiooftheInvestorClasswas1.50%,theAdvisorClasswas1.65%,andtheIClasswas1.10%.
Emerging Markets Value Stock Fund

Proof #6
12
T. Rowe Price Emerging Markets Value Stock Fund
Since InceptionPeriodEnded9/30/17 OneYear Inception Date
EmergingMarketsValueStockFund 25.56% 18.31% 9/14/15
EmergingMarketsValueStockFund–AdvisorClass 25.40 18.08 9/14/15
EmergingMarketsValueStockFund–IClass – 15.65 3/6/17
Current performance may be higher or lower than the quoted past performance, which cannot guarantee future results. Share price, principal value, and return will vary, and you may have a gain or loss when you sell your shares. For the most recent month-end performance, please visit our website (troweprice.com) or contact a T. Rowe Price representative at 1-800-225-5132 or, for Advisor and I Class shares, 1-800-638-8790. The performance information shown does not reflect the deduction of a 2% redemption fee on shares held for 90 days or less. If it did, the performance would be lower.
Thistableprovidesreturnsthroughthemostrecentcalendarquarter-endratherthanthroughtheendofthefund’sfiscalperiod.Itshowshowthefundwouldhaveperformedeachyearifitsactual(orcumulative)returnsfortheperiodsshownhadbeenearnedataconstantrate.Averageannualtotalreturnfiguresincludechangesinprincipalvalue,reinvesteddividends,andcapitalgaindistributions.Returnsdonotreflecttaxesthattheshareholdermaypayonfunddistributionsortheredemptionoffundshares.Whenassessingperformance,investorsshouldconsiderbothshort-andlong-termreturns.
Quarter-End Returns
EmergingMarketsValueStockFund 3.21%
EmergingMarketsValueStockFund–AdvisorClass 4.23
EmergingMarketsValueStockFund–IClass 2.22
Theexpenseratioshownisasofthefund’sfiscalyearended10/31/16.TheexpenseratiofortheEmergingMarketsValueStockFund–IClassisestimatedasoftheclass’sinceptiondateof3/6/17.Thisnumbermayvaryfromtheexpenseratioshownelsewhereinthisreportbecauseitisbasedonadifferenttimeperiodand,ifapplicable,includesacquiredfundfeesandexpensesbutdoesnotincludefeeorexpensewaivers.
Expense Ratio

Proof #6
13
T. Rowe Price Emerging Markets Value Stock Fund
Financial Highlights For a share outstanding throughout each period
The accompanying notes are an integral part of these financial statements.
Investor ClassYear
Ended 10/31/17
10/31/16
9/14/15(1)
Through
10/31/15
NET ASSET VALUE
Beginning of period
$ 11.23
$ 10.42
$ 10.00
Investment activities
Net investment income (loss)(2)
0.19(3)(6)
0.14(3)
(0.01)(3)
Net realized and unrealized gain / loss
2.75
0.82
0.43
Total from investment activities
2.94
0.96
0.42
Distributions
Net investment income
(0.16)
–
–
Net realized gain
(0.09)
(0.15)
–
Total distributions
(0.25)
(0.15)
–
NET ASSET VALUE
End of period $ 13.92 $ 11.23 $ 10.42
Ratios/Supplemental Data Total return(4) 26.85%(3)(6) 9.43%(3) 4.20%(3)
Ratio of total expenses to average net assets
1.51%(3)(6)
1.50%(3)
1.50%(3)(5)
Ratio of net investment income (loss) to average net assets
1.49%(3)(6)
1.42%(3)
(1.09)%(3)(5)
Portfolio turnover rate
63.6%
93.8%
15.6%
Net assets, end of period (in thousands)
$ 41,456
$ 19,226
$ 13,257
(1) Inception date (2) Per share amounts calculated using average shares outstanding method. (3) See Note 6. Excludes expenses in excess of a 1.50% contractual expense limitation in effect
through 2/28/18. (4) Total return reflects the rate that an investor would have earned on an investment in the fund
during each period, assuming reinvestment of all distributions and payment of no redemption or account fees. Total return is not annualized for periods less than one year.
(5) Annualized (6) Includes investment-related costs borne by the fund in excess of the expense limitation
(See Note 6).

Proof #6
14
T. Rowe Price Emerging Markets Value Stock Fund
Financial Highlights For a share outstanding throughout each period
The accompanying notes are an integral part of these financial statements.
Advisor Class
Year Ended
10/31/17
10/31/16
9/14/15(1)
Through
10/31/15
NET ASSET VALUE
Beginning of period
$ 11.20
$ 10.42
$ 10.00
Investment activities
Net investment income (loss)(2)
0.16(3)(6)
0.13(3)
(0.01)(3)
Net realized and unrealized gain / loss
2.75
0.80
0.43
Total from investment activities
2.91
0.93
0.42
Distributions
Net investment income
(0.14)
–
–
Net realized gain
(0.09)
(0.15)
–
Total distributions
(0.23)
(0.15)
–
NET ASSET VALUE
End of period $ 13.88 $ 11.20 $ 10.42
Ratios/Supplemental Data Total return(4) 26.60%(3)(6) 9.14%(3) 4.20%(3)
Ratio of total expenses to average net assets
1.66%(3)(6)
1.65%(3)
1.65%(3)(5)
Ratio of net investment income (loss) to average net assets
1.27%(3)(6)
1.29%(3)
(1.12)%(3)(5)
Portfolio turnover rate
63.6%
93.8%
15.6%
Net assets, end of period (in thousands)
$ 385
$ 297
$ 260
(1) Inception date (2) Per share amounts calculated using average shares outstanding method. (3) See Note 6. Excludes expenses in excess of a 1.65% contractual expense limitation in effect
through 2/28/18. (4) Total return reflects the rate that an investor would have earned on an investment in the fund
during each period, assuming reinvestment of all distributions and payment of no redemption or account fees. Total return is not annualized for periods less than one year.
(5) Annualized (6) Includes investment-related costs borne by the fund in excess of the expense limitation (See
Note 6).

Proof #6
15
T. Rowe Price Emerging Markets Value Stock Fund
Financial Highlights
The accompanying notes are an integral part of these financial statements.
Forashareoutstandingthroughouttheperiod
I Class
3/6/17(1)
Through
10/31/17
NET ASSET VALUE
Beginning of period
$ 11.76
Investment activities
Net investment income (2)
0.13 (3)(6)
Net realized and unrealized gain / loss
2.06
Total from investment activities
2.19
NET ASSET VALUE
End of period $ 13.95
Ratios/Supplemental Data Total return(4) 18.62%(3)(6)
Ratio of total expenses to average net assets 1.10%
(3)(5)(6)
Ratio of net investment income to average net assets 1.56%
(3)(5)(6)
Portfolio turnover rate
63.6%
Net assets, end of period (in thousands) $1,149
(1) Inception date (2) Per share amounts calculated using average shares outstanding method. (3) See Note 6. Excludes expenses in excess of a 0.05% contractual operating expense limitation
in effect through 2/28/19. (4) Total return reflects the rate that an investor would have earned on an investment in the fund
during each period, assuming reinvestment of all distributions and payment of no redemption or account fees. Total return is not annualized for periods less than one year.
(5) Annualized (6) Includes investment-related costs borne by the fund in excess of the expense limitation
(See Note 6).

Proof #6
T. Rowe Price Emerging Markets Value Stock Fund October 31, 2017
Portfolio of Investments ‡ Shares $ Value
(Cost and value in $000s)
16
AUSTRIA 1.6%
Common Stocks 1.6%
Erste Group Bank 15,869 681
Total Austria (Cost $464) 681
BRAZIL 9.9%
Common Stocks 5.3%
Banco Btg Pactual, Equity Units 157,500 1,060
Energias do Brasil 69,227 309
Tim Participacoes, ADR (USD) 28,200 520
Transmissora Alianca de Energia Eletrica, Equity Units 61,200 384
2,273
Preferred Stocks 4.6%
Banco Bradesco (1) 65,726 697
Marcopolo (1) 582,730 707
Petrobras Brasileiro (1)(2) 111,700 573
1,977
Total Brazil (Cost $2,962) 4,250
CHILE 1.0%
Common Stocks 1.0%
Itau CorpBanca, ADR (USD) 32,100 442
Total Chile (Cost $415) 442
CHINA 27.6%
Common Stocks 27.6%
Agricultural Bank of China, H Shares (HKD) 2,112,000 995
Anhui Conch Cement, H Shares (HKD) 213,500 915
China International Marine Containers, H Shares (HKD) 364,800 727
China Life Insurance, H Shares (HKD) 314,000 1,041
China Mobile (HKD) 58,000 583

Proof #6
T. Rowe Price Emerging Markets Value Stock Fund
Shares $ Value
(Cost and value in $000s)
17
China Overseas Land & Investment (HKD) 104,000 338
China Unicom Hong Kong (HKD) (2) 522,000 741
Fosun International (HKD) 303,000 752
Huaneng Power International, H Shares (HKD) 880,000 588
Industrial & Commercial Bank of China, H Shares (HKD) 1,145,000 911
Kunlun Energy (HKD) 1,020,000 946
Lonking Holdings (HKD) 1,450,000 652
PICC Property & Casualty, H Shares (HKD) 538,000 1,068
Uni-President China Holdings (HKD) 768,000 642
YY, ADR (USD) (2) 10,652 963
Total China (Cost $9,874) 11,862
EGYPT 2.8%
Common Stocks 2.8%
OCI (EUR) (2) 29,527 700
Telecom Egypt 686,203 503
Total Egypt (Cost $999) 1,203
HONG KONG 1.2%
Common Stocks 1.2%
Pacific Textiles 497,000 523
Total Hong Kong (Cost $578) 523
INDIA 2.9%
Common Stocks 2.9%
ICICI Bank, ADR (USD) 86,770 794
State Bank of India, GDR (USD) 9,384 444
Total India (Cost $881) 1,238

Proof #6
T. Rowe Price Emerging Markets Value Stock Fund
Shares $ Value
(Cost and value in $000s)
18
INDONESIA 1.4%
Common Stocks 1.4%
Bank Negara Indonesia Persero 1,089,500 611
Total Indonesia (Cost $401) 611
MALAYSIA 1.7%
Common Stocks 1.7%
CIMB Group Holdings Berhad 497,505 722
Total Malaysia (Cost $592) 722
MEXICO 3.4%
Common Stocks 3.4%
Concentradora Fibra Danhos 399,268 671
Mexichem SAB de CV 299,013 770
Total Mexico (Cost $1,472) 1,441
PERU 1.3%
Common Stocks 1.3%
Compania de Minas Buenaventura, ADR (USD) 39,800 549
Total Peru (Cost $503) 549
PHILIPPINES 1.5%
Common Stocks 1.5%
LT Group 1,891,100 659
Total Philippines (Cost $589) 659

Proof #6
T. Rowe Price Emerging Markets Value Stock Fund
Shares $ Value
(Cost and value in $000s)
19
ROMANIA 1.3%
Common Stocks 1.3%
BRD-Groupe Societe Generale 175,736 553
Total Romania (Cost $507) 553
RUSSIA 5.5%
Common Stocks 5.5%
Mail.Ru, GDR (USD) (2) 27,713 900
Sberbank of Russia, ADR (USD) 50,406 723
VEON, ADR (USD) 190,400 745
Total Russia (Cost $1,816) 2,368
SAUDI ARABIA 1.2%
Common Stocks 1.2%
Saudi British Bank 76,138 502
Total Saudi Arabia (Cost $506) 502
SOUTH AFRICA 5.2%
Common Stocks 5.2%
Barclays Africa 61,863 613
Brait 117,172 438
Nedbank 33,065 484
Telkom SA SOC 192,510 721
Total South Africa (Cost $2,671) 2,256
SOUTH KOREA 14.0%
Common Stocks 14.0%
Hyundai Motor 3,644 524
ING Life Insurancve Korea 18,656 800
KT 20,341 566

Proof #6
T. Rowe Price Emerging Markets Value Stock Fund
Shares $ Value
(Cost and value in $000s)
20
Netmarble Games (2) 1,882 292
POSCO 2,518 734
Samsung Electronics 1,257 3,099
Total South Korea (Cost $4,426) 6,015
TAIWAN 6.1%
Common Stocks 6.1%
Catcher Technology 36,000 383
Cathay Financial Holding 454,000 750
Pegatron 162,000 420
Taiwan Semiconductor Manufacturing 135,000 1,092
Total Taiwan (Cost $1,986) 2,645
THAILAND 3.3%
Common Stocks 3.3%
Bangkok Bank, NVDR 70,100 407
BEC World 245,600 129
Land & Houses, NVDR 2,640,600 866
Total Thailand (Cost $1,222) 1,402
TURKEY 1.1%
Common Stocks 1.1%
Akbank 175,722 465
Total Turkey (Cost $460) 465
UNITED ARAB EMIRATES 1.8%
Common Stocks 1.8%
Abu Dhabi Commercial Bank 382,232 770
Total United Arab Emirates (Cost $701) 770

Proof #6
T. Rowe Price Emerging Markets Value Stock Fund
Shares $ Value
(Cost and value in $000s)
21
UNITED KINGDOM 1.9%
Common Stocks 1.9%
Standard Chartered (2) 84,199 840
Total United Kingdom (Cost $756) 840
SHORT-TERM INVESTMENTS 2.1%
Money Market Funds 2.1%
T. Rowe Price Government Reserve Fund, 1.09% (3)(4) 924,941 925
Total Short-Term Investments (Cost $925) 925
Total Investments in Securities
99.8% of Net Assets (Cost $35,706) $ 42,922
‡
Country classifications are generally based on MSCI categories or another unaffiliated third party data provider; Shares are denominated in the currency of the country presented unless otherwise noted.
(1)
Preferred stocks are shares that carry certain preferential rights. The dividend rate may not be consistent each pay period and could be zero for a particular year.
(2) Non-income producing (3) Seven-day yield (4) Affiliated Company
ADR American Depositary Receipts EUR Euro GDR Global Depositary Receipts HKD Hong Kong Dollar
NVDR Non-Voting Depositary Receipts USD U.S. Dollar

Proof #6
T. Rowe Price Emerging Markets Value Stock Fund
22
The accompanying notes are an integral part of these financial statements.
Affiliated Companies
($000s)
The fund may invest in certain securities that are considered affiliated companies. As defined by the 1940 Act, an affiliated company is one in which the fund owns 5% or more of the outstanding voting securities, or a company that is under common ownership or control. The following securities were considered affiliated companies for all or some portion of the year ended October 31, 2017. Net realized gain (loss), investment income, change in net unrealized gain/loss, and purchase and sales cost reflect all activity for the period then ended.
Affiliate
Net Realized Gain(Loss)
Change in NetUnrealizedGain/Loss
InvestmentIncome
T. Rowe Price Government Reserve Fund $ — $ — $ 8Totals $ —# $ — $ 8+ Supplementary Investment Schedule Affiliate
Value10/31/16
PurchaseCost
SalesCost
Value10/31/17
T. Rowe Price Government Reserve Fund $ 665 $ ¤ $ ¤ $ 925 $ 925^
# Capital gain/loss distributions from mutual funds represented $0 of the net realized gain(loss). + Investment income comprised $8 of dividend income and $0 of interest income. ¤ Purchase and sale information not shown for cash management funds. ^ The cost basis of investments in affiliated companies was $925.

Proof #6
23
T. Rowe Price Emerging Markets Value Stock Fund October 31, 2017
($000s, except shares and per share amounts)
Statement of Assets and Liabilities
Assets
Investments in securities, at value (cost $35,706) $ 42,922
Receivable for shares sold 79
Receivable for investment securities sold 63
Cash 25
Due from affiliates 15
Dividends receivable 7
Foreign currency (cost $2) 2
Other assets 132
Total assets 43,245
Liabilities
Payable for investment securities purchased 96
Investment management fees payable 37
Due to affiliates 9
Other liabilities 113
Total liabilities 255
NET ASSETS $ 42,990 Net Assets Consist of:
Undistributed net investment income $ 378
Accumulated undistributed net realized gain 802
Net unrealized gain 7,216
Paid-in capital applicable to 3,088,893 shares of $0.01 par value capital stock outstanding; 18,000,000,000 shares of the Corporation authorized 34,594
NET ASSETS $ 42,990

Proof #6
24
T. Rowe Price Emerging Markets Value Stock Fund October 31, 2017
The accompanying notes are an integral part of these financial statements.
Statement of Assets and Liabilities
NET ASSET VALUE PER SHARE
Investor Class ($41,456,232 / 2,978,808 shares outstanding) $ 13.92
Advisor Class ($385,454 / 27,772 shares outstanding) $ 13.88
I Class ($1,148,463 / 82,313 shares outstanding) $ 13.95

Proof #6
T. Rowe Price Emerging Markets Value Stock Fund
($000s)
Statement of Operations
25
The accompanying notes are an integral part of these financial statements.
Year Ended
10/31/17Investment Income (Loss)
Income Dividend (net of foreign taxes of $118) $ 903 Interest 5
Total income 908
Expenses Investment management 315 Shareholder servicing
Investor Class $ 44 Advisor Class 1 45
Rule 12b-1 fees Advisor Class 1
Prospectus and shareholder reports Investor Class 15 Advisor Class 1 16
Custody and accounting 170 Registration 88 Legal and audit 45 Miscellaneous 33 Waived / paid by Price Associates (256)
Total expenses 457
Net investment income 451
Realized and Unrealized Gain / Loss
Net realized gain (loss) Securities 1,830 Foreign currency transactions (4)
Net realized gain 1,826 Change in net unrealized gain / loss on securities 4,951
Net realized and unrealized gain / loss 6,777
INCREASE IN NET ASSETS FROM OPERATIONS $ 7,228

Proof #6
T. Rowe Price Emerging Markets Value Stock Fund
($000s)
26
Statement of Changes in Net Assets
Year Ended
10/31/17 10/31/16Increase (Decrease) in Net Assets
Operations Net investment income $ 451 $ 221 Net realized gain (loss) 1,826 (660) Change in net unrealized gain / loss 4,951 2,085 Increase in net assets from operations 7,228 1,646
Distributions to shareholders
Net investment income Investor Class (277) – Advisor Class (4) –
Net realized gain Investor Class (156) (208) Advisor Class (2) (4)
Decrease in net assets from distributions (439) (212)
Capital share transactions*
Shares sold Investor Class 23,117 6,643 Advisor Class 16 15 I Class 1,158 –
Distributions reinvested Investor Class 254 103
Shares redeemed Investor Class (7,784) (2,198) I Class (93) –
Redemption fees received 10 9 Increase in net assets from capital share transactions 16,678 4,572
Net Assets
Increase during period 23,467 6,006 Beginning of period 19,523 13,517
End of period $ 42,990 $ 19,523
Undistributed net investment income 378 221

Proof #6
T. Rowe Price Emerging Markets Value Stock Fund
27
The accompanying notes are an integral part of these financial statements.
Statement of Changes in Net Assets
(000s)
Year Ended
10/31/17 10/31/16 *Share information
Shares sold Investor Class 1,871 653 Advisor Class 2 1 I Class 89 –
Distributions reinvested Investor Class 24 10
Shares redeemed Investor Class (628) (224) I Class (7) –
Increase in shares outstanding 1,351 440

Proof #6
28
T. Rowe Price Emerging Markets Value Stock Fund October 31, 2017
Notes to Financial Statements
T. Rowe Price International Funds, Inc. (the corporation) is registered under the Investment Company Act of 1940 (the 1940 Act). The T. Rowe Price Emerging Markets Value Stock Fund (the fund) is a diversified, open-end management investment company established by the corporation. The fund seeks long-term growth of capital. The fund has three classes of shares: the Emerging Markets Value Stock Fund (Investor Class), the Emerging Markets Value Stock Fund–Advisor Class (Advisor Class), and the Emerging Markets Value Stock Fund–I Class (I Class). Advisor Class shares are sold only through unaffiliated brokers and other unaffiliated financial intermediaries. I Class shares generally are available only to investors meeting a $1,000,000 minimum investment or certain other criteria. The Advisor Class operates under a Board-approved Rule 12b-1 plan pursuant to which the class compensates financial intermediaries for distribution, shareholder servicing, and/or certain administrative services; the Investor and I Classes do not pay Rule 12b-1 fees. Each class has exclusive voting rights on matters related solely to that class; separate voting rights on matters that relate to all classes; and, in all other respects, the same rights and obligations as the other classes.
NOTE 1 - SIGNIfICaNT aCCOuNTING POLICIES
Basis of Preparation The fund is an investment company and follows accounting and reporting guidance in the Financial Accounting Standards Board (FASB) Accounting Standards Codification Topic 946 (ASC 946). The accompanying financial statements were prepared in accordance with accounting principles generally accepted in the United States of America (GAAP), including, but not limited to, ASC 946. GAAP requires the use of estimates made by management. Management believes that estimates and valuations are appropriate; however, actual results may differ from those estimates, and the valuations reflected in the accompanying financial statements may differ from the value ultimately realized upon sale or maturity.
Investment Transactions, Investment Income, and Distributions Investment transactions are accounted for on the trade date basis. Income and expenses are recorded on the accrual basis. Realized gains and losses are reported on the identified cost basis. Dividends received from mutual fund investments are reflected as dividend income; capital gain distributions are reflected as realized gain/loss. Dividend income and capital gain distributions are recorded on the ex-dividend date. Income tax-related interest and penalties, if incurred,

Proof #6
29
T. Rowe Price Emerging Markets Value Stock Fund
are recorded as income tax expense. Income distributions are declared and paid by each class annually. Distributions to shareholders are recorded on the ex-dividend date. A capital gain distribution may also be declared and paid by the fund annually.
Currency Translation Assets, including investments, and liabilities denominated in foreign currencies are translated into U.S. dollar values each day at the prevailing exchange rate, using the mean of the bid and asked prices of such currencies against U.S. dollars as quoted by a major bank. Purchases and sales of securities, income, and expenses are translated into U.S. dollars at the prevailing exchange rate on the respective date of such transaction. The portion of the results of operations attributable to changes in foreign exchange rates on investments is not bifurcated from the portion attributable to changes in market prices. The effect of changes in foreign currency exchange rates on realized and unrealized security gains and losses is reflected as a component of security gains and losses.
Class accounting Shareholder servicing, prospectus, and shareholder report expenses incurred by each class are charged directly to the class to which they relate. Expenses common to all classes, investment income, and realized and unrealized gains and losses are allocated to the classes based upon the relative daily net assets of each class. To the extent any expenses are waived or reimbursed in accordance with an expense limitation (see Note 6), the waiver or reimbursement is charged to the applicable class or allocated across the classes in the same manner as the related expense. The Advisor Class pays Rule 12b-1 fees, in an amount not exceeding 0.25% of the class’s average daily net assets; during the year ended October 31, 2017, the Advisor Class incurred $1,000 in these fees.
Redemption fees A 2% fee is assessed on redemptions of fund shares held for 90 days or less to deter short-term trading and to protect the interests of long-term shareholders. Redemption fees are withheld from proceeds that shareholders receive from the sale or exchange of fund shares. The fees are paid to the fund and are recorded as an increase to paid-in capital. The fees may cause the redemption price per share to differ from the net asset value per share.
New accounting Guidance In March 2017, the FASB issued amended guidance to shorten the amortization period for certain callable debt securities, held at a premium. The guidance is effective for fiscal years and interim periods beginning after December 15, 2018. Adoption will have no effect on the fund’s net assets or results of operations.

Proof #6
30
T. Rowe Price Emerging Markets Value Stock Fund
On August 1, 2017, the fund implemented amendments to Regulation S-X, issued by the Securities and Exchange Commission, which require standardized, enhanced disclosures, particularly related to derivatives, in investment company financial statements. Adoption had no effect on the fund’s net assets or results of operations.
Indemnification In the normal course of business, the fund may provide indemnification in connection with its officers and directors, service providers, and/or private company investments. The fund’s maximum exposure under these arrangements is unknown; however, the risk of material loss is currently considered to be remote.
NOTE 2 - vaLuaTION
The fund’s financial instruments are valued and each class’s net asset value (NAV) per share is computed at the close of the New York Stock Exchange (NYSE), normally 4 p.m. ET, each day the NYSE is open for business. However, the NAV per share may be calculated at a time other than the normal close of the NYSE if trading on the NYSE is restricted, if the NYSE closes earlier, or as may be permitted by the SEC.
fair value The fund’s financial instruments are reported at fair value, which GAAP defines as the price that would be received to sell an asset or paid to transfer a liability in an orderly transaction between market participants at the measurement date. The T. Rowe Price Valuation Committee (the Valuation Committee) is an internal committee that has been delegated certain responsibilities by the fund’s Board of Directors (the Board) to ensure that financial instruments are appropriately priced at fair value in accordance with GAAP and the 1940 Act. Subject to oversight by the Board, the Valuation Committee develops and oversees pricing-related policies and procedures and approves all fair value determinations. Specifically, the Valuation Committee establishes procedures to value securities; determines pricing techniques, sources, and persons eligible to effect fair value pricing actions; oversees the selection, services, and performance of pricing vendors; oversees valuation-related business continuity practices; and provides guidance on internal controls and valuation-related matters. The Valuation Committee reports to the Board and has representation from legal, portfolio management and trading, operations, risk management, and the fund’s treasurer.

Proof #6
31
T. Rowe Price Emerging Markets Value Stock Fund
Various valuation techniques and inputs are used to determine the fair value of financial instruments. GAAP establishes the following fair value hierarchy that categorizes the inputs used to measure fair value:
Level 1 – quoted prices (unadjusted) in active markets for identical financial instruments that the fund can access at the reporting date
Level 2 – inputs other than Level 1 quoted prices that are observable, either directly or indirectly (including, but not limited to, quoted prices for similar financial instruments in active markets, quoted prices for iden-tical or similar financial instruments in inactive markets, interest rates and yield curves, implied volatilities, and credit spreads)
Level 3 – unobservable inputs
Observable inputs are developed using market data, such as publicly available information about actual events or transactions, and reflect the assumptions that market participants would use to price the financial instrument. Unobservable inputs are those for which market data are not available and are developed using the best information available about the assumptions that market participants would use to price the financial instrument. GAAP requires valuation techniques to maximize the use of relevant observable inputs and minimize the use of unobservable inputs. When multiple inputs are used to derive fair value, the financial instrument is assigned to the level within the fair value hierarchy based on the lowest-level input that is significant to the fair value of the financial instrument. Input levels are not necessarily an indication of the risk or liquidity associated with financial instruments at that level but rather the degree of judgment used in determining those values.
valuation Techniques Equity securities listed or regularly traded on a securities exchange or in the over-the-counter (OTC) market are valued at the last quoted sale price or, for certain markets, the official closing price at the time the valuations are made. OTC Bulletin Board securities are valued at the mean of the closing bid and asked prices. A security that is listed or traded on more than one exchange is valued at the quotation on the exchange determined to be the primary market for such security. Listed securities not traded on a particular day are valued at the mean of the closing bid and asked prices for domestic securities and the last quoted sale or closing price for international securities.
For valuation purposes, the last quoted prices of non-U.S. equity securities may be adjusted to reflect the fair value of such securities at the close of the NYSE. If the fund determines that developments between the close of a foreign market

Proof #6
32
T. Rowe Price Emerging Markets Value Stock Fund
and the close of the NYSE will affect the value of some or all of its portfolio securities, the fund will adjust the previous quoted prices to reflect what it believes to be the fair value of the securities as of the close of the NYSE. In deciding whether it is necessary to adjust quoted prices to reflect fair value, the fund reviews a variety of factors, including developments in foreign markets, the performance of U.S. securities markets, and the performance of instruments trading in U.S. markets that represent foreign securities and baskets of foreign securities. The fund may also fair value securities in other situations, such as when a particular foreign market is closed but the fund is open. The fund uses outside pricing services to provide it with quoted prices and information to evaluate or adjust those prices. The fund cannot predict how often it will use quoted prices and how often it will determine it necessary to adjust those prices to reflect fair value. As a means of evaluating its security valuation process, the fund routinely compares quoted prices, the next day’s opening prices in the same markets, and adjusted prices.
Actively traded equity securities listed on a domestic exchange generally are categorized in Level 1 of the fair value hierarchy. Non-U.S. equity securities generally are categorized in Level 2 of the fair value hierarchy despite the availability of quoted prices because, as described above, the fund evaluates and determines whether those quoted prices reflect fair value at the close of the NYSE or require adjustment. OTC Bulletin Board securities, certain preferred securities, and equity securities traded in inactive markets generally are categorized in Level 2 of the fair value hierarchy.
Investments in mutual funds are valued at the mutual fund’s closing NAV per share on the day of valuation and are categorized in Level 1 of the fair value hierarchy. Assets and liabilities other than financial instruments, including short-term receivables and payables, are carried at cost, or estimated realizable value, if less, which approximates fair value.
Thinly traded financial instruments and those for which the above valuation procedures are inappropriate or are deemed not to reflect fair value are stated at fair value as determined in good faith by the Valuation Committee. The objective of any fair value pricing determination is to arrive at a price that could reasonably be expected from a current sale. Financial instruments fair valued by the Valuation Committee are primarily private placements, restricted securities, warrants, rights, and other securities that are not publicly traded.

Proof #6
33
T. Rowe Price Emerging Markets Value Stock Fund
Subject to oversight by the Board, the Valuation Committee regularly makes good faith judgments to establish and adjust the fair valuations of certain securities as events occur and circumstances warrant. For instance, in determining the fair value of an equity investment with limited market activity, such as a private placement or a thinly traded public company stock, the Valuation Committee considers a variety of factors, which may include, but are not limited to, the issuer’s business prospects, its financial standing and performance, recent investment transactions in the issuer, new rounds of financing, negotiated transactions of significant size between other investors in the company, relevant market valuations of peer companies, strategic events affecting the company, market liquidity for the issuer, and general economic conditions and events. In consultation with the investment and pricing teams, the Valuation Committee will determine an appropriate valuation technique based on available information, which may include both observable and unobservable inputs. The Valuation Committee typically will afford greatest weight to actual prices in arm’s length transactions, to the extent they represent orderly transactions between market participants, transaction information can be reliably obtained, and prices are deemed representative of fair value. However, the Valuation Committee may also consider other valuation methods such as market-based valuation multiples; a discount or premium from market value of a similar, freely traded security of the same issuer; or some combination. Fair value determinations are reviewed on a regular basis and updated as information becomes available, including actual purchase and sale transactions of the issue. Because any fair value determination involves a significant amount of judgment, there is a degree of subjectivity inherent in such pricing decisions, and fair value prices determined by the Valuation Committee could differ from those of other market participants. Depending on the relative significance of unobservable inputs, including the valuation technique(s) used, fair valued securities may be categorized in Level 2 or 3 of the fair value hierarchy.

Proof #6
34
T. Rowe Price Emerging Markets Value Stock Fund
valuation Inputs The following table summarizes the fund’s financial instruments, based on the inputs used to determine their fair values on October 31, 2017:
($000s) Level 1 Level 2 Level 3 Total value
Quoted Prices
Significant Observable
Inputs
Significant unobservable
Inputs
InvestmentsinSecurities,except: $ — $ 21,288 $ — $ 21,288
Brazil 520 3,730 — 4,250
Chile 442 — — 442
China 963 10,899 — 11,862
India 794 444 — 1,238
Peru 549 — — 549
Russia 745 1,623 — 2,368
Short-TermInvestments 925 — — 925
Total $ 4,938 $ 37,984 $ — $ 42,922
There were no material transfers between Levels 1 and 2 during the year ended October 31, 2017.
NOTE 3 - OTHER INvESTMENT TRaNSaCTIONS
Consistent with its investment objective, the fund engages in the following practices to manage exposure to certain risks and/or to enhance performance. The investment objective, policies, program, and risk factors of the fund are described more fully in the fund’s prospectus and Statement of Additional Information.
Emerging and frontier Markets The fund may invest, either directly or through investments in T. Rowe Price institutional funds, in securities of companies located in, issued by governments of, or denominated in or linked to the currencies of emerging and frontier market countries; at period-end, approximately 91% of the fund’s net assets were invested in emerging markets
Proof #6
35
T. Rowe Price Emerging Markets Value Stock Fund
and 2% in frontier markets. Emerging markets, and to a greater extent frontier markets, generally have economic structures that are less diverse and mature, and political systems that are less stable, than developed countries. These markets may be subject to greater political, economic, and social uncertainty and differing regulatory environments that may potentially impact the fund’s ability to buy or sell certain securities or repatriate proceeds to U.S. dollars. Such securities are often subject to greater price volatility, less liquidity, and higher rates of inflation than U.S. securities. Investing in frontier markets is significantly riskier than investing in other countries, including emerging markets.
Other Purchases and sales of portfolio securities other than short-term securities aggregated $34,986,000 and $18,576,000, respectively, for the year ended October 31, 2017.
NOTE 4 - fEDERaL INCOME TaxES
No provision for federal income taxes is required since the fund intends to continue to qualify as a regulated investment company under Subchapter M of the Internal Revenue Code and distribute to shareholders all of its taxable income and gains. Distributions determined in accordance with federal income tax regulations may differ in amount or character from net investment income and realized gains for financial reporting purposes. Financial reporting records are adjusted for permanent book/tax differences to reflect tax character but are not adjusted for temporary differences.
The fund files U.S. federal, state, and local tax returns as required. The fund’s tax returns are subject to examination by the relevant tax authorities until expiration of the applicable statute of limitations, which is generally three years after the filing of the tax return but which can be extended to six years in certain circumstances. Tax returns for open years have incorporated no uncertain tax positions that require a provision for income taxes.
Reclassifications to paid-in capital relate primarily to a tax practice that treats a portion of the proceeds from each redemption of capital shares as a distribution of taxable net investment income or realized capital gain. Reclassifications between income and gain relate primarily to the character of foreign capital

Proof #6
36
T. Rowe Price Emerging Markets Value Stock Fund
gains taxes. For the year ended October 31, 2017, the following reclassifications were recorded to reflect tax character (there was no impact on results of operations or net assets):
Undistributednetinvestmentincome $ (13)
Undistributednetrealizedgain (75)
Paid-incapital 88
($000s)
Distributions during the years ended October 31, 2017 and October 31, 2016, totaled $439,000 and $212,000, respectively, and were characterized as ordinary income for tax purposes. At October 31, 2017, the tax-basis cost of investments, including derivatives, and components of net assets were as follows:
Costofinvestments $ 36,446
Unrealizedappreciation $ 7,585
Unrealizeddepreciation (1,109)
Netunrealizedappreciation(depreciation) 6,476
Undistributedordinaryincome 1,178
Undistributedlong-termcapitalgain 742
Paid-incapital 34,594
Netassets $ 42,990
($000s)
The difference between book-basis and tax-basis net unrealized appreciation (depreciation) is attributable to the deferral of losses from wash sales, the realization of gains/losses on passive foreign investment companies for tax purposes. During the year ended October 31, 2017, the fund utilized $583,000 of capital loss carryforwards.

Proof #6
37
T. Rowe Price Emerging Markets Value Stock Fund
NOTE 5 - fOREIGN TaxES
The fund is subject to foreign income taxes imposed by certain countries in which it invests. Additionally, certain foreign currency transactions are subject to tax, and capital gains realized upon disposition of securities issued in or by certain foreign countries are subject to capital gains tax imposed by those countries. All taxes are computed in accordance with the applicable foreign tax law, and, to the extent permitted, capital losses are used to offset capital gains. Taxes attributable to income are accrued by the fund as a reduction of income. Taxes incurred on the purchase of foreign currencies are recorded as realized loss on foreign currency transactions. Current and deferred tax expense attributable to capital gains is reflected as a component of realized or change in unrealized gain/loss on securities in the accompanying financial statements. At October 31, 2017, the fund had no deferred tax liability attributable to foreign securities and no foreign capital loss carryforwards.
NOTE 6 - RELaTED PaRTY TRaNSaCTIONS
The fund is managed by T. Rowe Price Associates, Inc. (Price Associates), a wholly owned subsidiary of T. Rowe Price Group, Inc. (Price Group). Price Associates has entered into a sub-advisory agreement(s) with one or more of its wholly owned subsidiaries, to provide investment advisory services to the fund. The investment management agreement between the fund and Price Associates provides for an annual investment management fee, which is computed daily and paid monthly. The fee consists of an individual fund fee, equal to 0.75% of the fund’s average daily net assets, and a group fee. The group fee rate is calculated based on the combined net assets of certain mutual funds sponsored by Price Associates (the group) applied to a graduated fee schedule, with rates ranging from 0.48% for the first $1 billion of assets to 0.265% for assets in excess of $650 billion. The fund’s group fee is determined by applying the group fee rate to the fund’s average daily net assets. At October 31, 2017, the effective annual group fee rate was 0.29%.
The Investor Class and Advisor Class are each subject to a contractual expense limitation through the limitation dates indicated in the table below. During the limitation period, Price Associates is required to waive its management fee or pay any expenses (excluding interest, expenses related to borrowings, taxes, brokerage, and other non-recurring expenses permitted by the investment management agreement) that would otherwise cause the class’s ratio of

Proof #6
38
T. Rowe Price Emerging Markets Value Stock Fund
annualized total expenses to average net assets (expense ratio) to exceed its expense limitation. Each class is required to repay Price Associates for expenses previously waived/paid to the extent the class’s net assets grow or expenses decline sufficiently to allow repayment without causing the class’s expense ratio (after the repayment is taken into account) to exceed both: (1) the expense limitation in place at the time such amounts were waived; and (2) the class’s current expense limitation. However, no repayment will be made more than three years after the date of a payment or waiver.
advisor Class
Expenselimitation 1.50% 1.65%
Limitationdate February28,2018 February28,2018
Investor Class
The I Class is also subject to an operating expense limitation (I Class limit) pursuant to which Price Associates is contractually required to pay all operating expenses of the I Class, excluding management fees, interest, expenses related to borrowings, taxes, brokerage, and other non-recurring expenses permitted by the investment management agreement, to the extent such operating expenses, on an annualized basis, exceed 0.05% of average net assets. This agreement will continue until February 28, 2019, and may be renewed, revised, or revoked only with approval of the fund’s Board. The I Class is required to repay Price Associates for expenses previously paid to the extent the class’s net assets grow or expenses decline sufficiently to allow repayment without causing the class’s operating expenses (after the repayment is taken into account) to exceed both: (1) the expense limitation in place at the time such amounts were paid; and (2) the class’s current expense limitation. However, no repayment will be made more than three years after the date of a payment or waiver.
Pursuant to these agreements, $256,000 of expenses were waived/paid by Price Associates during the year ended October 31, 2017 and remain subject to repayment by the fund. Including this amount, expenses previously waived/paid by Price Associates in the amount of $571,000 remain subject to repayment by the fund at October 31, 2017.
In addition, the fund has entered into service agreements with Price Associates and a wholly owned subsidiary of Price Associates (collectively, Price). Price Associates provides certain accounting and administrative services to the fund. T. Rowe Price Services, Inc. provides shareholder and administrative services in its capacity as the fund’s transfer and dividend-disbursing agent. For the year ended October 31, 2017, expenses-incurred pursuant to these service

Proof #6
39
T. Rowe Price Emerging Markets Value Stock Fund
agreements were $86,000 for Price Associates and $36,000 for T. Rowe Price Services, Inc. The total amount payable at period-end pursuant to these service agreements is reflected as Due to Affiliates in the accompanying financial statements.
The fund may invest in certain open-end management investment companies managed by Price Associates and considered affiliates of the fund: the T. Rowe Price Government Reserve Fund or the T. Rowe Price Treasury Reserve Fund, organized as money market funds, or the T. Rowe Price Short-Term Fund, a short-term bond fund (collectively, the Price Reserve Funds). The Price Reserve Funds are offered as short-term investment options to mutual funds, trusts, and other accounts managed by Price Associates or its affiliates and are not available for direct purchase by members of the public. The Price Reserve Funds pay no investment management fees.
As of October 31, 2017, T. Rowe Price Group, Inc., or its wholly owned sub-sidiaries owned 675,000 shares of the Investor Class, representing 23% of the Investor Class’s net assets, 25,000 shares of the Advisor Class, representing 90% of the Advisor Class’s net assets and 21,259 shares of the I Class, representing 26% of the I Class’s net assets.
The fund may participate in securities purchase and sale transactions with other funds or accounts advised by Price Associates (cross trades), in accordance with procedures adopted by the fund’s Board and Securities and Exchange Commission rules, which require, among other things, that such purchase and sale cross trades be effected at the independent current market price of the security. During the year ended October 31, 2017, the fund had no purchases or sales cross trades with other funds or accounts advised by Price Associates.

Proof #6
40
T. Rowe Price Emerging Markets Value Stock Fund
Report of Independent Registered Public Accounting Firm
To the Board of Directors of T. Rowe Price International funds, Inc. and Shareholders of T. Rowe Price Emerging Markets value Stock fund
In our opinion, the accompanying statement of assets and liabilities, including the portfolio of investments, and the related statements of operations and of changes in net assets and the financial highlights present fairly, in all material respects, the financial position of the T. Rowe Price Emerging Markets Value Stock Fund (one of the portfolios comprising T. Rowe Price International Funds, Inc., hereafter referred to as the “Fund”) as of October 31, 2017, the results of its operations for the year then ended, the changes in its net assets for each of the two years in the period then ended and the financial highlights for each of the periods indicated therein, in conformity with accounting principles generally accepted in the United States of America. These financial statements and financial highlights (hereafter referred to as “financial statements”) are the responsibility of the Fund’s management. Our responsibility is to express an opinion on these financial statements based on our audits. We conducted our audits of these financial statements in accordance with the standards of the Public Company Accounting Oversight Board (United States). Those standards require that we plan and perform the audit to obtain reasonable assurance about whether the financial statements are free of material misstatement. An audit includes examining, on a test basis, evidence supporting the amounts and disclosures in the financial statements, assessing the accounting principles used and significant estimates made by management, and evaluating the overall financial statement presentation. We believe that our audits, which included confirmation of securities as of October 31, 2017 by correspondence with the custodian, brokers, and transfer agent, provide a reasonable basis for our opinion.
PricewaterhouseCoopers LLPBaltimore, MarylandDecember 15, 2017

Proof #6
41
T. Rowe Price Emerging Markets Value Stock Fund
Tax Information (Unaudited) for the Tax Year Ended 10/31/17
WeareprovidingthisinformationasrequiredbytheInternalRevenueCode.Theamountsshownmaydifferfromthoseelsewhereinthisreportbecauseofdifferencesbetweentaxandfinancialreportingrequirements.
Thefund’sdistributionstoshareholdersincluded:
• $214,000fromshort-termcapitalgains,
• $33,000fromlong-termcapitalgains,subjecttoalong-termcapitalgainstaxrateofnotgreaterthan20%.
Fortaxablenon-corporateshareholders,$529,000ofthefund’sincomerepresentsqualifieddividendincomesubjecttoalong-termcapitalgainstaxrateofnotgreaterthan20%.
Forcorporateshareholders,$3,000ofthefund’sincomequalifiesforthedividends-receiveddeduction.
Thefundwillpassthroughforeignsourceincomeof$864,000andforeigntaxespaidof$127,000.
AdescriptionofthepoliciesandproceduresusedbyT.RowePricefundsandportfoliostodeterminehowtovoteproxiesrelatingtoportfoliosecuritiesisavailableineachfund’sStatementofAdditionalInformation.Youmayrequestthisdocumentbycalling1-800-225-5132orbyaccessingtheSEC’swebsite,sec.gov.
Thedescriptionofourproxyvotingpoliciesandproceduresisalsoavailableonourcorporatewebsite.Toaccessit,pleasevisitthefollowingWebpage:
https://www3.troweprice.com/usis/corporate/en/utility/policies.html
Scrolldowntothesectionnearthebottomofthepagethatsays,“ProxyVotingPolicies.”ClickontheProxyVotingPolicieslinkintheshadedbox.
Eachfund’smostrecentannualproxyvotingrecordisavailableonourwebsiteandthroughtheSEC’swebsite.ToaccessitthroughT.RowePrice,visitthewebsitelocationshownabove,andscrolldowntothesectionnearthebottomofthepagethatsays,“ProxyVotingRecords.”ClickontheProxyVotingRecordslinkintheshadedbox.
Information on Proxy Voting Policies, Procedures, and Records
ThefundfilesacompletescheduleofportfolioholdingswiththeSecuritiesandExchangeCommissionforthefirstandthirdquartersofeachfiscalyearonFormN-Q.Thefund’sFormN-QisavailableelectronicallyontheSEC’swebsite(sec.gov);hardcopiesmaybereviewedandcopiedattheSEC’sPublicReferenceRoom,100FSt.N.E.,Washington,DC20549.FormoreinformationonthePublicReferenceRoom,call1-800-SEC-0330.
How to Obtain Quarterly Portfolio Holdings

Proof #6
42
T. Rowe Price Emerging Markets Value Stock Fund
About the Fund’s Directors and Officers
YourfundisoverseenbyaBoardofDirectors(Board)thatmeetsregularlytoreviewawidevarietyofmattersaffectingorpotentiallyaffectingthefund,includingperformance,investmentprograms,compliancematters,advisoryfeesandexpenses,serviceproviders,andbusinessandregulatoryaffairs.TheBoardelectsthefund’sofficers,whoarelistedinthefinaltable.Atleast75%oftheBoard’smembersareindependentofT.RowePriceAssociates,Inc.(T.RowePrice),anditsaffiliates;“inside”or“interested”directorsareemployeesorofficersofT.RowePrice.Thebusinessaddressofeachdirectorandofficeris100EastPrattStreet,Baltimore,Maryland21202.TheStatementofAdditionalInformationincludesadditionalinformationaboutthefunddirectorsandisavailablewithoutchargebycallingaT.RowePricerepresentativeat1-800-638-5660.
Independent Directors
Name(Year of Birth)Year Elected*[Number of T. Rowe PricePortfolios Overseen]
Principal Occupation(s) and Directorships of Public Companies and Other Investment Companies During the Past five Years
AnthonyW.Deering(1945)1991[191]
Chairman,ExeterCapital,LLC,aprivateinvestmentfirm(2004topresent);DirectorandAdvisoryBoardMember,DeutscheBankNorthAmerica(2004topresent);Director,VornadoRealEstateInvestmentTrust(2004to2012);Director,UnderArmour(2008topresent);Director,BrixmorRealEstateInvestmentTrust(2012topresent)
BruceW.Duncan(1951)2013[191]
ChiefExecutiveOfficerandDirector(2009toDecember2016),ChairmanoftheBoard(January2016topresent),andPresident(2009toSeptember2016),FirstIndustrialRealtyTrust,anownerandoperatorofindustrialproperties;ChairmanoftheBoard(2005toSeptember2016)andDirector(1999toSeptember2016),StarwoodHotels&Resorts,ahotelandleisurecompany;Director,BostonProperties(May2016topresent);Director,MarriottInternational,Inc.(September2016topresent)
RobertJ.Gerrard,Jr.(1952)2012[191]
AdvisoryBoardMember,PipelineCrisis/WinningStrategies,acollaborativeworkingtoimproveopportunitiesforyoungAfricanAmericans(1997topresent)
PaulF.McBride(1956)2013[191]
AdvisoryBoardMember,VizziaTechnologies(2015topresent)
*Eachindependentdirectorservesuntilretirement,resignation,orelectionofasuccessor.

Proof #6
43
T. Rowe Price Emerging Markets Value Stock Fund
Independent Directors (continued)
Name(Year of Birth)Year Elected*[Number of T. Rowe PricePortfolios Overseen]
Principal Occupation(s) and Directorships of Public Companies and Other Investment Companies During the Past five Years
CeciliaE.Rouse,Ph.D.(1963)2012[191]
Dean,WoodrowWilsonSchool(2012topresent);ProfessorandResearcher,PrincetonUniversity(1992topresent);MemberofNationalAcademyofEducation(2010topresent);Director,MDRC,anonprofiteducationandsocialpolicyresearchorganization(2011topresent);ResearchAssociateofLaborStudiesProgram(2011to2015)andBoardMember(2015topresent),NationalBureauofEconomicResearch(2011topresent);ChairofCommitteeontheStatusofMinorityGroupsintheEconomicProfession(2012topresent);VicePresident(2015topresent),AmericanEconomicAssociation
JohnG.Schreiber(1946)2001[191]
Owner/President,CentaurCapitalPartners,Inc.,arealestateinvestmentcompany(1991topresent);Cofounder,Partner,andCochairmanoftheInvestmentCommittee,BlackstoneRealEstateAdvisors,L.P.(1992to2015);Director,GeneralGrowthProperties,Inc.(2010to2013);Director,BlackstoneMortgageTrust,arealestatefinancecompany(2012to2016);DirectorandChairmanoftheBoard,BrixmorPropertyGroup,Inc.(2013topresent);Director,HiltonWorldwide(2013topresent);Director,HudsonPacificProperties(2014to2016)
MarkR.Tercek(1957)2009[191]
PresidentandChiefExecutiveOfficer,TheNatureConservancy(2008topresent)
*Eachindependentdirectorservesuntilretirement,resignation,orelectionofasuccessor.

Proof #6
44
Inside Directors
Name(Year of Birth)Year Elected*[Number of T. Rowe Price Portfolios Overseen]
Principal Occupation(s) and Directorships of Public Companies and Other Investment Companies During the Past five Years
EdwardC.Bernard(1956)2006[191]
DirectorandVicePresident,T.RowePrice;ViceChairmanoftheBoard,Director,andVicePresident,T.RowePriceGroup,Inc.;ChairmanoftheBoard,Director,andPresident,T.RowePriceInvestmentServices,Inc.;ChairmanoftheBoardandDirector,T.RowePriceRetirementPlanServices,Inc.,andT.RowePriceServices,Inc.;ChairmanoftheBoard,ChiefExecutiveOfficer,Director,andPresident,T.RowePriceInternationalandT.RowePriceTrustCompany;ChairmanoftheBoard,allfunds
RobertW.Sharps,CFA,CPA**(1971)2017[135]
VicePresident,T.RowePrice,T.RowePriceGroup,Inc.,andT.RowePriceTrustCompany;VicePresident,InternationalFunds
*Eachinsidedirectorservesuntilretirement,resignation,orelectionofasuccessor.**EffectiveApril1,2017,BrianC.RogerswasreplacedbyRobertW.Sharpsasaninsidedirector
ofcertainPriceFunds.
Officers
Name (Year of Birth)Position Held With International funds Principal Occupation(s)
JasonR.Adams(1979)VicePresident
VicePresidentT.RowePriceandT.RowePriceGroup,Inc.;formerly,ResearchAnalyst,CaxtonAssociates(to2015)
UlleAdamson,CFA(1979)ExecutiveVicePresident
VicePresident,T.RowePriceGroup,Inc.,andT.RowePriceInternational
RoyH.Adkins(1970)VicePresident
VicePresident,T.RowePriceGroup,Inc.,andT.RowePriceInternational
ChristopherD.Alderson(1962)President
DirectorandVicePresident,T.RowePriceInternational;VicePresident,PriceHongKong,PriceSingapore,andT.RowePriceGroup,Inc.
Unlessotherwisenoted,officershavebeenemployeesofT.RowePriceorT.RowePriceInternationalforatleast5years.
T. Rowe Price Emerging Markets Value Stock Fund

Proof #6
45
T. Rowe Price Emerging Markets Value Stock Fund
Officers (continued)
Name (Year of Birth)Position Held With International funds Principal Occupation(s)
SyedH.Ali(1970)VicePresident
VicePresident,PriceSingaporeandT.RowePriceGroup,Inc.
PaulinaAmieva(1981)VicePresident
VicePresident,T.RowePriceandT.RowePriceGroup,Inc.
MalikS.Asif(1981)VicePresident
VicePresident,T.RowePriceGroup,Inc.,andT.RowePriceInternational;formerly,student,TheUniversityofChicagoBoothSchoolofBusiness(to2012)
HarishankarBalkrishna(1983)VicePresident
VicePresident,T.RowePriceGroup,Inc.,andT.RowePriceInternational
SheenaL.Barbosa(1983)VicePresident
VicePresident,PriceHongKongandT.RowePriceGroup,Inc.
PeterJ.Bates,CFA(1974)ExecutiveVicePresident
VicePresident,T.RowePriceandT.RowePriceGroup,Inc.
LuisM.Baylac(1982)VicePresident
VicePresident,T.RowePriceGroup,Inc.,andT.RowePriceInternational
TimothyBei(1973)VicePresident
VicePresident,T.RowePriceandT.RowePriceGroup,Inc.
OliverD.M.Bell,IMC(1969)ExecutiveVicePresident
VicePresident,T.RowePriceGroup,Inc.,andT.RowePriceInternational
R.ScottBerg,CFA(1972)ExecutiveVicePresident
VicePresident,T.RowePriceandT.RowePriceGroup,Inc.
StevenE.Boothe,CFA(1977)VicePresident
VicePresident,T.RowePriceandT.RowePriceGroup,Inc.
PeterI.Botoucharov(1965)VicePresident
VicePresident,T.RowePriceGroup,Inc.,andT.RowePriceInternational
TalaBoulos(1984)VicePresident
VicePresident,T.RowePriceGroup,Inc.,andT.RowePriceInternational;formerly,VicePresident,CEEMEACorporateCreditResearch,DeutscheBank(to2013)
DarrellN.Braman(1963)VicePresidentandSecretary
VicePresident,PriceHongKong,PriceSingapore,T.RowePrice,T.RowePriceGroup,Inc.,T.RowePriceInternational,T.RowePriceInvestmentServices,Inc.,andT.RowePriceServices,Inc.
Unlessotherwisenoted,officershavebeenemployeesofT.RowePriceorT.RowePriceInternationalforatleast5years.

Proof #6
46
T. Rowe Price Emerging Markets Value Stock Fund
Officers (continued)
Name (Year of Birth)Position Held With International funds Principal Occupation(s)
RyanN.Burgess,CFA(1974)VicePresident
VicePresident,T.RowePriceandT.RowePriceGroup,Inc.
SheldonChan(1981)VicePresident
VicePresident,PriceHongKongandT.RowePriceGroup,Inc.
AndrewChang(1983)VicePresident
VicePresident,T.RowePriceGroup,Inc.
TakYiuCheng,CFA,CPA(1974)VicePresident
VicePresident,PriceHongKongandT.RowePriceGroup,Inc.
CarolynHoiCheChu(1974)VicePresident
VicePresident,PriceHongKongandT.RowePriceGroup,Inc.
ArchibaldCiganerAlbeniz,CFA(1976)ExecutiveVicePresident
VicePresident,T.RowePriceGroup,Inc.,andT.RowePriceInternational
RichardN.Clattenburg,CFA(1979)ExecutiveVicePresident
VicePresident,PriceSingapore,T.RowePrice,T.RowePriceGroup,Inc.,andT.RowePriceInternational
MichaelJ.Conelius,CFA(1964)ExecutiveVicePresident
VicePresident,T.RowePrice,T.RowePriceGroup,Inc.,T.RowePriceInternational,andT.RowePriceTrustCompany
MichaelF.Connelly,CFA(1977)VicePresident
VicePresident,T.RowePriceandT.RowePriceGroup,Inc.
AndrewS.Davis(1978)VicePresident
VicePresident,T.RowePriceandT.RowePriceGroup,Inc.
RicharddelosReyes(1975)VicePresident
VicePresident,T.RowePrice,T.RowePriceGroup,Inc.,andT.RowePriceTrustCompany
MichaelDellaVedova(1969)ExecutiveVicePresident
VicePresident,T.RowePriceGroup,Inc.,andT.RowePriceInternational
ShawnT.Driscoll(1975)VicePresident
VicePresident,T.RowePrice,T.RowePriceGroup,Inc.,andT.RowePriceTrustCompany
BridgetA.Ebner(1970)VicePresident
VicePresident,T.RowePriceandT.RowePriceGroup,Inc.
DavidJ.Eiswert,CFA(1972)ExecutiveVicePresident
VicePresident,T.RowePrice,T.RowePriceGroup,Inc.,andT.RowePriceInternational
Unlessotherwisenoted,officershavebeenemployeesofT.RowePriceorT.RowePriceInternationalforatleast5years.

Proof #6
47
T. Rowe Price Emerging Markets Value Stock Fund
Officers (continued)
Name (Year of Birth)Position Held With International funds Principal Occupation(s)
HenryM.Ellenbogen(1973)VicePresident
VicePresident,T.RowePrice,T.RowePriceGroup,Inc.,andT.RowePriceTrustCompany
RyanW.Ferro(1985)VicePresident
VicePresident,T.RowePrice;formerly,student,TuckSchoolofBusinessatDartmouth(to2014)
MarkS.Finn,CFA,CPA(1963)VicePresident
VicePresident,T.RowePrice,T.RowePriceGroup,Inc.,andT.RowePriceTrustCompany
QuentinS.Fitzsimmons(1968)VicePresident
VicePresident,T.RowePriceGroup,Inc.,andT.RowePriceInternational;formerly,PortfolioManager,RoyalBankofScotlandGroup(to2015)
MelissaC.Gallagher(1974)VicePresident
VicePresident,T.RowePriceGroup,Inc.,andT.RowePriceInternational
JustinT.Gerbereux,CFA(1975)VicePresident
VicePresident,T.RowePrice,T.RowePriceGroup,Inc.,andT.RowePriceTrustCompany
JohnR.Gilner(1961)ChiefComplianceOfficer
ChiefComplianceOfficerandVicePresident,T.RowePrice;VicePresident,T.RowePriceGroup,Inc.,andT.RowePriceInvestmentServices,Inc.
VishnuVardhanGopal(1979)VicePresident
VicePresident,PriceHongKongandT.RowePriceGroup,Inc.
JoelGrant(1978)VicePresident
VicePresident,T.RowePriceandT.RowePriceGroup,Inc.;formerly,Analyst,FidelityInternational(to2014)
PaulD.GreeneII(1978)VicePresident
VicePresident,T.RowePriceandT.RowePriceGroup,Inc.
BenjaminGriffiths,CFA(1977)VicePresident
VicePresident,T.RowePriceGroup,Inc.,andT.RowePriceInternational
AmandaB.Hall,CFA(1985)VicePresident
VicePresident,T.RowePriceInternational;formerly,student,StanfordGraduateSchoolofBusiness(to2014)
RichardL.Hall(1979)VicePresident
VicePresident,T.RowePriceandT.RowePriceGroup,Inc.
Unlessotherwisenoted,officershavebeenemployeesofT.RowePriceorT.RowePriceInternationalforatleast5years.

Proof #6
48
Officers (continued)
Name (Year of Birth)Position Held With International funds Principal Occupation(s)
NabilHanano,CFA(1984)VicePresident
VicePresident,T.RowePriceInternational
StevenC.Huber,CFA,FSA(1958)VicePresident
VicePresident,T.RowePrice,T.RowePriceGroup,Inc.,andT.RowePriceInternational
StefanHubrich,Ph.D.,CFA(1974)VicePresident
VicePresident,T.RowePriceandT.RowePriceGroup,Inc.
ArifHusain,CFA(1972)ExecutiveVicePresident
VicePresident,T.RowePriceGroup,Inc.,andT.RowePriceInternational;formerly,Director/HeadofUKandEuroFixedIncome,AllianceBernstein(to2013)
HiromasaIkeda(1971)VicePresident
VicePresident,PriceHongKongandT.RowePriceGroup,Inc.;formerly,Manager,FidelityKorea(to2014)
TetsujiInoue(1971)VicePresident
VicePresident,T.RowePriceGroup,Inc.,andT.RowePriceInternational
MichaelJacobs(1971)VicePresident
VicePresident,T.RowePriceGroup,Inc.,andT.RowePriceInternational;formerly,VicePresident,JPMorganAssetManagement(to2013)
RandalS.Jenneke(1971)VicePresident
VicePresident,T.RowePriceGroup,Inc.,andT.RowePriceInternational
PrashantG.Jeyaganesh(1983)VicePresident
VicePresident,T.RowePriceandT.RowePriceGroup,Inc.
NinaP.Jones,CPA(1980)VicePresident
VicePresident,T.RowePriceandT.RowePriceGroup,Inc.
YoichiroKai(1973)VicePresident
VicePresident,T.RowePriceGroup,Inc.,andT.RowePriceInternational
JacobKann,CFA(1987)VicePresident
Employee,T.RowePrice;formerly,EquityResearchAssociate,EatonVanceCorporation(to2013)
JaiKapadia(1982)VicePresident
VicePresident,PriceHongKongandT.RowePriceGroup,Inc.
AndrewJ.Keirle(1974)ExecutiveVicePresident
VicePresident,T.RowePriceGroup,Inc.,andT.RowePriceInternational
Unlessotherwisenoted,officershavebeenemployeesofT.RowePriceorT.RowePriceInternationalforatleast5years.
T. Rowe Price Emerging Markets Value Stock Fund

Proof #6
49
T. Rowe Price Emerging Markets Value Stock Fund
Officers (continued)
Name (Year of Birth)Position Held With International funds Principal Occupation(s)
PaulJ.Krug,CPA(1964)VicePresident
VicePresident,T.RowePrice,T.RowePriceGroup,Inc.,andT.RowePriceTrustCompany
ChristopherJ.Kushlis,CFA(1976)VicePresident
VicePresident,T.RowePriceGroup,Inc.,andT.RowePriceInternational
ShengrongLau(1982)VicePresident
VicePresident,PriceSingaporeandT.RowePriceGroup,Inc.
MarkJ.Lawrence(1970)VicePresident
VicePresident,T.RowePriceGroup,Inc.,andT.RowePriceInternational
JacquelineLiu(1979)VicePresident
VicePresident,PriceHongKongandT.RowePriceGroup,Inc.;formerly,InvestmentAnalyst,FidelityInternationalHongKongLimited(to2014)
AnhLu(1968)ExecutiveVicePresident
VicePresident,PriceHongKongandT.RowePriceGroup,Inc.
OxanaLyalina(1987)VicePresident
VicePresident,T.RowePriceInternational;formerly,SeniorAnalyst,GoldmanSachsInternational(to2013)
SebastienMallet(1974)VicePresident
VicePresident,T.RowePriceGroup,Inc.,andT.RowePriceInternational
RyanMartyn(1979)VicePresident
VicePresident,T.RowePriceGroup,Inc.,andT.RowePriceInternational
CatherineD.Mathews(1963)TreasurerandVicePresident
VicePresident,T.RowePrice,T.RowePriceGroup,Inc.,andT.RowePriceTrustCompany
JonathanH.W.Matthews,CFA(1975)ExecutiveVicePresident
VicePresident,T.RowePriceGroup,Inc.,andT.RowePriceInternational
RaymondA.Mills,Ph.D.,CFA(1960)ExecutiveVicePresident
VicePresident,T.RowePrice,T.RowePriceGroup,Inc.,T.RowePriceInternational,andT.RowePriceTrustCompany
JihongMin(1979)VicePresident
VicePresident,PriceSingaporeandT.RowePriceGroup,Inc.
EricC.Moffett(1974)ExecutiveVicePresident
VicePresident,PriceHongKongandT.RowePriceGroup,Inc.
Unlessotherwisenoted,officershavebeenemployeesofT.RowePriceorT.RowePriceInternationalforatleast5years.

Proof #6
50
Officers (continued)
Name (Year of Birth)Position Held With International funds Principal Occupation(s)
SamyB.Muaddi,CFA(1984)ExecutiveVicePresident
VicePresident,T.RowePriceandT.RowePriceGroup,Inc.
TobiasF.Mueller(1980)VicePresident
VicePresident,T.RowePriceGroup,Inc.,andT.RowePriceInternational
JaredT.Murphy(1986)VicePresident
VicePresident,T.RowePrice;formerly,student,StanfordGraduateSchoolofBusiness(to2015);Associate,ShawSpringPartners(to2013)
JoshuaNelson(1977)ExecutiveVicePresident
VicePresident,T.RowePrice,T.RowePriceGroup,Inc.,andT.RowePriceInternational
PhilipA.Nestico(1976)VicePresident
VicePresident,T.RowePriceandT.RowePriceGroup,Inc.
MichaelNiedzielski(1979)VicePresident
VicePresidentT.RowePriceGroup,Inc.,andT.RowePriceInternational;formerly,ManagerandAnalyst,FidelityInvestments,BostonandLondonoffices(to2015)
SridharNishtala(1975)VicePresident
VicePresident,PriceSingaporeandT.RowePriceGroup,Inc.
JasonNogueira,CFA(1974)ExecutiveVicePresident
VicePresident,T.RowePriceandT.RowePriceGroup,Inc.
DavidOestreicher(1967)VicePresident
Director,VicePresident,andSecretary,T.RowePriceInvestmentServices,Inc.,T.RowePriceRetirementPlanServices,Inc.,T.RowePriceServices,Inc.,andT.RowePriceTrustCompany;ChiefLegalOfficer,VicePresident,andSecretary,T.RowePriceGroup,Inc.;VicePresidentandSecretary,T.RowePriceandT.RowePriceInternational;VicePresident,PriceHongKongandPriceSingapore
KennethA.Orchard(1975)ExecutiveVicePresident
VicePresident,T.RowePriceGroup,Inc.,andT.RowePriceInternational
CurtJ.Organt,CFA(1968)VicePresident
VicePresident,T.RowePriceandT.RowePriceGroup,Inc.
PaulT.O’Sullivan(1973)VicePresident
VicePresident,T.RowePriceGroup,Inc.,andT.RowePriceInternational
Unlessotherwisenoted,officershavebeenemployeesofT.RowePriceorT.RowePriceInternationalforatleast5years.
T. Rowe Price Emerging Markets Value Stock Fund

Proof #6
51
T. Rowe Price Emerging Markets Value Stock Fund
Officers (continued)
Name (Year of Birth)Position Held With International funds Principal Occupation(s)
OluwaseunA.Oyegunle,CFA(1984)VicePresident
VicePresident,T.RowePriceGroup,Inc.,andT.RowePriceInternational;formerly,student,TheWhartonSchool,UniversityofPennsylvania(to2013)
GonzaloPángaro,CFA(1968)ExecutiveVicePresident
VicePresident,T.RowePriceGroup,Inc.,andT.RowePriceInternational
VivekRajeswaran(1985)VicePresident
VicePresident,T.RowePriceandT.RowePriceGroup,Inc.
JohnW.Ratzesberger(1975)VicePresident
VicePresident,T.RowePrice,T.RowePriceGroup,Inc.,andT.RowePriceTrustCompany;formerly,NorthAmericanHeadofListedDerivativesOperation,MorganStanley(to2013)
ShannonH.Rauser(1987)AssistantSecretary
Employee,T.RowePrice
MelanieA.Rizzo(1982)VicePresident
VicePresident,T.RowePrice
DavidL.Rowlett,CFA(1975)VicePresident
VicePresident,T.RowePriceandT.RowePriceGroup,Inc.
MarielSantiago(1981)VicePresident
VicePresident,T.RowePriceandT.RowePriceGroup,Inc.;formerly,EquityResearchAnalyst,HSBCSecurities,Inc.(to2014)
FedericoSantilli,CFA(1974)ExecutiveVicePresident
VicePresident,T.RowePriceGroup,Inc.,andT.RowePriceInternational
SebastianSchrott(1977)VicePresident
VicePresident,T.RowePriceGroup,Inc.,andT.RowePriceInternational
DeborahD.Seidel(1962)VicePresident
VicePresident,T.RowePrice,T.RowePriceGroup,Inc.,T.RowePriceInvestmentServices,Inc.,andT.RowePriceServices,Inc.
JohnC.A.Sherman(1969)VicePresident
VicePresident,T.RowePriceGroup,Inc.,andT.RowePriceInternational
GabrielSolomon(1977)VicePresident
VicePresident,T.RowePriceandT.RowePriceGroup,Inc.
Unlessotherwisenoted,officershavebeenemployeesofT.RowePriceorT.RowePriceInternationalforatleast5years.

Proof #6
52
Officers (continued)
Name (Year of Birth)Position Held With International funds Principal Occupation(s)
EunbinSong,CFA(1980)VicePresident
VicePresident,PriceSingaporeandT.RowePriceGroup,Inc.
JoshuaK.Spencer,CFA(1973)VicePresident
VicePresident,T.RowePriceandT.RowePriceGroup,Inc.
DavidA.Stanley(1963)VicePresident
VicePresident,T.RowePriceGroup,Inc.,andT.RowePriceInternational
TaymourR.Tamaddon,CFA(1976)VicePresident
VicePresident,T.RowePriceandT.RowePriceGroup,Inc.
JuYenTan(1972)VicePresident
VicePresident,T.RowePriceGroup,Inc.,andT.RowePriceInternational
SinDeeTan,CFA(1979)VicePresident
VicePresident,T.RowePriceGroup,Inc.,andT.RowePriceInternational
DeanTenerelli(1964)ExecutiveVicePresident
VicePresident,T.RowePriceGroup,Inc.,andT.RowePriceInternational
SibyThomas(1979)VicePresident
VicePresident,T.RowePriceandT.RowePriceGroup,Inc.
JustinThomson(1968)ExecutiveVicePresident
VicePresident,T.RowePriceGroup,Inc.,andT.RowePriceInternational
MitchellJ.K.Todd(1974)VicePresident
VicePresident,T.RowePriceGroup,Inc.,andT.RowePriceInternational
MarkJ.Vaselkiv(1958)ExecutiveVicePresident
VicePresident,T.RowePrice,T.RowePriceGroup,Inc.,andT.RowePriceTrustCompany
RupinderVig(1979)VicePresident
VicePresident,T.RowePriceGroup,Inc.,andT.RowePriceInternational;formerly,Partner,EgertonCapital(to2016);ExecutiveDirector,MorganStanley(to2014)
KesVisuvalingam,CFA(1968)VicePresident
Director,ResponsibleOfficer,andVicePresident,PriceHongKong;Director,ChiefExecutiveOfficer,andVicePresident,PriceSingapore;VicePresident,T.RowePriceGroup,Inc.
VerenaE.Wachnitz,CFA(1978)ExecutiveVicePresident
VicePresident,T.RowePriceGroup,Inc.,andT.RowePriceInternational
Unlessotherwisenoted,officershavebeenemployeesofT.RowePriceorT.RowePriceInternationalforatleast5years.
T. Rowe Price Emerging Markets Value Stock Fund

Proof #6
53
T. Rowe Price Emerging Markets Value Stock Fund
Officers (continued)
Name (Year of Birth)Position Held With International funds Principal Occupation(s)
DavidJ.Wallack(1960)VicePresident
VicePresident,T.RowePrice,T.RowePriceGroup,Inc.,andT.RowePriceTrustCompany
DaiWang(1989)VicePresident
VicePresident,PriceHongKongandT.RowePriceGroup,Inc.;formerly,student,HarvardBusinessSchool(to2014)
MeganWarren(1968)VicePresident
VicePresident,T.RowePrice,T.RowePriceRetirementPlanServices,Inc.,T.RowePriceServices,Inc.,andT.RowePriceTrustCompany;formerly,ExecutiveDirector,JPMorganChase(to2017)
HiroshiWatanabe,CFA(1975)VicePresident
VicePresident,T.RowePriceGroup,Inc.,andT.RowePriceInternational
ChristopherS.Whitehouse(1972)VicePresident
VicePresident,T.RowePriceGroup,Inc.,andT.RowePriceInternational
CliveM.Williams(1966)VicePresident
VicePresident,PriceHongKong,PriceSingapore,T.RowePrice,T.RowePriceGroup,Inc.,andT.RowePriceInternational
J.HowardWoodward,CFA(1974)VicePresident
VicePresident,T.RowePriceGroup,Inc.,andT.RowePriceInternational
MartaYago(1977)VicePresident
VicePresident,T.RowePriceGroup,Inc.,andT.RowePriceInternational
BenjaminT.Yeagle(1978)VicePresident
VicePresident,T.RowePriceandT.RowePriceGroup,Inc.
ErnestC.Yeung,CFA(1979)ExecutiveVicePresident
Director,ResponsibleOfficer,andVicePresident,PriceHongKong;VicePresident,T.RowePriceGroup,Inc.
AlisonMeiLingYip(1966)VicePresident
VicePresident,PriceHongKongandT.RowePriceGroup,Inc.
EricYuan(1984)VicePresident
Employee,T.RowePrice;student,ColumbiaBusinessSchool(to2016);formerlyAnalyst,YulanCapitalManagement(to2014)
WenliZheng(1979)VicePresident
VicePresident,PriceHongKongandT.RowePriceGroup,Inc.
Unlessotherwisenoted,officershavebeenemployeesofT.RowePriceorT.RowePriceInternationalforatleast5years.

Proof #6
F34-050 12/17
STOCk fuNDSDomestic Blue Chip GrowthCapital Appreciation‡
Capital OpportunityDiversified Mid-Cap GrowthDividend GrowthEquity IncomeEquity Index 500Extended Equity Market IndexFinancial ServicesGrowth & IncomeGrowth StockHealth Sciences‡
Media & TelecommunicationsMid-Cap Growth‡
Mid-Cap Value‡
New America GrowthNew EraNew Horizons‡
QM U.S. Small & Mid-Cap Core EquityQM U.S. Small-Cap Growth EquityQM U.S. Value EquityReal EstateScience & TechnologySmall-Cap Stock‡
Small-Cap ValueTax-Efficient Equity Total Equity Market IndexU.S. Large-Cap CoreValue
aSSET aLLOCaTION fuNDSBalanced Global AllocationPersonal Strategy BalancedPersonal Strategy GrowthPersonal Strategy IncomeReal AssetsSpectrum GrowthSpectrum IncomeSpectrum InternationalTarget Date Fundsˆ
BOND fuNDSDomestic TaxableCorporate IncomeCredit OpportunitiesFloating RateGNMA High Yield‡
Inflation Protected BondLimited Duration Inflation
Focused BondNew IncomeShort-Term BondTotal ReturnUltra Short-Term BondU.S. Bond Enhanced IndexU.S. High YieldU.S. Treasury IntermediateU.S. Treasury Long-Term
Domestic Tax-freeCalifornia Tax-Free BondGeorgia Tax-Free BondIntermediate Tax-Free High YieldMaryland Short-Term Tax-Free BondMaryland Tax-Free BondNew Jersey Tax-Free BondNew York Tax-Free BondSummit Municipal IncomeSummit Municipal IntermediateTax-Free High YieldTax-Free IncomeTax-Free Short-IntermediateVirginia Tax-Free Bond
MONEY MaRkET fuNDSTaxableCash Reserves1
Government Money2
U.S. Treasury Money2
MONEY MaRkET fuNDS (cont.)Tax-freeCalifornia Tax-Free Money1
Maryland Tax-Free Money1
New York Tax-Free Money1
Summit Municipal Money Market1
Tax-Exempt Money1
INTERNaTIONaL/GLOBaL fuNDSStockAfrica & Middle EastAsia OpportunitiesEmerging EuropeEmerging Markets StockEmerging Markets Value StockEuropean Stock Global ConsumerGlobal Growth StockGlobal IndustrialsGlobal Real EstateGlobal StockGlobal Technology‡
International Concentrated EquityInternational DiscoveryInternational Equity IndexInternational StockInternational Value EquityJapanLatin AmericaNew AsiaOverseas StockQM Global Equity
BondDynamic Global BondEmerging Markets BondEmerging Markets Corporate BondEmerging Markets Local Currency BondGlobal High Income BondGlobal Multi-Sector BondInternational BondInternational Bond (USD Hedged)
T.RowePriceInvestmentServices,Inc.100EastPrattStreetBaltimore,MD21202
Thispagecontainssupplementaryinformationthatisnotpartoftheshareholderreport.
T. Rowe Price Mutual Funds
201712-295032
Call 1-800-225-5132 to request a prospectus or summary prospectus; each includes investment objectives, risks, fees, expenses, and other information that you should read and consider carefully before investing. ‡Subjecttocertainexceptions,thefundiscurrentlyclosedtonewinvestorsandnewaccounts.
ˆTheTargetDateFundsareinclusiveoftheRetirementFunds,theTargetFunds,andtheRetirementBalancedFund.
1 Retail Funds: You could lose money by investing in the Fund. Although the Fund seeks to preserve the value of your investment at $1.00 per share, it cannot guarantee it will do so. Beginning October 14, 2016, the Fund may impose a fee upon the sale of your shares or may temporarily suspend your ability to sell shares if the Fund’s liquidity falls below required minimums because of market conditions or other factors. An investment in the Fund is not insured or guaranteed by the Federal Deposit Insurance Corporation or any other government agency. The Fund’s sponsor has no legal obligation to provide financial support to the Fund, and you should not expect that the sponsor will provide financial support to the Fund at any time.
2 Government Funds: You could lose money by investing in the Fund. Although the Fund seeks to preserve the value of your investment at $1.00 per share, it cannot guarantee it will do so. An investment in the Fund is not insured or guaranteed by the Federal Deposit Insurance Corporation or any other government agency. The Fund’s sponsor has no legal obligation to provide financial support to the Fund, and you should not expect that the sponsor will provide financial support to the Fund at any time.