Stock Code: BSE NSE Reuters ABRL BO / ABRL NS / … Meet/100303_20131113.pdf · Among the largest...
55
Stock Code: BSE : 500303 NSE : ABIRLANUVO Reuters : ABRL.BO / ABRL.NS / IRYN.LU Bloomberg : ABNL IN / IRIG LX
-
Upload
trannguyet -
Category
Documents
-
view
212 -
download
0
Transcript of Stock Code: BSE NSE Reuters ABRL BO / ABRL NS / … Meet/100303_20131113.pdf · Among the largest...

Stock Code: BSE : 500303 NSE : ABIRLANUVO Reuters : ABRL.BO / ABRL.NS / IRYN.LU Bloomberg : ABNL IN / IRIG LX

2
Aditya Birla Nuvo – A Snapshot 3 – 15
Our businesses :
Financial Services 17
Fashion & Lifestyle 27
Telecom 33
IT-ITeS 36
Manufacturing 38
Annexure 43 – 55
Contents

3
Part of the Aditya Birla Group
The Aditya Birla Group is in league of fortune 500
A USD 42 billion Corporation by revenue size and USD 29 billion Group by Market Cap
Operating in 36 countries in 6 continents with over 50% of revenue flowing from overseas operations
Among the largest and the most reputed business houses in India
Flagship listed companies: Aditya Birla Nuvo (Conglomerate), Grasim & Ultratech (VSF & Cement), Hindalco
- Incl. Novelis (Aluminium & Copper), Idea Cellular (Telecom)
Ranked 4th in global top companies for leaders & 1st in Asia Pacific (Source: Aon Hewitt, Fortune Magazine & RBL -2011)
Anchored by over 136,000 employees belonging to 42 nationalities
Trusted by ~ 1.5 million shareholders and over 125 million customers
In India
Leadership Aluminium, Cement, Carbon Black, VSF, VFY,
Position Branded Apparels, Copper, Chlor-alkali,
Insulators (in terms of production / sales)
Top 3 Telecom (in terms of wireless revenue market share)
Top 5 Life Insurance (in terms of new business premium)
Asset Management (in terms of average AUM)
Global positioning
Aluminium World’s largest aluminium rolling unit
VSF World’s largest manufacturer
Carbon Black World’s largest in terms of capacity
Cement Among top 10 manufacturers in the world
Our Values – Integrity, Commitment, Passion, Seamlessness, Speed

4
Aditya Birla Nuvo : Vision & Mission
Kumar Mangalam Birla
Chairman
Vision
“To be a premium conglomerate building leadership in businesses
and creating value for all the stakeholders”
Mission
• Investing in the promising sectors
• Building leadership in businesses
• A platform to drive synergy of resources
• Delivering best value to all the stakeholders
• To be a responsible corporate citizen

5
Savings led Consumption ledInfrastructure &
Agriculture ledOutsourcing led
Growth Drivers
High rate of savings Rising income levelsHigh rate of
capital formationRising outsourcing trend
Lower penetration of
financial servicesA large young population
Steady economic
reform regime
Highly skilled
human capital
Growing awareness
for financial planningBurgeoning middle class
Investor friendly policies
Increasing FII & FDI flowLow cost destination
Key sectors to
benefitFinancial Services
Telecom, Fashion &
Lifestyle, Textiles,
Automobiles,
Power, Roads,
AgricultureIT-ITeS
ABNL : Well positioned to tap growth opportunities
Aditya Birla Nuvo :
A large eco-system
1995 2013
Revenue 0.2 4.75
Businesses 5
De-risking through portfolio of 15
businesses representing varied sectors
of Indian Economy
Brands ~ 6 ~30
Customers < 1 million Touching lives of 125 million Indians
Employees ~ 13,500Anchored by strong management teams
& about 69,000 employees

6Invested ~ USD 1.5 billion over these years to support growth
Transformation from a Manufacturing Company ..
2000: Foray in Fashion & Lifestyle biz. through acquisition of international brands
2006 : Became largest shareholder in Idea
2005 : Merger of Agri and other Financial Services in ABNL
2001 : Foray in Life Insurance business through JV with Sun Life Canada
2013 : Acquisition of Pantaloons
Divestment of Carbon Black business

7
… to a USD 4.75 billion conglomerate
Manufacturing
Rayon*
Agri*
IT-ITeS^
(99.85%)
Fashion &
Lifestyle
Financial
ServicesTelecom $ #
(25.25%)
Asset Management^
(51%) @
Life Insurance^
(74%) @
Private Equity^
Broking (75%)^
Wealth management^
General Insurance Advisory (50.01%)^
Insulators*
Represent Joint VenturesRepresent Subsidiaries @ JV with Sun Life Financial, CanadaRepresent Divisions # Listed, Aditya Birla Group holds 45.85%* ^ $
Leadership position in India
Leader Top 3 Top 5
Pantaloons^(67.95%)
Madura*
Textiles *
Note : Percentage figures indicated above represent ABNL’s shareholding in its subsidiaries /JV’s
NBFC^

8
Sector Market Position Brand
Financial Services Among top 5 fund managers (excl. LIC)
Fashion & Lifestyle
Largest premium branded apparel player
Largest linen manufacturer
TelecomAmong top 3 cellular operators by revenue
market share
Agri Business
Rayon
Insulators
2nd best energy efficient urea plant
2nd largest manufacturer of VFY
Largest insulators manufacturer
IT-ITeSRanks among top 10 Indian BPO companies by
revenue size
Leadership position across businesses in India

9
Strongly placed in its businesses
Size : Large sizeable player across the businesses
Competitive edge : Well positioned vis-à-vis competition
Operating Performance : Marching on profitable growth
Future Prospects : Capturing opportunities across the businesses to achieve next level of growth
Financial position : Strong standalone balance sheet supporting growth
Return on investment : Earning strong return on investments in most of the businesses

10
Financial snapshot : Consolidated
Earnings growing at robust CAGR
All the businesses are contributing to the
profitable growth
With Idea and Birla Sun Life insurance declaring
dividend, ABNL has started generating return on
its long term investments
Net Profit (` Cr.)
151
(436)
155
822 890
1,059
FY08 FY09 FY10 FY11 FY12 FY13
Revenue (` Cr.)
11,375 14,331 15,523
18,188
21,840
25,490
FY08 FY09 FY10 FY11 FY12 FY13
1,153 867
1,686
2,685
3,259
4,142
FY08 FY09 FY10 FY11 FY12 FY13
EBITDA (` Cr.)

11
Consolidated Mix – FY13
Financial Services
27%
Telecom24%
Fashion & Lifestyle
21%
IT-ITeS10%
Manufacturing 18%
Financial Services
32%
Telecom29%
Fashion & Lifestyle
14%
IT-ITeS8%
Manufacturing 17%
Revenue1EBIT1
Note 1 : Revenue and EBIT Mix is without Carbon Black business. Having received shareholders’ approval, ABNL has accounted for slump sale of the Carbon Black business w.e.f. 1st Apr’13

12
Achieved revenue growth across the businesses
Note 1 : Including full figures of Asset Management business. As per AS27, Asset Management business has been proportionately consolidated @ 50% in ABNL’s financials, being a 50:50 Joint Venture till 9th Oct’12.
Thereafter it is consolidated as subsidiary since ABFS holds 51% w.e.f. 10th Oct’12.
Note 2 : Full financial numbers of Idea Cellular. Being a JV, Idea Cellular has been consolidated at 31.78% from 10th March 2007 upto 12th August 2008, at 27.02% upto 1st March 2010 and
at ~ 25.3% thereafter as per AS 27.
Note 3 : Represents Branded apparels & Accessories (Madura & Pantaloons) and Textiles. In FY13, nine months financials for Pantaloons are included pursuant to its acquisition w.e.f. appointed date 1st July 2012
Note 4 : Represents Agri, Rayon and Insulators. Having received shareholders’ approval, ABNL has accounted for slump sale of the Carbon Black business w.e.f. 1st Apr’13
Revenue
3500
4778
58716313 6550 6390
FY08 FY09 FY10 FY11 FY12 FY13
Financial Services1
1622 1688 18262576
3281
4930
FY08 FY09 FY10 FY11 FY12 FY13
Fashion & Lifestyle3
1677 17771530
1692
2082
2466
FY08 FY09 FY10 FY11 FY12 FY13
IT-ITeS
1662
22121988
2327
3255
4155
FY08 FY09 FY10 FY11 FY12 FY13
Manufacturing4
( ` Crore)
6720
1013112398
15438
1948922407
FY08 FY09 FY10 FY11 FY12 FY13
Telecom2

13
Augmented profitability across the businesses
-351-586
-231
544661
819
FY08 FY09 FY10 FY11 FY12 FY13
Financial Services 1
107
-10466
235339
466
FY08 FY09 FY10 FY11 FY12 FY13
Fashion & Lifestyle3
454
105
193 189
251
FY08 FY09 FY10 FY11 FY12 FY13
IT-ITeS
363
474426 420 406
446
FY08 FY09 FY10 FY11 FY12 FY13
Manufacturing4
EBITDA ( ` Crore)
23763051
3621 3903
5135
6091
FY08 FY09 FY10 FY11 FY12 FY13
Telecom 2
Note 1 : Including full figures of Asset Management business. As per AS27, Asset Management business has been proportionately consolidated @ 50% in ABNL’s financials, being a 50:50 Joint Venture till 9th Oct’12.
Thereafter it is consolidated as subsidiary since ABFS holds 51% w.e.f. 10th Oct’12. Interest cost of NBFC biz., being operating expense as per AS17, is deducted from segmental EBITDA.
Note 2 : Full financial numbers of Idea Cellular. Being a JV, Idea Cellular has been consolidated at 31.78% from 10th March 2007 upto 12th August 2008, at 27.02% upto 1st March 2010 and
at ~ 25.3% thereafter as per AS 27.
Note 3 : Represents Branded apparels & Accessories (Madura & Pantaloons) and Textiles. . In FY13, nine months financials for Pantaloons are included pursuant to its acquisition w.e.f. appointed date 1st July 2012
Note 4 : Represents Agri, Rayon and Insulators. Having received shareholders’ approval, ABNL has accounted for slump sale of the Carbon Black business w.e.f. 1st Apr’13

14
Growth supported by strong Standalone Balance Sheet
Standalone Capital Employed
(` Cr.)
Strong balance sheet : Net Debt to EBITDA @ 2.1x and Net Debt to Equity @ 0.41x as on 30th Sep‟13
Despite more than 70% of standalone capital employed being deployed in long term investments
Led by reduction in debt on account of slump sale of Carbon Black business w.e.f. 1st Apr’13
Dividend / buyback proceeds of ` 294 Cr. from BSLI & realisation of subsidy in Agri business also contributed
Strengthening of the balance sheet will support ABNL‟s investment and capex plans
Equity infusion of ` 671 Cr. by promoters in Nov’13 on conversion of remaining 9.82 million warrants
Investment plan includes funding growth capital requirement of NBFC business
4,982 5,4365,424
5,598 5,857
7,616
3,7673,044
3,4374,696
5,157 2,915
Mar'09 Mar'10 Mar'11 Mar'12 Mar'13 Sep'13
Long Term
Investments
Fixed Assets &
Working Capital
5.8
4.1
3.3 3.6 3.3
2.1
0.87
0.74
0.580.66
0.53
0.41
Mar'09 Mar'10 Mar'11 Mar'12 Mar'13 Sep'13
Net Debt / EBITDA Net Debt / Equity
Standalone Ratios

15
Anchored by a strong Management Team
Business Head/Director Business
Dr. Rakesh Jain Sector Head - Agri,
Insulators, Chemicals
IT-ITeS
Mr. Ajay Srinivasan Financial Services
Mr. Pranab Barua Fashion & Lifestyle
(Madura & Pantaloons)
Mr. Thomas Varghese Textiles
Mr. Lalit Naik VFY , Chemicals, Agri,
Insulators
Mr. Himanshu Kapania Telecom
Whole Time Director & Chief Financial Officer
Mr. Sushil Agarwal
Board of Directors
The Company has a balanced Board, comprising of 3
Executive, 3 Non-Executive and 6 Independent
Directors.
• Each business is run as an independent SBU under the
leadership of a business head
• Chief Financial Officer heads the finance function which
is the life blood for a business
• Business heads and the Chief Financial Officer have
wide-ranging experience in the areas of business
development, strategy formulation, restructuring,
acquisitions, technology management etc.
• Some of the senior management team members, prior
to joining Aditya Birla Group, have also played key roles
in the globally renowned organisations viz., GE,
Prudential Corporation Asia, Hindustan Unilever, Reckitt
Benckiser etc.
• Independent directors have rich experience in their
respective fields and incl. ex-secretary to the President
of India and former top executives from the esteemed
organisations viz., Exim Bank, LIC, IDBI, UTI etc.

16

17
Aditya Birla Financial Services

18
Ranks among top 5 fund managers in India (excl. LIC)
Funds under management @ ~USD 20 billion
Revenue of ~USD 1.2 billion
Anchored by ~14,750 employees & trusted by ~5 mn customers
Nation wide presence through ~1,550 branches / touch points and
~160,000 agents / channel partners
Strong growth in profitability
Generated return on average capital employed of 31% in FY13
Aditya Birla Financial Services (ABFS)
Note 1 : Includes AUM of Life Insurance, Private Equity and quarterly AAUM of Asset Management business
Note 2 : Including full figures of Asset Management business. As per AS27, Asset Management business has been proportionately consolidated @ 50% in ABNL’s financials, being a 50:50 Joint Venture till 9th
Oct’12. Thereafter it is consolidated as subsidiary since ABFS holds 51% w.e.f. 10th Oct’12. Interest cost of NBFC biz., being operating expense as per AS17, is deducted from segmental EBITDA.
-351-586
-231
544661
819
FY08 FY09 FY10 FY11 FY12 FY13
2EBITDA
3500
4778
58716313 6550 6390
FY08 FY09 FY10 FY11 FY12 FY13
2Revenue
5144557825
8347288309 88393
107560
Mar'08 Mar'09 Mar'10 Mar'11 Mar'12 Mar'13
1Funds under Management

19
Aditya Birla Financial Services (ABFS)
Gained market share across the businesses
Strong growth in lending book and assets under management
Business Parameter FY12 FY13
Life Insurance Private sector’s new business premium 7.8% 8.0%
Asset Management Domestic avg. AUM 9.2% 9.4%
Non-life Insurance Advisory Non-life industry premium ~0.5% ~0.9%
Broking Retail cash equity broking 1.16% 1.50%
Business Parameter FY12 FY13
Life Insurance AUM (Y-o-Y growth%) 21,110 22,929 (+9%)
NBFC Book Size (Y-o-Y growth%) 3,425 8,000 (+135%)
Asset Management Avg. AUM - Q4 (Y-o-Y growth%) 66,082 83,451 (+26%)
Wealth Management Avg. assets under advisory 14,000 16,500 (+18%)
Non-life Insurance Advisory Premium placed (Y-o-Y growth%) 304 634 (+108%)
(` Crore) (` Crore / y-o-y growth)

20
Sound fund performance in Asset Management
and Life Insurance businesses
Capital Infusion to support growth in NBFC
Lending book grew from ` 900 Cr. in Mar’10 to
reach ` 8,300 Cr. in Sep’13
A sum of ` 875 Cr. was invested during this period
years to support growth
Returning surplus funds to the shareholders by
Birla Sun Life Insurance (BSLI)
Birla Sun Life Insurance turned profitable in FY11
Distributed interim dividend of ` 98 Cr. in FY12
and ` 197 Cr. in FY13
Distributed final dividend of ` 118 Cr. in Jul’13 and
` 280 Cr. through buyback of shares in Q1FY14
This will support ABNL’s capital commitments
towards the Financial Services business
Aditya Birla Financial Services (ABFS)
2012-13 2011-12
Revenue
Birla Sun Life Insurance 5,037 5,691
Birla Sun Life Asset Management 405 315
Aditya Birla Finance 713 348
Aditya Birla Money 84 88
Aditya Birla Money Mart 76 60
Aditya Birla Insurance Brokers 57 32
Aditya Birla Capital Advisors (PE) 24 21
Elimination (6) (5)
Revenue 6,390 6,550
Earnings before tax 761 600
Net Profit 672 539
` Crore Full Year
Note : Including full figures of Asset Management business. As per AS27, Asset
Management business has been proportionately consolidated @ 50% in ABNL’s
financials, being a 50:50 Joint Venture till 9th Oct’12. Thereafter, it is consolidated as
subsidiary since ABFS holds 51% w.e.f. 10th Oct’12.
21
Birla Sun Life Insurance (BSLI)
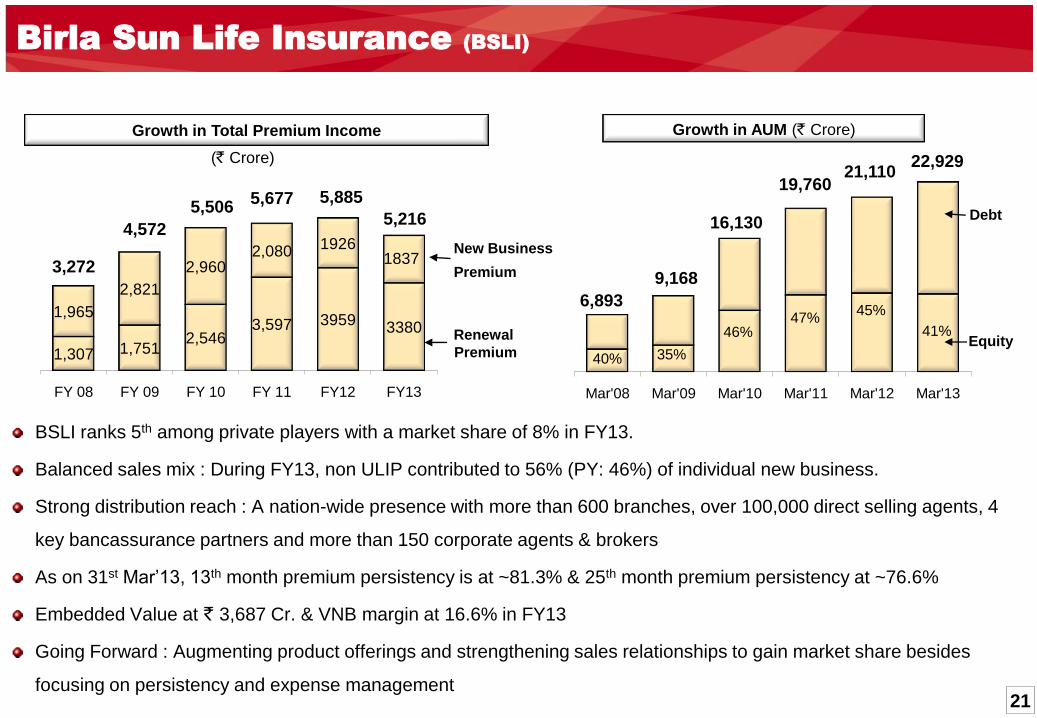
Growth in Total Premium Income Growth in AUM (` Crore)
BSLI ranks 5th among private players with a market share of 8% in FY13.
Balanced sales mix : During FY13, non ULIP contributed to 56% (PY: 46%) of individual new business.
Strong distribution reach : A nation-wide presence with more than 600 branches, over 100,000 direct selling agents, 4
key bancassurance partners and more than 150 corporate agents & brokers
As on 31st Mar’13, 13th month premium persistency is at ~81.3% & 25th month premium persistency at ~76.6%
Embedded Value at ` 3,687 Cr. & VNB margin at 16.6% in FY13
Going Forward : Augmenting product offerings and strengthening sales relationships to gain market share besides
focusing on persistency and expense management
(` Crore)
1,307 1,7512,546
3,597 39593380
1,965
2,821
2,9602,080 1926
1837
FY 08 FY 09 FY 10 FY 11 FY12 FY13
3,272
4,572
5,506
52%
New Business
Premium
Renewal
Premium
5,677 5,885
5,216
19,760
Mar'08 Mar'09 Mar'10 Mar'11 Mar'12 Mar'13
6,893
9,168
16,130
40% 35%
47%
Debt
Equity46%
21,110
45%
22,929
41%

22
1,6261,037
+447+195
- 401- 139 - 63
-367
1,259
•Movement of Embedded Value – FY2012-13
2012-13
EV
3,687
2,428
Dividend
& DDT
Operating
Variance -
Experience
Operating
Variance -
Assumptions
Expense
OverrunVNB*Economic
Variance incl.
Unwinding
2011-12
EV
4,015
2,978 In-force Business Value
Adjusted Net worth
* Value of New Business margin, as % of Individual APE (Annual Premium Equivalent) is 16.6% for 2012-13
4,054
2012-13
EV (before dividend
distribution)
2,428

23
Birla Sun Life Asset Management (BSAMC)
Growth in AUM (` Crore)
17 years + journey of continued wealth creation
Ranked 4th in India with market share of 9.4% in Q4FY13
Registered 2nd highest y-o-y growth rate among top 5 players
Building alternate assets : Maiden Real Estate Onshore Fund of ` 1,060 Cr.
Expanding International Presence : Set up offices in Dubai & Singapore
Offshore AUM grew to ~USD 900 million
Posted revenue at ` 405 Cr. & Net profit at ` 73 Cr. in FY13
Going forward : Growing profitable assets with a thrust on improving distribution efficiency and fund performance
1Equity AUM (Domestic & Offshore) + PMS + Real Estate Onshore Fund
28,38142,489
52,902 52,383 50,543 66,284 69,336 16,171
6,168
13559 15,285 15,539
17,167 17,512
Mar'08 Mar'09 Q4FY10 Q4FY11 Q4FY12 Q4FY13 Q1FY14
44,552
66,461
48,657
Equity & Alternate Assets1
Debt & Liquid
67,66866,082
83,45186,849

24
Financials
•Birla Sun Life Asset Management
` Crore 2012-13 2011-12
New Business Premium
Individual Business 1,048 1,250
Group Business 788 676
New Business Premium (Gross) 1,837 1,926
Renewal Premium (Gross) 3,380 3,959
Premium Income (Gross) 5,216 5,885
Less : Reinsurance ceded & Service tax (313) (261)
Premium Income (Net) 4,903 5,624
Other Operating Income 134 67
Revenue 5,037 5,691
Earnings before tax 542 461
Net Profit 542 461
Capital 2,450 2,450
Assets under management 22,929 21,110
Q4FY13 Q4FY12
Equity 10,860 10,631
Debt & Liquid 66,284 50,543
Domestic AUM 77,144 61,174
Off shore 4,600 3,368
PMS 643 461
Real Estate Fund 1,063 1,078
Total AUM 83,451 66,082
2012-13 2011-12
Revenue (Fee Income) 405 315
Earnings before tax 107 89
Net Profit 73 59
Average AUM ` Crore
` Crore
Revenues
Birla Sun Life Insurance Birla Sun Life Asset Management

25
Aditya Birla Finance (NBFC)
Closing book as on 30th Sep’13 grew by 61% y-o-y to reach ~ ` 8,300 Cr.
All the segments are contributing to the growth
Net worth as on 30th Sep’13 is ` 1,381 Cr. (Mar’12: ` 628 Cr.)
Share Capital of ` 575 Cr. was infused in past 18 months to
support growth.
The business is growing at a good pace and will require further
capital for future growth
Scaling up the book size while keeping risk under control
Posted revenue at ` 713 Cr. & Net profit at ` 100 Cr. in FY13
Capital Infusion (` Crore)
- - 225 75 350 225
600 9001,850
3,425
8,000 8,300
Mar'09 Mar'10 Mar'11 Mar'12 Mar'13 Sep'13
Growth in Lending book
(` Crore)~
~
~
~~ ~
Key business metrics
H1FY13
(PY)
H1FY14
(CY)
Net Interest Income (incl. fee income) (%) 5.8% 5.1%
Opex to NII Ratio (%) 44% 30%
Return on Avg. Net Worth (p.a.) (%) 12.7% 13.7%
Return on Avg. Assets (p.a.) (%) 2.0% 1.9%
Gross NPA (as % of total loans & advances) 1.6% 1.9%
Net NPA (as % of total loans & advances) 1.3% 1.3%
Revenue (` Crore) 286 550
Net Profit (` Crore) 40 78
Net Worth (` Crore) 769 1,381
Borrowings (` Crore) 4,547 7,068
Leverage (x) 5.92x 5.12x
Capital Market 29%
Infra Financing
27%
Mortgage*23%
Others2%
Corporate Finance
19%
Lending book as on 30th Sep‟13 : Break-up
* LAP / LRD & Construction Finance

26
Other Financial Services
Aditya Birla Private Equity : Of ` 1,179 Cr. corpus, ABPE has deployed / committed ~60% of the deployable surplus
ABPE Fund I (Size : ` 881 Cr.) has invested in Anupam Industries, Bombay Stock Exchange, Credit Analysis &
Research Ltd., GEI Industrial systems, Alphion India Pvt. Ltd., Trimax IT Infrastructure & Services and Ratnakar Bank
Sunrise Fund (Size : ` 299 Cr.) : Investment made in SMS Paryavaran Ltd., Olive Bar and Kitchen Ltd. and Tree
House Education & Accessories Ltd.
Aditya Birla Money : is a retail broking company with nationwide network of more than 900 touch points (including
franchisees) serving over 300,000 customers across more than 150 cities
Aditya Birla Money Mart : A large corporate mutual fund distributor in India having Assets under Advisory of about
` 100 billion (Sep’13) and a nationwide presence with 21 branches and ~16,000 channel partners
Aditya Birla Insurance Brokers : A leading non-life insurance broking company in India. The premium placement
more than doubled year on year to ` 634 Crore in FY13
2012-13 2011-12 2012-13 2011-12 2012-13 2011-12 2012-13 2011-12
Revenue 24 21 84 88 76 60 57 32
Earnings before tax 9 6 (15) (19) (2) (21) 16 9
Net Profit / (Loss) 6 4 (15) (18) (2) (21) 11 6
` Crore
Aditya Birla Capital
Advisors (Private Equity)
Aditya Birla Money Mart
(Wealth Management)
Aditya Birla Insurance
Brokers (General
Insurance Advisory)
Aditya Birla Money
(Broking)

27
Fashion & Lifestyle

28
The largest branded apparel player in India selling one apparel every
second
Largest manufacturer of linen fabric in India
Nationwide reach through a large controlled retail presence of 1,587
stores spanning across 4.1 million sq. ft. as on 30th Sep’13
Besides, reaching customers through more than 4,750 MBOs &
Department Stores.
Combined revenue (annualised)1 of ~USD 1 billion
Generated return on operating capital employed @ 25% in FY13
Fashion & Lifestyle
Business EBOs /
Stores
Retail
Space (million sq. ft.)
Madura 1,405 2.01
Pantaloons (incl.
Factory Outlets)97 1.96
Jayashree Textiles (Linen Club)
85 0.1
1,587 4.1
1FY13 includes nine months financials of Pantaloons Fashion business acquired w.e.f. the appointed date 1st July 2012
Madura51%
Pantaloons26%
Jayashree23%
Revenue mix1 (FY13)
(For 9 months
Jul’12-Mar’13)
1622 1688 18262576
3281
4930
FY08 FY09 FY10 FY11 FY12 FY13
Revenue1
107
-10466
235339
466
FY08 FY09 FY10 FY11 FY12 FY13
EBITDA1
2
2FY13 EBITDA excludes interest income of ` 62 Cr. on current investments to make performance comparable

29
1,026 1,116
1,251
1,811 2,239
2,523
FY08 FY09 FY10 FY11 FY12 FY13
Madura Fashion & Lifestyle
Revenue (` Cr.)
39
(158)
(4)
136
196 245
FY08 FY09 FY10 FY11 FY12 FY13
EBITDA (` Cr.)
Madura Fashion & Lifestyle is the largest branded apparel player in India
Strong Brands : Louis Philippe, Van Heusen, Allen Solly, Peter England,
Collective, Plant Fashion, People
Louis Philippe & Van Heusen are the best selling brands in India
EBITDA margin of brands enhanced to 11.5% in FY13 (PY:10.2%)
Revenue doubled in past 3 years to cross ` 2,500 Cr. mark – growing @
CAGR of 26% while capital employed is managed at similar levels –
leading to ROACE expansion from 11% in FY11 to 29% in FY13
Expanding retail channel to strengthen market leadership
Besides these EBOs, Madura is reaching customers through more than
1,750 MBOs & Department Stores
•Retail Channel
895 1,129
1,272 1,405
Mar'11 Mar'12 Mar'13 Sep'13
1.271.64
1.86 2.01
Retail Space (Million Sq Ft)
No. of EBOs
30
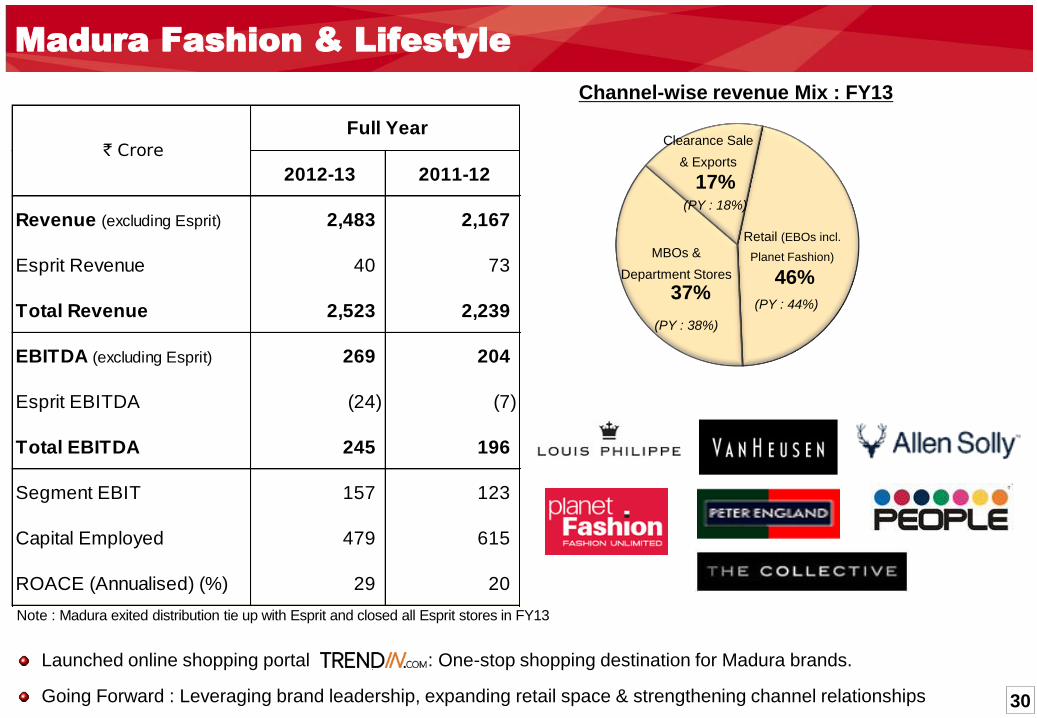
Madura Fashion & Lifestyle
46%37%
17%
Channel-wise revenue Mix : FY13
Clearance Sale
& Exports
Retail (EBOs incl.
Planet Fashion)MBOs &
Department Stores
(PY : 38%)
(PY : 44%)
(PY : 18%)
2012-13 2011-12
Revenue (excluding Esprit) 2,483 2,167
Esprit Revenue 40 73
Total Revenue 2,523 2,239
EBITDA (excluding Esprit) 269 204
Esprit EBITDA (24) (7)
Total EBITDA 245 196
Segment EBIT 157 123
Capital Employed 479 615
ROACE (Annualised) (%) 29 20
` Crore
Full Year
Launched online shopping portal : One-stop shopping destination for Madura brands.
Going Forward : Leveraging brand leadership, expanding retail space & strengthening channel relationships
Note : Madura exited distribution tie up with Esprit and closed all Esprit stores in FY13

31
Pantaloons Fashion & Retail Ltd.
Pantaloons : Posted revenue1 at ` 1,285 Cr. & EBITDA^ at ` 67 Cr. (incl. 9 months financials of the acquired Pantaloons business)
Gross margin was sustained, however, moderated sales growth and higher sellex impacted EBITDA
One time costs on account of change in accounting policy also lowered profitability
Customer reach stands expanded to 72 Pantaloons stores & 25 Factory Outlets across 1.96 million sq. ft.
Added 5 new Pantaloons stores during H1FY14
Refinancing of debt to optimize finance costs : Utilised current investments of ` 800 Cr. in Q1 and raised term loans
of ` 600 Cr. & NCDs of ` 300 Cr. to repay high cost debt
Menswear35%
Womenswear38%
Kidswear9%
Non-apparel18%
Revenue Mix (FY13)
2012-13
(Including nine
months financials
of Pantaloons)
Revenue 1,285
EBITDA^ 67
Finance Cost^ 82
Depreciation 54
Net Profit / (Loss) (69)
Net of interest income of ` 62 Cr. on current investments
` Crore
1
1FY13 includes nine months financials of Pantaloons Fashion business acquired w.e.f. the appointed date 1st July 2012
` Crore As on
31st Mar'13
Net Fixed Assets 488
Goodwill 1,168
Net Working Capital 44
Capital Employed 1,700
Net Worth 770
Net Debt# 931
# Net of current investments of ` 800 Cr.

32
Jaya Shree Textiles (JST) is the domestic market leader in Linen segment
Branding & promoting linen fabric under “Linen Club”
Focus on high margin linen fabric OTC segment
Contributes to 50% of total linen fabric sales
One of the largest player in Wool segment in India
Revenue crossed ` 1,100 Cr. mark
ROACE improved considerably: Earnings doubled in past 3 years while capital employed is managed at a lower level.
To capitalise on buoyant demand in the linen segment, JST has expanded linen yarn capacity from 2,300 TPA to 3,400
TPA in Q2FY14 & targets to expand linen fabric processing capacity from 7.3 million meters to 10.1 million meters by the
end of Q3FY14
Jaya Shree Textiles
600 573 577
774
1,0461,144
FY08 FY09 FY10 FY11 FY12 FY13
Revenue (` Cr.)
6854
69
99141
154
11.3%9.5%
12.0% 12.8%
13.4% 13.5%
FY08 FY09 FY10 FY11 FY12 FY13
EBITDA (` Cr.) OPM(%)
359 345
281
198
88
179
15% 9%15%
32%
82%
97%
FY08 FY09 FY10 FY11 FY12 FY13
Capital Employed (` Cr.) ROACE (%)

33
Telecom

34
Idea Cellular (Telecom)
672010131
1239815438
1948922407
FY08 FY09 FY10 FY11 FY12 FY13
Revenue (` Cr.)
Having a market cap of ~USD 9 billion, Idea is the biggest revenue market share gainer in India since past four years
Ranks 3rd in terms of pan India revenue market share1 at 15.7% up from 15% a year ago.
Contributed to 22% of industry’s incremental mobile revenue1 in FY13
Ranks among top 10 players globally with total Minutes of voice usage of about 1.6 billion per day
Base of 127 mn subscribers provides a platform for upgrading pure voice customers to wireless data services in future
Winner of 3G spectrum in 11 service areas which contribute more than 75% of Idea’s existing 2G revenue
Idea holds 16% stake in the world’s largest Indus Towers
Strong balance sheet & cash profit to support growth :Standalone Net Debt/EBITDA 1.33 & Net Debt/Equity 0.61 (Sep’13)
Generated cash profit of ` 4,697 Cr. in FY13 attaining 30% y-o-y growth
Maiden dividend proposed @ 3% of share capital : Overall payout of ` 116 Cr. (incl. dividend distribution tax)
ROACE (annualised) improved y-o-y from 9% to 13% in H1FY14
11.7%12.6%
13.6%15.0%
15.7%
Q4FY09 Q4FY10 Q4FY11 Q4 FY12 Q4 FY13
Revenue Market Share1
23763051
3621 3903
5135
6091
FY08 FY09 FY10 FY11 FY12 FY13
EBITDA (` Cr.)
1Based on gross revenue for UAS & Mobile licenses only, as released by TRAI

35
Idea Cellular (Telecom)
Currently, 30.9 million subscribers use mobile data services, contributing 7.2% of total service revenue in Q1FY14
As on 30th Apr’13, Idea has around 98.1% of reported subscribers as active subscribers, highest in the industry.
Going forward: Capitalising on brand !DEA, consolidating position in voice market & expanding in evolving wireless
broadband business
10.4 8.8 9.5 9.07.2
10.1
FY08 FY09 FY10 FY11 FY12 FY13
Mar'08 Mar'09 Mar'10 Mar'11 Mar '12 Mar '13
35
133 114
123131 143
65
89
79121
133140
Net Worth
Total Debt
Strong Balance Sheet (Figures in ` billion)
4,76310,114 24,793
49,86066,187 73,668
96,015 107,234
Mar'06 Mar'07 Mar'08 Mar'09 Mar'10 Mar'11 Mar '12 Mar '13
Subscribers (In Million)
Cell Sites: Capacity grew multifold
Robust growth in MOUs (billion minutes)
21 46 86 165 243363 453 532
FY06 FY07 FY08 FY09 FY10 FY11 FY12 FY13
7.4 14.0 24.043.0
63.889.5
112.7 121.6 127.2
Mar'06 Mar'07 Mar'08 Mar'09 Mar'10 Mar'11 Mar '12 Mar '13 Sep'13
Net Profit (` billion)

36
IT-ITeS

37
Aditya Birla Minacs (IT-ITeS)
Ranks among top 10 Indian BPO companies by revenue size (Source: NASSCOM)
A global solution provider serving > 100 clients through 36 centres in US, Canada, Europe, India & Philippines
Employees base of 20,500 (North America : ~8,000, APAC : 12,500) as on 31st Mar’13
Revenue reaches near to ` 2,500 Cr. mark in FY13 and EBITDA margin improved y-o-y from 9.1% to 10.2%
On constant currency2 basis, revenue grew y-o-y by 8% & EBITDA by 13% during FY13
Net profit surged by 80% from ` 70 Cr. to ` 125 Cr. in FY13
Generating steady cash profits to fund its capex and working capital requirements
Net Debt as on 31st Mar’13 at ` 977 Cr. stands reduced y-o-y by ` 129 Cr.
Operating at ROACE of 11.5% in FY13 at capital employed of ` 1,449 Cr. (PY : ` 1,399 Cr.)
Going Forward : Enhancing profitability with focus on operational efficiencies to improve margins.
1677 17771530
1692
2082
2466
FY08 FY09 FY10 FY11 FY12 FY13
Revenue (` Cr.)
454
105
193 189
251
FY08 FY09 FY10 FY11 FY12 FY13
1
EBITDA (` Cr.)
1Received employment incentive arrears of ` 25 Cr. in 2010-11
US77%
Canada14%
Asia Pacific
6%
Europe3%
Revenue Mix by Customer Location
2Normalising for CAD/INR translation impact due to forex movement

38
Manufacturing

39
Manufacturing Businesses
Revenue
FY12 FY13Business
EBITDA
FY12 FY13Remarks on profitability
2,107 2,924 Agri 211 197Lower urea sales volume and higher energy costs due to
planned maintenance shutdown
680 777 Rayon 128 189 Higher VFY & ECU realisation and growth in volumes
468 454 Insulators 67 61 Sales volume & margins were impacted due to cheaper imports
3,255 4,155 Total 406 446 Revenue grew by 28% and EBITDA by 10%
1,943 2,036 Carbon Black2 204 132Constrain on sales volume & margins due to cheaper imports
and lower off-take from tyre manufacturers
5,198 6,191 611 579
Revenue1 grew by 28% to ` 4,155 Cr. in FY13
EBITDA1 is up by 10% to ` 446 Cr.
Operating at an ROACE1 of 15.4%
2Having received shareholders approval, ABNL has accounted for slump sale of the Carbon Black business, w.e.f. 1st April 2013
1Agri, Rayon and Insulators

40
Acute deficit of urea in India – Approx. 25% of the demand is imported
Indo Gulf Fertilisers has 10-20% market share in the target markets
of Uttar Pradesh, Bihar, Jharkhand and West Bengal
Strong brand “ Birla Shaman” is preferred choice of farmers
Also offering value adding variety – Neem coated “Krishi Dev”
A complete agri-solutions provider – Fertilisers, Seeds, Pesticides
Capital employed in FY13 increased primarily due to higher outstanding subsidy owing to slower recovery, rise in natural
gas prices & increase in trading sales of imported P&K fertilisers. Trading in imported P&K fertilisers has been
discontinued in FY14.
Outstanding subsidy and receivables reduced q-o-q from ` 1,632 Cr. in Mar’13 to ` 828 Cr. in Sep’13.
Indo Gulf Fertilisers (Agri-business)
102
228
155176
211 19713%
18%
15% 14%
10%
7%
FY08 FY09 FY10 FY11 FY12 FY13
EBITDA (` Cr.) OPM(%)
531 587
307496
984
1,854
18%
38%31%
39%
26%12%
FY08 FY09 FY10 FY11 FY12 FY13
Capital Employed (` Cr.) ROACE (%)
7871,250
1,0221,244
2,107
2,924
8701073 1106 1099
1152
1091
FY08 FY09 FY10 FY11 FY12 FY13
Revenue (` Cr.) Sales ('000 MT)

41
2nd largest producer of VFY in India with ~39% domestic production share and capacity of 19,800 tons p.a.
Largest Indian VFY exporter for consecutive 8th year
with ~48% share in VFY exports from India in FY13
Integrated facilities : Cost effective 34.5 MW captive power plant
VFY has a niche market globally
Premium is driven by quality and value added yarns
Expanded its presence in fine & superfine VFY segment using Spool Technology from Germany at a capex of ~ ` 270 Cr.
in Mar’13. New VFY plant has been commissioned and is targeting full capacity utilisation by the end of FY14. New
capacity will help in enhancing product quality and range, especially in superfine segment.
Increase in capital employed in FY13 is primarily on account of VFY capacity expansion. ROACE improved to 26%
Indian Rayon (VFY and Chemicals)
454437
430
440515
681
20%20%
28%
17%19%
26%
FY08 FY09 FY10 FY11 FY12 FY13
Capital Employed (` Cr.) ROACE (%)
476537 538 565
680 777
17923 16792 16616 1559216183 16806
FY08 FY09 FY10 FY11 FY12 FY13
Revenue (` Cr.) VFY Sales Volume (MT)
124 123155
110 128
189
26%23%
29%
19%19% 24%
FY08 FY09 FY10 FY11 FY12 FY13
EBITDA (` Cr.) OPM(%)

42
Used in power generation, Transmission & distribution (T&D) and by Original Equipment Manufacturers (OEMs)
Aditya Birla Insulators is largest domestic producer & 4th largest globally with a capacity of 45,260 TPA at two plants
Power Grid corporation of India & State Electricity Boards , ABB, Areva, Siemens etc. are amongst major customers
Insulators industry’s domestic sales volume de-grew y-o-y by 15% during Apr’12-Feb’13 (Source : IEEMA)
Deferment of projects coupled with cheaper imports from China impacted sales and margins across the industry
Liquidity crunch in the power sector is also restricting dispatches
Aditya Birla Insulators contained de-growth in its volumes to 8% during the year
Finance Ministry has imposed safeguard duty of 35% on insulators imports from China from 20th Dec’12 to 19th Dec’13
and then 25% till 31stDec’13. Benefit of imposition of safeguard duty will not accrue immediately due to accelerated
imports of insulators in anticipation of duty.
Aditya Birla Insulators
136 123 116134
67 61
34%29% 27% 26%
14% 13%
FY08 FY09 FY10 FY11 FY12 FY13
EBITDA (` Cr.) OPM(%)
240 264294
362 375 395
58%43% 35% 34% 12% 10%
FY08 FY09 FY10 FY11 FY12 FY13
Capital Employed (` Cr.) ROACE (%)
399 425 428518
468 454
32304 3256137050
44281
39024 35889
FY08 FY09 FY10 FY11 FY12 FY13
Revenue (` Cr.) Sales Volumes (MT)

43

44
Segmental Revenue & EBIT - Consolidated( ` Crore)
Consolidated
2012-13 2011-12 2012-13 2011-12
6,295 6,392 Aditya Birla Financial Services 706 541
5,037 5,691 Life Insurance 542 461
1,258 702 Other Financial Services* 165 80
5,662 4,933 Telecom (Nuvo's share) @ 639 534
4930 3281 Apparels & Textiles 299 242
3,802 2,243 Branded Apparels & Accessories 170 125
1,144 1,046 Textiles 129 117
(16) (8) Inter-segment Elimination - -
2,466 2,082 IT-ITeS 164 111
4155 3255 Manufacturing 369 329
2,924 2,107 Agri-business 177 192
777 680 Rayon 153 92
454 468 Insulators 39 46
2,036 1,943 Carbon Black 93 164
(54) (46) Inter-segment Elimination - -
25,490 21,840 Segmental EBIT 2,270 1,921
Revenue EBIT
* Other Financial Services include Asset Management (proportionately consolidated at 50%, being a 50:50 JV till 9th Oct’12 and thereafter consolidated as subsidiary since ABFS holds
51% w.e.f. 10th Oct’12), NBFC, Private Equity, Broking, Wealth Management & General Insurance Advisory. Interest cost of NBFC business, being an operating expense as per AS
17, is deducted from Segmental EBIT
@ Idea is consolidated at ~25.3%
45
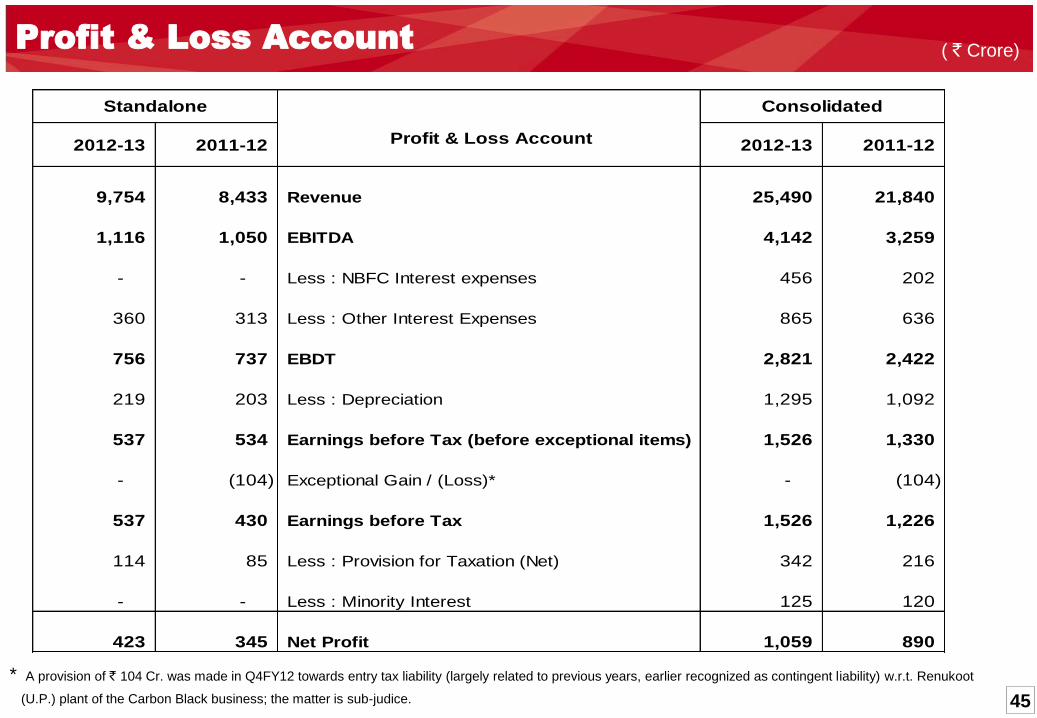
Profit & Loss Account ( ` Crore)
2012-13 2011-12 2012-13 2011-12
9,754 8,433 Revenue 25,490 21,840
1,116 1,050 EBITDA 4,142 3,259
- - Less : NBFC Interest expenses 456 202
360 313 Less : Other Interest Expenses 865 636
756 737 EBDT 2,821 2,422
219 203 Less : Depreciation 1,295 1,092
537 534 Earnings before Tax (before exceptional items) 1,526 1,330
- (104) Exceptional Gain / (Loss)* - (104)
537 430 Earnings before Tax 1,526 1,226
114 85 Less : Provision for Taxation (Net) 342 216
- - Less : Minority Interest 125 120
423 345 Net Profit 1,059 890
Standalone
Profit & Loss Account
Consolidated
* A provision of ` 104 Cr. was made in Q4FY12 towards entry tax liability (largely related to previous years, earlier recognized as contingent liability) w.r.t. Renukoot
(U.P.) plant of the Carbon Black business; the matter is sub-judice.

46
6,854 5,679 Net Worth 9,384 7,517
- - Minority Interest 940 301
4,005 4,457 Debt 11,799 9,224
- - NBFC borrowings 6,903 2,973
155 158 Deferred Tax Liabilities (Net) 428 317
11,014 10,294 Capital Employed 29,455 20,331
- -
Policyholders' funds (Incl. funds
for future appropriation) 21,576 19,964
11,014 10,294 Total Liabilities 51,031 40,295
2,226 1,976 Net Block (Incl. Capital Advances) 10,710 9,385
- - Goodwill 4,793 3,146
- - NBFC Lending 8,000 3,425
2,577 2,012 Net Working Capital 1,837 1,177
5,857 5,598 Long Term Investments 354 319
- - Life Insurance Investments 22,929 21,110
- - Policyholders' Investments 21,559 20,095
- - Shareholders' Investments 1,371 1,015
353 707 Cash Surplus & Current Investments 2,409 1,733
570 500 Book Value (`) 781 662
3.3 3.6 Net Debt / EBITDA (x) 2.3 2.3
0.53 0.66 Net Debt / Equity (x) 1.00 1.00
11,727 10,723 Market Capitalisation - NSE
Mar-13
Consolidated
Mar-12Mar-12 Mar-13
Standalone
Balance Sheet
Balance Sheet ( ` Crore)
Excluding MTM gain of ` 22 Cr. as on 31st Mar’13 and MTM loss of ` 104 Cr. as on 31st Mar’12 w.r.t. fully hedged foreign currency working capital debt
47
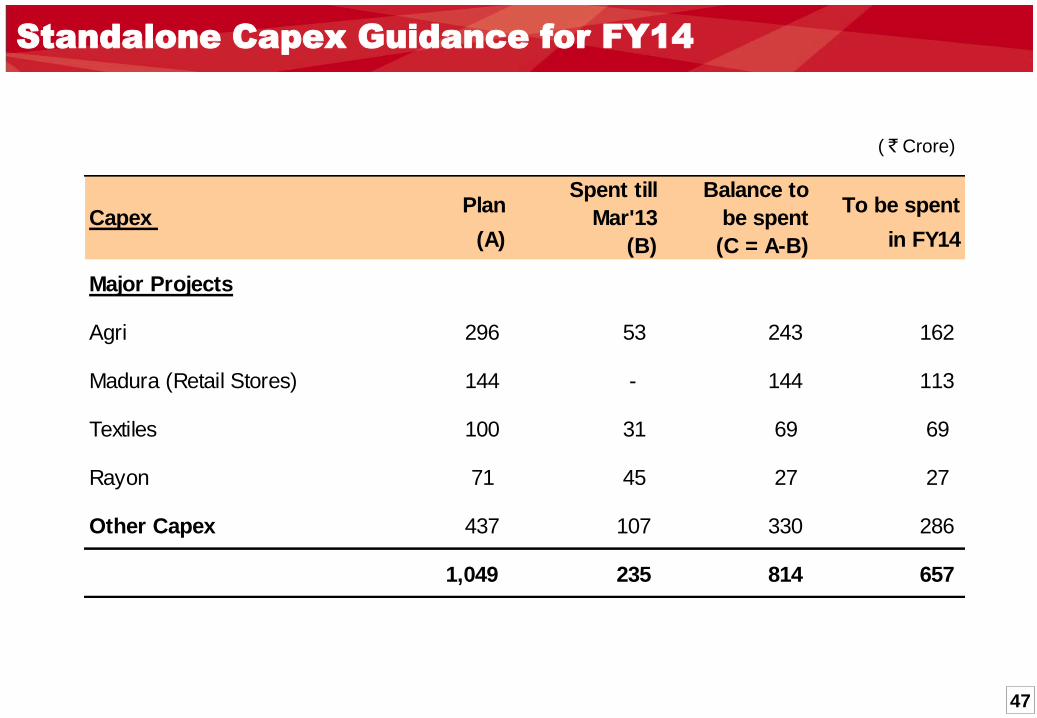
Standalone Capex Guidance for FY14
( ` Crore)
Plan To be spent
(A) in FY14
Major Projects
Agri 296 53 243 162
Madura (Retail Stores) 144 - 144 113
Textiles 100 31 69 69
Rayon 71 45 27 27
Other Capex 437 107 330 286
1,049 235 814 657
Capex
Balance to
be spent
(C = A-B)
Spent till
Mar'13
(B)

48

49
Consolidated Revenue
* Other Financial Services include Asset Management (proportionately consolidated at 50%, being a 50:50 JV till 9th Oct’12 and thereafter consolidated as subsidiary since ABFS holds 51% w.e.f.
10th Oct’12), NBFC, Private Equity, Broking, Wealth Management & General Insurance Advisory.
( ` Crore)
@ Idea is consolidated at ~25.3%
^ Accounted for slump sale of Carbon Black business w.e.f 1st April 2013
Quarter - 1 Revenue
2013-14 2012-13
(PY)
2013-14
(CY)
2012-13
(PY)
2013-14
(CY)
1,366 1,438 1,526 Aditya Birla Financial Services 2,755 2,892
895 1,177 1,083 Life Insurance 2,265 1,979
474 263 446 Other Financial Services* 493 920
(4) (2) (3) Elimination (4) (7)
1,651 1,343 1,596 Telecom (Nuvo's share) @ 2,736 3,247
1,294 1,376 1,613 Fashion & Lifestyle 2,204 2,907
982 1,090 1,303 Branded Apparels & Accessories 1,614 2,285
313 288 311 Textiles 592 624
(1) (1) (1) Elimination (2) (2)
658 628 774 IT-ITeS 1,227 1,431
786 1,165 994 Manufacturing 1,806 1,780
487 864 664 Agri-business 1,209 1,151
204 188 213 Rayon 374 418
95 112 116 Insulators 223 211
- 494 - Carbon Black^ 1,052 -
(11) (10) (10) Inter-segment Elimination (22) (21)
5,744 6,435 6,493 Consolidated Revenue 11,757 12,237
Half YearQuarter 2

50
Consolidated EBIT
* Other Financial Services include Asset Management (proportionately consolidated at 50%, being a 50:50 JV till 9th Oct’12 & thereafter consolidated as subsidiary since ABFS holds 51% w.e.f. 10th Oct’12),
NBFC, Private Equity, Broking, Wealth Management & General Insurance Advisory. Interest cost of NBFC business, being an operating expense as per AS 17, is deducted from Segmental EBIT
( ` Crore)
@ Idea is consolidated at ~25.3%
^ Accounted for slump sale of Carbon Black business w.e.f 1st April 2013
Quarter - 1 EBIT
2013-14 2012-13
(PY)
2013-14
(CY)
2012-13
(PY)
2013-14
(CY)
220 177 156 Aditya Birla Financial Services 359 376
136 145 75 Life Insurance 292 210
84 32 81 Other Financial Services* 67 166
238 144 225 Telecom (Nuvo's share) @ 297 463
25 94 102 Fashion & Lifestyle 137 128
(7) 61 72 Branded Apparels & Accessories 65 65
32 33 30 Textiles 72 63
38 41 44 IT-ITeS 72 82
63 113 96 Manufacturing 186 159
15 61 40 Agri-business 86 55
41 37 43 Rayon 76 84
7 14 13 Insulators 24 21
- 15 - Carbon Black^ 57 -
584 584 624 Segmental EBIT 1,109 1,208
Half YearQuarter 2

51
Consolidated Profit & Loss ( ` Crore)
* Book gain of ` 24 Cr. and a net tax credit of ` 41 Cr. has been recognized in Q1FY14 w.r.t. the slump sale of Carbon Black business
Quarter - 1
2013-14 2012-13
(PY)
2013-14
(CY)
2012-13
(PY)
2013-14
(CY)
5,744 6,435 6,493 Revenue 11,757 12,237
1,174 1,039 1,203 EBITDA 1,955 2,377
166 95 176 Less : NBFC Interest expenses 176 342
211 234 181 Less : Other Interest Expenses 400 392
797 710 847 EBDT 1,379 1,643
388 321 384 Less : Depreciation 616 772
409 389 463 Earnings before Tax (before exceptional items) 763 872
24 - - Exceptional Gain / (Loss)* - 24
433 389 463 Earnings before Tax 763 896
77 73 155 Less : Provision for Taxation (Net)* 139 233
24 33 17 Less : Minority Interest 73 41
331 284 290 Net Profit 551 621
Quarter 2 Half Year Consolidated
Profit & Loss Account

52
7,335 6,854 Net Worth 10,211 9,384
- - Minority Interest 741 940
3,110 4,005 Debt 8,874 11,799
- - NBFC borrowings 7,068 6,903
86 155 Deferred Tax Liabilities (Net) 468 428
10,531 11,014 Capital Employed 27,362 29,455
- -
Policyholders' funds (Incl. funds
for future appropriation) 21,143 21,576
10,531 11,014 Total Liabilities 48,505 51,031
1,756 2,206 Net Block (Incl. Capital Advances) 10,306 10,677
20 20 Goodwill 5,096 4,825
- - NBFC Lending 8,300 8,000
1,000 2,577 Net Working Capital 474 1,837
7,616 5,857 Long Term Investments 365 354
- - Life Insurance Investments 22,381 22,929
- - Policyholders' Investments 21,217 21,559
- - Shareholders' Investments 1,164 1,371
139 353 Cash Surplus & Current Investments 1,584 2,409
610 570 Book Value (`) 849 781
2.1 3.3 Net Debt / EBITDA (x) 1.5 2.3
0.41 0.53 Net Debt / Equity (x) 0.71 1.00
14,939 11,727 Market Capitalisation - NSE
Sep-13
Consolidated
Mar-13Mar-13 Sep-13
Standalone
Balance Sheet
Balance Sheet ( ` Crore)
Excluding MTM gain of ` 22 Cr. as on 31st Mar’13 and MTM loss of ` 28 Cr. as on 30th Sep’13 w.r.t. fully hedged foreign currency working capital debt
Note : Standalone capex of ` 224 Cr. was incurred during H1FY14

53
Standalone Profit & Loss ( ` Crore)
* Book gain of ` 24 Cr. and a net tax credit of ` 41 Cr. has been recognized in Q1FY14 w.r.t. the slump sale of Carbon Black business
Quarter - 1 Standalone
Profit & Loss Account
2013-14 2012-13
(PY)
2013-14
(CY)
2012-13
(PY)
2013-14
(CY)
1,701 2,562 2,132 Revenue 4,599 3,833
315 271 392 EBITDA 485 707
64 96 66 Interest Expenses 182 129
251 175 326 EBDT 303 577
46 52 51 Depreciation 102 97
205 124 275 Earnings before Tax (before exceptional items) 201 480
24 - - Exceptional Gain / (Loss)* - 24
229 124 275 Earnings before Tax 201 504
(24) 28 57 Provision for Taxation (Net)* 47 32
253 96 218 Net Profit 154 472
Half YearQuarter 2

54
2,409
6,246
9,992
13,265
4,227
9,3369,244
10,72311,727
14,939402748
10711396
445906 814 945 976
1242
Mar'05 Mar'06 Mar'07 Mar'08 Mar'09 Mar'10 Mar'11 Mar'12 Mar'13 Sep'13
Market Cap (` Crores) Closing Share price (`)
Shareholding Pattern & Market Cap
Trusted by 140,363 shareholders
Over 97.5% of shares are in dematerialised form
Face value of ` 10 per share
For analysts coverage on ABNL visit :
Market Cap & Share Price
Source : NSE website
Stock Code – BSE : 500303 NSE : ABIRLANUVO Reuters : ABRL.BO / ABRL.NS / IRYN.LU Bloomberg : ABNL IN / IRIG LX
http://www.adityabirlanuvo.com/investors/downloads/third_party_analysts_coverage.aspx
Category
No. of No. of Shares Shareholding
Shareholders held (in million) (%)
Promoter & Promoter Group 21 64.62 53.74%
Foreign Institutional Investors 343 19.32 16.06%
Domestic Institutional Investors 179 16.36 13.60%
Non-Institutional Investors 139,816 16.78 13.95%
GDRs - Public 4 3.18 2.65%
Total 140,363 120.26 100.00%
As on 30th Sep'13

55
Disclaimer
Certain statements made in this presentation may not be based on historical information or facts and may be “forward looking statements” including,
but not limited to, those relating to general business plans & strategy of Aditya Birla Nuvo Limited ("ABNL"), its future outlook & growth prospects,
future developments in its businesses, its competitive & regulatory environment and management's current views & assumptions which may not
remain constant due to risks and uncertainties. Actual results may differ materially from these forward-looking statements due to a number of
factors, including future changes or developments in ABNL's business, its competitive environment, its ability to implement its strategies and
initiatives and respond to technological changes and political, economic, regulatory and social conditions in the countries in which ABNL conducts
business. Important factors that could make a difference to ABNL’s operations include global and Indian demand supply conditions, finished goods
prices, feed stock availability and prices, cyclical demand and pricing in ABNL’s principal markets, changes in Government regulations, tax regimes,
competitors actions, economic developments within India and the countries within which ABNL conducts business and other factors such as
litigation and labour negotiations.
This presentation does not constitute a prospectus, offering circular or offering memorandum or an offer to acquire any shares and should not be
considered as a recommendation that any investor should subscribe for or purchase any of ABNL's shares. Neither this presentation nor any other
documentation or information (or any part thereof) delivered or supplied under or in relation to the shares shall be deemed to constitute an offer of
or an invitation by or on behalf of ABNL.
ABNL, as such, makes no representation or warranty, express or implied, as to, and does not accept any responsibility or liability with respect to,
the fairness, accuracy, completeness or correctness of any information or opinions contained herein. The information contained in this presentation,
unless otherwise specified is only current as of the date of this presentation. ABNL assumes no responsibility to publicly amend, modify or revise
any forward looking statements on the basis of any subsequent developments, information or events or otherwise. Unless otherwise stated in this
document, the information contained herein is based on management information and estimates. The information contained herein is subject to
change without notice and past performance is not indicative of future results. ABNL may alter, modify or otherwise change in any manner the
content of this presentation, without obligation to notify any person of such revision or changes. This presentation may not be copied and
disseminated in any manner.
INFORMATION PRESENTED HERE IS NOT AN OFFER FOR SALE OF ANY EQUITY SHARES OR ANY OTHER SECURITY OF ABNL
This presentation is not for publication or distribution, directly or indirectly, in or into the United States, Canada or Japan. These
materials are not an offer of securities for sale in or into the United States, Canada or Japan.
Aditya Birla Nuvo Limited
Regd. Office: Indian Rayon Compound, Veraval – 362 266 (Gujarat)
Corporate Office: 4th Floor „A‟ Wing, Aditya Birla Center, S.K. Ahire Marg, Worli, Mumbai – 400 030
Website: www.adityabirlanuvo.com or www.adityabirla.com or Email: [email protected]