Stochastic Oscillator
7
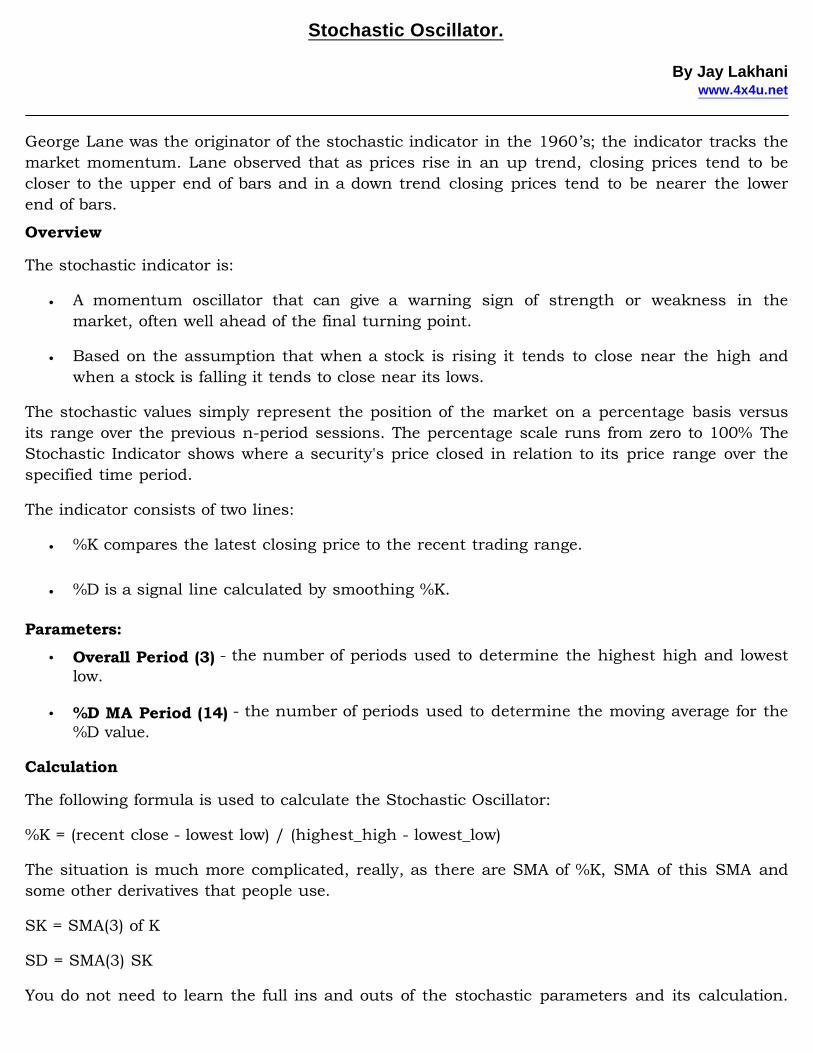
Stochastic Oscillator. By Jay Lakhani www.4x4u.net George Lane was the originator of the stochastic indicator in the 1960’s; the indicator tracks the market momentum. Lane observed that as prices rise in an up trend, closing prices tend to be closer to the upper end of bars and in a down trend closing prices tend to be nearer the lower end of bars. Overview The stochastic indicator is: • A momentum oscillator that can give a warning sign of strength or weakness in the market, often well ahead of the final turning point. • Based on the assumption that when a stock is rising it tends to close near the high and when a stock is falling it tends to close near its lows. The stochastic values simply represent the position of the market on a percentage basis versus its range over the previous n-period sessions. The percentage scale runs from zero to 100% The Stochastic Indicator shows where a security's price closed in relation to its price range over the specified time period. The indicator consists of two lines: • %K compares the latest closing price to the recent trading range. • %D is a signal line calculated by smoothing %K. Parameters: • Overall Period (3) - the number of periods used to determine the highest high and lowest low. • %D MA Period (14) - the number of periods used to determine the moving average for the %D value. Calculation The following formula is used to calculate the Stochastic Oscillator: %K = (recent close - lowest low) / (highest_high - lowest_low) The situation is much more complicated, really, as there are SMA of %K, SMA of this SMA and some other derivatives that people use. SK = SMA(3) of K SD = SMA(3) SK You do not need to learn the full ins and outs of the stochastic parameters and its calculation.
-
Upload
paul-burke -
Category
Documents
-
view
60 -
download
4
Transcript of Stochastic Oscillator
Stochastic Oscillator.
By Jay Lakhaniwww.4x4u.net
George Lane was the originator of the stochastic indicator in the 1960’s; the indicator tracks themarket momentum. Lane observed that as prices rise in an up trend, closing prices tend to becloser to the upper end of bars and in a down trend closing prices tend to be nearer the lowerend of bars.
Overview
The stochastic indicator is:
• A momentum oscillator that can give a warning sign of strength or weakness in themarket, often well ahead of the final turning point.
• Based on the assumption that when a stock is rising it tends to close near the high andwhen a stock is falling it tends to close near its lows.
The stochastic values simply represent the position of the market on a percentage basis versusits range over the previous n-period sessions. The percentage scale runs from zero to 100% TheStochastic Indicator shows where a security's price closed in relation to its price range over thespecified time period.
The indicator consists of two lines:
• %K compares the latest closing price to the recent trading range.
• %D is a signal line calculated by smoothing %K.
Parameters:
• Overall Period (3) - the number of periods used to determine the highest high and lowestlow.
• %D MA Period (14) - the number of periods used to determine the moving average for the%D value.
Calculation
The following formula is used to calculate the Stochastic Oscillator:
%K = (recent close - lowest low) / (highest_high - lowest_low)
The situation is much more complicated, really, as there are SMA of %K, SMA of this SMA andsome other derivatives that people use.
SK = SMA(3) of K
SD = SMA(3) SK
You do not need to learn the full ins and outs of the stochastic parameters and its calculation.

Most advanced charting packages will do this for you
Interpretation
The overbought warning signal is when the lines are above the 80% value, and oversold warningis when the lines are below 20%.
The signals are most reliable if you wait until the %K and %D lines turn upward below 5%before buying, and the lines turn downward above 95% before selling
Uses of a Stochastic to generate trading signals
1. Divergence between the price action and stochastic can indicate that a trend change mayfollow
2. When the stochastic moves from extreme levels and than moves above the 20% level, mayindicate that the price is about to trend higher
3. Alert to buy is confirmed when the lines move above 50%
4. During an uptrend, once you see stochastic fall below the 80%, you may want to considerclosing your long positions.
5. Once the stochastic fell below 80% and than below the 50% levels, this would offer a sellsignal.
6. When the faster %K line crosses above the slower %D line and the lines are below 20, abuy signal is generated
7. When the %K lines crosses below the %D line and the lines are above 80 a sell signal isgenerated
As I have often said that that just relying on one indicator, as a means of generating an entrytrade is very dangerous, you must look for a confluence of indicators to confirm the entry signal.There is a step-by-step guide in my ebook “The Way To Trade Forex”, on what to look for. Byhaving these confluence will mean that the losing trades are minimised. This is the sole reasonwhy I tend to have a high percentage of winning trades – over 70%. I am quite happy not totrade, if there is no signal.
I am looking for an ironclad trade. Often I could go few days without a trade, but that does notbother me. My golden rule is No signal – No Trade!
Just because there is a crossover of the stochastic line does not mean that you have an ironcladtrade. I often find many traders use just one indicator and than lose! Than blame the Indicatorand not themselves. If it were so easy than 90% of traders would not lose!
One of my favourite signals is to trade the stochastic divergence, often when I see a divergencebetween a price and divergence and this is followed by a crossover of lines, than often you have awinner.
2

Different types of divergence1. Bearish - The price moves higher, but stochastic suggests a slowing trend. You will see
higher price highs and lower stochastic highs, and is a sure sign that a price correction isnot far off.
2. Bullish - The lower lows in price action show a divergence with higher stochastic lows. Asstochastic shows the market becoming less oversold, the market itself fails to confirm thisnotion and continues on down. However, this is just indicative that price will invariablyshift course and follow stochastic’s lead.
3

4
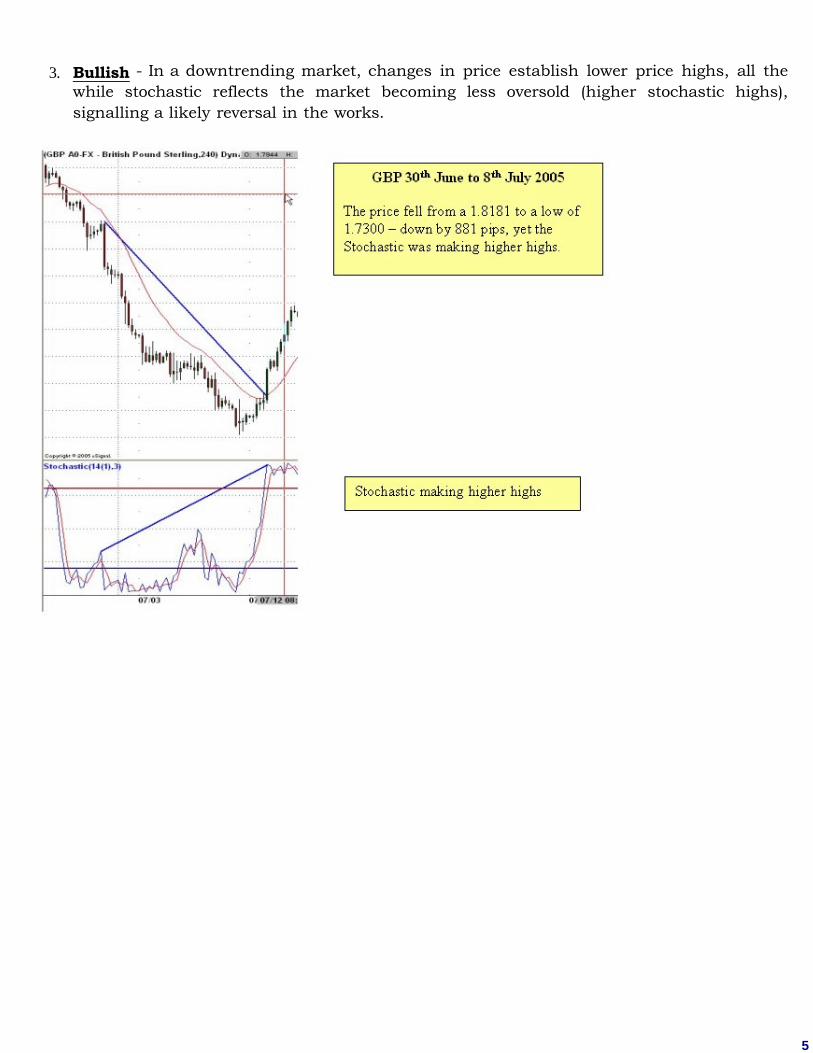
3. Bullish - In a downtrending market, changes in price establish lower price highs, all thewhile stochastic reflects the market becoming less oversold (higher stochastic highs),signalling a likely reversal in the works.
5
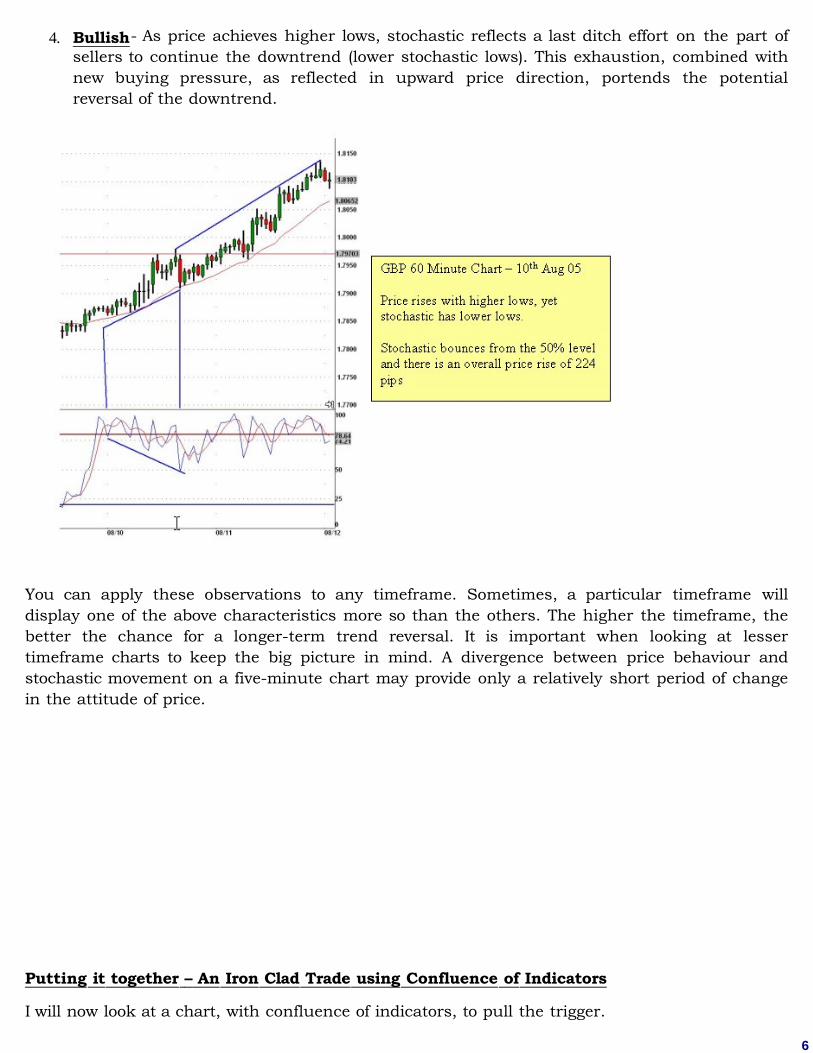
4. Bullish- As price achieves higher lows, stochastic reflects a last ditch effort on the part ofsellers to continue the downtrend (lower stochastic lows). This exhaustion, combined withnew buying pressure, as reflected in upward price direction, portends the potentialreversal of the downtrend.
You can apply these observations to any timeframe. Sometimes, a particular timeframe willdisplay one of the above characteristics more so than the others. The higher the timeframe, thebetter the chance for a longer-term trend reversal. It is important when looking at lessertimeframe charts to keep the big picture in mind. A divergence between price behaviour andstochastic movement on a five-minute chart may provide only a relatively short period of changein the attitude of price.
Putting it together – An Iron Clad Trade using Confluence of Indicators
I will now look at a chart, with confluence of indicators, to pull the trigger.
6

The stochastic indicator as a starting point.
GBP – Daily Chart – 8th July 05 to 15th Aug 05.
Looking at the above chart, you had so many confluences of indicators to go long on 26th July2005, with the price at a bottom at 1.7360. Since than GBP has risen by nearly 900 pips.
This was a great position trade to be in. In my book “The Way To Trade Forex” I always say thatyou must have at least 3 reasons why you should pull the trigger. In this case we certainly hadso many triggers, you just had to fill your boots! Some of the reasons were;
1. Bullish Divergence Stochastic
2. Bullish Divergence RSI
3. Bullish divergence MACD
4. Double Bottom
5. Support at a Pivot point, repeated bounce.
Good Trading
Jay Lakhani
7