Stochastic cellular manufacturing system design subject to
13
Stochastic cellular manufacturing system design subject to maximum acceptable risk level q Gokhan Egilmez, Gürsel A. Süer ⇑ , Jing Huang ISE Department, Ohio University, Athens, OH 45701, USA article info Article history: Received 2 July 2011 Received in revised form 8 May 2012 Accepted 27 May 2012 Available online 13 June 2012 Keywords: Cellular manufacturing system design Non-linear modeling Stochastic optimization Simulation Model validation abstract In this study, a non-linear mathematical model is proposed to solve the stochastic cellular manufacturing system (CMS) design problem. The problem is observed in both machine and labor-intensive cells, where operation times are probabilistic in addition to uncertain customer demand. We assume that processing times and customer demand are normally distributed. The objective is to design a CMS with product fam- ilies that are formed with most similar products and minimum number of cells and machines for a spec- ified risk level. Various experiments are carried out to study the impact of risk level on CMS design. As the risk level increases, lower number of cells and product families are formed and average cell utilization increases. However, this leads to poor performance in cells, where standard deviations of capacity requirements are high. Later, the deterministic approach proposed by Suer, Huang, and Sripathi (2010) and the proposed stochastic model with various risk levels are compared. Both of the models’ results are simulated with Arena Simulation Software. Simulation is performed to validate models and assess the performance of designed CMSs with respect to following measures: cell utilization, WIP, total waiting time and total number waiting. Stochastic CMS design with 10% risk formed a better CMS in all of the performance measures according to the results obtained from simulation experiments. Ó 2012 Elsevier Ltd. All rights reserved. 1. Introduction Manufacturing strategies and approaches have significantly changed in recent decades in comparison to the first half of the 20th century. One of the changes that has been employed and implemented by numerous companies in recent decades is the Group Technology (GT) and Cellular Manufacturing (CM) concepts. Group technology is a general philosophy, where similar items are brought together considering a critical attribute and the same solu- tion is applied to the entire group thus improving the productivity of the system. Cellular manufacturing is an application of GT to the manufac- turing world. In a cellular manufacturing system (CMS), similar products are grouped into product families and the required ma- chines are assigned to manufacturing cells to produce the corre- sponding product families. In this respect, a cell is a small manufacturing unit designed to have people, dissimilar equipment and machines together to produce like products resulting in lower leadtimes, work-in-process inventory (WIP), setup times and work- force (Wemmerlov & Johnson, 1997). See Burbidge and Wei (1992) for more detailed explanation of the benefits of implementing CMS. Although there are significant benefits that can be achieved when CMS is employed, there are some disadvantages of CMS implemen- tation such as being less flexible to rapid changes in product mix and demand (Ang & Willey, 1984; Wei & Gaither, 1990; Satoglu & Sur- esh, 2009). In addition to these cons, the major concern about Cellu- lar Manufacturing (CM) is the reduced machine utilization due to the dedication of machines and cells to certain product families (Suer & Ortega, 1996). Moreover, overutilization or underutilization of cells can be another complicated issue when demand of each product is uncertain. Due to such difficulties as inefficient cell and machine utilization and poor production control associated with highly probabilistic demand (Suer et al., 2010), stochastic behavior of demand should be taken into consideration prior to CMS design. Manufacturing cells can be defined as either machine-intensive cell or labor-intensive. In machine-intensive cells, the operator involvement is limited and the operation is mostly influenced by the machine performance. The operators usually load the raw material or semi-product, unload it from the machine and perform quality control. In these environments, processing times may not greatly vary from one unit of the job to the next unit of the same job as the machines increasingly have a better repeatability feature. On the other hand, in labor- intensive manufacturing cells, opera- tions are mainly carried out by the operators and the processing time of an operation can vary significantly from one unit of the job to the next unit depending on the operator and even for the same operator. 0360-8352/$ - see front matter Ó 2012 Elsevier Ltd. All rights reserved. http://dx.doi.org/10.1016/j.cie.2012.05.006 q This manuscript was processed by Area Editor Gursel A. Suer. ⇑ Corresponding author. Tel.: +1 740 593 1542; fax: +1 740 593 0778. E-mail addresses: [email protected] (G. Egilmez), [email protected] (G.A. Süer), [email protected] (J. Huang). Computers & Industrial Engineering 63 (2012) 842–854 Contents lists available at SciVerse ScienceDirect Computers & Industrial Engineering journal homepage: www.elsevier.com/locate/caie
Transcript of Stochastic cellular manufacturing system design subject to
Computers & Industrial Engineering 63 (2012) 842–854
Contents lists available at SciVerse ScienceDirect
Computers & Industrial Engineering
journal homepage: www.elsevier .com/ locate/caie
Stochastic cellular manufacturing system design subject to maximumacceptable risk level q
Gokhan Egilmez, Gürsel A. Süer ⇑, Jing HuangISE Department, Ohio University, Athens, OH 45701, USA
a r t i c l e i n f o
Article history:Received 2 July 2011Received in revised form 8 May 2012Accepted 27 May 2012Available online 13 June 2012
Keywords:Cellular manufacturing system designNon-linear modelingStochastic optimizationSimulationModel validation
0360-8352/$ - see front matter � 2012 Elsevier Ltd. Ahttp://dx.doi.org/10.1016/j.cie.2012.05.006
q This manuscript was processed by Area Editor Gu⇑ Corresponding author. Tel.: +1 740 593 1542; fax
E-mail addresses: [email protected] (G. [email protected] (J. Huang).
a b s t r a c t
In this study, a non-linear mathematical model is proposed to solve the stochastic cellular manufacturingsystem (CMS) design problem. The problem is observed in both machine and labor-intensive cells, whereoperation times are probabilistic in addition to uncertain customer demand. We assume that processingtimes and customer demand are normally distributed. The objective is to design a CMS with product fam-ilies that are formed with most similar products and minimum number of cells and machines for a spec-ified risk level. Various experiments are carried out to study the impact of risk level on CMS design. As therisk level increases, lower number of cells and product families are formed and average cell utilizationincreases. However, this leads to poor performance in cells, where standard deviations of capacityrequirements are high. Later, the deterministic approach proposed by Suer, Huang, and Sripathi (2010)and the proposed stochastic model with various risk levels are compared. Both of the models’ resultsare simulated with Arena Simulation Software. Simulation is performed to validate models and assessthe performance of designed CMSs with respect to following measures: cell utilization, WIP, total waitingtime and total number waiting. Stochastic CMS design with 10% risk formed a better CMS in all of theperformance measures according to the results obtained from simulation experiments.
� 2012 Elsevier Ltd. All rights reserved.
1. Introduction
Manufacturing strategies and approaches have significantlychanged in recent decades in comparison to the first half of the20th century. One of the changes that has been employed andimplemented by numerous companies in recent decades is theGroup Technology (GT) and Cellular Manufacturing (CM) concepts.Group technology is a general philosophy, where similar items arebrought together considering a critical attribute and the same solu-tion is applied to the entire group thus improving the productivityof the system.
Cellular manufacturing is an application of GT to the manufac-turing world. In a cellular manufacturing system (CMS), similarproducts are grouped into product families and the required ma-chines are assigned to manufacturing cells to produce the corre-sponding product families. In this respect, a cell is a smallmanufacturing unit designed to have people, dissimilar equipmentand machines together to produce like products resulting in lowerleadtimes, work-in-process inventory (WIP), setup times and work-force (Wemmerlov & Johnson, 1997). See Burbidge and Wei (1992)for more detailed explanation of the benefits of implementing CMS.
ll rights reserved.
rsel A. Suer.: +1 740 593 0778.), [email protected] (G.A. Süer),
Although there are significant benefits that can be achieved whenCMS is employed, there are some disadvantages of CMS implemen-tation such as being less flexible to rapid changes in product mix anddemand (Ang & Willey, 1984; Wei & Gaither, 1990; Satoglu & Sur-esh, 2009). In addition to these cons, the major concern about Cellu-lar Manufacturing (CM) is the reduced machine utilization due tothe dedication of machines and cells to certain product families(Suer & Ortega, 1996). Moreover, overutilization or underutilizationof cells can be another complicated issue when demand of eachproduct is uncertain. Due to such difficulties as inefficient cell andmachine utilization and poor production control associated withhighly probabilistic demand (Suer et al., 2010), stochastic behaviorof demand should be taken into consideration prior to CMS design.
Manufacturing cells can be defined as either machine-intensivecell or labor-intensive. In machine-intensive cells, the operatorinvolvement is limited and the operation is mostly influenced bythe machine performance. The operators usually load the rawmaterial or semi-product, unload it from the machine and performquality control. In these environments, processing times may notgreatly vary from one unit of the job to the next unit of the samejob as the machines increasingly have a better repeatability feature.On the other hand, in labor- intensive manufacturing cells, opera-tions are mainly carried out by the operators and the processingtime of an operation can vary significantly from one unit of thejob to the next unit depending on the operator and even for thesame operator.
G. Egilmez et al. / Computers & Industrial Engineering 63 (2012) 842–854 843
In this paper, both demand and processing times are consideredas probabilistic. A non-linear stochastic mathematical model isdeveloped for CMS design. Experimentation is carried out withdeterministic model given by Suer et al. (2010) and the proposedstochastic mathematical model. Subsequently, the results are sim-ulated with Arena software to validate the mathematical modeland observe performance of CMS in terms of cell utilization, WIP,waiting times and total number of units waiting.
The remainder of the paper is organized as follows. In Section 2,literature is reviewed. In Section 3, the manufacturing systemstudied is explained. In Section 4, the calculation of similarity coef-ficients and capacity requirements and the deterministic capaci-tated P-median model are discussed. In Section 5, stochastic CMSdesign is introduced, where bottleneck machine identificationand probabilistic capacity requirements are discussed and the pro-posed non-linear stochastic mathematical model is described. Anexample problem is solved and provided in Section 6. In Section7, the validation of models and performance analysis are explained.The experimentation and the results are presented in Section 8.Finally, the concluding remarks are made and the future work isgiven in Section 9.
2. Literature review
Many different optimizing procedures have been used to solveCMS design problem. The majority of the procedures are based onmathematical optimization. In addition to mathematical models,simulation, heuristics and meta-heuristics are also used in someof these works. While most of the studies in the literature haveaddressed the deterministic CMS design problem, less attention ispaid to the problems which include uncertainty in such parametersas demand and processing times. The literature is classified intotwo sections as works that consider deterministic behavior of theproblem and also stochastic behavior of the problem.
2.1. Deterministic CMS design
Mathematical modeling is employed in numerous studies in theliterature. Purcheck (1974) studied the group technology problemand applied linear programming. Kusiak (1987) compared matrixand integer programming (the p-median) models and showedthe improvement in the quality of cell formation. Shtubt (1989)proposed the Generalized Assignment Problem (GAP) as the equiv-alence of simple cell-formation problem. Rajamani, Singh, andAneja (1990) developed three integer programming models forCMS design and analyzed the impact of alternative process plans.Wei and Gaither (1990) used an optimal 0–1 integer programmingmodel to provide an analysis for the CMS design problem to min-imize the cost of manufacturing exceptional products outside thecellular system, subject to machine capacity constraints.
Shafer and Rogers (1991) proposed a goal programming ap-proach to CMS design problem which addresses such issues asreducing setup times, minimizing intercellular movements ofproducts and the investment in new equipment, and maintainingacceptable machine utilization levels. Kamrani, Parsaei, and Leep(1995) developed a mathematical model and tested the perfor-mance of the model with simulation in four phases. Heragu andChen (1998) applied a mathematical model which incorporatesBenders’ decomposition to CMS design problem. Chen (1998) pro-posed an approach to design a sustainable cellular manufacturingsystem in a dynamic environment and an integer programmingmodel to minimize material handling and machine costs as wellas cell reconfiguration cost for a multi-period planning horizon.Wang (1998) applied a linear assignment model to the group for-mation problem.
Sofianopoulou (1999) developed a mathematical model and atwo-phased simulated annealing algorithm to solve the problemof grouping machines into cells. A unique product process planfor each product is selected, where machine duplication, operationsequence constraints and several design requirements exist. Akturkand Turkcan (2000) proposed an integrated algorithm to solve theproduct-family and machine-cell formation problem by simulta-neously considering the within-cell layout problem. The efficiencyof both individual cells and the overall system in monetary termsare considered and a local search heuristic is provided. Albadawi,Bashir, and Chen (2005) proposed a two-phase mathematicalmodel that includes the identification of machine cells by applyingfactor analysis and the assignment of products to the machine cells.They also applied their model to a case study.
Some of the works used simulation in addition to mathematicaloptimization in cell formation problems. Kamrani et al. (1995)proposed a simulation-based methodology considering designand manufacturing attributes to form manufacturing cells. A threephased-hierarchical methodology is used, namely: (1) part dissim-ilarity-based cell formation, (2) grouping of machines into manu-facturing cells and (3) simulation. The proposed approach isbeneficial in terms of designing, analyzing, optimizing and justify-ing the cellular manufacturing system considered. Hachicha,Masmoudi, and Haddar (2007) provided a simulation-basedimprovement approach considering exceptional elements and theeffect of intercellular movement. The initial configuration ofmachines and parts in cells are known and the intercell transfer isallowed since some process routes require parts visit different cells.Based on the cluster given, the designed system is improved viasimulation such that the impact of remaining exceptional elementson system performance is minimized. Mean transfer, machining,waiting and flow times are considered as performance measurealong with the cost of intercell movement. For more examples ofworks include simulation, see Shang and Tadikamalla (1998),Habchi and Berchet (2003), and Masmoudi (2006).
In the last decade, metaheuristics such as Genetic Algorithms(GA), Simulated Annealing (SA), Tabu Search (TS) have been widelyapplied to the cell formation problem. See Moon, Gen, and Suer(1999), Asokan, Prabhakaran, and Satheesh (2001), Suer, Pena,and Vazques (2003), Cao and Chen (2004), Jayaswal and Adil(2004), and Solimanpur, Vrat, and Shankar (2004).
2.2. Stochastic CMS design
Although there are several studies, which considers thedeterministic CMS design problem in literature, only a handfulconsider the stochastic parameters such as demand, processingtime, and capacity requirements. Seifoddini (1990) focused on theuncertainty of the product mix for a single period and proposed aprobabilistic model for machine cell formation to minimize theexpected inter-cell material handling costs of the system. Wicksand Reasor (1999) used forecasting techniques and solved the mul-ti-period cell formation problem with GA (Wicks & Reasor, 1999).Saad (2003) focused on the reconfiguration issues in manufacturingsystems and provided several sub-modules, namely: configurationand reconfiguration module, loading module, and simulation-basedscheduling module (Saad, 2003). Saidi-Mehrabad and Ghezavati(2009) applied queuing theory to the CMS design problem associ-ated with uncertainty issues (Saidi-Mehrabad & Ghezavati, 2009).Each machine is considered as server and each product is assumedas customer. The objective is to minimize the idleness costs forservers, the total cost of sub-contracting for exceptional elementsand the cost of resource underutilization. Suer et al. (2010)proposed an alternative CMS design approach, ‘‘layered manufac-turing system’’, to deal with the uncertainty in product demandand production rates. The proposed layered CMS consists of three
844 G. Egilmez et al. / Computers & Industrial Engineering 63 (2012) 842–854
types of cells, namely: dedicated, shared and remainder cells. Intheir study, the generalized p-median model by Kusiak (1987) ismodified to one which considers the utilization of cells as well asthe product similarities. In this paper, the CMS design based ondeterministic capacitated p-median model is used for comparison.
In this study, a stochastic non-linear capacitated p-median math-ematical model is developed to deal with the probabilistic demand,production rates and thus capacity requirements. The proposedmodel is compared with Süer et al.’s (2010) deterministic capaci-tated p-median model. The obtained cell configurations from bothdeterministic and proposed stochastic mathematical models aresimulated with Arena Simulation Software to validate the designedCMS and assess the overall performance based on selected metrics,namely, cell utilization, the number of machines, work-in-processinventory, average queue length and average waiting time.
3. The manufacturing system studied
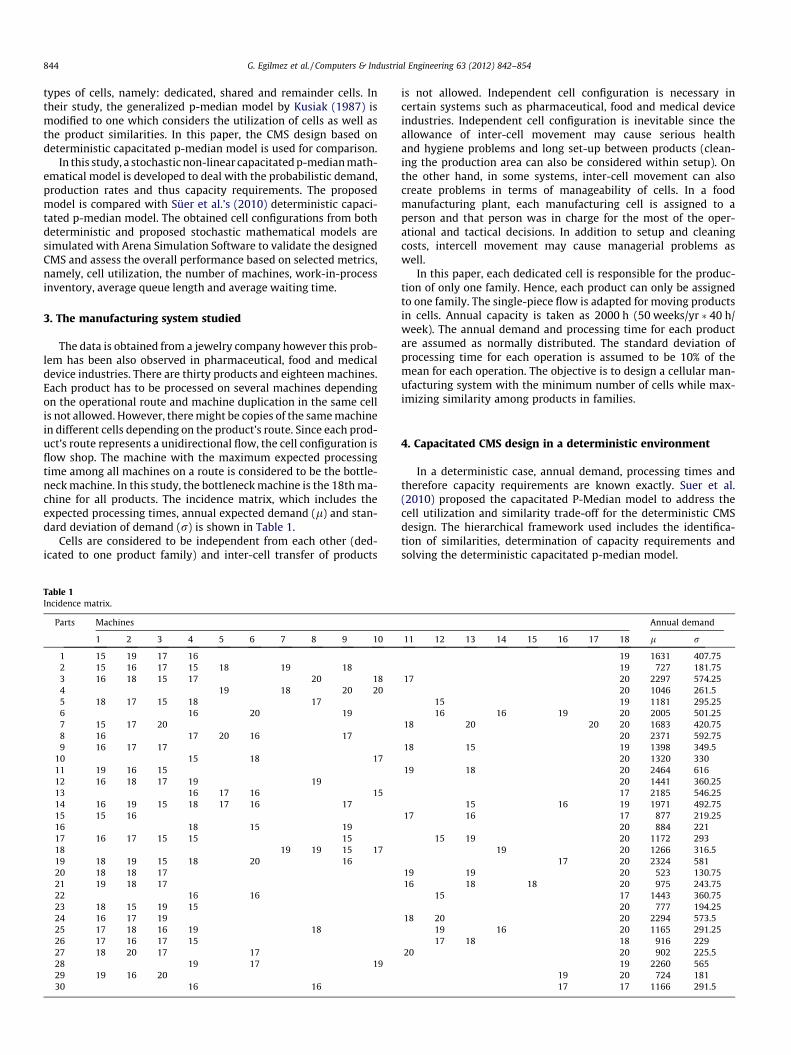
The data is obtained from a jewelry company however this prob-lem has been also observed in pharmaceutical, food and medicaldevice industries. There are thirty products and eighteen machines.Each product has to be processed on several machines dependingon the operational route and machine duplication in the same cellis not allowed. However, there might be copies of the same machinein different cells depending on the product’s route. Since each prod-uct’s route represents a unidirectional flow, the cell configuration isflow shop. The machine with the maximum expected processingtime among all machines on a route is considered to be the bottle-neck machine. In this study, the bottleneck machine is the 18th ma-chine for all products. The incidence matrix, which includes theexpected processing times, annual expected demand (l) and stan-dard deviation of demand (r) is shown in Table 1.
Cells are considered to be independent from each other (ded-icated to one product family) and inter-cell transfer of products
Table 1Incidence matrix.
Parts Machines
1 2 3 4 5 6 7 8 9 10
1 15 19 17 162 15 16 17 15 18 19 183 16 18 15 17 20 184 19 18 20 205 18 17 15 18 176 16 20 197 15 17 208 16 17 20 16 179 16 17 17
10 15 18 1711 19 16 1512 16 18 17 19 1913 16 17 16 1514 16 19 15 18 17 16 1715 15 1616 18 15 1917 16 17 15 15 1518 19 19 15 1719 18 19 15 18 20 1620 18 18 1721 19 18 1722 16 1623 18 15 19 1524 16 17 1925 17 18 16 19 1826 17 16 17 1527 18 20 17 1728 19 17 1929 19 16 2030 16 16
is not allowed. Independent cell configuration is necessary incertain systems such as pharmaceutical, food and medical deviceindustries. Independent cell configuration is inevitable since theallowance of inter-cell movement may cause serious healthand hygiene problems and long set-up between products (clean-ing the production area can also be considered within setup). Onthe other hand, in some systems, inter-cell movement can alsocreate problems in terms of manageability of cells. In a foodmanufacturing plant, each manufacturing cell is assigned to aperson and that person was in charge for the most of the oper-ational and tactical decisions. In addition to setup and cleaningcosts, intercell movement may cause managerial problems aswell.
In this paper, each dedicated cell is responsible for the produc-tion of only one family. Hence, each product can only be assignedto one family. The single-piece flow is adapted for moving productsin cells. Annual capacity is taken as 2000 h (50 weeks/yr � 40 h/week). The annual demand and processing time for each productare assumed as normally distributed. The standard deviation ofprocessing time for each operation is assumed to be 10% of themean for each operation. The objective is to design a cellular man-ufacturing system with the minimum number of cells while max-imizing similarity among products in families.
4. Capacitated CMS design in a deterministic environment
In a deterministic case, annual demand, processing times andtherefore capacity requirements are known exactly. Suer et al.(2010) proposed the capacitated P-Median model to address thecell utilization and similarity trade-off for the deterministic CMSdesign. The hierarchical framework used includes the identifica-tion of similarities, determination of capacity requirements andsolving the deterministic capacitated p-median model.
Annual demand
11 12 13 14 15 16 17 18 l r
19 1631 407.7519 727 181.75
17 20 2297 574.2520 1046 261.5
15 19 1181 295.2516 16 19 20 2005 501.25
18 20 20 20 1683 420.7520 2371 592.75
18 15 19 1398 349.520 1320 330
19 18 20 2464 61620 1441 360.2517 2185 546.25
15 16 19 1971 492.7517 16 17 877 219.25
20 884 22115 19 20 1172 293
19 20 1266 316.517 20 2324 581
19 19 20 523 130.7516 18 18 20 975 243.75
15 17 1443 360.7520 777 194.25
18 20 20 2294 573.519 16 20 1165 291.2517 18 18 916 229
20 20 902 225.519 2260 565
19 20 724 18117 17 1166 291.5

G. Egilmez et al. / Computers & Industrial Engineering 63 (2012) 842–854 845
4.1. Identification of similarities and determination of capacityrequirements
The similarity matrix is constructed based on the similaritycoefficients. Suer et al. (2010) modified McAuley’s (1972) similar-ity coefficient definition to find the similarities among products.The similarity coefficients are calculated via the suggestedequation by Suer et al. (2010) as shown in Eq. (1). The machinesimilarity (MS) between products i and j is the ratio of thecommon number of machines to the total number of machinesto produce both.
MSij ¼Number of machines processing parts i and j
Number of machines processing parts either i or jð1Þ
Once similarities are calculated, the capacity requirements areobtained via Eq. (2), where Pi is processing time of bottleneckmachine for part i in minutes, Di is annual demand for part i in unitsand CRi is annual capacity requirement for product i in hours.
CRi ¼Di � Pi
60ð2Þ
4.2. Deterministic capacitated P-median model
The deterministic approach only considers the mean capacityrequirements and the machine similarities. Product families andcell formations are determined considering cell utilization andsimilarity coefficients. The indices, parameters and decisionvariables for the model are listed as follows:
Indices:
i Product index j Product index and family/cell index Parameters: Sij Similarity coefficient between product i and j CRi Capacity requirement for product i in hours n Number of products TU Upper limit for cell capacity Decision variables: Xij 1, if product i is assigned to family j; 0, otherwiseThe objective function is shown in Eq. (3). It maximizes the totalsimilarity among products that are formed as families are pro-duced in dedicated cells, while minimizing the number of cells.Eq. (4) limits the cell utilization up to the cell capacity. Eq. (5)forces each product to be assigned to a cell. Eq. (6) guaranteesthe assignment of each product to only one of the cells that areopened. Eq. (7) determines whether product i can is assigned to cellj or not.
Objective function:
max Z ¼Xn
i¼1
Xn
j¼1
Sij � Xij �Xn
j¼1
Xjj ð3Þ
Subject to:
Xn
i¼1
CRi � Xij 6 TU j ¼ 1; . . . ;n ð4Þ
Xn
j¼1
Xij ¼ 1 i ¼ 1; . . . ;n ð5Þ
Xij 6 Xjj j ¼ 1; . . . ;n and i ¼ 1; . . . ;n ð6Þ
Xij 2 ½0;1�; Xij integer ð7Þ
5. The proposed solution methodology: stochastic CMS design
The model discussed in the previous section assumes that pro-cessing times and demand and hence capacity requirements are alldeterministic. In this paper, we relax this assumption and modifythe model considering normally distributed demand and process-ing times. The similarity coefficients used in the deterministicmodel are kept the same in the proposed stochastic approach. Thissection consists of three parts: first part explains how the probabi-listic capacity requirements are determined; proposed stochasticnon-linear mathematical model is explained in the second partand an example problem is provided in the third part.
5.1. Capacity requirements in the presence of stochastic demand andprocessing times
In the deterministic case, the capacity requirement of a productis calculated via multiplying its demand and processing time (Eq.(2)). However, in the stochastic case, since both demand and pro-cessing time are probabilistic, the product of these two randomvariables becomes probabilistic and requires statistical analysisto find the probability density functions (pdf) of the capacityrequirements. To find the fitted distribution (pdf) of the capacityrequirement of product i, statistical analysis is performed with Are-na Input Analyzer software. The framework of the analysis isshown in Fig. 1.
5.2. Stochastic capacitated P-median model
The proposed solution methodology is based on the mathemat-ical model given in Section 4. The objective function (Eq. (3)), con-straints given in Eqs. (5) and (6), and decision variable definitions(Eq. (7)) remain the same. However, the first constraint (Eq. (4))which limits the allocation of products to the cells in terms ofcapacity is changed since capacity requirements are now stochas-tically defined. This section discusses how new constrained isformulated.
For a product to be assigned to a family and thus to a cell, thetotal capacity requirements after assignment must be less thanor equal to the available capacity. A product can be assigned toonly one of the opened cells. The probability that capacity require-ments will not exceed available capacity when the first product,say product 1 is assigned to a cell is computed as P(CR1 6 TU),where CR1 is the capacity requirement for product 1 and TU isthe available cell capacity. Similarly, this expression now can beextended to include the second product, product 2 as well. Theprobability that the total capacity requirements for both products1 and 2 will not exceed the available capacity when assigned to
Fig. 1. The framework of input analysis.
846 G. Egilmez et al. / Computers & Industrial Engineering 63 (2012) 842–854
the same cell is given as P(CR1 + CR2 6 TU). We can specify the min-imum probability that capacity requirements will be less than orequal to the available capacity as ð1� aÞ in our mathematical mod-el and then include this as a constraint for the first product asshown in Eq. (8). In this relation, factor ðaÞ indicates the maximumacceptable risk level that the decision maker would like to takewhen assigning products to families, i.e., factor ðaÞ indicates themaximum acceptable probability that capacity requirements willexceed the capacity available
pðCR1 6 TUÞP ð1� aÞ ð8Þ
Now this constraint type can be re-written to include meancapacity requirements and the decision variable for the first prod-uct assigned. For example, the constraint for the first product is de-scribed by Eq. (9), where lCR1
is the mean capacity requirementsfor product 1 and Xij is the decision variable indicating whetherproduct 1 will be assigned to cell j or not
pðlCR1� X1j 6 TUÞP ð1� aÞ ð9Þ
Similarly, the assignment of the second product (product 2) isthe sum of mean capacity requirements of first two products (ifboth assigned) and this is illustrated by Eq. (10)
pðlCR1� X1j þ lCR2
� X2j 6 TUÞP ð1� aÞ ð10Þ
The relations given by Eqs. (9) and (10) can be converted tostandard normal distribution equations for products 1 and 2 asshown by Eqs. (11) and (12), respectively
p Z1j 6ðTU � lCR1
� XijÞffiffiffiffiffiffiffiffiffiffiffiffiffiffiffiffiffir2
1 � X1j
q0B@
1CAP ð1� aÞ ð11Þ
p Z2j 6ðTU � lCR1
� X1j � lCR2� X2jÞffiffiffiffiffiffiffiffiffiffiffiffiffiffiffiffiffiffiffiffiffiffiffiffiffiffiffiffiffiffiffiffiffiffiffiffiffiffiffi
r21 � X1j þ r2
2 � X2j
q0B@
1CA P ð1� aÞ ð12Þ
The generalized constraint is given in Eq. (13), where uth prod-uct is assigned to cell j.
p Zuj 6ðTU �
Pui¼1lCRi
� XijÞffiffiffiffiffiffiffiffiffiffiffiffiffiffiffiffiffiffiffiffiffiffiffiffiffiffiPui¼1r2
i � Xij
q0B@
1CA P ð1� aÞ ð13Þ
Finally, Eq. (14) replaces the cell capacity constraint given Eq.(4) in the deterministic mathematical model.
p Znj 6ðTU �
Pni¼1lCRi
� XijÞffiffiffiffiffiffiffiffiffiffiffiffiffiffiffiffiffiffiffiffiffiffiffiffiffiffiPni¼1r2
i � Xij
q0B@
1CA P ð1� aÞ j ¼ 1;2; . . . ;n ð14Þ
This constraint brings non-linearity to the mathematical modeland it is solved by using Lingo software.
Table 2Similarity matrix of example problem.
Product 1 2 3 4 5
1 – 0.625 0.625 0.111 0.712 0.625 – 0.455 0.444 0.53 0.625 0.455 – 0.182 0.664 0.111 0.444 0.182 – 0.095 0.714 0.5 0.667 0.091 –6 0.2 0.25 0.154 0.2 0.277 0.5 0.364 0.5 0.091 0.48 0.375 0.556 0.273 0.375 0.39 0.571 0.4 0.556 0.1 0.4410 0.286 0.2 0.333 0.286 0.22
5.3. Example problem
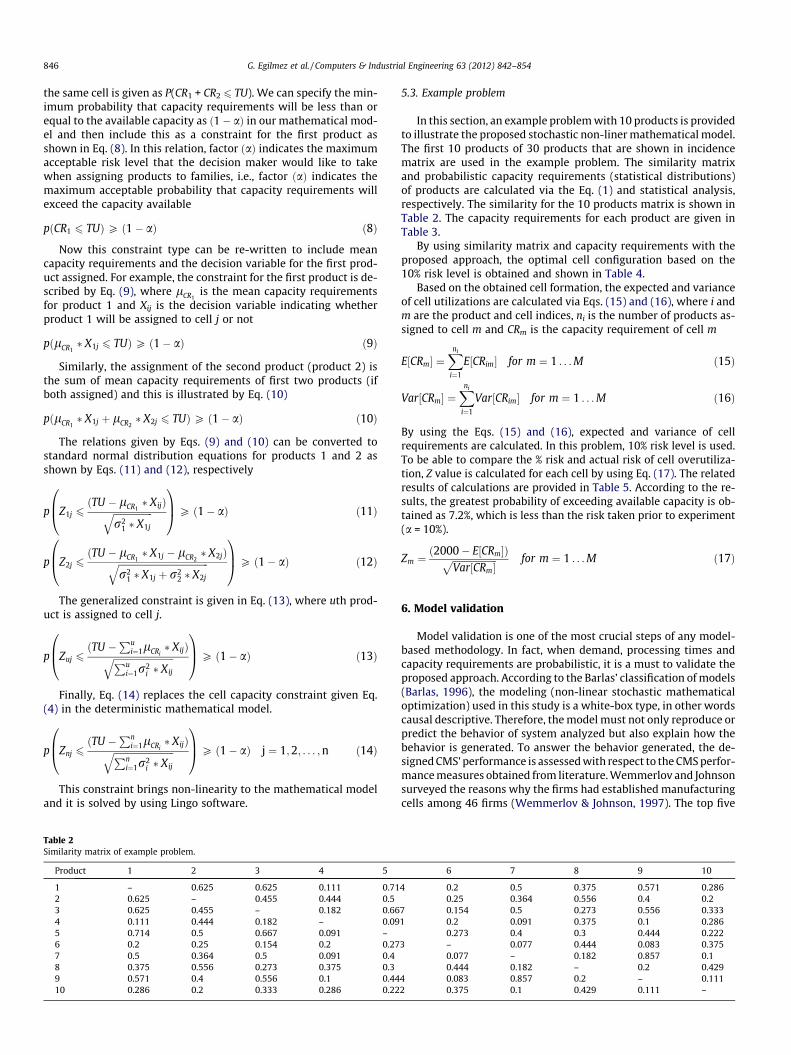
In this section, an example problem with 10 products is providedto illustrate the proposed stochastic non-liner mathematical model.The first 10 products of 30 products that are shown in incidencematrix are used in the example problem. The similarity matrixand probabilistic capacity requirements (statistical distributions)of products are calculated via the Eq. (1) and statistical analysis,respectively. The similarity for the 10 products matrix is shown inTable 2. The capacity requirements for each product are given inTable 3.
By using similarity matrix and capacity requirements with theproposed approach, the optimal cell configuration based on the10% risk level is obtained and shown in Table 4.
Based on the obtained cell formation, the expected and varianceof cell utilizations are calculated via Eqs. (15) and (16), where i andm are the product and cell indices, ni is the number of products as-signed to cell m and CRm is the capacity requirement of cell m
E½CRm� ¼Xni
i¼1
E½CRim� for m ¼ 1 . . . M ð15Þ
Var½CRm� ¼Xni
i¼1
Var½CRim� for m ¼ 1 . . . M ð16Þ
By using the Eqs. (15) and (16), expected and variance of cellrequirements are calculated. In this problem, 10% risk level is used.To be able to compare the % risk and actual risk of cell overutiliza-tion, Z value is calculated for each cell by using Eq. (17). The relatedresults of calculations are provided in Table 5. According to the re-sults, the greatest probability of exceeding available capacity is ob-tained as 7.2%, which is less than the risk taken prior to experiment(a = 10%).
Zm ¼ð2000� E½CRm�Þffiffiffiffiffiffiffiffiffiffiffiffiffiffiffiffiffiffiffi
Var½CRm�p for m ¼ 1 . . . M ð17Þ
6. Model validation
Model validation is one of the most crucial steps of any model-based methodology. In fact, when demand, processing times andcapacity requirements are probabilistic, it is a must to validate theproposed approach. According to the Barlas’ classification of models(Barlas, 1996), the modeling (non-linear stochastic mathematicaloptimization) used in this study is a white-box type, in other wordscausal descriptive. Therefore, the model must not only reproduce orpredict the behavior of system analyzed but also explain how thebehavior is generated. To answer the behavior generated, the de-signed CMS’ performance is assessed with respect to the CMS perfor-mance measures obtained from literature. Wemmerlov and Johnsonsurveyed the reasons why the firms had established manufacturingcells among 46 firms (Wemmerlov & Johnson, 1997). The top five
6 7 8 9 10
4 0.2 0.5 0.375 0.571 0.2860.25 0.364 0.556 0.4 0.2
7 0.154 0.5 0.273 0.556 0.3331 0.2 0.091 0.375 0.1 0.286
0.273 0.4 0.3 0.444 0.2223 – 0.077 0.444 0.083 0.375
0.077 – 0.182 0.857 0.10.444 0.182 – 0.2 0.429
4 0.083 0.857 0.2 – 0.1112 0.375 0.1 0.429 0.111 –

Table 3Capacity requirements (CRs).
Product Mean CR Std. Dev. Of CR
1 516 1902 514 184.43 790 2844 348 124.65 372 131.86 668 2407 566 2008 782 2809 446 169.4
10 442 162.6
Table 4Result of Example Problem with 10% Risk Level.
Cellno.
ProductNo
ExpectedCR
Variance ofCR
Machine group
1 1 516 36100 {1,2,3,4,11,13,17,18}7 566 400009 446 28696.36
2 2 514 34003.36 {1,2,3,4,5,6,7,9,10,18}4 348 15525.16
10 442 26438.76
3 3 790 80656 {1,2,3,4,8,10,11,12,18}5 372 17371.24
4 6 668 57600 {1,4,5,6,9,12,14,16,18}8 782 78400
Table 5Probabilistic cell utilizations and risk of capacity shortage.
Cellno.
Expectedcell CR
Varianceof cell CR
Std. dev.of cell CR
ZValue
Probability ofexceeding availablecapacity (%)
1 1528 104796.36 323.72 1.46 7.22 1304 75967.28 275.62 2.53 0.63 1162 98027.24 313.09 2.68 0.44 1450 136000.00 368.78 1.49 6.8
Input Analysis
• Conversion of product demand to interarrival times (IAT)• Conversion of product demand and processing times to
capacity requirements
Building The
Simulation Model
• Family and cell formation according to the results of mathematical model
• Defining the performance measures• Testing the model to decide the warm-up period
Validation
• Simulation runs• Comparison of simulations vs mathematical models via
One Way ANOVA• Interpretation of results and understanding of the
behaviour of model
Fig. 2. The hierarchical framework of validation.
G. Egilmez et al. / Computers & Industrial Engineering 63 (2012) 842–854 847
significant ones are to reduce throughput time, WIP, response timeto customer, move distances and move times, and to improve part/product quality.
In this study, simulation is employed for the validation of theproposed approach and performance analysis of CMS with respectto the measures, namely: cell utilization, WIP, waiting time and thenumber waiting. The results of 30-product dataset are used in val-idation. A hierarchical framework is developed to validate the pro-posed approach with simulation. As shown in Fig. 2. The validationprocedure consists of three steps: (1) Input analysis, (2) Simulationmodel development and (3) Simulation experiments and statisticalanalysis.
6.1. Input analysis
Prior to building the simulation model, inputs are prepared.First of all, annual stochastic product demands are converted tointerarrival times (IAT). The same demand data generated for themathematical model is used in this analysis. System capacity(2000 h) is divided by the demand data of each product and the ob-tained data is analyzed via the Input Analyzer module of Arena.According to the Kolmogorov–Smirnov and Chi-Square tests’ re-sults, best fitted distribution is determined as the ‘‘interarrival timedistribution’’ for each product.
6.2. Simulation model development
After determining the probabilistic distributions for the interar-rival times, they are entered into simulation model. Secondly, celland family formation information obtained from the mathematicalmodel and production routes are defined. Thirdly, performancemeasures are defined and included in the simulation model.
6.3. Simulation runs and analysis
In this phase, the simulation models are run to let the simula-tion model reach to the steady state. Ten replications are madefor each CMS configuration. After simulation experiments are per-formed, results are analyzed with ANOVA. One-way ANOVA is em-ployed to compare the cell utilization results obtained frommathematical models and simulation replications. The ANOVA testresults for deterministic model and stochastic model with accept-able risk levels of 10% and 50% are shown in Table 6.
There are 11 groups which consist of the mathematical models’results and the results of 10 replications. According to the results,the test statistics (sigma values) are greater than 0.05 in all CMSconfigurations. In conclusion, there is no significant difference be-tween each pair of mathematical model and corresponding simula-tion replications for all models. The patterns of behaviors that ofdeterministic and stochastic models provided are shown in Fig. 3.
In addition to ANOVA tests, expected cell utilization output ob-tained from mathematical model and actual cell utilization outputfrom simulation are also visually compared. In this comparison,95% confidence intervals are established for each cell based onmathematical model results. An example is given in Table 7 toillustrate how the confidence interval is calculated for a cell.
According to the example in Table 7, products 1, 12, 23 and 29are assigned to cell 1. The expected capacity requirements are gi-ven along with variance. The cell capacity is 2000 h annually. Theexpected capacity requirement of cell (product family) is the sumof expected utilizations of products, 1502 h. The variance is72575.6 which is the sum of variances of products. Based on the95% confidence level, z value is 1.64 and the lower and upperbounds are 1060.2 and 1943.8 h, respectively. Then, the averagecell utilization obtained from simulation is also included in graphs(Figs. 3–5).
According to the results shown in Fig. 3, all of the utilizationsobtained from simulation runs fall in between lower and upperbounds of confidence intervals. Therefore, it is concluded that themathematical models are valid based on 95% level of confidencein terms of cell utilization. Additionally, in cells which have cell
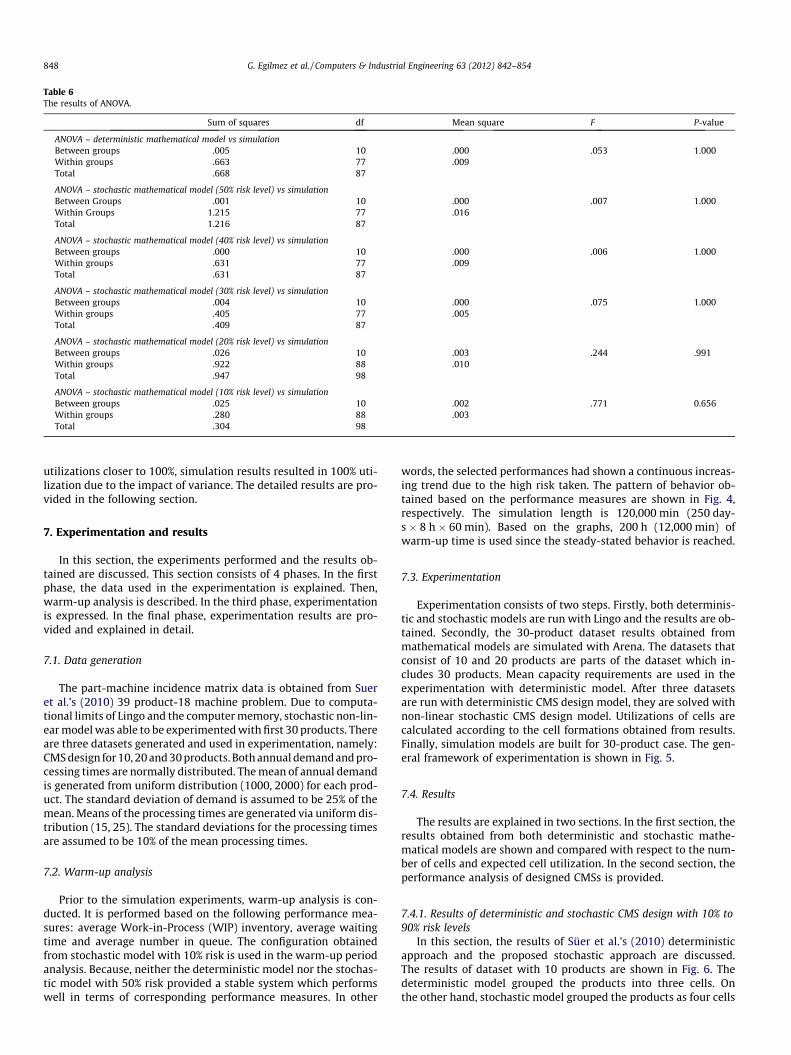
Table 6The results of ANOVA.
Sum of squares df Mean square F P-value
ANOVA – deterministic mathematical model vs simulationBetween groups .005 10 .000 .053 1.000Within groups .663 77 .009Total .668 87
ANOVA – stochastic mathematical model (50% risk level) vs simulationBetween Groups .001 10 .000 .007 1.000Within Groups 1.215 77 .016Total 1.216 87
ANOVA – stochastic mathematical model (40% risk level) vs simulationBetween groups .000 10 .000 .006 1.000Within groups .631 77 .009Total .631 87
ANOVA – stochastic mathematical model (30% risk level) vs simulationBetween groups .004 10 .000 .075 1.000Within groups .405 77 .005Total .409 87
ANOVA – stochastic mathematical model (20% risk level) vs simulationBetween groups .026 10 .003 .244 .991Within groups .922 88 .010Total .947 98
ANOVA – stochastic mathematical model (10% risk level) vs simulationBetween groups .025 10 .002 .771 0.656Within groups .280 88 .003Total .304 98
848 G. Egilmez et al. / Computers & Industrial Engineering 63 (2012) 842–854
utilizations closer to 100%, simulation results resulted in 100% uti-lization due to the impact of variance. The detailed results are pro-vided in the following section.
7. Experimentation and results
In this section, the experiments performed and the results ob-tained are discussed. This section consists of 4 phases. In the firstphase, the data used in the experimentation is explained. Then,warm-up analysis is described. In the third phase, experimentationis expressed. In the final phase, experimentation results are pro-vided and explained in detail.
7.1. Data generation
The part-machine incidence matrix data is obtained from Sueret al.’s (2010) 39 product-18 machine problem. Due to computa-tional limits of Lingo and the computer memory, stochastic non-lin-ear model was able to be experimented with first 30 products. Thereare three datasets generated and used in experimentation, namely:CMS design for 10, 20 and 30 products. Both annual demand and pro-cessing times are normally distributed. The mean of annual demandis generated from uniform distribution (1000, 2000) for each prod-uct. The standard deviation of demand is assumed to be 25% of themean. Means of the processing times are generated via uniform dis-tribution (15, 25). The standard deviations for the processing timesare assumed to be 10% of the mean processing times.
7.2. Warm-up analysis
Prior to the simulation experiments, warm-up analysis is con-ducted. It is performed based on the following performance mea-sures: average Work-in-Process (WIP) inventory, average waitingtime and average number in queue. The configuration obtainedfrom stochastic model with 10% risk is used in the warm-up periodanalysis. Because, neither the deterministic model nor the stochas-tic model with 50% risk provided a stable system which performswell in terms of corresponding performance measures. In other
words, the selected performances had shown a continuous increas-ing trend due to the high risk taken. The pattern of behavior ob-tained based on the performance measures are shown in Fig. 4,respectively. The simulation length is 120,000 min (250 day-s � 8 h � 60 min). Based on the graphs, 200 h (12,000 min) ofwarm-up time is used since the steady-stated behavior is reached.
7.3. Experimentation
Experimentation consists of two steps. Firstly, both determinis-tic and stochastic models are run with Lingo and the results are ob-tained. Secondly, the 30-product dataset results obtained frommathematical models are simulated with Arena. The datasets thatconsist of 10 and 20 products are parts of the dataset which in-cludes 30 products. Mean capacity requirements are used in theexperimentation with deterministic model. After three datasetsare run with deterministic CMS design model, they are solved withnon-linear stochastic CMS design model. Utilizations of cells arecalculated according to the cell formations obtained from results.Finally, simulation models are built for 30-product case. The gen-eral framework of experimentation is shown in Fig. 5.
7.4. Results
The results are explained in two sections. In the first section, theresults obtained from both deterministic and stochastic mathe-matical models are shown and compared with respect to the num-ber of cells and expected cell utilization. In the second section, theperformance analysis of designed CMSs is provided.
7.4.1. Results of deterministic and stochastic CMS design with 10% to90% risk levels
In this section, the results of Süer et al.’s (2010) deterministicapproach and the proposed stochastic approach are discussed.The results of dataset with 10 products are shown in Fig. 6. Thedeterministic model grouped the products into three cells. Onthe other hand, stochastic model grouped the products as four cells
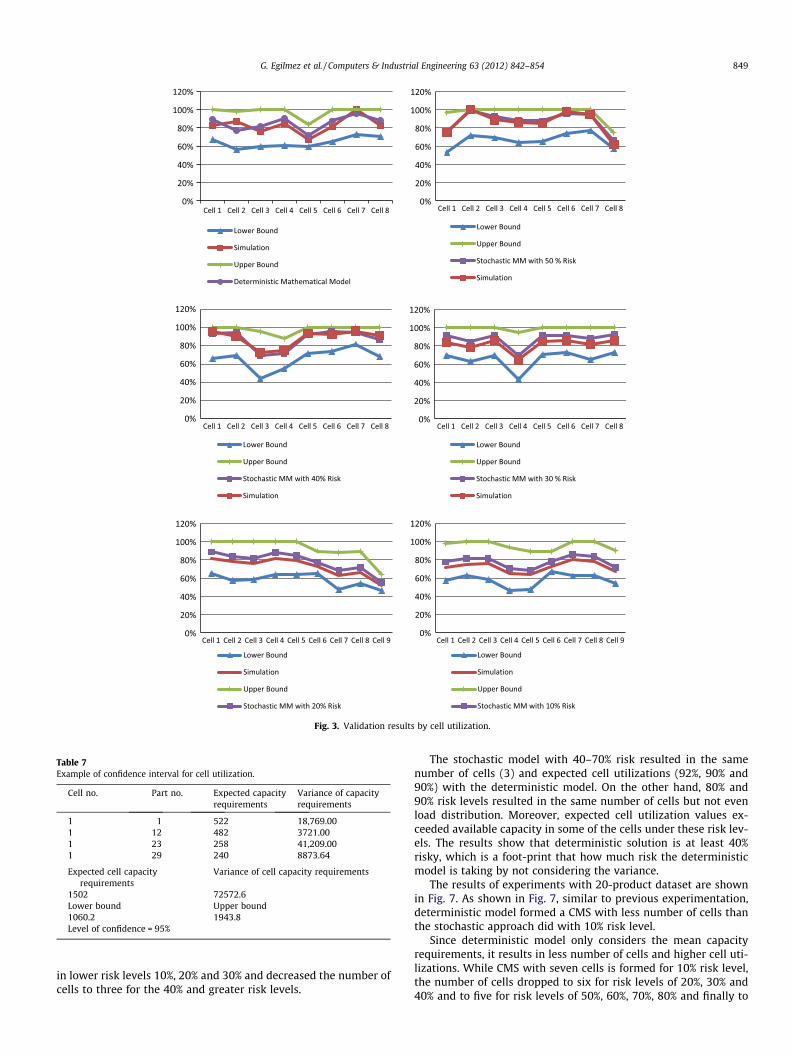
Fig. 3. Validation results by cell utilization.
Table 7Example of confidence interval for cell utilization.
Cell no. Part no. Expected capacityrequirements
Variance of capacityrequirements
1 1 522 18,769.001 12 482 3721.001 23 258 41,209.001 29 240 8873.64
Expected cell capacityrequirements
Variance of cell capacity requirements
1502 72572.6Lower bound Upper bound1060.2 1943.8Level of confidence = 95%
G. Egilmez et al. / Computers & Industrial Engineering 63 (2012) 842–854 849
in lower risk levels 10%, 20% and 30% and decreased the number ofcells to three for the 40% and greater risk levels.
The stochastic model with 40–70% risk resulted in the samenumber of cells (3) and expected cell utilizations (92%, 90% and90%) with the deterministic model. On the other hand, 80% and90% risk levels resulted in the same number of cells but not evenload distribution. Moreover, expected cell utilization values ex-ceeded available capacity in some of the cells under these risk lev-els. The results show that deterministic solution is at least 40%risky, which is a foot-print that how much risk the deterministicmodel is taking by not considering the variance.
The results of experiments with 20-product dataset are shownin Fig. 7. As shown in Fig. 7, similar to previous experimentation,deterministic model formed a CMS with less number of cells thanthe stochastic approach did with 10% risk level.
Since deterministic model only considers the mean capacityrequirements, it results in less number of cells and higher cell uti-lizations. While CMS with seven cells is formed for 10% risk level,the number of cells dropped to six for risk levels of 20%, 30% and40% and to five for risk levels of 50%, 60%, 70%, 80% and finally to
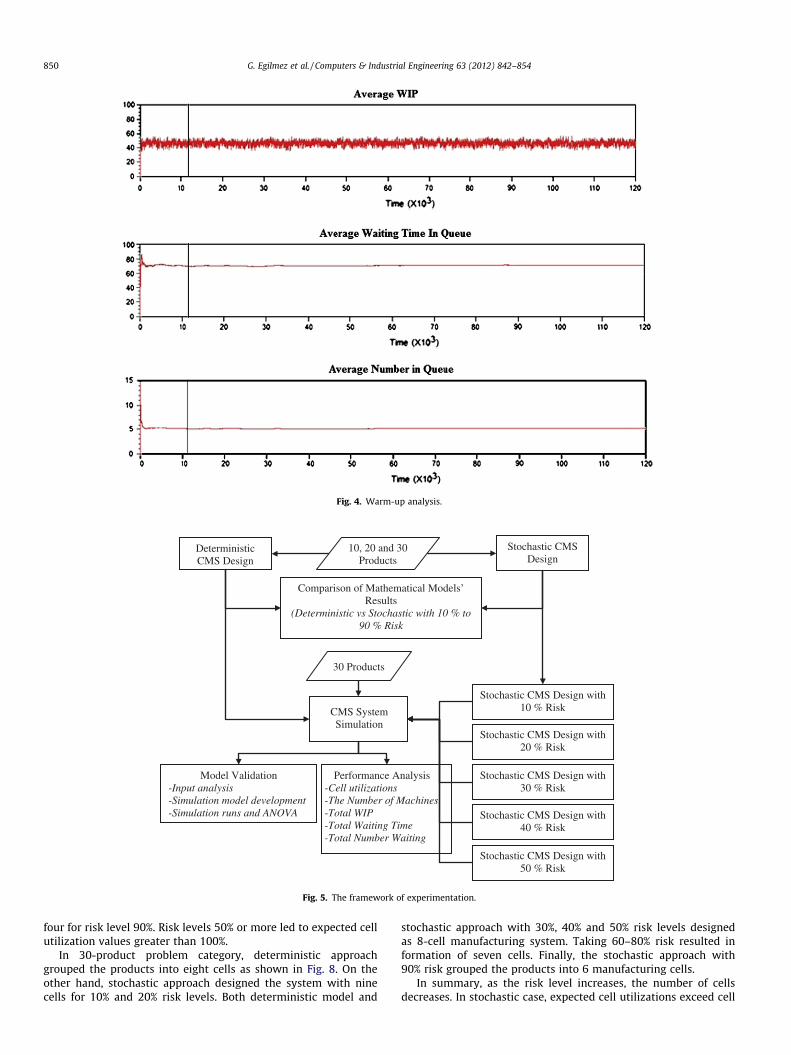
Fig. 4. Warm-up analysis.
Deterministic CMS Design
Stochastic CMS Design
10, 20 and 30 Products
Comparison of Mathematical Models’ Results
(Deterministic vs Stochastic with 10 % to 90 % Risk
CMS System Simulation
Performance Analysis-Cell utilizations-The Number of Machines-Total WIP-Total Waiting Time-Total Number Waiting
30 Products
Stochastic CMS Design with 10 % Risk
Stochastic CMS Design with 50 % Risk
Stochastic CMS Design with 30 % Risk
Stochastic CMS Design with 20 % Risk
Stochastic CMS Design with 40 % Risk
Model Validation-Input analysis-Simulation model development-Simulation runs and ANOVA
Fig. 5. The framework of experimentation.
850 G. Egilmez et al. / Computers & Industrial Engineering 63 (2012) 842–854
four for risk level 90%. Risk levels 50% or more led to expected cellutilization values greater than 100%.
In 30-product problem category, deterministic approachgrouped the products into eight cells as shown in Fig. 8. On theother hand, stochastic approach designed the system with ninecells for 10% and 20% risk levels. Both deterministic model and
stochastic approach with 30%, 40% and 50% risk levels designedas 8-cell manufacturing system. Taking 60–80% risk resulted information of seven cells. Finally, the stochastic approach with90% risk grouped the products into 6 manufacturing cells.
In summary, as the risk level increases, the number of cellsdecreases. In stochastic case, expected cell utilizations exceed cell
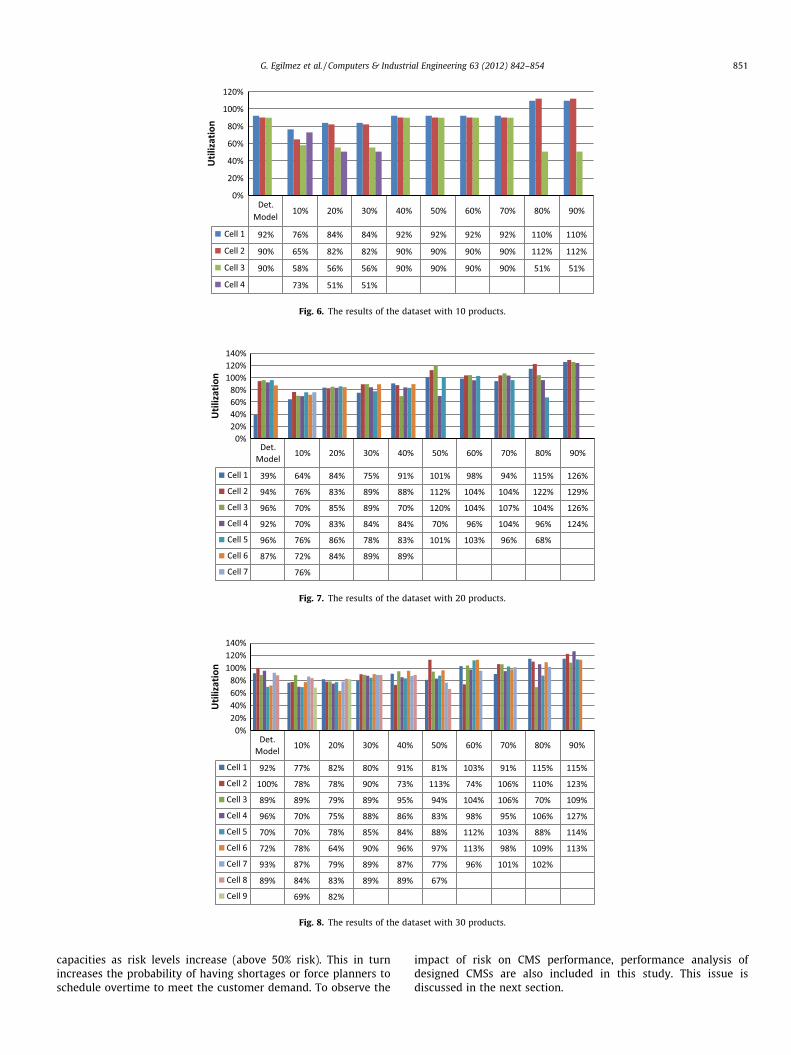
Fig. 6. The results of the dataset with 10 products.
Fig. 7. The results of the dataset with 20 products.
Fig. 8. The results of the dataset with 30 products.
G. Egilmez et al. / Computers & Industrial Engineering 63 (2012) 842–854 851
capacities as risk levels increase (above 50% risk). This in turnincreases the probability of having shortages or force planners toschedule overtime to meet the customer demand. To observe the
impact of risk on CMS performance, performance analysis ofdesigned CMSs are also included in this study. This issue isdiscussed in the next section.
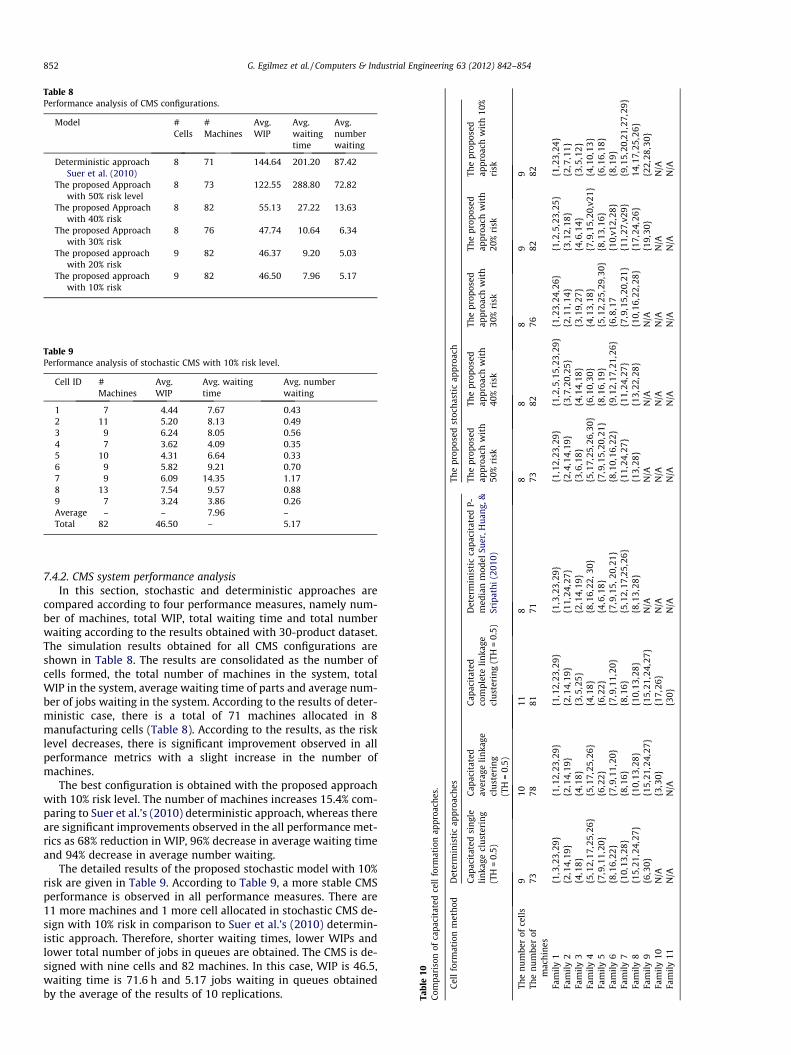
Table 8Performance analysis of CMS configurations.
Model #Cells
#Machines
Avg.WIP
Avg.waitingtime
Avg.numberwaiting
Deterministic approachSuer et al. (2010)
8 71 144.64 201.20 87.42
The proposed Approachwith 50% risk level
8 73 122.55 288.80 72.82
The proposed Approachwith 40% risk
8 82 55.13 27.22 13.63
The proposed Approachwith 30% risk
8 76 47.74 10.64 6.34
The proposed approachwith 20% risk
9 82 46.37 9.20 5.03
The proposed approachwith 10% risk
9 82 46.50 7.96 5.17
Table 9Performance analysis of stochastic CMS with 10% risk level.
Cell ID #Machines
Avg.WIP
Avg. waitingtime
Avg. numberwaiting
1 7 4.44 7.67 0.432 11 5.20 8.13 0.493 9 6.24 8.05 0.564 7 3.62 4.09 0.355 10 4.31 6.64 0.336 9 5.82 9.21 0.707 9 6.09 14.35 1.178 13 7.54 9.57 0.889 7 3.24 3.86 0.26Average – – 7.96 –Total 82 46.50 – 5.17
Tabl
e10
Com
pari
son
ofca
paci
tate
dce
llfo
rmat
ion
appr
oach
es.
Cel
lfo
rmat
ion
met
hod
Det
erm
inis
tic
appr
oach
esTh
epr
opos
edst
och
asti
cap
proa
ch
Cap
acit
ated
sin
gle
lin
kage
clu
ster
ing
(TH
=0.
5)
Cap
acit
ated
aver
age
lin
kage
clu
ster
ing
(TH
=0.
5)
Cap
acit
ated
com
plet
eli
nka
gecl
ust
erin
g(T
H=
0.5)
Det
erm
inis
tic
capa
cita
ted
P-m
edia
nm
odel
Suer
,Hu
ang,
&Sr
ipat
hi
(201
0)
The
prop
osed
appr
oach
wit
h50
%ri
sk
The
prop
osed
appr
oach
wit
h40
%ri
sk
The
prop
osed
appr
oach
wit
h30
%ri
sk
The
prop
osed
appr
oach
wit
h20
%ri
sk
The
prop
osed
appr
oach
wit
h10
%ri
sk
The
nu
mbe
rof
cell
s9
1011
88
88
99
The
nu
mbe
rof
mac
hin
es73
7881
7173
8276
8282
Fam
ily
1{1
,3,2
3,29
}{1
,12,
23,2
9}{1
,12,
23,2
9}{1
,3,2
3,29
}{1
,12,
23,2
9}{1
,2,5
,15,
23,2
9}{1
,23,
24,2
6}{1
,2,5
,23,
25}
{1,2
3,24
}Fa
mil
y2
{2,1
4,19
}{2
,14,
19}
{2,1
4,19
}{1
1,24
,27}
{2,4
,14,
19}
{3,7
,20,
25}
{2,1
1,14
}{3
,12,
18}
{2,7
,11}
Fam
ily
3{4
,18}
{4,1
8}{3
,5,2
5}{2
,14,
19}
{3,6
,18}
{4,1
4,18
}{3
,19,
27}
{4,6
,14}
{3,5
,12}
Fam
ily
4{5
,12,
17,2
5,26
}{5
,17,
25,2
6}{4
,18}
{8,1
6,22
,30}
{5,1
7,25
,26,
30}
{6,1
0,30
}{4
,13,
18}
{7,9
,15,
20,v
21}
{4,1
0,13
}Fa
mil
y5
{7,9
,11,
20}
{6,2
2}{6
,22}
{4,6
,18}
{7,9
,15,
20,2
1}{8
,16,
19}
{5,1
2,25
,29,
30}
{8,1
3,16
}{6
,16,
18}
Fam
ily
6{8
,16,
22}
{7,9
,11,
20}
{7,9
,11,
20}
{7,9
,15,
20,2
1}{8
,10,
16,2
2}{9
,12,
17,2
1,26
}{6
,8,1
7{1
0,v1
2,28
}{8
,19}
Fam
ily
7{1
0,13
,28}
{8,1
6}{8
,16}
{5,1
2,17
,25,
26}
{11,
24,2
7}{1
1,24
,27}
{7,9
,15,
20,2
1}{1
1,27
,v29
}{9
,15,
20,2
1,27
,29}
Fam
ily
8{1
5,21
,24,
27}
{10,
13,2
8}{1
0,13
,28}
{8,1
3,28
}{1
3,28
}{1
3,22
,28}
{10,
16,2
2,28
}{1
7,24
,26}
14,1
7,25
,26}
Fam
ily
9{6
,30}
{15,
21,2
4,27
}{1
5,21
,24,
27}
N/A
N/A
N/A
N/A
{19,
30}
{22,
28,3
0}Fa
mil
y10
N/A
{3,3
0}{1
7,26
}N
/AN
/AN
/AN
/AN
/AN
/AFa
mil
y11
N/A
N/A
{30}
N/A
N/A
N/A
N/A
N/A
N/A
852 G. Egilmez et al. / Computers & Industrial Engineering 63 (2012) 842–854
7.4.2. CMS system performance analysisIn this section, stochastic and deterministic approaches are
compared according to four performance measures, namely num-ber of machines, total WIP, total waiting time and total numberwaiting according to the results obtained with 30-product dataset.The simulation results obtained for all CMS configurations areshown in Table 8. The results are consolidated as the number ofcells formed, the total number of machines in the system, totalWIP in the system, average waiting time of parts and average num-ber of jobs waiting in the system. According to the results of deter-ministic case, there is a total of 71 machines allocated in 8manufacturing cells (Table 8). According to the results, as the risklevel decreases, there is significant improvement observed in allperformance metrics with a slight increase in the number ofmachines.
The best configuration is obtained with the proposed approachwith 10% risk level. The number of machines increases 15.4% com-paring to Suer et al.’s (2010) deterministic approach, whereas thereare significant improvements observed in the all performance met-rics as 68% reduction in WIP, 96% decrease in average waiting timeand 94% decrease in average number waiting.
The detailed results of the proposed stochastic model with 10%risk are given in Table 9. According to Table 9, a more stable CMSperformance is observed in all performance measures. There are11 more machines and 1 more cell allocated in stochastic CMS de-sign with 10% risk in comparison to Suer et al.’s (2010) determin-istic approach. Therefore, shorter waiting times, lower WIPs andlower total number of jobs in queues are obtained. The CMS is de-signed with nine cells and 82 machines. In this case, WIP is 46.5,waiting time is 71.6 h and 5.17 jobs waiting in queues obtainedby the average of the results of 10 replications.

G. Egilmez et al. / Computers & Industrial Engineering 63 (2012) 842–854 853
7.4.3. Analysis of cell formation and comparison with previousapproaches
Several cell formation approaches have been proposed in liter-ature. However, since majority of them does not consider capacitywhile grouping products into cells, ones that are in the same clas-sification with the proposed approach are compared. Capacitatedsingle, average and complete linkage cell formation methods(CFMs) proposed by Vega (1999) are used for comparison pur-poses. The results of cell formation methods are provided in Table10.
According to the results, the minimum number of machines isobtained with deterministic capacitated P-Median model (Sueret al., 2010). The number of machines ranges between 71 and 82and the number of cells varies from 8 to 11. Since machine costsare similar for the problem studied, it is sufficient to check thenumber of machines required as a result of cell formation. The pro-posed stochastic capacitated P-median model produced compara-ble results with respect to the number of machines compared toother capacitated clustering procedures, when a risk level of 50%is considered. However, there is a tradeoff between the numberof machines thus the number of cells and risk of exceeding avail-able capacity. Deterministic capacitated cell formation methodsdo not provide any information about this tradeoff. However, theproposed approach identifies the risk of exceeding the availablecapacity while maximizing the total similarity among products.Therefore, decision maker can vary risk levels and generate alter-native designs prior to implementation.
8. Conclusion and future work
In this study, stochastic capacitated cellular manufacturing sys-tem has been addressed. Süer et al.’s (2010) deterministic capaci-tated P-Median model is modified and a non-linear mathematicalmodel is developed to deal with uncertain demand and processingtimes. Demand and processing times are normally distributed andthe statistical distributions for capacity requirements are deter-mined via statistical analyses and non-parametric tests. Indepen-dent cells are assumed and inter-cell movement is not allowed.Three datasets are used for experimenting with deterministic andproposed stochastic mathematical models, which consist of 10,20 and 30 products, respectively.
Cell and family formations obtained from mathematical modelsare used to build simulation models. The results of mathematicalmodels are validated by comparing with simulation results via AN-OVA. According to the ANOVA results, there is no significant differ-ence observed between the results of mathematical models andsimulations. Both CMSs designed with deterministic and stochasticmathematical models are compared in terms of CM performancemeasures suggested by Wemmerlov and Johnson (Wemmerlov &Johnson, 1997).
According to the results of mathematical models, deterministicmodel resulted in less number of cells in comparison to the sto-chastic model with lower levels of risks. As the risk level increased,the proposed approach formed CMS with lower number of cellsand machines in all datasets and as a result, cell utilizations areincreased.
To analyze the performance of designed CMSs by deterministicand proposed stochastic approaches, simulation experiments areperformed. A total of six CMS configurations are considered,namely: Suer et al.’s (2010) deterministic approach and the pro-posed stochastic approach with 10%, 20%, 30%, 40% and 50% risklevels. In this paper, Suer et al.’s (2010) deterministic capacitatedP-median model is used as benchmark work. Deterministic modelformed the CMS with less number of cells and machines which re-sulted in higher cell utilizations. However, according to simulation
results, the highly utilized cells resulted in significant amount oftotal WIP, average waiting time and average number of jobs wait-ing. Results indicate that the proposed stochastic model with 10%risk level performed as the best in all performance measures ex-cept the number of machines. If the number of machines is a signif-icant concern to the designer, then 30% risk level is also a viableoption as it increases the number of machines by 7% while obtain-ing significant improvements in all other performance metrics. Asthe risk level increases, cell utilizations increase which result inlonger queue sizes and waiting times and more WIP.
This problem may be extended to include other features of CMSdesign such as allowance of inter-cell movement, system imple-mentation costs, setup times, worker allocation, different similar-ity matrix definitions. Another possible direction is to study thebottleneck machine definition in detail and assess its impact onthe results. Finally, genetic algorithms or other meta-heuristicscan be also considered to solve larger problem sizes.
References
Akturk, M. S., & Turkcan, A. (2000). Cellular manufacturing system design using aholonistic approach. International Journal of Production Research, 38(10), 21.
Albadawi, Z., Bashir, H. A., & Chen, M. (2005). A mathematical approach for theformation of manufacturing cells. Computers and Industrial Engineering, 48(1),3–21.
Ang, C. L., & Willey, P. C. T. (1984). A comparative study of the performance of pureand hybrid group technology manufacturing systems using computersimulation techniques. International Journal of Production Research, 22(2),193–233.
Asokan, P., Prabhakaran, G., & Satheesh, K. G. (2001). Machine-cell grouping incellular manufacturing systems using non-traditional optimisation techniques– a comparative study. International Journal of Advanced ManufacturingTechnology, 18(2), 140–147.
Barlas, Y. (1996). Formal aspects of model validity and validation in systemdynamics. System Dynamics Review, 12(3), 183–210.
Burbidge, J. L., & Wei, J. C. (1992). Change to group technology: Process organizationis obsolete. International journal of production research, 30(5), 1209–1222.
Cao, D., & Chen, M. (2004). Using penalty function and Tabu search to solve cellformation problems with fixed cell cost. Computers & Operations Research, 31(1),21–37.
Chen, M. (1998). 77 Annals of operations research 109-128-128 a mathematicalprogramming model for system reconfiguration in a dynamic cellularmanufacturing environment. Netherlands: Springer.
Habchi, G., & Berchet, C. (2003). A model for manufacturing systems simulationwith a control dimension. Simulation Modelling Practice and Theory, 11(3),21–44.
Hachicha, W., Masmoudi, F., & Haddar, M. (2007). An improvement of a cellularmanufacturing system design using simulation analysis. International Journal ofSimulation Modelling, 6(4), 193–205. <http://mpra.ub.uni-muenchen.de/8922/>(Accessed January 9, 2012).
Heragu, S., & Chen, J. (1998). Optimal solution of cellular manufacturing systemdesign: Benders’ decomposition approach. European Journal of OperationalResearch, 107(1), 175–192.
Jayaswal, S., & Adil, G. K. (2004). Efficient algorithm for cell formation withsequence data, machine replications and alternative process routings.International Journal of Production Research, 42(12), 2419–2433.
Kamrani, A. K., Parsaei, H. R., & Leep, H. R. (1995). 24 Planning, Design, and Analysis ofCellular Manufacturing Systems. Elsevier.
Kusiak, A. (1987). The generalized group technology concept. International Journal ofProduction Research, 25(4), 561–569.
Masmoudi, F. (2006). Sizing manufacturing cell machines based on the simulationand an expert system. International journal of simulation modeling, 5(2), 45–55.
McAuley, J. (1972). Machine grouping for efficient production. Production Engineer,51(2), 53–57.
Moon, C., Gen, M., & Suer, G. A. (1999). A genetic algorithm-based approach fordesign of independent manufacturing cells. International Journal of ProductionEconomics, 60–61(2), 421–426.
Purcheck, G. F. K. (1974). A mathematical classification as a basis for the design ofgroup-technology production cells. Production Engineer, 54(1), 35–48.
Rajamani, D., Singh, N., & Aneja, Y. P. (1990). Integrated design of cellularmanufacturing systems in the presence of alternative process plans.International Journal of Production Research, 28(8), 1541–1554.
Saad, S. (2003). The reconfiguration issues in manufacturing systems. Journal ofMaterials Processing Technology, 138(1–3), 277–283.
Saidi-Mehrabad, M., & Ghezavati, V. R. (2009). Designing cellular manufacturingsystems under uncertainty. Journal of Uncertain Systems, 3(4), 315–320.
Satoglu, S. I., & Suresh, N. C. (2009). A goal-programming approach for design ofhybrid cellular manufacturing systems in dual resource constrainedenvironments. Computers & Industrial Engineering, 56(2), 560–575.

854 G. Egilmez et al. / Computers & Industrial Engineering 63 (2012) 842–854
Seifoddini, H. (1990). A probabilistic model for machine cell formation. Journal ofManufacturing Systems, 9(1), 69–75.
Shafer, S., & Rogers, D. (1991). A goal programming approach to the cell formationproblem. Journal of Operations Management, 10(1), 28–43.
Shang, J. S., & Tadikamalla, P. R. (1998). Multicriteria design and control of a cellularmanufacturing system through simulation and optimization. InternationalJournal of Production Research, 36(6), 1515–1528.
Shtubt, A. (1989). Modelling group technology cell formation as a generalizedassignment problem. International Journal of Production Research, 27(5),775–782.
Sofianopoulou, S. (1999). Manufacturing cells design with alternative process plansand/or replicate machines. International Journal of Production Research, 37(3),707–720.
Solimanpur, M., Vrat, P., & Shankar, R. (2004). A multi-objective genetic algorithmapproach to the design of cellular manufacturing systems. International Journalof Production Research, 42, 1419–1441.
Suer, G. A., & Ortega, M. (1996). Flexibility considerations in designingmanufacturing cells: A case study. In Group technology and cellularmanufacturing - methodologies and applications (pp. 97–127). Amsterdam, TheNetherlands: Gordon and Branch Science.
Suer, G. A., Huang, J., & Sripathi, M. (2010). Design of dedicated, shared andremainder cells in a probabilistic demand environment. International Journal ofProduction Research, 48(19–20), 5613–5646.
Suer, G. A., Pena, Y., & Vazques, R. (2003). Cellular design to minimise investmentcosts by using evolutionary programming. International Journal of ManufacturingTechnology and Management, 5(1), 118–132.
Vega, M. J. C. (1999). 450 A capacity-driven clustering procedure for family formation.University of Puerto Rico.
Wang, J. (1998). A linear assignment algorithm for formation of machine cells andpart families in cellular manufacturing. Computers & Industrial Engineering,35(1–2), 81–84.
Wei, Jerry C., & Gaither, Norman (1990). An optimal model for cell formationdecisions. Decision Sciences, 21(1), 416–433.
Wemmerlov, U., & Johnson, D. J. (1997). Cellular manufacturing at 46 user plants:implementation experiences and performance improvements. InternationalJournal of Production Research, 35(1), 29–49.
Wicks, E. M., & Reasor, R. J. (1999). 31 IIE transactions 11-20-20 designing cellularmanufacturing systems with dynamic part populations. Netherlands: Springer.