![Chanukah Notebooking Activity · 8]]ldk wkh frppdqghu ri wkh ghihqvh irufhv dqg wkh hoghuv ri wkh wrzq wulhg wr fdop wkh 3DJH RI SRSXODFH ZLWKRXW VXFFHVV )LQDOO\ WKH\ SOHDGHG ³*LYH](https://static.fdocuments.us/doc/165x107/5e10b69692860a5fec500ae6/chanukah-notebooking-activity-8ldk-wkh-frppdqghu-ri-wkh-ghihqvh-irufhv-dqg-wkh.jpg)
STM ID3.3.7 EMSN Test Report Numerical Analysis Southern ... · &kdw )xqfwlrq $ vwdqgdorqh vriwzduh...
28
Document no Document No: STM_ID3.3.7 EMSN Test Report: Numerical Data Analysis Southern Baltic Scenario Date: 2018/12/12
Transcript of STM ID3.3.7 EMSN Test Report Numerical Analysis Southern ... · &kdw )xqfwlrq $ vwdqgdorqh vriwzduh...
Document no
Document No: STM_ID3.3.7 EMSN Test Report: Numerical Data Analysis
Southern Baltic Scenario Date: 2018/12/12
2
DOCUMENT STATUS Authors
Name Organisation
Tina Scheidweiler Fraunhofer CML
Reto Weber Chalmers
Review
Name Organisation
Approval
Name Organisation Signature Date
Document History
Version Date Status Initials Description
The sole responsibility of this publication lies with the author. The European Union is not responsible for any use that may be made of the information contained therein.
3
Table of contents List of figures ......................................................................................................................... 4
List of tables .......................................................................................................................... 4
Abbreviations ........................................................................................................................ 5
1 Background .................................................................................................................... 6
2 Methodology ................................................................................................................... 7
3 Delimitation .................................................................................................................... 7
4 Simulation scenario Southern Baltic ............................................................................... 8
5 Data Collection ............................................................................................................... 9
6 Numerical data analysis ................................................................................................. 9
6.1 Collision Index ......................................................................................................... 9
6.2 Grounding Index .....................................................................................................10
6.3 Environment Index .................................................................................................10
6.4 Manoeuvrability of a ship ........................................................................................11
6.5 Analysis Framework ...............................................................................................12
6.6 Analysis results ......................................................................................................13
6.6.1 Baseline runs ..................................................................................................13
6.6.2 STM run ..........................................................................................................18
7 Visual analysis ..............................................................................................................22
8 Conclusions ...................................................................................................................25
9 References ....................................................................................................................27

4
List of figures
Figure 1: Analysis Framework used for safety index calculation. ..........................................13 Figure 2: Average Safety Index OS – Baseline run. ..............................................................17 Figure 3: Average Safety Index TS – Baseline run. ..............................................................17 Figure 4: Minimum Safety Index OS – Baseline run. ............................................................18 Figure 5: Average Safety Index OS – STM run. ....................................................................21 Figure 6: Average Safety Index TS - STM run. .....................................................................21 Figure 7: Minimum Safety Index OS – STM run. ...................................................................22 Figure 8: Histogram of intersections to the reference line Puttgarden including the Oil Spill
Area – baseline run. ......................................................................................................23 Figure 9: Histogram of intersections to the reference line Puttgarden including the Oil Spill
Area – STM run. ............................................................................................................23 Figure 10: Heatmap and Oil Spill Area – Baseline runs ........................................................24 Figure 11: Heatmap and Oil Spill Area – STM runs ..............................................................24 Figure 12: Histogram Safety Indices – baseline run ..............................................................25 Figure 13: Histogram Safety Indices – STM run ...................................................................25
List of tables
Table 1: Simulation scenarios. ............................................................................................... 8 Table 2: Simulator centers participating in the EMSN ............................................................ 8 Table 3: Input variables used for estimating the Collision Index (CI). ....................................10 Table 4: Manoeuvrability-Indices for different ship types. .....................................................12 Table 5: Average Safety Indices of Baseline run 92. ............................................................16 Table 6: Average Safety Indices of STM run 101. .................................................................20
5
Abbreviations
The following abbreviations are used in this document:
AIS Automatic Identification System
CI Collision Index
COLREG International Regulations for Preventing Collisions at Sea
CPA Closest Point of Approach
EMSN European Maritime Simulator Network
GI Grounding Index
OS Own Ship
SI Safety Index
STM Sea Traffic Management
S2SREX Ship to Ship Route Exchange
TCPA Time to Closest Point of Approach
TS Target Ship
6
1 Background
The primary purpose of the European Maritime Simulator Network (EMSN) is to gain
experience with STM services and to understand how involved persons and institutions deal
with its capabilities. This is done in a simulated environment, which saves large amounts of
time, costs and environmental impact.
The scope and purpose of the various EMSN simulations are to reflect the STM concept and
its services, to validate and evaluate the findings and to give input to various hypotheses and
FSA developed by other activities within the project. The following services were implemented
and available in the EMSN simulations:
Ship-to-ship route exchange:
This service provides the navigator with a route segment consisting of the next 7 waypoints of
the monitored route of another vessel. Route segments are broadcasted through Automatic
Identification System (AIS) and give additional information to the presently available data
obtained by radar/ARPA and AIS. Nothing in the S2SREX information exonerates the
navigator from applying the International Regulations for Preventing Collisions at Sea
(COLREG) and rather than being used in a close quarters situation, the S2SREX may be used
as a tactical tool for supporting decision-making and situational awareness at a longer range.
Rendezvous Function:
As an integral part of the S2SREX, this function allows the navigator to view where own ship
will meet a target ship if both vessels continue along their monitored broadcasted route with
the present speed over ground. This function provides route-based Closest Point of Arrival
(CPA) and Time to Closest Point of Arrival (TCPA) based on AIS information.
Shore-to-Ship Route Exchange (Receiving route suggestions from shore):
This service allows the shore-centre to send a suggested route to the ship, to be reviewed by
the bridge team and then either accepted or rejected. This service can be used in various
situations, for example if several vessels are warned to avoid a certain area, the shore centre
can plan a route based on all available information and directly send this route to the vessel.
Receiving Navigational Warnings:
This service provides a notification which overlays a Navigational Warning Message directly
on the ECDIS. If the Navigational Warning involves a geographical area to avoid or be aware
of, this will be automatically plotted onto the ECDIS so it is visible to the bridge team.
7
Chat Function:
A standalone software like other programs (e.g. Skype) which was integrated on the same
station as the ECDIS. Text communications with other stations with enabled STM tools such
as Shore Centres and ships.
Enhanced Monitoring and Route Cross Check:
After having received a ship’s monitored route and schedule, shore centres will be able to
detect if planned schedule is not kept or if ship deviates from monitored route. A shore centre
can receive any planned route and cross check such route against any navigational dangers
and if necessary send a route suggestion back to the ship.
2 Methodology
To determine whether the STM services have a measurable effect on maritime traffic safety,
the following methodology was used:
1) Specify a set of maritime traffic scenarios.
2) Simulate the scenarios with and without the STM services (STM runs and Base Line
runs).
3) Assess the traffic safety in each of the scenarios with and without the STM services
using a numerical methodology further described in chapter 6.
4) Compare the safety assessments.
3 Delimitation
This study is not attempting to make a comparative analysis of the possible effects of each
individual STM service on traffic safety separately. Rather, this study is an attempt to capture
the possible effects of several STM services being available at the time of the simulation runs
based on numerical data collected during 4 weeks of simulation trials in the EMSN. The
services may have been used individually by the test participants or in combination with other
services. Other factors which may have an influence when analysing possible effects of
introducing STM services such as usability of ECDIS in general, the familiarization and training
in the use of the services, the experience of the test participants, etc. have not been considered
in this study. In addition, it should be emphasised that within the numerical data analysis only
two runs have been analysed (one with STM services and one without). This fact is conformal,
since the depicted runs are considered as representatives of all executed simulation runs.
8
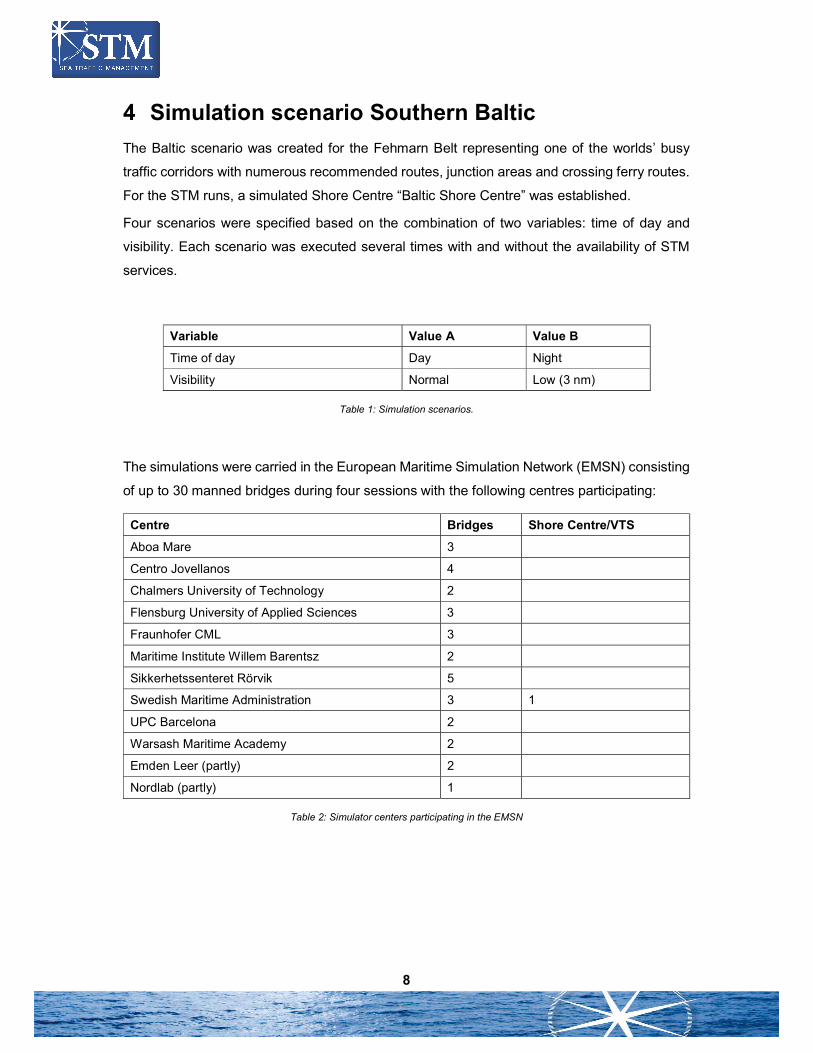
4 Simulation scenario Southern Baltic
The Baltic scenario was created for the Fehmarn Belt representing one of the worlds’ busy
traffic corridors with numerous recommended routes, junction areas and crossing ferry routes.
For the STM runs, a simulated Shore Centre “Baltic Shore Centre” was established.
Four scenarios were specified based on the combination of two variables: time of day and
visibility. Each scenario was executed several times with and without the availability of STM
services.
Variable Value A Value B
Time of day Day Night
Visibility Normal Low (3 nm)
Table 1: Simulation scenarios.
The simulations were carried in the European Maritime Simulation Network (EMSN) consisting
of up to 30 manned bridges during four sessions with the following centres participating:
Centre Bridges Shore Centre/VTS
Aboa Mare 3
Centro Jovellanos 4
Chalmers University of Technology 2
Flensburg University of Applied Sciences 3
Fraunhofer CML 3
Maritime Institute Willem Barentsz 2
Sikkerhetssenteret Rörvik 5
Swedish Maritime Administration 3 1
UPC Barcelona 2
Warsash Maritime Academy 2
Emden Leer (partly) 2
Nordlab (partly) 1
Table 2: Simulator centers participating in the EMSN

9
5 Data Collection
To enable a centralized data tracking and storing from all centres and bridges in the EMSN, a
tracking application was set up at Fraunhofer CML which was able to send and receive PDUs
using an own Application ID. The tracking tool itself is not further detailed in this document but
relies on the outlined PDU communication as described in STM_ID3.2.1 EMSN Technical
Description.
6 Numerical data analysis
In order to assess the safety of different encounter situations and thus the validity of the
available STM services, a Safety Index (SI) was developed. The SI is used to further analyze
navigators’ behavior and decisions in different maritime traffic scenarios that are conducted
within the EMSN. For the assessment of navigators’ behaviour in encounter situations between
ships, it is required to develop an approach that accounts for the full complexity of the task.
While most assessment methods conventionally used depend to a large degree on expert
opinions, this study aims for a more objective and quantitative approach.
The most widely used approach for the assessment of ship handling simulation is rating by
expert opinion. An obvious disadvantage of this methodology is the high influence of subjective
judgement. This means that the same simulation results can receive totally divergent ratings
when being assessed by different experts. To compensate this drawback, an alternative
approach will be used for analysing and evaluating the impact of the available services at the
time of the simulations in the STM concept on ship traffic.
Within the STM Validation project, the level of safety of different traffic situations will be
measured based on a fuzzy logic approach, cf. (Bai, 2006), (Kozlowska, 2012), (Mamdani,
1975), (Perera, 2011) and (Zadeh, 1965). The SI may be used within the Formal Safety
Assessment (FSA) of Activity 5 to assess the potential risk reduction by the implementation of
the STM and its various operational services. Overall, the safety index consists of a collision
index, a grounding index, an environmental index and the manoeuvrability of the
corresponding ship, each of which is in general terms described below. Further details may be
obtained by contacting the author.
6.1 Collision Index Following the definition of the input variables, the membership functions for the fuzzy models
estimating a collision index are created based on the results of pre-conducted instructor
surveys and/or a comprehensive literature research.
10
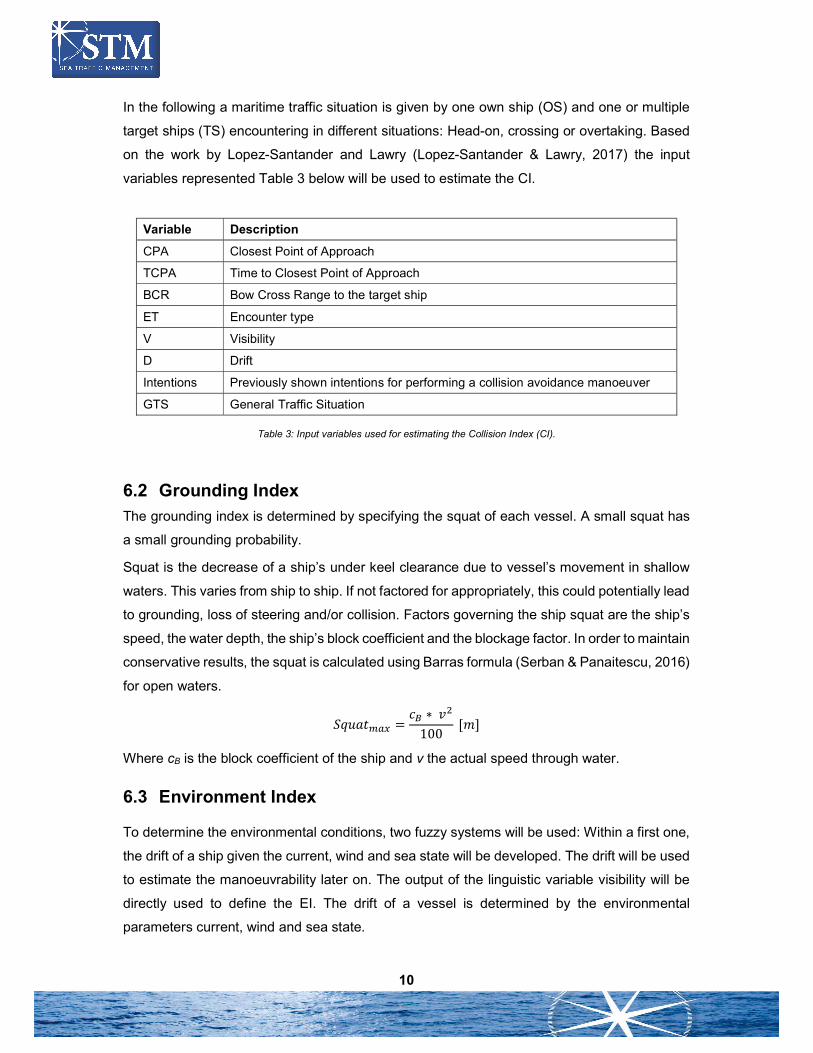
In the following a maritime traffic situation is given by one own ship (OS) and one or multiple
target ships (TS) encountering in different situations: Head-on, crossing or overtaking. Based
on the work by Lopez-Santander and Lawry (Lopez-Santander & Lawry, 2017) the input
variables represented Table 3 below will be used to estimate the CI.
Variable Description
CPA Closest Point of Approach
TCPA Time to Closest Point of Approach
BCR Bow Cross Range to the target ship
ET Encounter type
V Visibility
D Drift
Intentions Previously shown intentions for performing a collision avoidance manoeuver
GTS General Traffic Situation
Table 3: Input variables used for estimating the Collision Index (CI).
6.2 Grounding Index The grounding index is determined by specifying the squat of each vessel. A small squat has
a small grounding probability.
Squat is the decrease of a ship’s under keel clearance due to vessel’s movement in shallow
waters. This varies from ship to ship. If not factored for appropriately, this could potentially lead
to grounding, loss of steering and/or collision. Factors governing the ship squat are the ship’s
speed, the water depth, the ship’s block coefficient and the blockage factor. In order to maintain
conservative results, the squat is calculated using Barras formula (Serban & Panaitescu, 2016)
for open waters.
𝑆𝑞𝑢𝑎𝑡 =𝑐 ∗ 𝑣
100 [𝑚]
Where cB is the block coefficient of the ship and v the actual speed through water.
6.3 Environment Index
To determine the environmental conditions, two fuzzy systems will be used: Within a first one,
the drift of a ship given the current, wind and sea state will be developed. The drift will be used
to estimate the manoeuvrability later on. The output of the linguistic variable visibility will be
directly used to define the EI. The drift of a vessel is determined by the environmental
parameters current, wind and sea state.

11
6.4 Manoeuvrability of a ship
The manoeuvrability of a ship is determined by the block coefficient of length and breadth and
the type of ship transmitted via AIS. If the block coefficient is small, then there is no good ability
to manoeuvre, the larger it becomes, the better the ability to manoeuvre the ship (American
Bureau of Shipping, 2006). A poor manoeuvrability causes a deterioration of the Safety Index.
An avoiding manoeuvre is normally performed by a course change to starboard. According to
rule 14 in the COLREGs (International Maritime Organization, 1974) vessels meeting in a
head-on situation should both change their course to starboard. Rule 15 in the COLREGs
(International Maritime Organization, 1974) states that when two power-driven vessels are
crossing so as to involve risk of collision, the vessel which has the other on her own starboard
side shall keep out of the way and shall, if the circumstances of the case admit, avoid crossing
ahead of the other vessel, which normally means a turn to port side. If the own ship has no or
only a small ability to turn to starboard side due to other target ships or shallow water, the
safety level decreases in the index.
The manoeuvrability of a vessel strongly depends on its manoeuvring devices. This includes
the rudder, fixed lateral areas1 , transverse thrusters, propeller (with fixed pitch or controllable
pitch, Voith Schneider propeller or azimuth thruster). In addition, the engine has an influence
on the manoeuvrability of the vessel (two or four stroke engines or electrically driven). Since
AIS does not include this type of information the manoeuvrability of a ship has to be estimated.
Thus, the Manoeuvrability-Index CML developed is according to the AIS data a function of the
following variables.
𝑓(𝑉𝑒𝑠𝑠𝑒𝑙 𝑡𝑦𝑝𝑒, 𝐿, 𝐵) = [𝑔𝑜𝑜𝑑, 𝑝𝑜𝑜𝑟, 𝑛𝑜𝑛𝑒]
The main idea is to give every ship type a classification of the manoeuvrability. For passenger
ships, cargo ships, tanker and tugs an additional factor will be considered. The ratio length to
breadth will change manoeuvrability index of the actual ship. The larger the ratio, the slender
the ship. This is good for speed and course keeping, but rather bad for manoeuvring. For this
ship types good L/B ratios will be estimated. If a ship has a greater L/B ratio then the estimated
one, the estimated manoeuvrability will be improved one level and vice versa. Table 4 shows
the Manoeuvrability-Index for each ship type.
1 The lateral area of the hull is the “area of the profile of the underwater hull of a ship when projected normally upon the vertical, longitudinal centreline, including the area of skegs, deadwood, ect. Usually areas which lie abreast of one another, such as those of multiple skegs, are included once only. Lateral area can refer not only to the whole body, but also to forebody, afterbody, entrance, run, ect.” (ITTC, 2008)

12
Table 4: Manoeuvrability-Indices for different ship types.
6.5 Analysis Framework For the fast visualization and analysis of the data an analysis framework was developed, which
is shown in figure 1. In addition to the selection of an own and traffic ship, information regarding
the weather and environmental conditions as well as the basic data of the simulation run and
static ship data are provided.
AIS SHIPTYPE TYPE NAME Maneuverability L/B
10-19 Reserved Poor x
20-28 Wing In Grnd Poor x
29 SAR Aircraft Good x
30 Fishing Median x
31-32 Tug Good 4
33 Dredger Median x
34 Dive Vessel Median x
35 Military Ops Good x
36 Sailing Vessel Median x
37 Pleasure Craft Median x
38 Reserved Poor x
39 Reserved Poor x
40-49 High-Speed Craft Good x
50 Pilot Vessel good x
51 SAR Good x
52 Tug Good 4
53 Port Tender Median x
54 Anti-Pollution Median x
55 Law Enforce Poor x
56 Local Vessel Median x
57 Local Vessel Median x
58 Medical Trans Median x
59 Special Craft Median x
60-69 Passenger Good 7
70-79 Cargo Median 6
80-89 Tanker Good 6

13
Figure 1: Analysis Framework used for safety index calculation.
6.6 Analysis results For the first evaluation, an analysis of baseline runs and runs with STM equipment was carried
out.
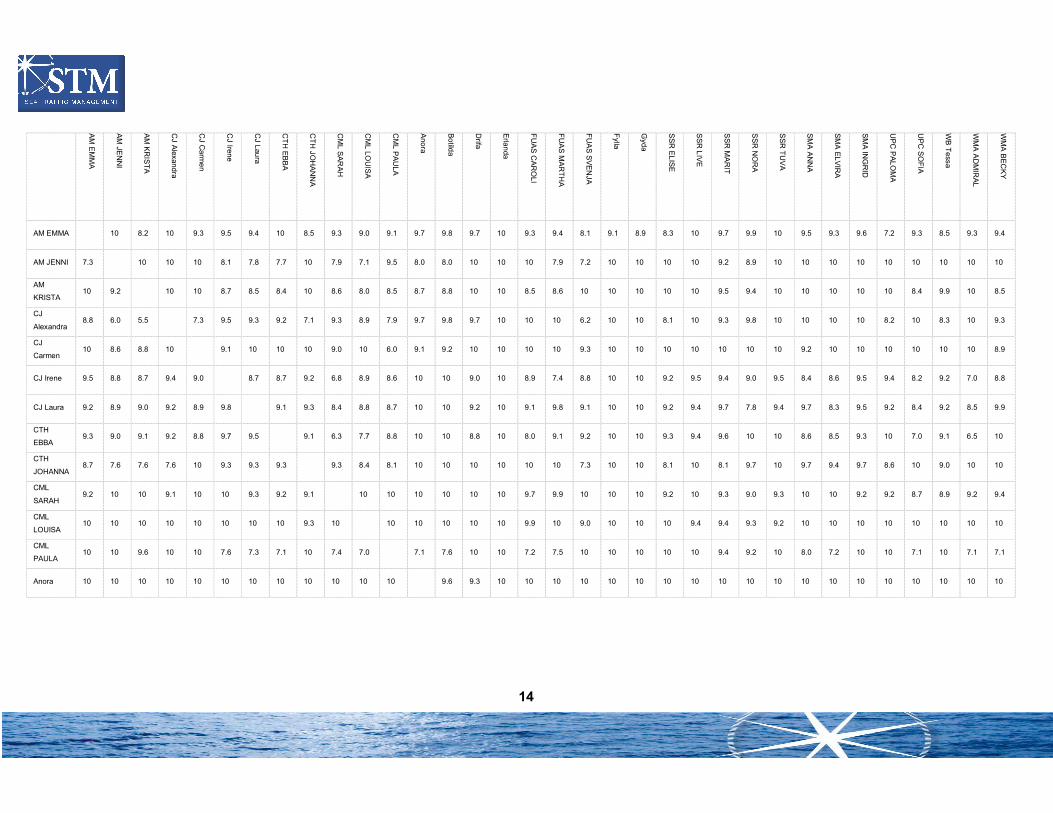
6.6.1 Baseline runs To evaluate the effects of STM services, safety indices of the baseline runs are determined in
a first step. The following analyses focus the run with id 92. For this purpose, each combination
of OS and TS and their corresponding CI and SI was determined. The following table contains
the average rounded SI of each combination.
14
AM
EM
MA
AM
JEN
NI
AM
KR
IST
A
CJ A
lexandra
CJ C
arm
en
CJ Ire
ne
CJ Lau
ra
CT
H E
BB
A
CT
H JO
HA
NN
A
CM
L SA
RA
H
CM
L LOU
ISA
CM
L PA
ULA
Ano
ra
Botild
a
Drifa
Erla
nda
FU
AS
CA
RO
LI
FU
AS
MA
RT
HA
FU
AS
SV
EN
JA
Fylla
Gyd
a
SS
R E
LIS
E
SS
R L
IVE
SS
R M
AR
IT
SS
R N
OR
A
SS
R T
UV
A
SM
A A
NN
A
SM
A E
LVIR
A
SM
A IN
GR
ID
UP
C P
AL
OM
A
UP
C S
OF
IA
WB
Tessa
WM
A A
DM
IRA
L
WM
A B
EC
KY
AM EMMA 10 8.2 10 9.3 9.5 9.4 10 8.5 9.3 9.0 9.1 9.7 9.8 9.7 10 9.3 9.4 8.1 9.1 8.9 8.3 10 9.7 9.9 10 9.5 9.3 9.6 7.2 9.3 8.5 9.3 9.4
AM JENNI 7.3 10 10 10 8.1 7.8 7.7 10 7.9 7.1 9.5 8.0 8.0 10 10 10 7.9 7.2 10 10 10 10 9.2 8.9 10 10 10 10 10 10 10 10 10
AM
KRISTA 10 9.2 10 10 8.7 8.5 8.4 10 8.6 8.0 8.5 8.7 8.8 10 10 8.5 8.6 10 10 10 10 10 9.5 9.4 10 10 10 10 10 8.4 9.9 10 8.5
CJ
Alexandra 8.8 6.0 5.5 7.3 9.5 9.3 9.2 7.1 9.3 8.9 7.9 9.7 9.8 9.7 10 10 10 6.2 10 10 8.1 10 9.3 9.8 10 10 10 10 8.2 10 8.3 10 9.3
CJ
Carmen 10 8.6 8.8 10 9.1 10 10 10 9.0 10 6.0 9.1 9.2 10 10 10 10 9.3 10 10 10 10 10 10 10 9.2 10 10 10 10 10 10 8.9
CJ Irene 9.5 8.8 8.7 9.4 9.0 8.7 8.7 9.2 6.8 8.9 8.6 10 10 9.0 10 8.9 7.4 8.8 10 10 9.2 9.5 9.4 9.0 9.5 8.4 8.6 9.5 9.4 8.2 9.2 7.0 8.8
CJ Laura 9.2 8.9 9.0 9.2 8.9 9.8 9.1 9.3 8.4 8.8 8.7 10 10 9.2 10 9.1 9.8 9.1 10 10 9.2 9.4 9.7 7.8 9.4 9.7 8.3 9.5 9.2 8.4 9.2 8.5 9.9
CTH
EBBA 9.3 9.0 9.1 9.2 8.8 9.7 9.5 9.1 6.3 7.7 8.8 10 10 8.8 10 8.0 9.1 9.2 10 10 9.3 9.4 9.6 10 10 8.6 8.5 9.3 10 7.0 9.1 6.5 10
CTH
JOHANNA 8.7 7.6 7.6 7.6 10 9.3 9.3 9.3 9.3 8.4 8.1 10 10 10 10 10 10 7.3 10 10 8.1 10 8.1 9.7 10 9.7 9.4 9.7 8.6 10 9.0 10 10
CML
SARAH 9.2 10 10 9.1 10 10 9.3 9.2 9.1 10 10 10 10 10 10 9.7 9.9 10 10 10 9.2 10 9.3 9.0 9.3 10 10 9.2 9.2 8.7 8.9 9.2 9.4
CML
LOUISA 10 10 10 10 10 10 10 10 9.3 10 10 10 10 10 10 9.9 10 9.0 10 10 10 9.4 9.4 9.3 9.2 10 10 10 10 10 10 10 10
CML
PAULA 10 10 9.6 10 10 7.6 7.3 7.1 10 7.4 7.0 7.1 7.6 10 10 7.2 7.5 10 10 10 10 10 9.4 9.2 10 8.0 7.2 10 10 7.1 10 7.1 7.1
Anora 10 10 10 10 10 10 10 10 10 10 10 10 9.6 9.3 10 10 10 10 10 10 10 10 10 10 10 10 10 10 10 10 10 10 10

15
Botilda 10 10 10 10 10 10 10 10 10 10 10 10 9.1 9.5 10 10 10 10 10 10 10 10 10 10 10 10 10 10 10 10 10 10 10
Drifa 10 10 10 10 10 10 10 10 10 10 10 10 9.4 9.4 10 10 10 10 10 10 10 10 10 10 10 10 10 10 10 10 9.8 10 9.0
Erlanda 10 10 10 10 10 10 10 10 10 10 10 10 10 10 10 10 10 10 9.4 9.1 10 10 10 10 10 10 10 10 10 10 10 10 10
FUAS
CAROLI 9.6 9.0 9.1 9.7 9.3 10 9.4 9.2 9.5 9.3 9.2 8.8 10 10 10 10 10 9.2 10 10 9.3 9.7 10 9.1 9.4 10 9.0 10 10 9.2 10 9.2 10
FUAS
MARTHA 10 10 10 10 9.2 9.9 8.9 8.8 9.5 9.0 8.8 10 10 10 10 10 8.6 10 10 10 9.7 9.9 8.8 9.7 9.7 8.8 10 10 8.8 9.5 8.8 9.5
FUAS
SVENJA 9.9 9.7 9.3 9.9 10 10 10 7.8 10 7.8 7.3 9.8 10 10 9.9 10 10 10 10 10 10 10 9.6 9.3 10 8.2 10 9.9 10 10 10 10 8.7
Fylla 10 10 10 10 10 10 10 10 10 10 10 10 10 10 10 10 10 10 10 10 10 10 10 10 10 10 10 10 10 10 10 10 10
Gyda 10 10 10 10 10 10 10 10 10 10 10 10 10 10 10 10 10 10 10 10 10 10 10 10 10 10 10 10 10 10 10 10 10
SSR
ELISE 9.8 9.9 9.9 9.8 9.8 9.3 9.2 10 9.4 9.1 8.8 10 10 10 10 10 10 10 9.3 10 10 9.8 9.7 9.9 10 9.3 10 9.9 10 10 9.8 10 10
SSR LIVE 9.6 7.8 8.2 9.8 10 9.4 9.6 9.6 9.1 9.6 9.3 9.6 10 10 10 10 9.5 9.8 9.1 10 10 10 9.9 9.9 9.7 9.9 9.7 10 8.8 9.6 9.4 9.6 9.2
SSR
MARIT 9.0 7.4 6.9 8.3 10 9.2 9.2 8.9 7.9 9.6 7.8 6.8 10 10 10 10 9.5 9.6 7.8 10 10 9.8 9.8 8.6 8.3 9.7 9.3 9.8 9.6 8.9 8.4 9.3 9.8
SSR
NORA 7.9 7.6 7.8 7.9 10 9.3 8.8 8.5 8.5 8.3 8.0 7.0 10 10 10 10 9.1 9.2 7.3 10 10 7.8 7.9 8.9 9.0 8.8 8.9 7.8 8.0 7.9 7.7 8.4 9.3
SSR
TUVA 10 9.4 9.7 10 10 9.9 9.6 9.7 9.8 9.6 9.4 9.9 10 10 10 10 9.7 9.8 9.8 10 10 10 8.8 10 9.8 9.9 9.7 10 9.8 9.6 9.9 9.6 9.0
SMA
ANNA 8.9 8.2 8.3 8.7 8.0 8.9 8.2 7.8 8.7 7.1 7.3 7.9 10 10 10 10 7.7 7.7 8.4 10 10 8.9 10 8.9 9.2 8.6 7.4 8.9 8.9 7.1 10 7.3 9.8
SMA
ELVIRA 10 10 10 10 10 10 10 9.6 9.5 9.8 9.4 8.8 10 10 9.3 10 9.6 9.9 9.2 10 10 9.9 9.3 9.8 9.9 9.2 9.4 9.9 9.4 9.3 9.5 9.2 8.1
SMA
INGRID 8.5 7.2 8.2 9.4 8.8 9.5 9.4 9.3 7.9 9.3 9.0 8.7 9.8 9.8 9.9 10 9.4 9.4 8.1 10 10 9.4 6.3 10 9.5 9.8 10 9.5 7.7 9.3 7.7 9.3 9.9
UPC
PALOMA 9.4 9.5 9.8 10 9.8 9.5 9.4 9.3 9.6 9.3 9.0 9.9 9.7 9.7 9.6 9.7 9.3 9.4 9.0 9.1 8.9 9.4 9.0 9.8 9.9 9.9 10 9.5 9.4 9.2 9.7 9.3 9.4

16
UPC
SOFIA 10 9.0 9.0 9.5 9.0 10 10 9.9 9.3 10 9.4 8.8 10 10 10 10 10 10 9.1 9.7 10 10 9.3 9.5 9.6 8.9 9.4 10 10 9.6 9.2 10 10
WB Tessa 9.3 9.0 8.9 10 8.6 9.3 9.1 9.1 9.9 9.2 8.8 8.4 9.4 9.5 9.3 10 9.1 9.2 8.9 10 10 9.1 10 10 9.4 9.5 10 9.3 9.1 10 10 9.1 9.1
WMA
ADMIRAL 9.4 9.0 9.1 9.5 9.5 10 10 9.9 9.5 9.1 9.2 8.8 10 10 9.3 10 9.6 9.8 9.2 10 10 10 9.3 9.6 9.8 8.5 9.4 10 10 9.3 9.3 9.0 10
WMA
BECKY 9.9 9.1 9.1 9.4 8.9 9.5 7.0 9.2 9.3 7.1 9.1 10 10 10 10 10 6.7 8.7 10 10 10 7.3 10 9.5 9.8 7.9 9.5 8.9 7.3 10 10 10 9.2
Table 5: Average Safety Indices of Baseline run 92.
17
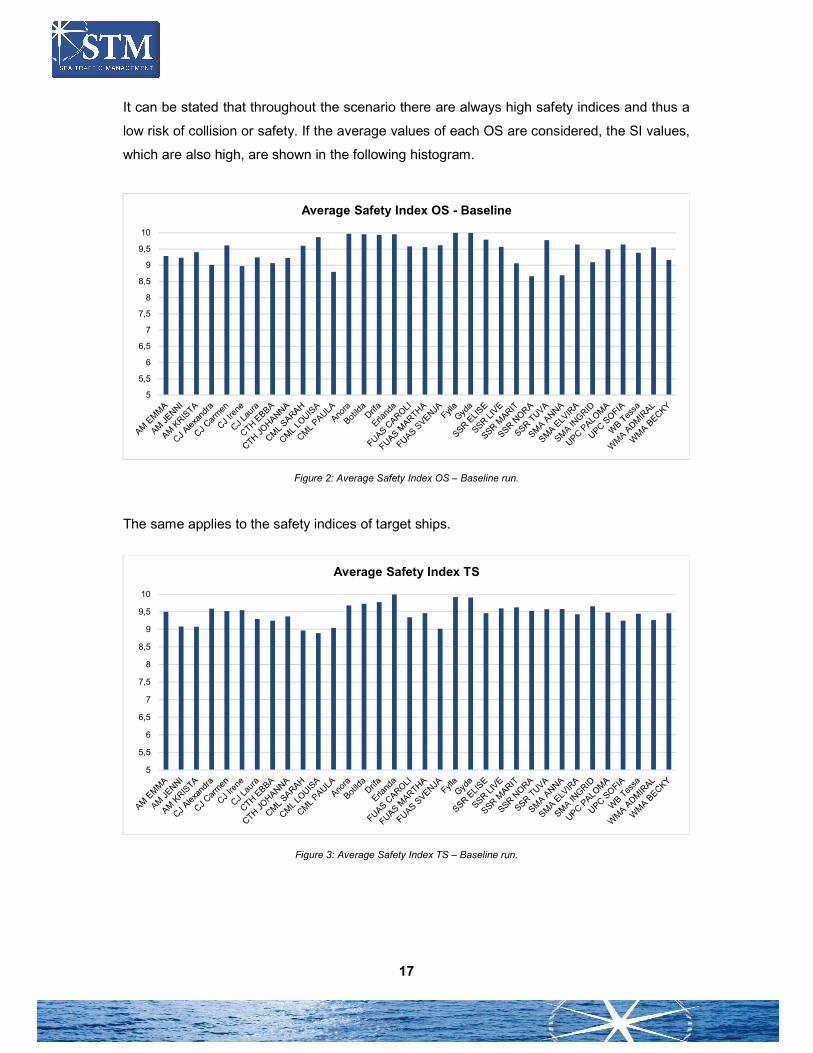
It can be stated that throughout the scenario there are always high safety indices and thus a
low risk of collision or safety. If the average values of each OS are considered, the SI values,
which are also high, are shown in the following histogram.
Figure 2: Average Safety Index OS – Baseline run.
The same applies to the safety indices of target ships.
Figure 3: Average Safety Index TS – Baseline run.
5
5,5
6
6,5
7
7,5
8
8,5
9
9,5
10
Average Safety Index OS - Baseline
5
5,5
6
6,5
7
7,5
8
8,5
9
9,5
10
Average Safety Index TS

18
With regard to the minimum SI, CJ Alexandra, CJ Carmen and the SMA Ingrid and CTH Ebba
show having the lowest values, i.e. the highest safety risks (cf. Figure 4).
Figure 4: Minimum Safety Index OS – Baseline run.
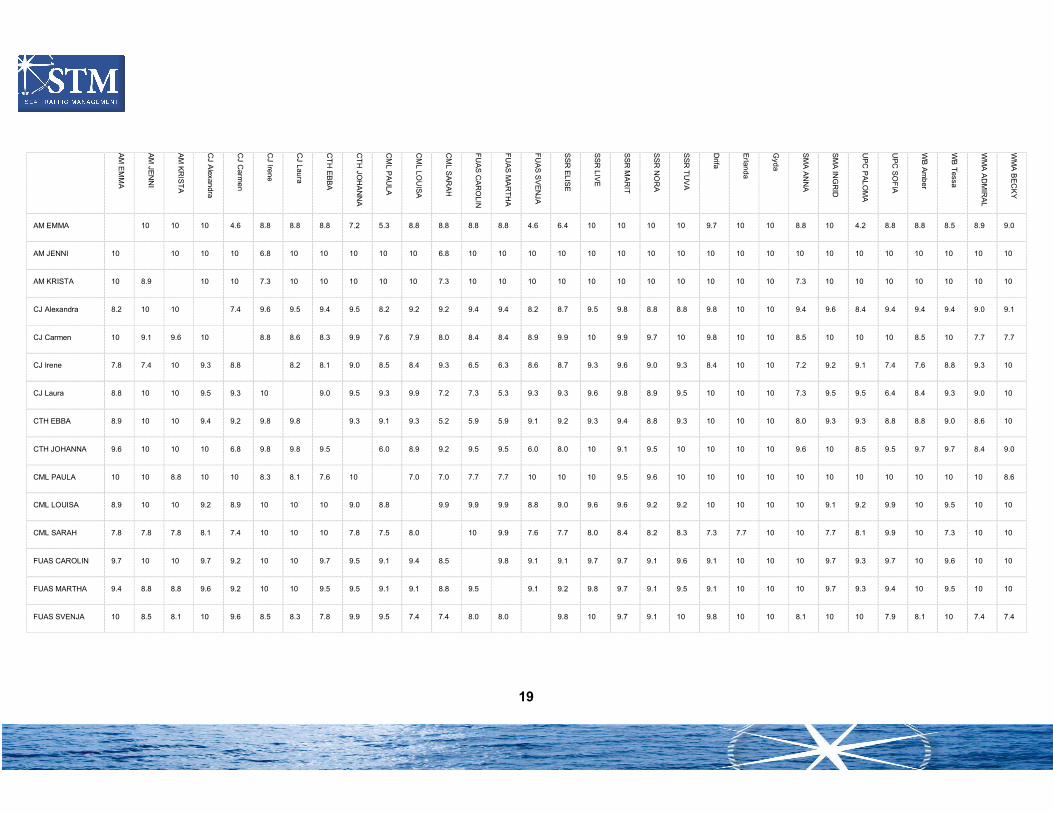
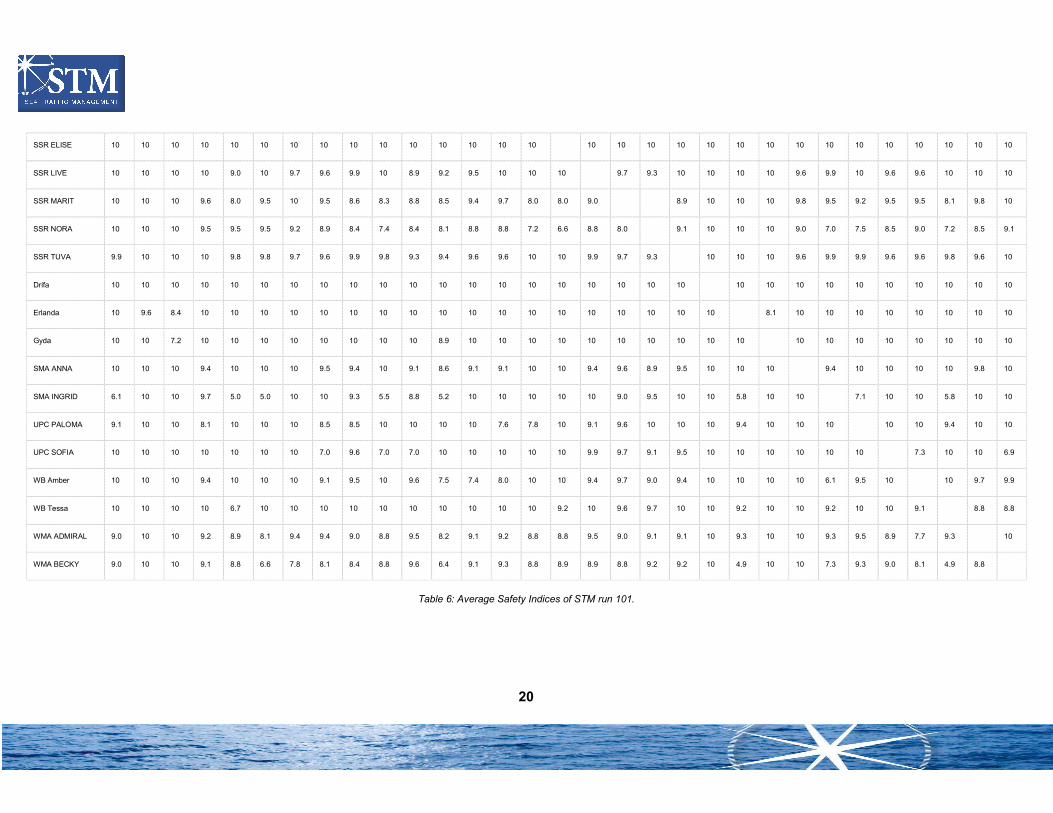
6.6.2 STM run To evaluate the effects of STM services, safety indices of the STM runs are determined in a
second step. The following analyses focus the run with id 101. For this purpose, each
combination of OS and TS and their corresponding CI and SI was determined. The following
table contains the average rounded SI of each combination.
5
5,5
6
6,5
7
7,5
8
8,5
9
9,5
10
Minimum Safety Index OS
19
AM
EM
MA
AM
JEN
NI
AM
KR
IST
A
CJ A
lexandra
CJ C
arme
n
CJ Ire
ne
CJ Lau
ra
CT
H E
BB
A
CT
H JO
HA
NN
A
CM
L PA
ULA
CM
L LOU
ISA
CM
L SA
RA
H
FU
AS
CA
RO
LIN
FU
AS
MA
RT
HA
FU
AS
SV
EN
JA
SS
R E
LIS
E
SS
R L
IVE
SS
R M
AR
IT
SS
R N
OR
A
SS
R T
UV
A
Drifa
Erlan
da
Gyd
a
SM
A A
NN
A
SM
A IN
GR
ID
UP
C P
AL
OM
A
UP
C S
OF
IA
WB
Am
ber
WB
Tessa
WM
A A
DM
IRA
L
WM
A B
EC
KY
AM EMMA 10 10 10 4.6 8.8 8.8 8.8 7.2 5.3 8.8 8.8 8.8 8.8 4.6 6.4 10 10 10 10 9.7 10 10 8.8 10 4.2 8.8 8.8 8.5 8.9 9.0
AM JENNI 10 10 10 10 6.8 10 10 10 10 10 6.8 10 10 10 10 10 10 10 10 10 10 10 10 10 10 10 10 10 10 10
AM KRISTA 10 8.9 10 10 7.3 10 10 10 10 10 7.3 10 10 10 10 10 10 10 10 10 10 10 7.3 10 10 10 10 10 10 10
CJ Alexandra 8.2 10 10 7.4 9.6 9.5 9.4 9.5 8.2 9.2 9.2 9.4 9.4 8.2 8.7 9.5 9.8 8.8 8.8 9.8 10 10 9.4 9.6 8.4 9.4 9.4 9.4 9.0 9.1
CJ Carmen 10 9.1 9.6 10 8.8 8.6 8.3 9.9 7.6 7.9 8.0 8.4 8.4 8.9 9.9 10 9.9 9.7 10 9.8 10 10 8.5 10 10 10 8.5 10 7.7 7.7
CJ Irene 7.8 7.4 10 9.3 8.8 8.2 8.1 9.0 8.5 8.4 9.3 6.5 6.3 8.6 8.7 9.3 9.6 9.0 9.3 8.4 10 10 7.2 9.2 9.1 7.4 7.6 8.8 9.3 10
CJ Laura 8.8 10 10 9.5 9.3 10 9.0 9.5 9.3 9.9 7.2 7.3 5.3 9.3 9.3 9.6 9.8 8.9 9.5 10 10 10 7.3 9.5 9.5 6.4 8.4 9.3 9.0 10
CTH EBBA 8.9 10 10 9.4 9.2 9.8 9.8 9.3 9.1 9.3 5.2 5.9 5.9 9.1 9.2 9.3 9.4 8.8 9.3 10 10 10 8.0 9.3 9.3 8.8 8.8 9.0 8.6 10
CTH JOHANNA 9.6 10 10 10 6.8 9.8 9.8 9.5 6.0 8.9 9.2 9.5 9.5 6.0 8.0 10 9.1 9.5 10 10 10 10 9.6 10 8.5 9.5 9.7 9.7 8.4 9.0
CML PAULA 10 10 8.8 10 10 8.3 8.1 7.6 10 7.0 7.0 7.7 7.7 10 10 10 9.5 9.6 10 10 10 10 10 10 10 10 10 10 10 8.6
CML LOUISA 8.9 10 10 9.2 8.9 10 10 10 9.0 8.8 9.9 9.9 9.9 8.8 9.0 9.6 9.6 9.2 9.2 10 10 10 10 9.1 9.2 9.9 10 9.5 10 10
CML SARAH 7.8 7.8 7.8 8.1 7.4 10 10 10 7.8 7.5 8.0 10 9.9 7.6 7.7 8.0 8.4 8.2 8.3 7.3 7.7 10 10 7.7 8.1 9.9 10 7.3 10 10
FUAS CAROLIN 9.7 10 10 9.7 9.2 10 10 9.7 9.5 9.1 9.4 8.5 9.8 9.1 9.1 9.7 9.7 9.1 9.6 9.1 10 10 10 9.7 9.3 9.7 10 9.6 10 10
FUAS MARTHA 9.4 8.8 8.8 9.6 9.2 10 10 9.5 9.5 9.1 9.1 8.8 9.5 9.1 9.2 9.8 9.7 9.1 9.5 9.1 10 10 10 9.7 9.3 9.4 10 9.5 10 10
FUAS SVENJA 10 8.5 8.1 10 9.6 8.5 8.3 7.8 9.9 9.5 7.4 7.4 8.0 8.0 9.8 10 9.7 9.1 10 9.8 10 10 8.1 10 10 7.9 8.1 10 7.4 7.4
20
SSR ELISE 10 10 10 10 10 10 10 10 10 10 10 10 10 10 10 10 10 10 10 10 10 10 10 10 10 10 10 10 10 10
SSR LIVE 10 10 10 10 9.0 10 9.7 9.6 9.9 10 8.9 9.2 9.5 10 10 10 9.7 9.3 10 10 10 10 9.6 9.9 10 9.6 9.6 10 10 10
SSR MARIT 10 10 10 9.6 8.0 9.5 10 9.5 8.6 8.3 8.8 8.5 9.4 9.7 8.0 8.0 9.0 8.9 10 10 10 9.8 9.5 9.2 9.5 9.5 8.1 9.8 10
SSR NORA 10 10 10 9.5 9.5 9.5 9.2 8.9 8.4 7.4 8.4 8.1 8.8 8.8 7.2 6.6 8.8 8.0 9.1 10 10 10 9.0 7.0 7.5 8.5 9.0 7.2 8.5 9.1
SSR TUVA 9.9 10 10 10 9.8 9.8 9.7 9.6 9.9 9.8 9.3 9.4 9.6 9.6 10 10 9.9 9.7 9.3 10 10 10 9.6 9.9 9.9 9.6 9.6 9.8 9.6 10
Drifa 10 10 10 10 10 10 10 10 10 10 10 10 10 10 10 10 10 10 10 10 10 10 10 10 10 10 10 10 10 10
Erlanda 10 9.6 8.4 10 10 10 10 10 10 10 10 10 10 10 10 10 10 10 10 10 10 8.1 10 10 10 10 10 10 10 10
Gyda 10 10 7.2 10 10 10 10 10 10 10 10 8.9 10 10 10 10 10 10 10 10 10 10 10 10 10 10 10 10 10 10
SMA ANNA 10 10 10 9.4 10 10 10 9.5 9.4 10 9.1 8.6 9.1 9.1 10 10 9.4 9.6 8.9 9.5 10 10 10 9.4 10 10 10 10 9.8 10
SMA INGRID 6.1 10 10 9.7 5.0 5.0 10 10 9.3 5.5 8.8 5.2 10 10 10 10 10 9.0 9.5 10 10 5.8 10 10 7.1 10 10 5.8 10 10
UPC PALOMA 9.1 10 10 8.1 10 10 10 8.5 8.5 10 10 10 10 7.6 7.8 10 9.1 9.6 10 10 10 9.4 10 10 10 10 10 9.4 10 10
UPC SOFIA 10 10 10 10 10 10 10 7.0 9.6 7.0 7.0 10 10 10 10 10 9.9 9.7 9.1 9.5 10 10 10 10 10 10 7.3 10 10 6.9
WB Amber 10 10 10 9.4 10 10 10 9.1 9.5 10 9.6 7.5 7.4 8.0 10 10 9.4 9.7 9.0 9.4 10 10 10 10 6.1 9.5 10 10 9.7 9.9
WB Tessa 10 10 10 10 6.7 10 10 10 10 10 10 10 10 10 10 9.2 10 9.6 9.7 10 10 9.2 10 10 9.2 10 10 9.1 8.8 8.8
WMA ADMIRAL 9.0 10 10 9.2 8.9 8.1 9.4 9.4 9.0 8.8 9.5 8.2 9.1 9.2 8.8 8.8 9.5 9.0 9.1 9.1 10 9.3 10 10 9.3 9.5 8.9 7.7 9.3 10
WMA BECKY 9.0 10 10 9.1 8.8 6.6 7.8 8.1 8.4 8.8 9.6 6.4 9.1 9.3 8.8 8.9 8.9 8.8 9.2 9.2 10 4.9 10 10 7.3 9.3 9.0 8.1 4.9 8.8
Table 6: Average Safety Indices of STM run 101.

21
It can be stated that throughout the scenario there are always high safety indices and thus a
low risk of collision or safety. If the average values of each OS are considered, the SI values,
which are also high, are shown in the following histogram.
Figure 5: Average Safety Index OS – STM run.
The same applies to the safety indices of target ships.
Figure 6: Average Safety Index TS - STM run.
5,0
5,5
6,0
6,5
7,0
7,5
8,0
8,5
9,0
9,5
10,0
Average Safety Index OS - STM
5
5,5
6
6,5
7
7,5
8
8,5
9
9,5
10
Average Safety Index TS
22
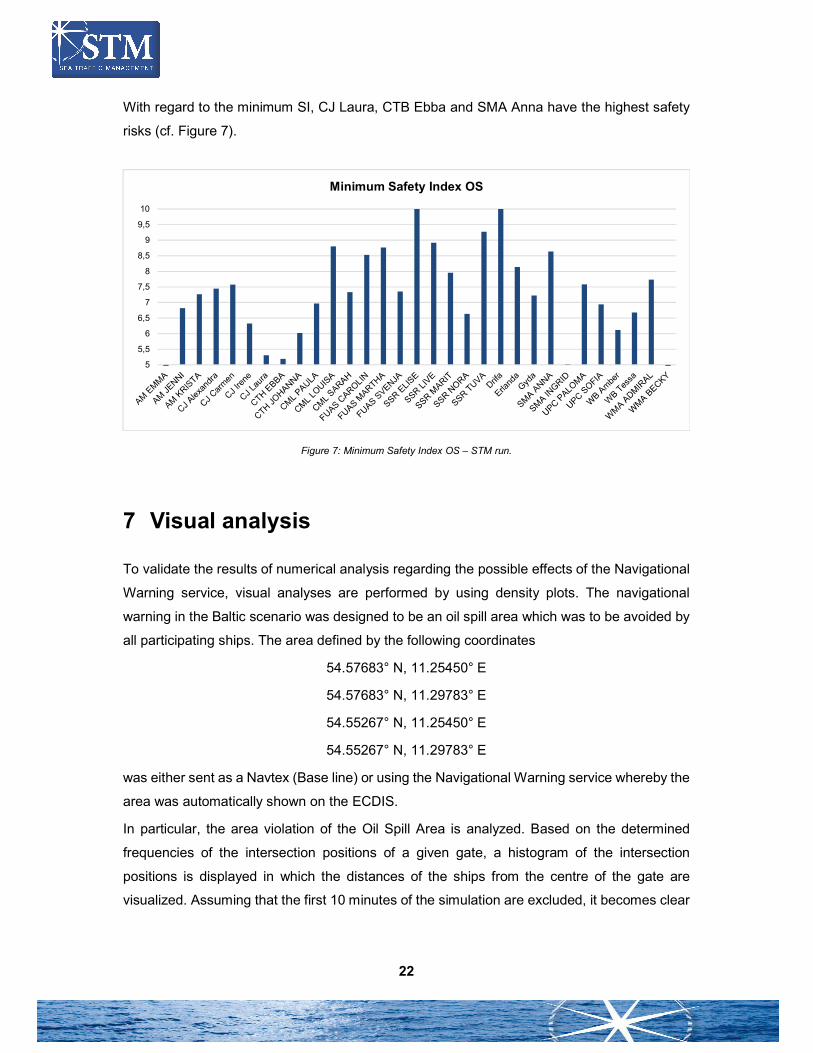
With regard to the minimum SI, CJ Laura, CTB Ebba and SMA Anna have the highest safety
risks (cf. Figure 7).
Figure 7: Minimum Safety Index OS – STM run.
7 Visual analysis
To validate the results of numerical analysis regarding the possible effects of the Navigational
Warning service, visual analyses are performed by using density plots. The navigational
warning in the Baltic scenario was designed to be an oil spill area which was to be avoided by
all participating ships. The area defined by the following coordinates
54.57683° N, 11.25450° E
54.57683° N, 11.29783° E
54.55267° N, 11.25450° E
54.55267° N, 11.29783° E
was either sent as a Navtex (Base line) or using the Navigational Warning service whereby the
area was automatically shown on the ECDIS.
In particular, the area violation of the Oil Spill Area is analyzed. Based on the determined
frequencies of the intersection positions of a given gate, a histogram of the intersection
positions is displayed in which the distances of the ships from the centre of the gate are
visualized. Assuming that the first 10 minutes of the simulation are excluded, it becomes clear
5
5,5
6
6,5
7
7,5
8
8,5
9
9,5
10
Minimum Safety Index OS
23
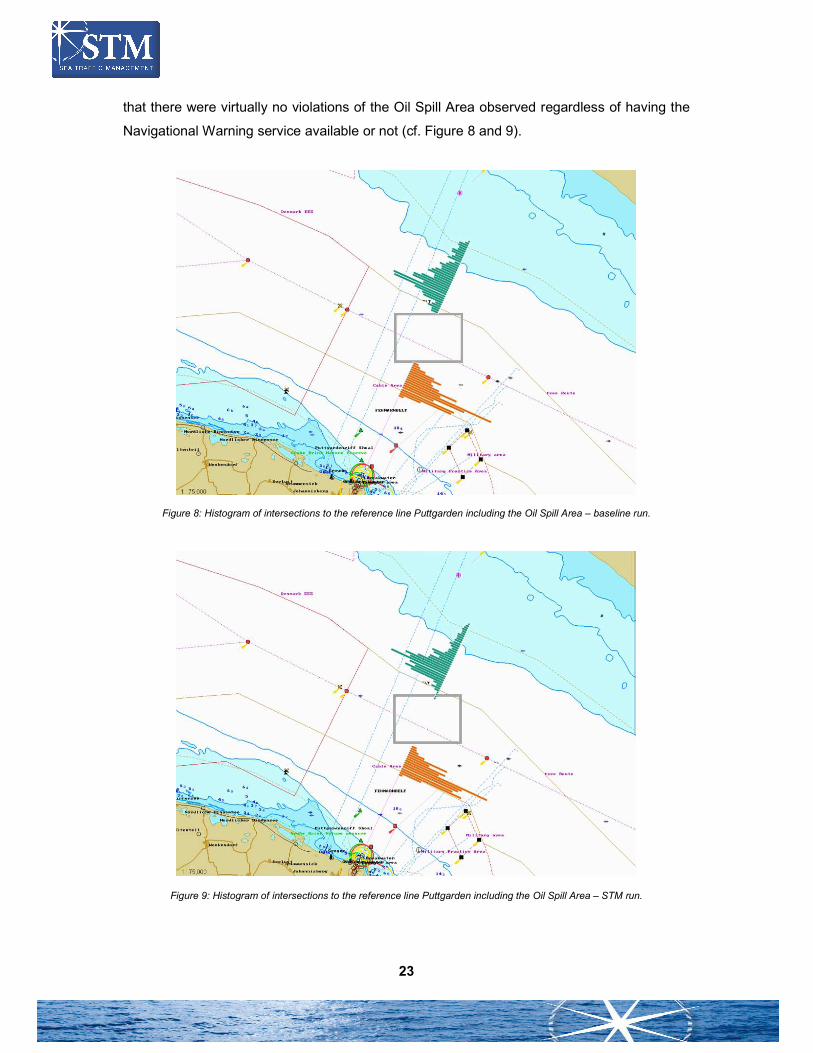
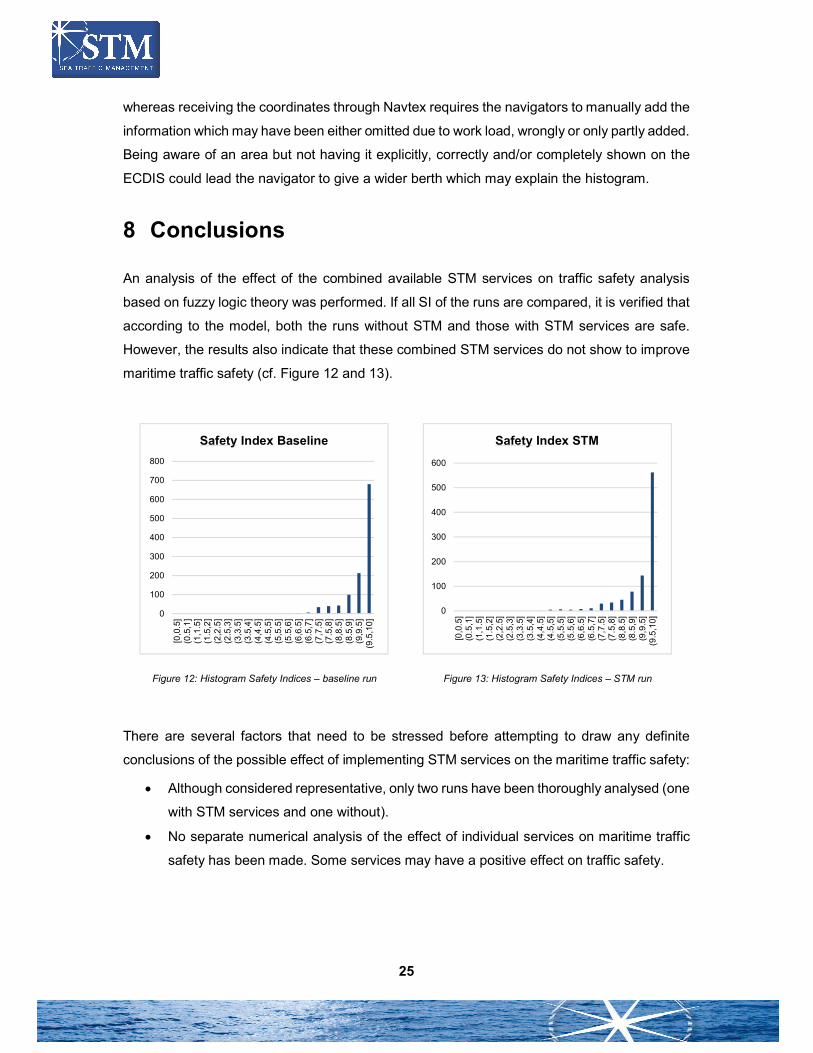
that there were virtually no violations of the Oil Spill Area observed regardless of having the
Navigational Warning service available or not (cf. Figure 8 and 9).
Figure 8: Histogram of intersections to the reference line Puttgarden including the Oil Spill Area – baseline run.
Figure 9: Histogram of intersections to the reference line Puttgarden including the Oil Spill Area – STM run.

24
This is also evident from the enumeration of heat maps of the baseline and runs with STM
equipment.
Figure 10: Heatmap and Oil Spill Area – Baseline runs
Figure 11: Heatmap and Oil Spill Area – STM runs
However, it may be noted that the histograms visually indicate a higher density with enabled
STM services, i.e. a higher lateral concentration of traffic North and South of the area to be
avoided compared to the distribution of the traffic without having STM services which is more
laterally spread out. This may be attributed to the fact that when receiving a Navigational
Warning through the STM service, the area will be automatically depicted on the ECDIS
25
whereas receiving the coordinates through Navtex requires the navigators to manually add the
information which may have been either omitted due to work load, wrongly or only partly added.
Being aware of an area but not having it explicitly, correctly and/or completely shown on the
ECDIS could lead the navigator to give a wider berth which may explain the histogram.
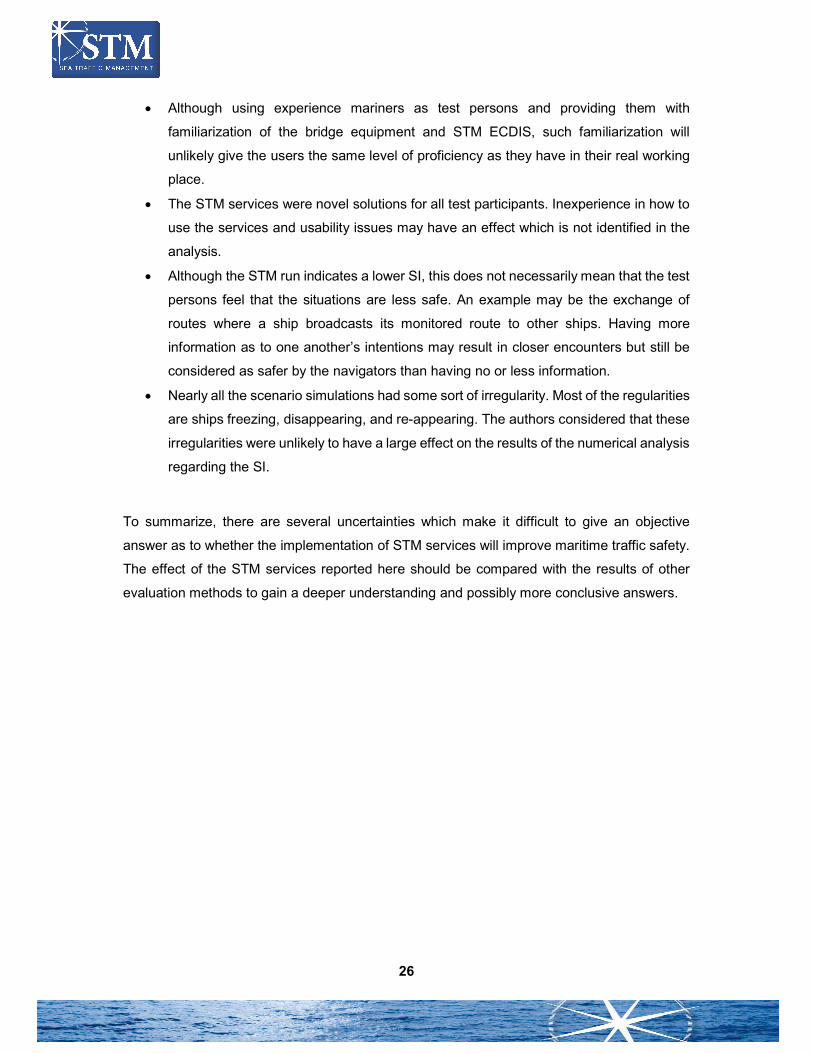
8 Conclusions
An analysis of the effect of the combined available STM services on traffic safety analysis
based on fuzzy logic theory was performed. If all SI of the runs are compared, it is verified that
according to the model, both the runs without STM and those with STM services are safe.
However, the results also indicate that these combined STM services do not show to improve
maritime traffic safety (cf. Figure 12 and 13).
Figure 12: Histogram Safety Indices – baseline run
Figure 13: Histogram Safety Indices – STM run
There are several factors that need to be stressed before attempting to draw any definite
conclusions of the possible effect of implementing STM services on the maritime traffic safety:
Although considered representative, only two runs have been thoroughly analysed (one
with STM services and one without).
No separate numerical analysis of the effect of individual services on maritime traffic
safety has been made. Some services may have a positive effect on traffic safety.
0
100
200
300
400
500
600
700
800
[0,0
.5]
(0.5
,1]
(1,1
.5]
(1.5
,2]
(2,2
.5]
(2.5
,3]
(3,3
.5]
(3.5
,4]
(4,4
.5]
(4.5
,5]
(5,5
.5]
(5.5
,6]
(6,6
.5]
(6.5
,7]
(7,7
.5]
(7.5
,8]
(8,8
.5]
(8.5
,9]
(9,9
.5]
(9.5
,10
]
Safety Index Baseline
0
100
200
300
400
500
600[0
,0.5
](0
.5,1
](1
,1.5
](1
.5,2
](2
,2.5
](2
.5,3
](3
,3.5
](3
.5,4
](4
,4.5
](4
.5,5
](5
,5.5
](5
.5,6
](6
,6.5
](6
.5,7
](7
,7.5
](7
.5,8
](8
,8.5
](8
.5,9
](9
,9.5
](9
.5,1
0]
Safety Index STM
26
Although using experience mariners as test persons and providing them with
familiarization of the bridge equipment and STM ECDIS, such familiarization will
unlikely give the users the same level of proficiency as they have in their real working
place.
The STM services were novel solutions for all test participants. Inexperience in how to
use the services and usability issues may have an effect which is not identified in the
analysis.
Although the STM run indicates a lower SI, this does not necessarily mean that the test
persons feel that the situations are less safe. An example may be the exchange of
routes where a ship broadcasts its monitored route to other ships. Having more
information as to one another’s intentions may result in closer encounters but still be
considered as safer by the navigators than having no or less information.
Nearly all the scenario simulations had some sort of irregularity. Most of the regularities
are ships freezing, disappearing, and re-appearing. The authors considered that these
irregularities were unlikely to have a large effect on the results of the numerical analysis
regarding the SI.
To summarize, there are several uncertainties which make it difficult to give an objective
answer as to whether the implementation of STM services will improve maritime traffic safety.
The effect of the STM services reported here should be compared with the results of other
evaluation methods to gain a deeper understanding and possibly more conclusive answers.

27
9 References
American Bureau of Shipping. (2006). Guide for Vessel Maneuverability. Houston. Von https://ww2.eagle.org/content/dam/eagle/rules-and-guides/current/conventional_ocean_service/145_vesselmaneuverability/Vessel_Maneuverability_Guide_e-Feb17.pdf abgerufen
Bai, W. W. (2006). Fundamentals of Fuzzy Logic Control - Fuzzy Sets, Fuzzy Rules and Defuzzifications. Advanced Fuzzy Logic Technologies in Industrial Applications. Springer - Verlag.
International Maritime Organization. (1974). COLREGS - International Regulations for Preventing Collisions at Sea.
ITTC. (2008). Dictionary of Ship Hydrodynamics. International Towing Tank Conference.
Kozlowska, E. (2012). Basic principles of fuzzy logic. Von Prague: Czech Technical University in Prague: http://access.feld.cvut.cz/view.php?cisloclanku=2012080002 abgerufen
Lopez-Santander, A., & Lawry, J. (2017). An Ordinal Model of Risk Based on Mariner's Judgement. The Journal of Navigation, 70, S. 309-324.
Mamdani, E. A. (1975). An Experiment in Linguistic Synthesis With a Fuzzy Logic Controller. International Journal of Man-Machine Studies, 7, S. 1-13.
Perera, L. C. (2011). Fuzzy logic based decision making system for collision avoidance of ocean navigation under critical collision conditions. Journal of Marine Science and Technology, S. 84-99.
Serban, P. S., & Panaitescu, V. N. (2016). Comparison Between Formulas of Maximum Ship Squat. "Mircea cel Batran" Naval Academy Scientific Bulletin, Volume XIX - Issue 1, S. 105-111.
Zadeh, L. (1965). Fuzzy Sets. In Information and Control (S. 338-353).
28
39 partners from 13 countries
containerising maritime information
Demonstrating the function and business value of the Sea Traffic Management concept and its services.
Seaing is believing!
SAFETY - ENVIRONMENT - EFFICIENCY
Swedish Maritime Administration ◦ SSPA ◦ Viktoria Swedish ICT ◦ Transas ◦ Chalmers University of Technology ◦ The Swedish Meteorological and Hydrological Institute ◦ Danish
Maritime Authority ◦ Navicon ◦ Novia University of Applied Sciences ◦ Fraunhofer ◦ Jeppesen ◦ Carnival Corp. ◦ Italian Ministry of Transport ◦ SASEMAR ◦ Valencia Port Authority ◦
Valencia Port Foundation ◦ CIMNE ◦ University of Catalonia ◦ Norwegian Coastal Administration ◦ GS1 ◦ Cyprys University of Technology ◦ Port of Barcelona ◦ Costa Crociere ◦ Svitzer ◦ OFFIS ◦ Finnish Transport Agency ◦ Southampton Solent University ◦ Frequentis ◦
SAM Electronics ◦ University of Flensburg ◦ Signalis ◦ Maritiem Instituut Willem Barentsz ◦ SAAB TransponderTech AB ◦ University of Oldenburg ◦ Magellan ◦ Furuno Finland ◦ Rörvik ◦
University of Southampton ◦ HiQ
www.stmvalidation.eu


![H]HWH 6XUURXQGLQJ DUHD RI WKH VWDWLRQ](https://static.fdocuments.us/doc/165x107/629ac03469a3fb1c9d28da03/hhwh-6xuurxqglqj-duhd-ri-wkh-vwdwlrq.jpg)