Conditional symmetric instability and the development of sting jets
Upload
laura-bakerCategory
view
212download
0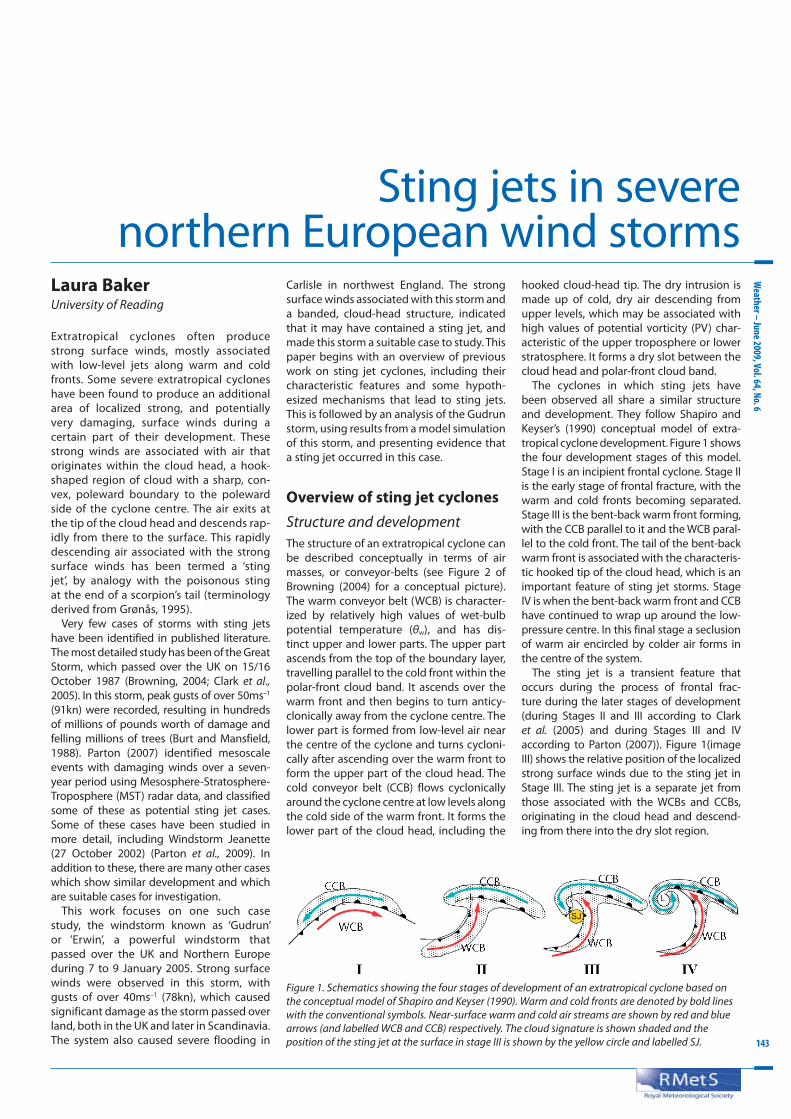
Weather – June 2009, Vol. 64, No. 6
143
Sting jets in severe northern European wind storms
Laura BakerUniversity of Reading
Extratropical cyclones often produce strong surface winds, mostly associated with low-level jets along warm and cold fronts. Some severe extratropical cyclones have been found to produce an additional area of localized strong, and potentially very damaging, surface winds during a certain part of their development. These strong winds are associated with air that originates within the cloud head, a hook-shaped region of cloud with a sharp, con-vex, poleward boundary to the poleward side of the cyclone centre. The air exits at the tip of the cloud head and descends rap-idly from there to the surface. This rapidly descending air associated with the strong surface winds has been termed a ‘sting jet’, by analogy with the poisonous sting at the end of a scorpion’s tail (terminology derived from Grønås, 1995).
Very few cases of storms with sting jets have been identified in published literature. The most detailed study has been of the Great Storm, which passed over the UK on 15/16 October 1987 (Browning, 2004; Clark et al., 2005). In this storm, peak gusts of over 50ms–1 (91kn) were recorded, resulting in hundreds of millions of pounds worth of damage and felling millions of trees (Burt and Mansfield, 1988). Parton (2007) identified mesoscale events with damaging winds over a seven-year period using Mesosphere-Stratosphere-Troposphere (MST) radar data, and classified some of these as potential sting jet cases. Some of these cases have been studied in more detail, including Windstorm Jeanette (27 October 2002) (Parton et al., 2009). In addition to these, there are many other cases which show similar development and which are suitable cases for investigation.
This work focuses on one such case study, the windstorm known as ‘Gudrun’ or ‘Erwin’, a powerful windstorm that passed over the UK and Northern Europe during 7 to 9 January 2005. Strong surface winds were observed in this storm, with gusts of over 40ms–1 (78kn), which caused significant damage as the storm passed over land, both in the UK and later in Scandinavia. The system also caused severe flooding in
Carlisle in northwest England. The strong surface winds associated with this storm and a banded, cloud-head structure, indicated that it may have contained a sting jet, and made this storm a suitable case to study. This paper begins with an overview of previous work on sting jet cyclones, including their characteristic features and some hypoth-esized mechanisms that lead to sting jets. This is followed by an analysis of the Gudrun storm, using results from a model simulation of this storm, and presenting evidence that a sting jet occurred in this case.
Overview of sting jet cyclonesStructure and developmentThe structure of an extratropical cyclone can be described conceptually in terms of air masses, or conveyor-belts (see Figure 2 of Browning (2004) for a conceptual picture). The warm conveyor belt (WCB) is character-ized by relatively high values of wet-bulb potential temperature (θw), and has dis-tinct upper and lower parts. The upper part ascends from the top of the boundary layer, travelling parallel to the cold front within the polar-front cloud band. It ascends over the warm front and then begins to turn anticy-clonically away from the cyclone centre. The lower part is formed from low-level air near the centre of the cyclone and turns cycloni-cally after ascending over the warm front to form the upper part of the cloud head. The cold conveyor belt (CCB) flows cyclonically around the cyclone centre at low levels along the cold side of the warm front. It forms the lower part of the cloud head, including the
hooked cloud-head tip. The dry intrusion is made up of cold, dry air descending from upper levels, which may be associated with high values of potential vorticity (PV) char-acteristic of the upper troposphere or lower stratosphere. It forms a dry slot between the cloud head and polar-front cloud band.
The cyclones in which sting jets have been observed all share a similar structure and development. They follow Shapiro and Keyser’s (1990) conceptual model of extra-tropical cyclone development. Figure 1 shows the four development stages of this model. Stage I is an incipient frontal cyclone. Stage II is the early stage of frontal fracture, with the warm and cold fronts becoming separated. Stage III is the bent-back warm front forming, with the CCB parallel to it and the WCB paral-lel to the cold front. The tail of the bent-back warm front is associated with the characteris-tic hooked tip of the cloud head, which is an important feature of sting jet storms. Stage IV is when the bent-back warm front and CCB have continued to wrap up around the low-pressure centre. In this final stage a seclusion of warm air encircled by colder air forms in the centre of the system.
The sting jet is a transient feature that occurs during the process of frontal frac-ture during the later stages of development (during Stages II and III according to Clark et al. (2005) and during Stages III and IV according to Parton (2007)). Figure 1(image III) shows the relative position of the localized strong surface winds due to the sting jet in Stage III. The sting jet is a separate jet from those associated with the WCBs and CCBs, originating in the cloud head and descend-ing from there into the dry slot region.
Figure 1. Schematics showing the four stages of development of an extratropical cyclone based on the conceptual model of Shapiro and Keyser (1990). Warm and cold fronts are denoted by bold lines with the conventional symbols. Near-surface warm and cold air streams are shown by red and blue arrows (and labelled WCB and CCB) respectively. The cloud signature is shown shaded and the position of the sting jet at the surface in stage III is shown by the yellow circle and labelled SJ.
144
Nort
hern
Euro
pean
stin
g je
tsW
eath
er –
June
2009
, Vol
. 64,
No.
6
Banding in the cloud head In many extratropical cyclones, a banded structure is observed in the cloud head, particularly near to its tip. This feature was identified in the satellite imagery for the October 1987 storm (Browning, 2004), and in the very high frequency (VHF) wind profiler observations of the October 2002 storm (Parton et al., 2009). This banded structure was hypothesized by Browning (2004) to be consistent with the existence of multiple, stacked, slantwise circulations. Evidence of banding was also seen by Clark et al. (2005) in their model-derived cloud head, and analysis of the three-dimen-sional structure of the model cloud head showed a slantwise structure consisting of alternating ascending and descending branches. In the main part of the cloud head, the ascending branches are strong-est, giving overall ascent; however, nearer the tip of the cloud head, the descending parts become stronger, leading to overall descent in this region. It was also found that the sting jet air associated with strong surface winds originated in the cloud head, and was brought down in one of the slant-wise descending branches.
Browning (2004) and Clark et al. (2005) suggested that the slantwise circulations in the cloud head may have been caused by the presence of conditional sym-metric instability (CSI) (see Schultz and Schumacher (1999) for a review of CSI) by consistency with the scale of the circula-tions. Thus, they hypothesized, the release of CSI may play a role in the generation of the sting jet.
Characteristics of sting jet airBrowning (2004) identified that the regions of strongest winds in the October 1987 storm were associated with air that had originated at higher levels within the cloud head, been brought down by the descend-ing branches of the slantwise circulations, and exited at the cloud-head tip before descending to the surface. It was observed that the sting jet air exited at the hooked tip of the cloud head much faster than the rate of travel of the cloud-head tip. This implies that there is rapid evaporation and diabatic cooling in this region, and it was hypothesized that these evaporative heat-sinks may have a role in strengthen-ing the damaging winds associated with this descending air. Within the cloud head, precipitation from the moist, ascending branches of the slantwise circulations falls into the descending parts of the cir-culations, and the air in the descending branches undergoes evaporative cooling. This was confirmed by the trajectory analy-sis in Clark et al. (2005), in which the most rapidly descending air showed a decrease in potential temperature and an increase
in specific humidity1, indicating evapora-tive cooling.
Clark et al. (2005) and Parton et al. (2009) used trajectory analysis to determine more characteristics of the sting jet air. Both stud-ies found that air descended over a relatively short period, from about 660 to 930mbar over four hours for the trajectory starting from the lowest pressure in the Clark et al. (2005) study and by about one kilometre over ten hours in the Parton et al. (2009) study. The wind speed increased and relative humidity decreased during descent which occurred approximately along a surface of constant wet-bulb potential temperature (θw). The sting jet was established to be dis-tinct from the CCB jet, which is associated with lower values of θw and lies to the west of the sting jet, and distinct from the WCB jet because the sting jet occurs behind the primary cold front.
When the descended sting jet air reaches the top of the boundary layer, turbulent or convective mixing with air in the moist boundary layer occurs and the high-momen-tum air is brought down to the surface. This causes the strong surface gusts associated with the sting jet.
Case analysis of GudrunModel description The storm was analysed using model data output from the Met Office Unified Model (UM) version 6.1. A forecast on the global domain, with approximately 60km horizon-tal grid spacing in the mid-latitudes and 38 vertical model levels, was run forward from 0900 UTC on 7 January 2005 using initial data from the operational global model. This was used to generate lateral boundary conditions for a limited area
run over the operationally defined North Atlantic European (NAE) domain. Forecast data on this domain with a smaller hori-zontal grid spacing of 0.11o (approximately 12.5km) was used to analyse the system. An enhanced vertical resolution of 76 model levels was used in order to resolve the small-scale features associated with the sting jet, as Clark et al. (2005) found that a 90-level version of the UM verified better than a 38-level version (both with 0.11o
horizontal grid spacing).
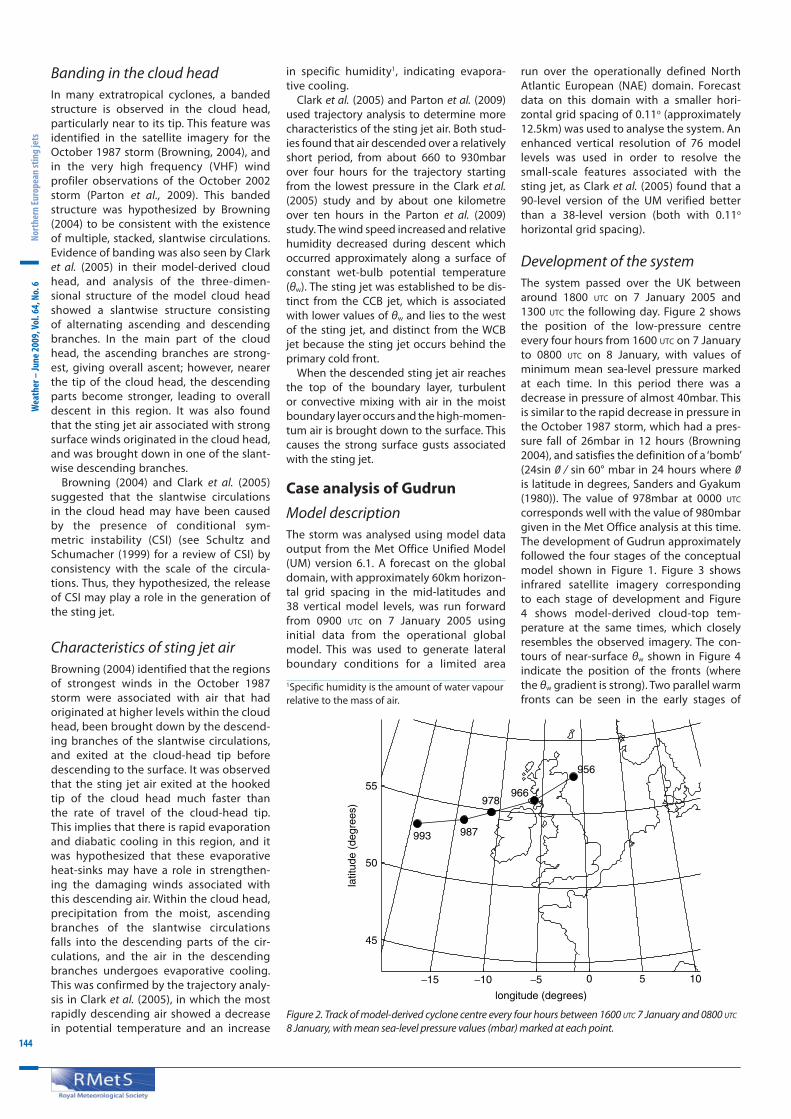
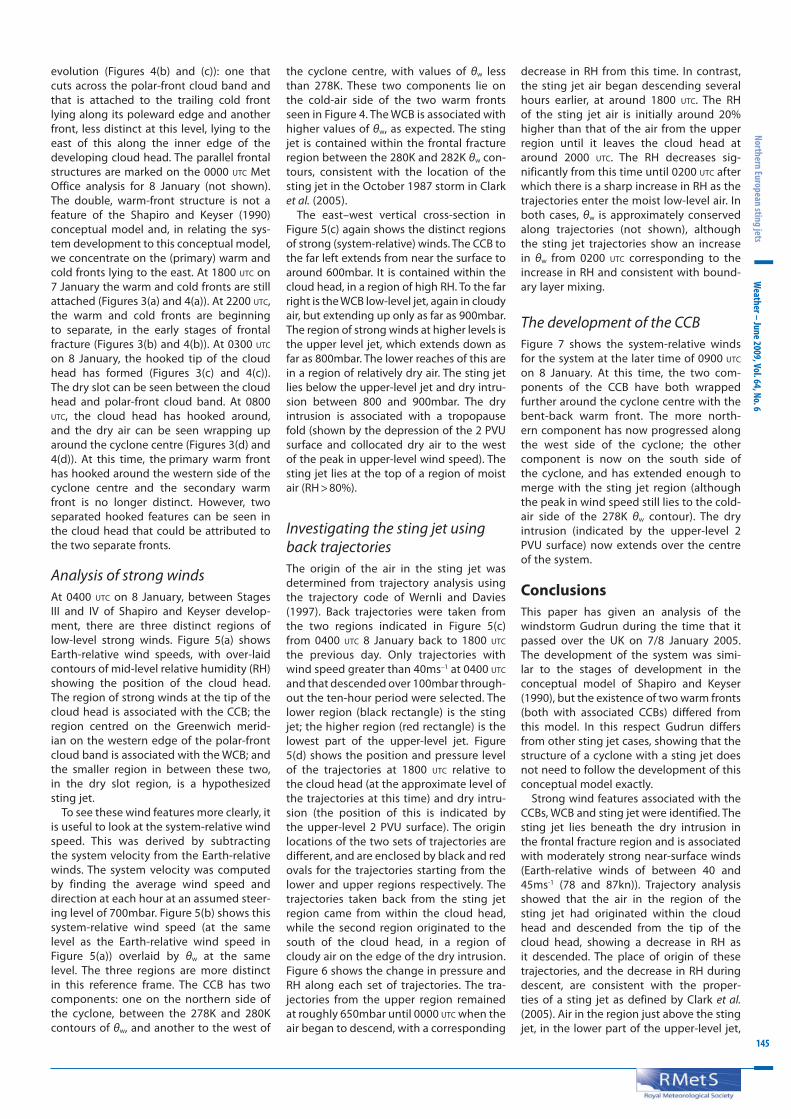
Development of the systemThe system passed over the UK between around 1800 UTC on 7 January 2005 and 1300 UTC the following day. Figure 2 shows the position of the low-pressure centre every four hours from 1600 UTC on 7 January to 0800 UTC on 8 January, with values of minimum mean sea-level pressure marked at each time. In this period there was a decrease in pressure of almost 40mbar. This is similar to the rapid decrease in pressure in the October 1987 storm, which had a pres-sure fall of 26mbar in 12 hours (Browning 2004), and satisfies the definition of a ‘bomb’ (24sin 0 / sin 60° mbar in 24 hours where 0 is latitude in degrees, Sanders and Gyakum (1980)). The value of 978mbar at 0000 UTC corresponds well with the value of 980mbar given in the Met Office analysis at this time. The development of Gudrun approximately followed the four stages of the conceptual model shown in Figure 1. Figure 3 shows infrared satellite imagery corresponding to each stage of development and Figure 4 shows model-derived cloud-top tem-perature at the same times, which closely resembles the observed imagery. The con-tours of near-surface θw shown in Figure 4 indicate the position of the fronts (where the θw gradient is strong). Two parallel warm fronts can be seen in the early stages of
956
966978
987993
45
−15 −10 −5 0 5 10
50
55
longitude (degrees)
latit
ude
(deg
rees
)
Figure 2. Track of model-derived cyclone centre every four hours between 1600 UTC 7 January and 0800 UTC 8 January, with mean sea-level pressure values (mbar) marked at each point.
1Specific humidity is the amount of water vapour relative to the mass of air.
Weather – June 2009, Vol. 64, No. 6
145
Northern European sting jets
evolution (Figures 4(b) and (c)): one that cuts across the polar-front cloud band and that is attached to the trailing cold front lying along its poleward edge and another front, less distinct at this level, lying to the east of this along the inner edge of the developing cloud head. The parallel frontal structures are marked on the 0000 UTC Met Office analysis for 8 January (not shown). The double, warm-front structure is not a feature of the Shapiro and Keyser (1990) conceptual model and, in relating the sys-tem development to this conceptual model, we concentrate on the (primary) warm and cold fronts lying to the east. At 1800 UTC on 7 January the warm and cold fronts are still attached (Figures 3(a) and 4(a)). At 2200 UTC, the warm and cold fronts are beginning to separate, in the early stages of frontal fracture (Figures 3(b) and 4(b)). At 0300 UTC on 8 January, the hooked tip of the cloud head has formed (Figures 3(c) and 4(c)). The dry slot can be seen between the cloud head and polar-front cloud band. At 0800 UTC, the cloud head has hooked around, and the dry air can be seen wrapping up around the cyclone centre (Figures 3(d) and 4(d)). At this time, the primary warm front has hooked around the western side of the cyclone centre and the secondary warm front is no longer distinct. However, two separated hooked features can be seen in the cloud head that could be attributed to the two separate fronts.
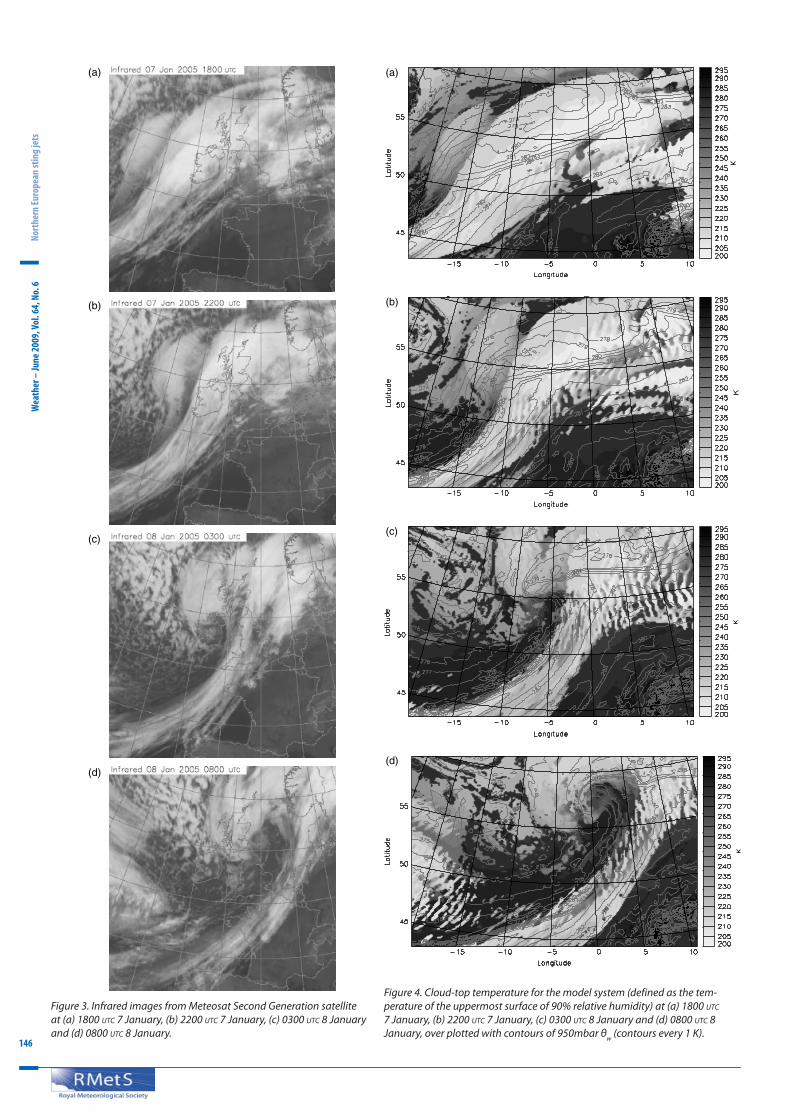
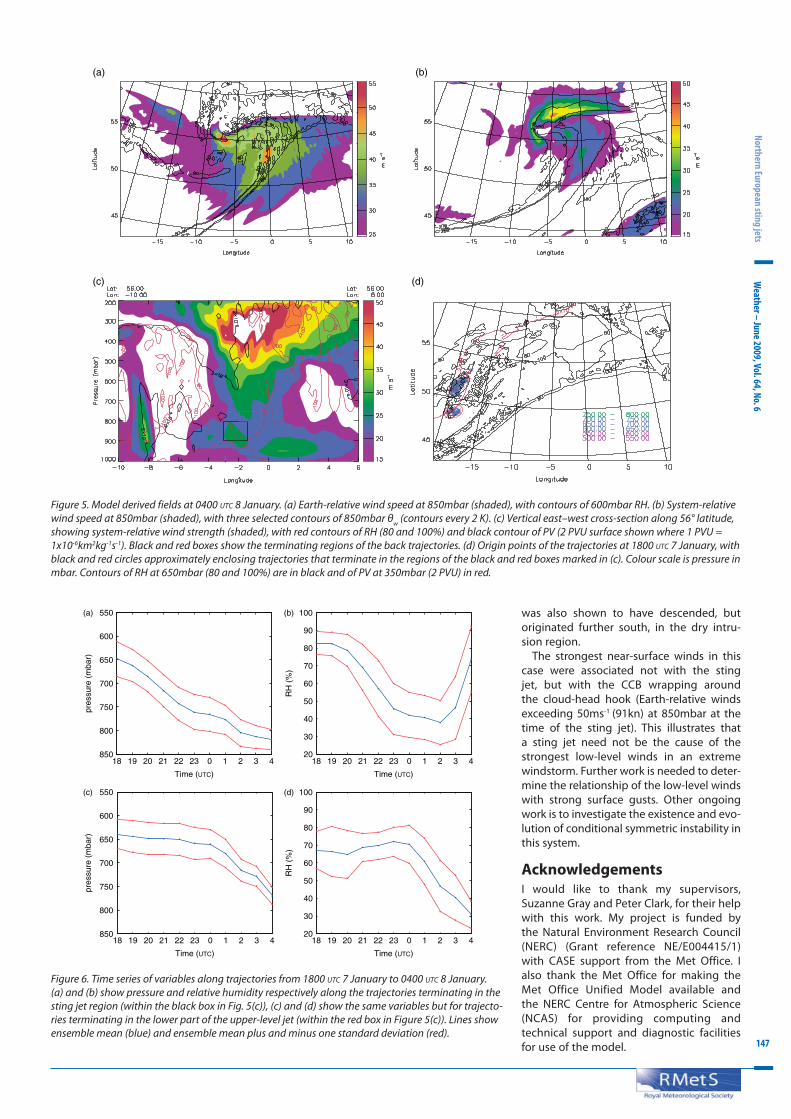
Analysis of strong windsAt 0400 UTC on 8 January, between Stages III and IV of Shapiro and Keyser develop-ment, there are three distinct regions of low-level strong winds. Figure 5(a) shows Earth- relative wind speeds, with over-laid contours of mid-level relative humidity (RH) showing the position of the cloud head. The region of strong winds at the tip of the cloud head is associated with the CCB; the region centred on the Greenwich merid-ian on the western edge of the polar-front cloud band is associated with the WCB; and the smaller region in between these two, in the dry slot region, is a hypothesized sting jet.
To see these wind features more clearly, it is useful to look at the system-relative wind speed. This was derived by subtracting the system velocity from the Earth-relative winds. The system velocity was computed by finding the average wind speed and direction at each hour at an assumed steer-ing level of 700mbar. Figure 5(b) shows this system-relative wind speed (at the same level as the Earth-relative wind speed in Figure 5(a)) overlaid by θw at the same level. The three regions are more distinct in this reference frame. The CCB has two components: one on the northern side of the cyclone, between the 278K and 280K contours of θw, and another to the west of
the cyclone centre, with values of θw less than 278K. These two components lie on the cold-air side of the two warm fronts seen in Figure 4. The WCB is associated with higher values of θw, as expected. The sting jet is contained within the frontal fracture region between the 280K and 282K θw con-tours, consistent with the location of the sting jet in the October 1987 storm in Clark et al. (2005).
The east–west vertical cross-section in Figure 5(c) again shows the distinct regions of strong (system-relative) winds. The CCB to the far left extends from near the surface to around 600mbar. It is contained within the cloud head, in a region of high RH. To the far right is the WCB low-level jet, again in cloudy air, but extending up only as far as 900mbar. The region of strong winds at higher levels is the upper level jet, which extends down as far as 800mbar. The lower reaches of this are in a region of relatively dry air. The sting jet lies below the upper-level jet and dry intru-sion between 800 and 900mbar. The dry intrusion is associated with a tropopause fold (shown by the depression of the 2 PVU surface and collocated dry air to the west of the peak in upper-level wind speed). The sting jet lies at the top of a region of moist air (RH > 80%).
Investigating the sting jet using back trajectoriesThe origin of the air in the sting jet was determined from trajectory analysis using the trajectory code of Wernli and Davies (1997). Back trajectories were taken from the two regions indicated in Figure 5(c) from 0400 UTC 8 January back to 1800 UTC the previous day. Only trajectories with wind speed greater than 40ms–1 at 0400 UTC and that descended over 100mbar through-out the ten-hour period were selected. The lower region (black rectangle) is the sting jet; the higher region (red rectangle) is the lowest part of the upper-level jet. Figure 5(d) shows the position and pressure level of the trajectories at 1800 UTC relative to the cloud head (at the approximate level of the trajectories at this time) and dry intru-sion (the position of this is indicated by the upper-level 2 PVU surface). The origin locations of the two sets of trajectories are different, and are enclosed by black and red ovals for the trajectories starting from the lower and upper regions respectively. The trajectories taken back from the sting jet region came from within the cloud head, while the second region originated to the south of the cloud head, in a region of cloudy air on the edge of the dry intrusion. Figure 6 shows the change in pressure and RH along each set of trajectories. The tra-jectories from the upper region remained at roughly 650mbar until 0000 UTC when the air began to descend, with a corresponding
decrease in RH from this time. In contrast, the sting jet air began descending several hours earlier, at around 1800 UTC. The RH of the sting jet air is initially around 20% higher than that of the air from the upper region until it leaves the cloud head at around 2000 UTC. The RH decreases sig-nificantly from this time until 0200 UTC after which there is a sharp increase in RH as the trajectories enter the moist low-level air. In both cases, θw is approximately conserved along trajectories (not shown), although the sting jet trajectories show an increase in θw from 0200 UTC corresponding to the increase in RH and consistent with bound-ary layer mixing.
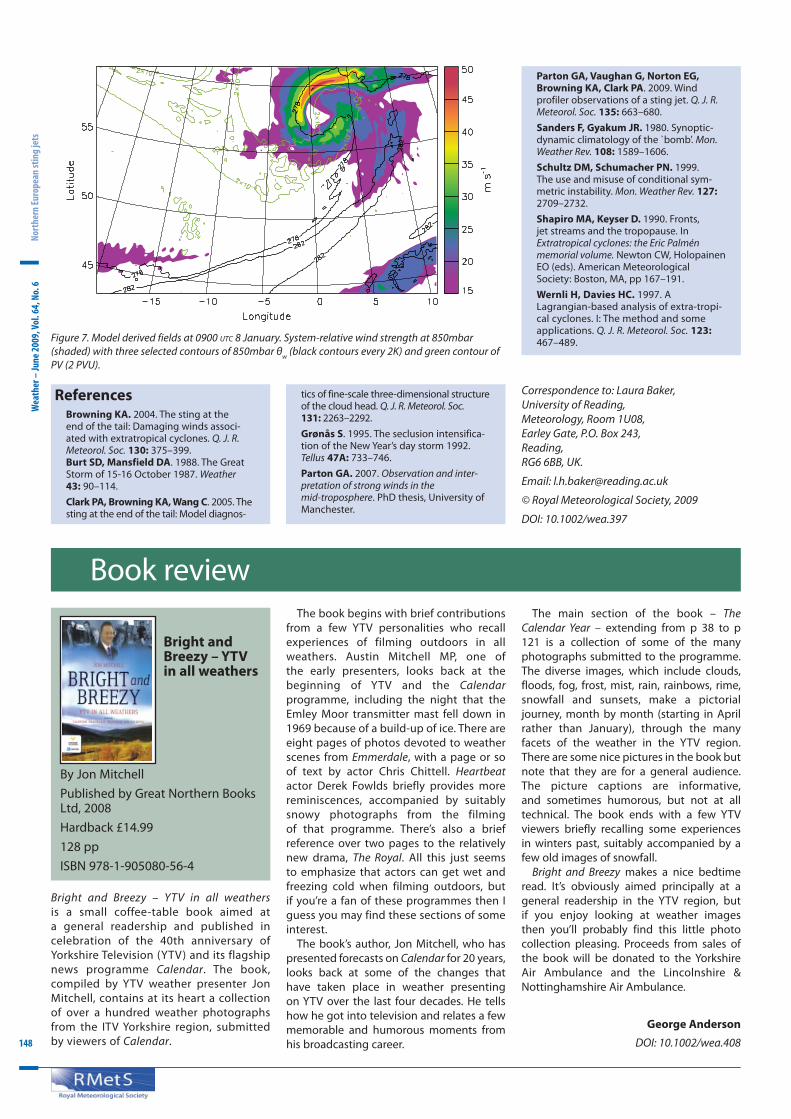
The development of the CCBFigure 7 shows the system-relative winds for the system at the later time of 0900 UTC on 8 January. At this time, the two com-ponents of the CCB have both wrapped further around the cyclone centre with the bent-back warm front. The more north-ern component has now progressed along the west side of the cyclone; the other component is now on the south side of the cyclone, and has extended enough to merge with the sting jet region (although the peak in wind speed still lies to the cold-air side of the 278K θw contour). The dry intrusion (indicated by the upper-level 2 PVU surface) now extends over the centre of the system.
Conclusions This paper has given an analysis of the windstorm Gudrun during the time that it passed over the UK on 7/8 January 2005. The development of the system was simi-lar to the stages of development in the conceptual model of Shapiro and Keyser (1990), but the existence of two warm fronts (both with associated CCBs) differed from this model. In this respect Gudrun differs from other sting jet cases, showing that the structure of a cyclone with a sting jet does not need to follow the development of this conceptual model exactly.
Strong wind features associated with the CCBs, WCB and sting jet were identified. The sting jet lies beneath the dry intrusion in the frontal fracture region and is associated with moderately strong near-surface winds (Earth-relative winds of between 40 and 45ms-1 (78 and 87kn)). Trajectory analysis showed that the air in the region of the sting jet had originated within the cloud head and descended from the tip of the cloud head, showing a decrease in RH as it descended. The place of origin of these trajectories, and the decrease in RH during descent, are consistent with the proper-ties of a sting jet as defined by Clark et al. (2005). Air in the region just above the sting jet, in the lower part of the upper-level jet,
146
Nort
hern
Euro
pean
stin
g je
tsW
eath
er –
June
2009
, Vol
. 64,
No.
6
Figure 4. Cloud-top temperature for the model system (defined as the tem-perature of the uppermost surface of 90% relative humidity) at (a) 1800 UTC 7 January, (b) 2200 UTC 7 January, (c) 0300 UTC 8 January and (d) 0800 UTC 8 January, over plotted with contours of 950mbar θw (contours every 1 K).
(a)
(b)
(c)
(d)
Figure 3. Infrared images from Meteosat Second Generation satellite at (a) 1800 UTC 7 January, (b) 2200 UTC 7 January, (c) 0300 UTC 8 January and (d) 0800 UTC 8 January.
(b)
(c)
(d)
(a)
Weather – June 2009, Vol. 64, No. 6
147
Northern European sting jets
Figure 5. Model derived fields at 0400 UTC 8 January. (a) Earth-relative wind speed at 850mbar (shaded), with contours of 600mbar RH. (b) System-relative wind speed at 850mbar (shaded), with three selected contours of 850mbar θw (contours every 2 K). (c) Vertical east–west cross-section along 56° latitude, showing system-relative wind strength (shaded), with red contours of RH (80 and 100%) and black contour of PV (2 PVU surface shown where 1 PVU = 1x10⁻⁶km2kg-1s-1). Black and red boxes show the terminating regions of the back trajectories. (d) Origin points of the trajectories at 1800 UTC 7 January, with black and red circles approximately enclosing trajectories that terminate in the regions of the black and red boxes marked in (c). Colour scale is pressure in mbar. Contours of RH at 650mbar (80 and 100%) are in black and of PV at 350mbar (2 PVU) in red.
(d)
(b)
(c)
(a)
43210232221201918
550
600
650
700
750
800
850
pres
sure
(m
bar)
550
600
650
700
750
800
850
pres
sure
(m
bar)
Time (UTC)
43210232221201918
Time (UTC)
43210232221201918
Time (UTC)
43210232221201918
Time (UTC)
20
30
40
50
60
70
80
90
100
RH
(%
)
20
30
40
50
60
70
80
90
100
RH
(%
)
(d)
(a)
(c)
(b)
Figure 6. Time series of variables along trajectories from 1800 UTC 7 January to 0400 UTC 8 January. (a) and (b) show pressure and relative humidity respectively along the trajectories terminating in the sting jet region (within the black box in Fig. 5(c)), (c) and (d) show the same variables but for trajecto-ries terminating in the lower part of the upper-level jet (within the red box in Figure 5(c)). Lines show ensemble mean (blue) and ensemble mean plus and minus one standard deviation (red).
was also shown to have descended, but originated further south, in the dry intru-sion region.
The strongest near-surface winds in this case were associated not with the sting jet, but with the CCB wrapping around the cloud-head hook (Earth-relative winds exceeding 50ms-1 (91kn) at 850mbar at the time of the sting jet). This illustrates that a sting jet need not be the cause of the strongest low-level winds in an extreme windstorm. Further work is needed to deter-mine the relationship of the low-level winds with strong surface gusts. Other ongoing work is to investigate the existence and evo-lution of conditional symmetric instability in this system.
AcknowledgementsI would like to thank my supervisors, Suzanne Gray and Peter Clark, for their help with this work. My project is funded by the Natural Environment Research Council (NERC) (Grant reference NE/E004415/1) with CASE support from the Met Office. I also thank the Met Office for making the Met Office Unified Model available and the NERC Centre for Atmospheric Science (NCAS) for providing computing and technical support and diagnostic facilities for use of the model.
148
Nort
hern
Euro
pean
stin
g je
tsW
eath
er –
June
2009
, Vol
. 64,
No.
6
Figure 7. Model derived fields at 0900 UTC 8 January. System-relative wind strength at 850mbar (shaded) with three selected contours of 850mbar θw (black contours every 2K) and green contour of PV (2 PVU).
ReferencesBrowning KA. 2004. The sting at the end of the tail: Damaging winds associ-ated with extratropical cyclones. Q. J. R. Meteorol. Soc. 130: 375–399.Burt SD, Mansfield DA. 1988. The Great Storm of 15-16 October 1987. Weather 43: 90–114.Clark PA, Browning KA, Wang C. 2005. The sting at the end of the tail: Model diagnos-
Correspondence to: Laura Baker,University of Reading, Meteorology, Room 1U08,Earley Gate, P.O. Box 243,Reading,RG6 6BB, UK.
Email: [email protected]
© Royal Meteorological Society, 2009
DOI: 10.1002/wea.397
tics of fine-scale three-dimensional structure of the cloud head. Q. J. R. Meteorol. Soc. 131: 2263–2292.Grønås S. 1995. The seclusion intensifica-tion of the New Year’s day storm 1992. Tellus 47A: 733–746.Parton GA. 2007. Observation and inter-pretation of strong winds in the mid-troposphere. PhD thesis, University of Manchester.
Parton GA, Vaughan G, Norton EG, Browning KA, Clark PA. 2009. Wind profiler observations of a sting jet. Q. J. R. Meteorol. Soc. 135: 663–680.Sanders F, Gyakum JR. 1980. Synoptic-dynamic climatology of the `bomb’. Mon. Weather Rev. 108: 1589–1606.Schultz DM, Schumacher PN. 1999. The use and misuse of conditional sym-metric instability. Mon. Weather Rev. 127: 2709–2732.Shapiro MA, Keyser D. 1990. Fronts, jet streams and the tropopause. In Extratropical cyclones: the Eric Palmén memorial volume. Newton CW, Holopainen EO (eds). American Meteorological Society: Boston, MA, pp 167–191.Wernli H, Davies HC. 1997. A Lagrangian-based analysis of extra-tropi-cal cyclones. I: The method and some applications. Q. J. R. Meteorol. Soc. 123: 467–489.
Book review
Bright and Breezy – YTV in all weathers is a small coffee-table book aimed at a general readership and published in celebration of the 40th anniversary of Yorkshire Television (YTV) and its flagship news programme Calendar. The book, compiled by YTV weather presenter Jon Mitchell, contains at its heart a collection of over a hundred weather photographs from the ITV Yorkshire region, submitted by viewers of Calendar.
The main section of the book – The Calendar Year – extending from p 38 to p 121 is a collection of some of the many photographs submitted to the programme. The diverse images, which include clouds, floods, fog, frost, mist, rain, rainbows, rime, snowfall and sunsets, make a pictorial journey, month by month (starting in April rather than January), through the many facets of the weather in the YTV region. There are some nice pictures in the book but note that they are for a general audience. The picture captions are informative, and sometimes humorous, but not at all technical. The book ends with a few YTV viewers briefly recalling some experiences in winters past, suitably accompanied by a few old images of snowfall.
Bright and Breezy makes a nice bedtime read. It’s obviously aimed principally at a general readership in the YTV region, but if you enjoy looking at weather images then you’ll probably find this little photo collection pleasing. Proceeds from sales of the book will be donated to the Yorkshire Air Ambulance and the Lincolnshire & Nottinghamshire Air Ambulance.
George Anderson
DOI: 10.1002/wea.408
The book begins with brief contributions from a few YTV personalities who recall experiences of filming outdoors in all weathers. Austin Mitchell MP, one of the early presenters, looks back at the beginning of YTV and the Calendar programme, including the night that the Emley Moor transmitter mast fell down in 1969 because of a build-up of ice. There are eight pages of photos devoted to weather scenes from Emmerdale, with a page or so of text by actor Chris Chittell. Heartbeat actor Derek Fowlds briefly provides more reminiscences, accompanied by suitably snowy photographs from the filming of that programme. There’s also a brief reference over two pages to the relatively new drama, The Royal. All this just seems to emphasize that actors can get wet and freezing cold when filming outdoors, but if you’re a fan of these programmes then I guess you may find these sections of some interest.
The book’s author, Jon Mitchell, who has presented forecasts on Calendar for 20 years, looks back at some of the changes that have taken place in weather presenting on YTV over the last four decades. He tells how he got into television and relates a few memorable and humorous moments from his broadcasting career.
Bright and Breezy – YTV in all weathers
By Jon MitchellPublished by Great Northern Books Ltd, 2008Hardback £14.99128 ppISBN 978-1-905080-56-4