STEROID HORMONES IN BIOSOLIDS AND POULTRY - DRUM
64
ABSTRACT Title of Thesis: STEROID HORMONES IN BIOSOLIDS AND POULTRY LITTER: A COMPARISON OF POTENTIAL ENVIRONMENTAL INPUTS Christine E. Bevacqua, M.S., 2010 Thesis Directed By: Professor Alba Torrents Department of Civil and Environmental Engineering Steroid hormones can act as potent endocrine disruptors when released into the environment. The main sources of these chemicals are thought to be wastewater treatment plant discharges and waste from animal feeding operations. While these compounds have frequently been found in wastewater effluents, few studies have investigated biosolids or manure, which are routinely land applied, as potential sources. This study assessed the relative environmental contribution of steroid hormones from biosolids and chicken litter. Samples of limed biosolids collected over a four year period and chicken litter from 12 mid-Atlantic farms were analyzed for 17β-estradiol (E2), estrone (E1), estriol (E3), 17α-ethinylestradiol (EE2), progesterone, and testosterone, and the conjugated hormones E1-sulfate (E1-S), E2-3- sulfate (E2-3-S), and E2-17-sulfate (E2-17-3). Results showed that E1 and progesterone were the most prevalent compounds in both of these materials, with E1-S also present in chicken litter.
Transcript of STEROID HORMONES IN BIOSOLIDS AND POULTRY - DRUM

ABSTRACT
Title of Thesis: STEROID HORMONES IN BIOSOLIDS AND
POULTRY LITTER: A COMPARISON OF POTENTIAL ENVIRONMENTAL INPUTS
Christine E. Bevacqua, M.S., 2010 Thesis Directed By: Professor Alba Torrents
Department of Civil and Environmental Engineering
Steroid hormones can act as potent endocrine disruptors when released into
the environment. The main sources of these chemicals are thought to be wastewater
treatment plant discharges and waste from animal feeding operations. While these
compounds have frequently been found in wastewater effluents, few studies have
investigated biosolids or manure, which are routinely land applied, as potential
sources. This study assessed the relative environmental contribution of steroid
hormones from biosolids and chicken litter. Samples of limed biosolids collected
over a four year period and chicken litter from 12 mid-Atlantic farms were analyzed
for 17β-estradiol (E2), estrone (E1), estriol (E3), 17α-ethinylestradiol (EE2),
progesterone, and testosterone, and the conjugated hormones E1-sulfate (E1-S), E2-3-
sulfate (E2-3-S), and E2-17-sulfate (E2-17-3). Results showed that E1 and
progesterone were the most prevalent compounds in both of these materials, with
E1-S also present in chicken litter.

STEROID HORMONES IN BIOSOLIDS AND POULTRY LITTER: A COMPARISON OF POTENTIAL ENVIRONMENTAL INPUTS
By
Christine Elizabeth Bevacqua
Thesis submitted to the Faculty of the Graduate School of the University of Maryland, College Park, in partial fulfillment
of the requirements for the degree of Master of Science
2010 Advisory Committee: Professor Alba Torrents, Chair Dr. Clifford Rice, Co-Chair Assistant Professor Joshua McGrath Professor Emeritus Richard Weismiller

© Copyright by Christine Elizabeth Bevacqua
2010

ii
Acknowledgements
Thank you to my many advisors: Dr. Alba Torrents for keeping me on track,
Mark Ramirez for his advice and support of this project, and especially Dr. Cliff Rice
for his enthusiasm, patience, and technical expertise which made this work possible.
Thank you also to my committee members: Dr. Richard Weismiller for his support
and excellent teaching and Dr. Josh McGrath for answering my questions about
poultry litter and helping to locate samples to analyze.
This research was funded by the District of Columbia Water and Sewer
Authority (DCWASA) and was conducted at the USDA Agricultural Research
Service’s Beltsville Agricultural Research Center (ARS-BARC). The support of both
organizations is greatly appreciated.
There are a number of people who assisted with my research. Thanks to
Krystyna Bialek for keeping our lab stocked, organized, and running smoothly, to Di
Deng, Natasha Andrade, and Gabriela Niño de Guzmán for their help with sample
collection and assistance in the lab, to Cheryl Patterson for her help with sample
preparation, and to Garrett Hughes for his assistance with my lime experiments.
Special thanks to Dr. Michael Meyer at the USGS Kansas Water Science Center in
Lawrence, KS for his advice on analytical methods and for kindly providing me with
standards, and to Dr. Rosalina Angel in the Animal Sciences Department at UMD for
providing me with the poultry litter samples I analyzed.
Finally, thank you to John Haines. Without your support and confidence this
would not have been possible.

iii
Table of Contents
Acknowledgements ....................................................................................................... ii Table of Contents ......................................................................................................... iii List of Tables ............................................................................................................... iv List of Figures ............................................................................................................... v Chapter 1: Introduction ................................................................................................. 1
1.1 Steroid Hormones Structure and Function .......................................................... 1 1.2 Endocrine Disrupting Potential ........................................................................... 4 1.3 Environmental Occurrence of Steroid Hormones ............................................... 8 1.4 Steroid Hormones in Biosolids ......................................................................... 10 1.5 Steroid Hormones in Chicken Litter ................................................................. 13 1.6 Biosolids and Poultry Litter Production and Use in Maryland ......................... 16 1.7 Scope of Work .................................................................................................. 17
Chapter 2: Materials and Methods .............................................................................. 19 2.1 Biosolid Sample Collection and Preparation .................................................... 19 2.2 Chicken Litter Sample Collection and Preparation .......................................... 19 2.3 Standards, Reagents and Materials ................................................................... 20 2.4 Pressurized Liquid Extraction ........................................................................... 21 2.5 LC/MS/MS Analysis ......................................................................................... 22 2.6 Quality Control/Quality Assurance................................................................... 23
Chapter 3: Results and Discussion .............................................................................. 25 3.1 Results ............................................................................................................... 25
3.1.1 Method Performance ................................................................................. 25 3.1.2 Biosolids Analysis ...................................................................................... 26 3.1.3 Chicken Litter Analysis .............................................................................. 28
3.2 Discussion ......................................................................................................... 29 3.2.1 Biosolids Analysis ...................................................................................... 29 3.2.2 Chicken Litter Analysis .............................................................................. 34 3.2.3 Comparison of Environmental Inputs by Biosolids and Poultry Litter ..... 35
Chapter 4: Conclusions ............................................................................................... 39 Appendix A: Method Development ............................................................................ 43 Appendix B: Sample Data .......................................................................................... 45 Appendix C : Chromatogram Comparisons ................................................................ 47 Appendix D: Lime Experiment ................................................................................... 49 Appendix E: Calculation of Yearly Inputs .................................................................. 52 Bibliography ............................................................................................................... 53

iv
List of Tables Table 1: Concentrations of steroid hormones found in biosolids 11
Table 2: Concentrations of steroid hormones found in chicken litter 16
Table 3: MS conditions used for the detection of hormones and conjugated hormones 23 Table 4: Recoveries (%) of steroid hormones, conjugated hormones, and internal standards 25 Table 5: Averages and Relative Percent Difference (RPD) from two extraction runs of the same sample 33 Table 6: Estimated yearly inputs of steroid hormones from biosolids and chicken litter 36 Table 7: Initial Predicted Environmental Concentrations (PECini) of steroid hormones in soil after amendment with biosolids or chicken litter 38

v
List of Figures
Figure 1: Structures of studied steroid hormones 2
Figure 2: Concentrations of estrone and progesterone in biosolids over 4 years 27
Figure 3: Trends in estrone and progesterone values over 4 years 27
Figure 4: Concentrations of steroid hormones in chicken litter 29
Figure 5: Relative environmental inputs of steroid hormones from biosolids and chicken litter 37

1
Chapter 1: Introduction
1.1 Steroid Hormones Structure and Function
Steroid hormones are a class of biological chemicals derived from cholesterol
that play a variety of roles in vertebrate systems. Within this classification are
estrogens, gestagens, and androgens. Estrogens and androgens are generally
considered the “female” and “male” sex hormones, respectively, while gestagens are
largely responsible for initiation and maintenance of pregnancy.
All steroids are derived from cholesterol. This compound is composed of
three cyclohexanes (labeled A, B, and C) and a cyclopentane (D), with a carbon side
chain attached at the 17 position of the D ring. Partial loss of the side chain results in
a series of C-21 compounds which includes progesterone, other gestagens, and
corticosteroids. Complete loss of the chain results in the series which includes the
androgens, of which testosterone is the primary compound. The next step of
transformation includes the aromatization of the A ring and results in the estrane
series, known as estrogens. Different compounds of all series are characterized by
various functional groups at different positions of the carbon backbone. Main
variations in the estrogen structures occur at C-16 and C-17 positions of the D-ring.
The primary estrogen, estradiol, is characterized by the hydroxyl group in the C-17
position which can be in either the α or the β conformation. 17β-estradiol (E2) is the
more common compound; a few species, most notably cattle, produce mainly 17α-
estradiol. Estrone (E1) differs from this structure by containing a carbonyl group at
the 17 position instead of the hydroxyl, while estriol (E3) has a hydroxyl at both the

2
OH
OHCH3
H
H H
OH
CH3
H
H H
O
OH
OHCH3
H
H H
OH
OH
H
H H
OH
O
CH3
H
H H
CH3
O
CH3
O
OHCH3
H
H H
CH3
Estrone(E1)
17β-estradiol(E2)
Estriol(E3)
17α-ethinylestradiol (EE2)
Progesterone(P)
Testosterone(T)
17 and 16 positions. Synthetic steroids contain
structural features that allow them to be more
stable, and therefore able to be taken orally and
survive to reach the active sites. For example,
17α-ethinylestradiol (EE2) has an ethene group
at the 17 position in addition to the hydroxyl
present in natural 17β-estradiol. These
structures are illustrated in Figure 1.
The primary estrogens are E2, E1, and
E3. E2 is the most prevalent and potent of these
forms, and is responsible for sexual
differentiation in developing fetuses, for
development of secondary female
characteristics such as breasts, and for
regulating the menstrual cycle together with
progesterone and non-steroidal hormones
Follicle Stimulate Hormone (FSH) and
Luteinizing Hormone (LH). While an
estrogen’s dominant roles are in the
reproductive tract, there are estrogen receptors
in other organs as well, from the brain and
hypothalamus to visceral organs such as the
liver. E2 is also present in males, although in Figure 1. Structures of studied steroid hormones.

3
much lower concentrations. E1 is the main degradation product of E2, and
transformations between these two forms can readily occur during hormonal cycles.
However, the estrogenic potency of E1 is half that of E2 (Johnson and Sumpter
2001). The third of these main forms of estrogen, E3, is mainly produced during
pregnancy by the placenta and the developing fetus. It is the least potent compound,
with potency between 0.005 and 0.04 that of E2 (Johnson and Sumpter 2001).
The male equivalents to the estrogens are the androgens, with the most potent
of these being testosterone. They are responsible for growth and development of the
male reproductive system and secondary sex characteristics such as increased facial
and body hair. Testosterone is present in much lower amounts in females and
influences female sexual behavior. It is also known to have anabolic effects in both
sexes such as increasing muscle mass.
Progesterone is the most potent gestagen and can also be considered the only
natural chemical in this group (Besse and Garric 2009). It is responsible for
preparing the uterus for a fertilized egg and for maintaining pregnancy. While it is
present in higher concentrations in females, progesterone is produced in both sexes
and is an early precursor in the formation of other steroid hormones, including the
estrogens and androgens. In addition to its direct reproductive role, progesterone acts
on the nervous system and is involved in mating and parental care behaviors. It acts
in both sexes; its role in males is now thought to be more prominent than originally
believed (Schumacher and Robert 2002).
Certain synthetic forms of these chemicals have also been developed for
pharmaceutical uses. Synthetic estrogens are used in birth control, hormone

4
replacement therapies, and in certain cancer drugs, either alone or in combinations
with synthetic gestagens. As they need to remain in an active form in the body long
enough to produce the desired effect, synthetic hormones are generally more potent
and persistent than their natural counterparts. The most common synthetic estrogen,
17α-ethynylestradiol (EE2), has an in vitro potency of 1-2x that of E2 (Johnson and
Sumpter 2001)
1.2 Endocrine Disrupting Potential
Steroid hormones function by binding to a hormone receptor within the
cytoplasm of the cell or on the cell membrane, which triggers a series of reactions
associated with that hormone. The binding occurs mainly on the basis of shape. If
another molecule is present that is similar in shape to the hormone associated with the
receptor, it can bind in its place, thus triggering the reactions normally associated
with that hormone. Similarly, an exogenous molecule could bind and therefore
prevent the binding of the appropriate hormone and prevent the associated actions
from occurring. Both of these events are classified as endocrine disruption. With an
ever increasing amount of pharmaceuticals, personal care products, pesticides, and
other organic chemicals on the market, concern has risen in recent years over the
potential for endocrine disruption in humans and other animals when these chemicals
are released into the environment.
While the natural steroid hormones have always been present in the
environment, they are nevertheless a subject of concern. Increasing human
population densities and intensive livestock production can result in concentrated

5
releases of hormones, resulting in potential endocrine disruption. As these chemicals
are the ones designed to attach at receptor sites, they are active at much lower
concentrations than exogenous chemicals. Metcalfe et al. (2001) observed males with
a condition know as “intersex”, in which oocytes are found in the testes, when groups
of Japanese medaka, (Oryzias latipes), were exposed to 10 ng/L of E2 or E1 from
hatch to 100 days after hatch. In comparison, the industrial chemicals 4-nonylphenol
and bisphenol A were less potent by a factor of 106. While E3 was shown to be 100x
less potent than the other estrogens, this is still 1000x more potent than those
industrial chemicals (Metcalfe et al. 2001). There is particular concern with regard to
exposure of aquatic or soil organisms to natural or synthetic hormones, as these
populations are directly and continuously affected by any increasing environmental
concentrations of these chemicals. This class of compounds can be considered
pseudo-persistent, since they may degrade readily, but are constantly introduced to
the soil or water environment (Besse and Garric 2009).
One useful marker of estrogen exposure is vitellogenin production.
Vitellogenin is a precursor protein to egg yolk production that is produced in response
to E2. It is found in the blood of developed females of oviparous (egg-laying)
species, while concentration in juveniles or males is very low. Species in this
category include fish, reptiles, and birds. Detection of increased levels of vitellogenin
in the blood of these types of animals, especially males or juveniles, can be used to
indicate exposure to estrogens or estrogen mimics. This technique is frequently used
in fish species and a number of studies have demonstrated elevated vitellogenin levels
in male or juvenile fish exposed to estrogenic chemicals (Routledge et al. 1998,

6
Jobling et al. 1998, Larsson et al. 1999, Yonkos 2005). Similarly, in a study of
painted turtles living in ponds on cattle farms, Irwin et al. (2001) found that while E2
levels in the ponds were not sufficient to induce vitellogenin in male turtles, females
had significantly higher levels of the protein than the females living in a nearby
control pond. While the type of induction may vary between species, vitellogenin
levels in blood are a useful indicator of exposure to estrogenic compounds and allow
for long-term monitoring of a population, as the same individuals can be repeatedly
tested over time.
The presence of vitellogenin itself may not have a deleterious effect on the
organism; it is mainly useful as a biomarker of exposure. However, disruption in the
system of steroid hormones can affect development, reproduction, or sex ratios in
species. The development of intersex fish has been induced in the laboratory and has
also been seen in fish in natural streams, especially those downstream of wastewater
treatment facilities (Metcalfe et al. 2001, Koger, Teh and Hinton 2000, Yonkos 2005,
Jobling et al. 1998). In cases of more severe exposure, significantly more females
than males are seen in some fish populations (Metcalfe et al. 2001, Koger et al. 2000,
Yonkos 2005). Whether or not the incidence of this condition will affect the overall
population depends on how successfully the intersex individuals can reproduce. Kidd
et al.(2007) observed near-complete reproductive failure and collapse of the fathead
minnow population in an experimental lake in Ontario, Canada after exposure to 5-6
ng/L of EE2 over three years. During the exposure time, individuals in the population
displayed impaired gonadal development and intersex conditions. A species can also
be affected without these physically apparent effects, as demonstrated by a study in

7
which EE2 exposure reduced the chances of successful mating in a population of sand
gobies (Saaristo et al. 2009).
As with male fish exposed to estrogens, female to male intersex has been
induced in female fish by exposure to androgens in laboratory studies (Koger et al.
2000). However, the effects caused by androgens and estrogens are not entirely
parallel, as testosterone and some of its metabolites can be aromatized to estrogens.
For example, sexually undifferentiated medaka exposed to methyltestosterone
displayed significantly higher levels of vitellogenin than controls, but in the presence
of fadrozole, an aromatase inhibitor, fish displayed increased aggression and male
secondary sexual characteristics. These results imply that when aromatization could
occur, some of the androgen was converted to an estrogen (Zerulla et al. 2002). León
et al. (2007), studied the response of medaka to 11-ketotestosterone, which can not be
aromatized. In their study, they did not observe gonadal effects, but found
differences in body weight and development, indicating the thyroid was affected
(León et al. 2007). Androgenic activity and associated endocrine disruption has also
been observed in environmental conditions in streams and ponds receiving effluent
from cattle feedlots (Orlando et al. 2004). In general, however, androgens are less
extensively studied than estrogens, and more studies on environmental occurrence of
androgens focus on effects seen downstream of pulp and paper mills than on water or
soil impacted by agricultural activities or domestic WTPs.
In addition to disrupting gonadal and egg development, changes in exogenous
hormone levels can affect spawning behavior in some fish species. Androgens,
estrogens, and especially progestins act as pheromones in fish and have been detected

8
in wastewater above the low ng/L levels at which fish will show an olfactory response
(Kolodziej, Gray and Sedlak 2003). Aside from these pheromone studies, little
research has been conducted on progesterone or synthetic progestins and their
occurrence in or possible effects on environmental systems (Besse and Garric 2009).
1.3 Environmental Occurrence of Steroid Hormones
In order to be excreted from the body, steroid hormones are generally
transformed into more soluble, inactive conjugated forms and excreted in urine. Most
commonly, this conjugation involves the addition of a glucuronate or sulfate group at
the 3 position of the A ring or the 17 position of the D ring. One or all of these
conjugation possibilities could occur to a molecule. The majority of excreted
estrogens are glucuronated; in humans, the ratio of sulfated to glucuronated estrogens
in female urine is about 21% to 79% (D'Ascenzo et al. 2003). Once excreted,
however, these conjugated compounds are susceptible to deconjugation, resulting in
free and biologically active steroid hormones. Glucuronated compounds are less
stable and are readily cleaved in wastewater processes, but sulfates will persist longer.
This difference is likely due to the large amount of β-glucuronidase enzyme present
in fecal bacteria which acts to cleave the conjugated compound. Arylsulfatase is
more scarce (D'Ascenzo et al. 2003). This difference in stability results in free and
sulfated hormones being the dominant species present in wastewater influent, with a
ratio of free to conjugated species around 2 (D'Ascenzo et al. 2003).
Wastewater treatment plants (WTPs) and livestock operations, especially
concentrated (or confined) animal feeding operations, are the two primary sources of

9
steroid hormones to water or soil. With log Kow (octanol-water partition coefficient)
values between 2.6 and 4.0, free steroid estrogens are moderately hydrophobic and
are likely to partition out of the water phase onto solids (Khanal et al. 2006).
Conjugated forms are more soluble and are more likely to be found in the water
phase. However, their presence in sludge or sediment has been noted in a few studies
(Nieto et al. 2008, Matejícek, Houserová and Kubán 2007, Isobe et al. 2006).
Both WTPs and animal feeding operations produce solid waste materials that
are used as an amendment to agricultural fields. This is partially out of the necessity
for an acceptable disposal route, but it can also be a very beneficial practice which
recycles nutrients back into the soil and reduces dependence on chemical fertilizers,
as well as providing additional organic carbon and aeration to the soil. Aside from
benefits to the soil, reuse of waste materials is a sustainable practice which saves
money for farmers and saves space in landfills. However, there is a risk of
introducing contaminants such as steroid hormones into the soil, surface water, or
groundwater through infiltration or runoff. Hormones have been detected in soil and
runoff from both fields amended with biosolids and with poultry litter or other animal
manure (Busheé, Edwards and Moore Jr 1998, Nichols et al. 1997, Finlay-Moore,
Hartel and Cabrera 2000, Yonkos 2005, Jenkins et al. 2006, Beck et al. 2008). In
order to make the best use of these materials in the safest way possible, it is important
to understand the potential risks associated with the presence of these
microconstituents

10
1.4 Steroid Hormones in Biosolids
Of the approximately 8.2 million tons of biosolids that will be produced in the
U.S. in 2010, approximately 70% is expected to be put to some beneficial use,
including land application for agriculture or reclamation (USEPA 1999). This
material consists of the wastewater sludge which has been separated and treated,
primarily to reduce pathogens. The Environmental Protection Agency, in Part 503 of
its Title 40 regulation, sets standards for the use or disposal of biosolids, including
those that must be met before land application occurs. There are two classes, Class A
and Class B, which are deemed safe for use, with Class A meeting higher standards
and therefore being less restricted (potentially unrestricted) in usage (USEPA 1994).
Standards include limits on the allowable concentrations of heavy metals and required
treatments to reduce pathogens and vectors (flies, etc.). However, these regulations
do not currently contain standards regarding concentrations of organic chemicals in
biosolids, mainly due to the large number and wide variety potentially present
(USEPA 1994). This gap makes land application of this material a potential source of
environmental contamination.
Knowledge about the occurrence of steroid hormones in sludge and biosolids
is still incomplete. Relatively few studies have investigated this issue, and those
mainly focus on E2, E1 and EE2. Concentrations of hormones found in the literature
are given in Table 1. Two studies also screened for conjugated hormones in sludge.
Nieto et al. (2008), found E2-3S and E1-S in all of their samples with concentrations
ranging from 0.64 to 7 ng/g. Muller et al. (2008) did not find any conjugated forms
of hormones present.

11
Table 1. Concentrations of steroid hormones found in biosolids
Concentration (ng/g dry wt)
Authors Treatment E1 E2 E3 EE2 P T
Ternes et al. ( 2002) Digestiona 16, NDb,c 9, 49c NAb 17, 2c NA NA
Andersen et al. ( 2003) Digestiona 22.8-27.8 4.9-5.4 NA ND NA NA
Muller et al. (2008) Dewatered 2-8 1-10 ND 1-16 NA NA
Nieto et al. ( 2008) Unknown ND-200d ND ND-406 ND NA NA
Pothitou and Voutsa (2008)
Dried ND ND ND NA NA NA
US EPAe (2009) Varied 26.7-965 22-355 7.56-232 ND 143-1290 30.8-2040
aType (anaerobic vs. aerobic) not specified bNA = Not analyzed, ND= Not detected cOnly two samples analyzed dExact number not given, value extracted from a graph eRanges given for samples where hormones were detected. E1 was detected in 60/84 samples, E2 in 11/84, E3 in 18/84, P in 19/84, and T in 17/84.
Of all these studies, the most comprehensive is the Targeted National Sewage
Sludge Survey (TNSSS) carried out by the U.S. Environmental Protection Agency.
This broad study was designed to obtain national estimates of the occurrence of a
number of analytes of concern in sludge (USEPA 2009). Eighty-four samples were
collected at 74 publicly-owned treatment works (POTWs) across 35 states, each
treating more than 1 million gallons of wastewater per day. All free hormones which
are part of the current study were included in the analyte list of the TNSSS. As
shown in Table 1, values for these hormones varied widely, with the exception of
EE2 which was not detected in any samples collected. Among the analytes found, E1
was detected in 71% of samples, while progesterone was found in 23%, E3 in 21%,
testosterone in 20%, and E2 in 13%.

12
E1 was detected with similar constancy among the other studies. In addition
to those in Table 1, Thomas et al. (2007) in a study of a wastewater treatment plant in
Norway noted that E1 was present in all of their dewatered sludge samples, although
they did not give exact numbers. E2 and EE2 were detected more frequently by other
researchers than those involved in the TNSSS. This could be due to a higher
reporting limit for the methods used by the EPA (EPA 2009), which could also help
explain why other studies report mainly lower concentrations of E2; any samples
having those levels of the hormone would not have been reported in the TNSSS. On
the other hand, Nieto et al. (2008) also found E3 in two samples from one treatment
plant at concentrations of 272 and 406 ng/g, which are larger values than those found
in the TNSSS. Aside from the EPA study, no concentration values for testosterone or
progesterone could be found in the literature.
Part of the wide variation in reported values is likely attributed to the variety
of technologies used in treating sludge, resulting in a wide variety of final products.
For example, the percent solids of the samples tested in the TNSSS ranged from
0.14% to 94.9%. Treatment options to produce biosolids for land application include
aerobic or anaerobic digestions, composting, drying, and lime stabilization. These
processes each subject any compounds in the sludge to a different set of conditions
which may enhance or impede degradation or transformation.
In addition to these studies, which all utilize gas or liquid chromatography
coupled with mass spectrometry, other researchers have used biological assays to
detect hormonally active compounds in biosolids. Lorenzen et al. (2004) analyzed
samples of biosolids from 19 sewage treatment plants across Ontario, Canada using a

13
recombinant yeast assay. In their anaerobically digested sludge, they found average
receptor gene transcription activities of 1233 ng/g dry weight for estrogens, 543 ng/g
dry weight for androgens, and no activity for progesterone. The drawback to this type
of study is the lack of specificity, which does not allow for direct comparison with
analytical methods. The values for estrogens and androgens initially look much
higher than anything reported in Table 1, but they could include any compounds with
hormonal activity, whether or not they are a hormone or even a contaminant.
Additionally, assays use various types of cells which can give varying results. In the
Lorenzen et al. (2004) study, some samples were analyzed using a human ovarian
carcinoma cell assay instead of yeast and these results showed concentrations that
followed the same pattern but had absolute values 25 times less than when the yeast
was used.
1.5 Steroid Hormones in Chicken Litter
More than 13 million tons of poultry litter is produced across the U.S. per year
and nearly all (>90%) is applied to agricultural land (Moore et al. 1995). This
material is composed of manure, bedding material, and feathers and is a good source
of nutrients (e.g. N, P, and K). In contrast to the regulations applied to biosolids,
management of poultry litter in the U.S. is based solely on its nutrient content. The
EPA’s CAFO rule defines an Animal Feeding Operation (AFO) and a Confined
Animal Feeding Operation (CAFO) and requires all CAFOs to apply and implement a
nutrient management plan. AFOs, which include poultry houses, are facilities where
animals are “stabled or confined and fed or maintained for 45 days or more in any 12

14
month period” (USEPA 2003). In the case of chickens, an AFO is considered a
CAFO if it houses 37,500 or more chickens and uses a liquid manure handling system
or 25,000 or more chickens and uses any other system (USEPA 2003). In Maryland,
the Nutrient Management Law requires farmers who have more than $2,500 in gross
income and more than eight animal units (1,000 pounds of live animal weight) to
have a management plan in place for nitrogen and phosphorus (MDA 2004). A
nutrient management plan is defined as a plan to “manage the amount, placement,
timing, and application of animal waste, commercial fertilizer, sludge, or other plant
nutrients to prevent pollution by transport of bioavailable nutrients and to maintain
productivity”(MDA 2004). Those farmers applying sludge or animal manure, which
includes poultry litter, were required to have a plan for nitrogen prepared by a
certified consultant by December 31, 2001 and for both nutrients by July 1, 2004.
They were required to comply with the nitrogen plan by December 31, 2002 and the
combined plan by July 1, 2005.
Aside from these plans, treatment and management of poultry litter is largely
at the discretion of the individual farmer or company. Ammonia build-up and
moisture are deciding factors in when to remove and replace the litter in a house.
Generally, farmers will “cake out”, or remove the top layer of litter, between flocks of
birds, and about once a year scrape out the whole house. Most of the litter is either
applied directly to land, or stockpiled until it is used. Other options include
composting systems to cycle litter back into poultry houses, and pelletizing, which is
a pasteurization process that condenses the nutrients and organic material into pellets
that can be packaged and sold as organic fertilizer.

15
All studies found in the literature on steroid hormone concentrations in
poultry litter used biological assay methods. As a result, they focus on E2 and
testosterone; very little information could be found on any other compound. The
concentrations reported are given in Table 2. As with the biosolids analyzed by these
methods, there is a lack of specificity and a question as to which compounds exactly
could produce the responses shown and are therefore represented in the total
concentrations. Yonkos (2005) investigated this issue to some extent by attempting
to separate the conjugated hormones from the free compounds. He found that about
half of the E2 response was from the conjugated compounds, while most of the
testosterone was in the free form. Likewise, Shore et al. (1993), report concentrations
of “estrogen” in their study, acknowledging that the values are a combination of E2
and E1.

16
Table 2. Concentrations of steroid hormones found in chicken litter. Concentrations given as ranges if all numbers were available, otherwise they are averages. NA = Not Analyzed, ND = Not Detected
Concentration (ng/g dry wt)
Authors Litter Type N Method a E2 T P Finlay-Moore et al.
(2000) Broiler 8 EIA 20-35 15-55 NA
Jenkins et al. (2006) Broiler 8 EIA 1.2-1.4 0.02-0.05 NA
Jenkins et al. (2008) Broiler 2 EIA 1.88, 0.81 0.75, 0.13 NA
Jenkins et al. (2009) Broiler 2 EIA 2.7, 0.99 0.34, 0.40 NA
Nichols et al. (1997) Broiler 1 EIA 133 NA NA
Nichols et al. (1998) Broiler 1 EIA 904 NA NA
Lorenzen et al. (2004) Broiler 12 RYA 60 30 (2/12) ND
Breeder 5 70 30 67 (1/12)
Layer 4 55 10 ND
Yonkos (2005) Broiler 8 RIA 86-166b 19-58 b NA
Shore et al. (1993) Broiler- Males 10 RIA 14 c 133 NA
Broiler-Female 10 65 c 133 NA
Layer 17 533 c 254 NA aEIA = Enzyme Immoassay, RYA= Recombinant Yeast Assay, RIA = Radio Immoassay bWet weight cValues given as concentration of E2 and E1
1.6 Biosolids and Poultry Litter Production and Use in Maryland
The State of Maryland has both a high human population density and a large
poultry industry, making the issue of relative environmental inputs of steroid
hormones from these sources relevant. More than 700,000 wet tons of sewage sludge
is produced in Maryland each year and approximately 30% of this amount is applied
to agricultural land in-state. An additional 42% is hauled out of state, likely for land
application as well. The remaining material is used for land reclamation (3%),

17
composted or pelletized for commercial use (13%), or incinerated or disposed of in
landfills (12%). The amount applied to land in-state has been generally decreasing
since 2004, from 240,427 tons to 188,221 tons in 2008 (MDE 2009a). In order to use
biosolids on farmland, the contractor must have a permit containing results of soil and
sludge testing, and the application site is also inspected to ensure proper application.
Currently, about 46,000 acres on more than 300 farms throughout Maryland are
permitted to receive biosolids (MDE 2009b).
Nearly 300 million chickens were produced in Maryland in 2007 (USDA
2009). Broilers accounted for 99% of this total, or about 296 million. This is up from
287 million in 2002. Based on estimates of litter production per 1000 pounds of
animal weight, these chickens produced approximately 415,000 tons of litter, most of
which was (~85%) was applied to nearby farms (Penn State 2010). There is a
pelletizing plant located in the region which takes in approximately 70,000 tons of
poultry litter a year for processing into organic fertilizer.
1.7 Scope of Work
This study investigated the presence and concentrations of E1, E2, E3, EE2,
progesterone, testosterone, E2-3-S, E2-17-S, and E1-S in biosolids and poultry litter
produced in the mid-Atlantic region of the U.S. The primary objective was to
compare these materials in terms of potential sources of steroid hormones to
agricultural environments. The main hypotheses were as follows:
1. More of the studied steroid hormones were expected to be found in chicken
litter, both in concentrations and in number of compounds present. This is

18
due to the less extensive processing that chicken litter is generally put through
compared to biosolids.
2. Based on preliminary investigations and on a review of current literature, E1,
progesterone, and potentially E2 were expected to be found in these materials.
Any conjugated hormones detected were expected to be in chicken litter.
To test these hypotheses and accomplish my objective, the following tasks were
performed:
1. Biosolid samples collected every 2 months over 4 years from a large WTP
servicing southern Maryland and the District of Columbia were extracted and
analyzed.
2. Chicken litter collected from 12 poultry farms on the Eastern Shore of
Maryland and Delaware was obtained, extracted, and processed.
3. To compare these materials in terms of potential environmental hormone
inputs, production and use data for both materials in the state of Maryland
were used to estimate yearly loads to this region.

19
Chapter 2: Materials and Methods
2.1 Biosolid Sample Collection and Preparation
Biosolid samples were collected every 3 months over 4 years (July 2005 to
August 2009) from a large municipal wastewater treatment plant in the mid-Atlantic
region of the U.S. The plant has a raw wastewater treatment capacity of 1.4 million
cubic meters (370 million gallons) per day. Treatment includes primary treatment,
activated sludge secondary treatment, nitrification/denitrification, effluent filtration,
chlorination/dechlorination and post aeration. Biosolids produced are a combination
of sludge from primary, activated sludge, and nitrification treatments that are
dewatered and treated with lime to approximately 15% based on dry weight to
produce a Class B product. These biosolids are supplied as soil amendments to many
mid-Atlantic farms. Samples were collected from the treatment line below the
mixers, put in amber glass jars (60- 250 ml) and stored at -20oC until processing.
Prior to extraction, three-gram aliquots of each sample were freeze-dried to
produce final weights of ~ 1 g. The fluffy, cotton-like texture of the freeze-dried
biosolids made grinding impractical and therefore samples were cut up with scissors
to reduce particle sizes.
2.2 Chicken Litter Sample Collection and Preparation
Chicken litter samples were collected at 12 broiler farms located in Maryland
and Delaware on the Delmarva Peninsula. Each house had held a minimum of four
flocks since the last complete clean-out of litter. For each house, 30 samples were

20
taken throughout the house, 12 in the brooding area and 18 in the rest of the house.
Samples were collected with bulb planters to the depth where litter removal occurs.
Once all samples were collected from the house, the litter was mixed well, spread out
thinly and squared off into 16 quadrilles. Litter (250 g) was taken from the middle of
each quadrille to compose the final sample.
Samples were dried in a forced-draft oven at 50oC and ground to pass through
a 2 mm screen. They were then refrigerated until analysis.
2.3 Standards, Reagents and Materials
The following hormone standards were obtained from Sigma-Aldrich Corp.
(St. Louis, MO, USA): E1 and E3 (VETRANAL® analytical standards), E2 (Sigma
Reference Standard), and E1-S (sodium salt). Progesterone (99.0%), testosterone
(99.5%), and EE2 (99.5%) were obtained from EQ Laboratories Inc. (Atlanta, GA,
USA). E2-3-S and E2-17-S were kindly provided by Dr. Michael Meyer at the USGS
Kansas Water Science Center (Lawrence, KS). Internal standards E1-2, 4, 16, 16-d4
(95%), E1-3-sulfate-2,4,16,16- d4 (95%), and E2-2,3,4-13C (99%) were obtained from
Sigma-Aldrich Corp. (St. Louis, MO, USA), and progesterone-3,4-13C (90%) from
Cambridge Isotope Laboratories, Inc. (Andover, MA, USA).
All solvents used were high purity pesticide grade. Ammonium hydroxide
was acquired from Fisher Scientific (Pittsburg, PA, USA). The alumina used was
neutral, 0.05-0.15 mm mesh, Brockmann Activity I obtained from Sigma-Aldrich
Corp. (St. Louis, MO, USA). Carbon free, deionized water (DI water) was produced
with a NANOpure system (Barnstead International, Dubuque, IA, USA). Sand,

21
obtained from JT Baker (Mallinckrodt Baker, Inc., Phillipsburg, NJ, USA), and all
glassware used was baked at 400ºC for 4 hours to drive off any organic materials.
2.4 Pressurized Liquid Extraction
Extraction and clean-up methods for the biosolids and poultry litter were
adapted from a method previously published by Nieto et al. (2008) and utilized an
ASE 300 accelerated solvent extraction system ((Dionex Corp. Sunnyvale, CA, USA)
and in-line alumina clean-up. The in-line clean-up step was incorporated into the
extraction method by packing 5 g of neutral aluminum oxide, baked for 24 h at
120oC, on top of two glass fiber filters that were placed in the bottom of each 33 ml
extraction cell. Sand was mixed with 1 gram of sample until the sample was evenly
dispersed and this mixture was then poured into the extraction cell on top of the
aluminum oxide plug. All internal standards were added to each sample in order to
allow for internal standard quantitation and to gauge method recoveries. Selected
samples were also spiked with non-labeled standard mixes to test method recovery.
The remaining cell volume was topped off with sand. Details of the method
development can be found in Appendix A.
Each cell was extracted twice, first with methanol and acetone (1:1) and then
followed by methanol and deionized water (1:1). Operating conditions for both
extractions were programmed into the ASE as follows: 75oC, 1500 psi, two static
cycles of 3 min, 30% flush volume, and 200 sec of nitrogen purge (preheating period
of 5 min for first cycle only). Final extract volumes were ~ 25 mL. The
methanol/acetone fractions were concentrated under nitrogen to a volume < 5 mL,

22
combined with the corresponding methanol/water fractions, and concentrated again
on a hotplate set to the lowest setting (~80 oC) until volumes reached < 5 mL.
Extracts were transferred to centrifuge tubes and diluted to 5 mL with deionized
water and then to 10 mL with methanol. The final solutions were centrifuged for 7
min at 4500 rpm and the supernatant was decanted and analyzed by LC/MS/MS.
2.5 LC/MS/MS Analysis
Separation was achieved using a Waters 2695 LC (Waters Corp., Milford,
MA) with a Waters XTerra C-18 column (5 µm MS C18 column - 150 x 2.1 mm)
heated to 50oC at a flow rate of 200 μL/min. Injection volume was 20 μL. Solvent A
was a 0.1% solution of ammonium hydroxide in water and Solvent B was a 0.1%
solution of ammonium hydroxide in acetonitrile. The ammonium hydroxide was
found to be necessary to aid in the ionization of analytes and to increase sensitivity in
negative ionization mode (see Appendix C). Both solutions were made fresh before
the start of each run. Initial conditions of 90% A:10% B were held static for 5 min,
then shifted by linear gradient to 40% A:60% B by 20 min, and 20% A:80% B by 30
min. The column was then equilibrated to initial conditions for 10 minutes before the
next run.
Tandem mass spectrometry analysis was performed using a triple-quadrupole
mass spectrometer (Quattro Ultima from Micromass Ltd., Manchester, U.K.) with an
electrospray ionization source. Negative ionization mode was used for all compounds
except testosterone and progesterone, which were analyzed in positive ionization
mode. Acquisitions were done in Multiple Reaction Monitoring (MRM) mode and

23
peak integration and quantitation were performed using MassLynx v4.0 software
(Micromass Ltd., Manchester, U.K.). The primary parent-daughter mass transitions
and the mass spectrometer settings are listed in Table 3. Isotope dilution quantitation
was used in order to account for matrix suppression of analytes. Isotope pairs used
were E2/13C-E2, E1/ E1-d4, E1-S/E1-S-d4, and progesterone/ 13C-progesterone. These
isotopes were also used as internal standards as follows: 13C-Progesterone was used to
quantitate testosterone, E1-S-d4 was used for the conjugated hormones, and 13C-E2
was used for E3 and EE2.
Compound Parent (Da)
Daughter (Da)
Retention Time (min)
Cone (V)
Collision (eV)
Dwell (Sec)
Ion Mode
E2 271.0 183.0 21.7 100 46 0.2 ES- E1 269.0 145.0 22.9 110 43 0.2 ES- E3 287.4 171.4 16.5 112 50 0.2 ES-
EE2 295.0 145.2 22.7 105 44 0.2 ES- Progesterone 315.0 108.9 26.2 65 31 0.2 ES+ Testosterone 289.0 108.9 22.4 62 31 0.2 ES+
E1-S 349.0 269.0 17.8 105 32 0.2 ES- E2-3-S 351.0 271.0 16.7 105 35 0.2 ES- E2-17-S 351.0 96.7 16.6 115 45 0.2 ES- 13C-E2 274.1 185.4 21.7 150 45 0.2 ES- E1-d4 273.0 147.0 22.9 105 38 0.2 ES-
13C-Prog 317.0 98.9 26.2 75 31 0.2 ES+ E1-S-d4
352.0 272.0 17.8 105 32 0.2 ES- Table 3. MS conditions used for the detection of hormones and conjugated hormones
2.6 Quality Control/Quality Assurance
Samples were run in groups of 5, with each sample being run in duplicate, and
each group being run with a solvent blank to test for contamination and two samples
spiked with a mixture of all free and conjugated hormones to test method recovery.
Labeled E2, E1, progesterone, and E1-S were added as internal standards to all
samples.
24
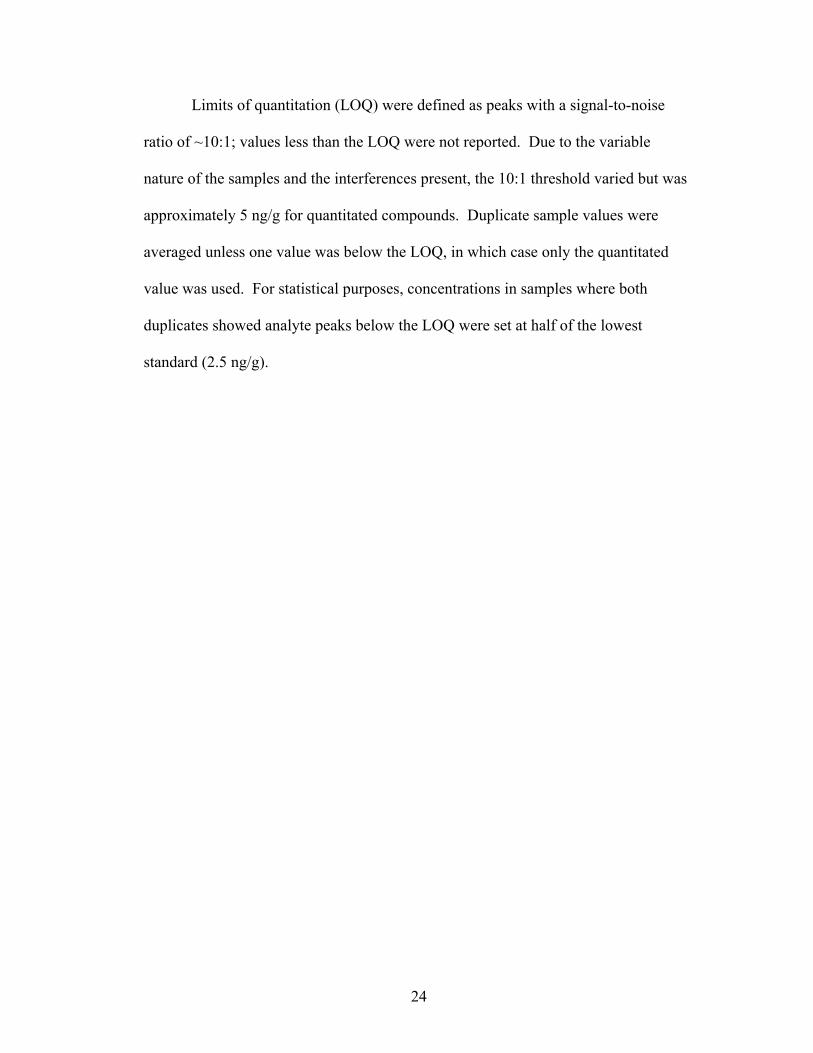
Limits of quantitation (LOQ) were defined as peaks with a signal-to-noise
ratio of ~10:1; values less than the LOQ were not reported. Due to the variable
nature of the samples and the interferences present, the 10:1 threshold varied but was
approximately 5 ng/g for quantitated compounds. Duplicate sample values were
averaged unless one value was below the LOQ, in which case only the quantitated
value was used. For statistical purposes, concentrations in samples where both
duplicates showed analyte peaks below the LOQ were set at half of the lowest
standard (2.5 ng/g).

25
Chapter 3: Results and Discussion
3.1 Results
3.1.1 Method Performance
Average recoveries for the studied hormones in spiked samples using the
isotope dilution internal standard method are given in Table 4. Average recoveries of
the internal standards are also shown.
Overall, this technique worked well to
overcome matrix suppression in samples and
losses during extraction and clean-up. In a
few cases, namely testosterone and E2-17-S
in biosolids, average recoveries indicate a
tendency for the isotope used to overcorrect
the concentrations. However, these
compounds were not detected above the
LOQ and therefore not quantitated in the samples so this issue was not investigated
further. Isotope dilution was especially useful considering the highly variable nature
of the samples, especially biosolids, which contain any number of interfering organic
compounds that can vary the matrix even between duplicates of the same sample
(matrix interferences are often a problem with MS electrospray analysis, see
Appendix C). Using isotopes allowed for correction of response due to this
variability and overall improved precision. Relative percent differences (RPDs) for
duplicate samples are given in Appendix B along with concentration data.
Matrix Hormone Biosolids Chicken Litter
E2 90 108 E1 103 109 E3 99 103
EE2 87 103 Progesterone 85 88 Testosterone 139 78
E1-S 101 111 E2-3-S 98 104
E2-17-S 154 112
13C-E2 84 82 E1-d4
62 87 13C-Prog 44 43 E1-S-d4
29 60 Table 4. Recoveries (%) of steroid hormones, conjugated hormones, and internal standards

26
The poultry litter matrix was much cleaner and easier to work with than were
the biosolids, as shown by the lower RPDs for these samples. This allowed for
greater precision in the concentrations obtained. Nearly all RPDs for poultry litter
samples were between 2% and 31%, with two outliers at 41% and 68%. Biosolid
samples, on the other hand, were less consistent, with RPD values stretching into the
70% range and two values over 100%. These two extreme cases were both close to
the LOQ. As would be expected, samples with concentrations closer to the LOQ
showed less precision and therefore higher RPD values. Sample chromatograms
illustrating differences in the two matrices are shown in Appendix C.
In addition to isotope dilution quantitation, dilution of sample extracts also
aided in overcoming matrix effects. With the concentrations of background organic
material lowered, peaks were better resolved and occasionally bigger than the more
concentrated sample due to the decrease in matrix suppression. An example of this
effect is show in Appendix C. Therefore, sample extracts were concentrated from 25
ml to 10 ml in order to make peaks easier to quantitate, but left this dilute to avoid
some of the matrix effects seen with more concentrated extracts.
3.1.2 Biosolids Analysis
Figure 2 shows concentrations of hormones found in limed biosolids over the
four years of collection. Progesterone and E1 were found in all samples, although not
always above the LOQ. Traces of estriol and testosterone were seen in some samples,
but not above the LOQ. Neither E2, EE2, nor any of the conjugated hormones were
detected.

27
Figure 2. Concentrations of estrone and progesterone in biosolids over 4 years. Error bars = Standard Error of Mean (SEM). No error bar indicates one value below LOQ, only one value used for the graph.
A change in the
concentration pattern is clearly
seen in progesterone values in
late 2007, while the shift in E1
is much more subtle. These
differing trends are illustrated in
Figure 3. Progesterone values
show minimal fluctuation until
August 2007, with an average
concentration of 8.52 ng/g.
After this point, values increase
Figure 3. Trends in estrone and progesterone values over 4 years. Note the difference in scales used. R2 for E1 regression is 0.83
7/1/05 1/1/06 7/1/06 1/1/07 7/1/07 1/1/08 7/1/08 1/1/09 7/1/09
ng/g
dry
wei
ght
50
150
250
350
0
100
200
300
400
ProgesteroneEstrone
ng/g
dry
wei
ght
0
5
10
15
20
25
1/1/05 7/1/05 1/1/06 7/1/06 1/1/07 7/1/07 1/1/08 7/1/08 1/1/09 7/1/09 1/1/10
ng/g
dry
wei
ght
0
50
100
150
200
250
300Progesterone
Estrone

28
sharply and fluctuate widely, with an average concentration of 157 ng/g. Values of
estrone are overall much lower, with an average over four years of 8.53 ng/g. Instead
of an abrupt shift in 2007, the concentrations instead show a slightly increasing trend
over the four years of sampling.
3.1.3 Chicken Litter Analysis
Figure 4 shows concentrations of hormones found in chicken litter samples.
Progesterone and E1 were again found in all samples and above the LOQ in all but
the progesterone and E1-S peaks for Farm 107. These extracts showed an unusually
large amount of matrix interference compared to other chicken litter samples, and this
likely affected the quantitation of those peaks. The average concentrations for
progesterone and E1 were 63.4 ng/g and 44.1 ng/g, respectively. These samples also
contained E1-S, with an average concentration of 19.2 ng/g. Traces of E3 and
testosterone were again seen in some samples, but all below the LOQ. No E2 was
seen. EE2 was also not seen, however this would not be expected in these samples,
as chickens should not be exposed to this synthetic hormone.

29
Farm IDs
96 98 100 101 104 102 103 105 106 107 108 109
ng/g
dry
wei
ght
0
20
40
60
80
100
120
140
160
180
Progesterone Estrone Estrone-3-Sulfate
Figure 4. Concentrations of steroid hormones in chicken litter. Error bars = SEM. No error bar (Farm 107) indicates peaks seen below LOQ. Nominal bar shown for this farm at half the lowest standard, 2.5 ng/g.
3.2 Discussion
3.2.1 Biosolids Analysis
Biosolids are a very heterogeneous material; among the factors that can cause
variation in the compounds found are the sources of wastewater feeding the WTP, the
attributes of the population that the plant serves, and the processes the plant uses for
treatment of biosolids. When comparing the hormone levels detected in this study to
those found in previous studies, the potential for inherent variability in the studied
material needs to be taken into account. Of the studies listed in Table 1, only the
TNSSS is known to contain treatment plants which produce limed biosolids, however

30
the number of plants employing this method and the hormone levels associated with
their biosolids are not disclosed.
With these considerations in mind, the concentrations detected here generally
agree well with those found in other studies. The E1 concentrations I quantitated,
ranging from 2.73-21.7 ng/g, fall in the same range (2-27.8 ng/g) as those reported in
digested and dewatered biosolids (Andersen et al. 2003, Ternes et al. 2002, Muller et
al. 2008). The non-detectable levels of E3 in limed biosolids were also in agreement
with these results (Muller e al. 2008, Andersen et al. 2003). On the other hand, E2
was detected in all of these previous studies, but not in the samples analyzed here.
This could partly be a result of detection limits. Many of the reported values are
between 1 and 10 ng/g, which is below or at the limit of sensitivity in this analysis.
While method detection limits were not formally tested in this study, it was frequently
difficult to get a clean peak for this compound in the standard equivalent to 50 ng/g
dry weight in a sample. Another possibility could be that liming biosolids more
effectively eliminates E2 in comparison to digestion or dewatering. None of these
compounds were detected in biosolids which were treated by dewatering and
transferring to drying beds, with reporting limits at 5 ng/g for E1 and E2, and 3 ng/g
for E3 (Pothitou and Voutsa 2008). This agrees with the results of my study for E2
and E3, but indicates a more effective removal of E1. In contrast is the study by
Nieto et al. (2008), which also did not detect E2, but found E1 at levels up to 200
ng/g and E3 as high as 406 ng/g. They do not specify how this sludge was treated.
Combined, these results illustrate the variability in the levels of these hormones that
can be found in biosolids following different treatments.

31
The TNSSS is a broader survey of many types of WTPs, making the data
useful for comparing the frequency with which various hormones are found in sludge
in addition to comparing the levels reported (USEPA 2009). The findings of my
study indicate that E1 is the most consistently detected estrogen in biosolids. This is
supported by a higher frequency of detection in the TNSSS (71%) for E1 than for any
of the other hormones (USEPA 2009). The levels reported in the TNSSS are higher
than those reported in my study, but this could again be partly due to a higher
reporting limit (21 ng/g), which would exclude samples with the concentrations found
here (USEPA 2009). The TNSSS also provides the only data on progesterone and
testosterone to compare with the results reported here for those compounds. The
average progesterone concentration of 157 ng/g for the second two sampling years
puts the concentration within the lower range of the TNSSS, but their reporting limits
for this compound are above all of the levels detected for the first two years.
Testosterone was detected in the TNSSS, although only in 20% of samples (USEPA
2009).
Characteristics of the populations served by the WTP are more likely to affect
the concentrations of EE2 found in biosolids than those found for the other
compounds. Whereas the others are naturally occurring and always being excreted,
EE2 is a pharmaceutical and its rate of detection will be affected by how frequently it
is used. The fact that no EE2 was seen in the limed biosolids is consistent with the
results of the TNSSS, which did not detect the compound in any of their samples, all
of which were collected in the U.S. like the ones in my study (USEPA 2009). EE2
was also not detected in two of the four European studies (Andersen et al. 2003, Nieto

32
et al. 2008). As these results are not consistent among plants with similar treatment
processes, they could instead correlate with the frequency of usage in the various
locations served by the treatment plants studied.
Non-detectable levels of conjugated hormones was an expected result as the
biosolids are highly processed and exposed to harsh conditions of high pH and high
temperature prior to our sampling point. These findings are in agreement with those
of Muller et al. (2008). Nieto et al. (2008) did find conjugated hormones up to 7 ng/g
but they do not specify what prior treatment the sludge had gone through. Again,
differing processes may allow for some sulfates to persist.
The advantage to this study compared to the others discussed is that samples
were collected over a period of years and therefore provides both more samples (from
one WTP) and also a broader picture of what is occurring in the WTP in terms of
concentrations of steroid hormones in the biosolids. This analysis over time brought
up the question of what occurred in 2007 to raise the values of progesterone so
abruptly and cause the larger variation in the levels. One possibility was that
refinements made in the way the extraction and analytical method was performed
over the course of the study caused the results to appear different due to variable
recoveries. To test this, one sample from each year was randomly chosen to be re-run
from the beginning of the method (including a duplicate of each). Another sample
(5-20-09) was repeated because a large discrepancy was seen between the two
duplicates of the first run. When these extractions were complete, all originals and
duplicates were run together and the results were compared. This comparison is
shown in Table 5. Both calculated RPDs for the random duplicated samples are

33
<50%, which is generally considered acceptable given the inherent variability in
biosolid samples (USEPA 2009). The RPD for the duplicated run of the 5-20-09
sample is 14% higher than the 50% value, which is not completely unreasonable and
more importantly, stayed within the trend seen in the data. Based on these results, I
concluded that method variations could not account for the abrupt shift or the high
variability seen in the progesterone concentrations after August 2007. For
consistency, these same analyses were performed for E1, with similar results to those
observed for progesterone (RPD values ranged from 6 to 54%).
Concentration (ng/g dry wt) Sample Date First Extraction Second Extraction RPD
5-25-06 <LOQ <LOQ ND
1-29-07 <LOQ <LOQ ND
8-6-08 205 146 33
8-28-09 49.8 35.3 34
5-20-09 338 175 64 Table 5. Averages and Relative Percent Difference (RPD) from two extraction runs of the same sample (n=2). ND = Not Determined With the method eliminated as the cause of the sudden shift in levels of
progesterone, the most likely cause for this increase in concentrations was a change in
the treatment process at the studied WTP. After consultation with staff at the plant, I
learned that around the time when the shift occurred, the plant changed its supply of
lime from one with a fine texture to one with a courser texture. A previous study at
this plant had shown that while no pH changes occur in biosolids based on lime
texture, coarser lime resulted in an increase in the levels of E. coli detected (North et
al. 2008). The authors of that study believed that the coarser lime may have left
larger pockets of biosolids between lime particles where the pH did not get quite as

34
high and therefore more bacteria were able to survive (North et al 2008). While this
is not a direct comparison, I suspect that lime texture has an effect on the
progesterone concentrations as well and perhaps to a lesser extent, on the E1
concentrations. A supplementary experiment was performed to test this hypothesis
and the results indicated that amending sludge with coarser lime vs. finer lime
resulted in concentrations of both hormones that mirrored the differences seen in
samples from pre-2007 and post-2007. However, the reasons behind this are still
uncertain. See Appendix D for a more detailed description of these findings.
3.2.2 Chicken Litter Analysis
This analysis of broiler litter showed very different results compared to
previous studies. My findings did not indicate the presence of E2 or testosterone, the
main compounds reported in chicken litter to date. Much of the difference is likely
due to differences in detection methodologies. Whereas other studies used bioassays
that quantify overall biological responses to hormonally active compounds present in
the material, I used LC/MS/MS which allowed specific hormones to be identified.
Average concentrations for E1 (44.1 ng/g) and for E1-S (19.2 ng/g), or both
combined, fall within the range of values reported previously for E2 in broiler litter.
It is possible, and even likely, that at least a part of the biological activity these
reported values represent can be attributed to the presence of E1. Shore et al. (1993)
acknowledged this in his reported concentrations by ascribing them to the
concentration of “estrogen,” a combination of E2 and E1. Similarly, the lack of
testosterone in my samples could be an indication that there are other active
androgenic compounds in the litter which contribute to the testosterone response.

35
Analysis was performed for three possible conjugated hormones and found
that E1-S was present in the chicken litter samples at concentrations as high as 35.4
ng/g. This compound could contribute to the total estrogenicity of the chicken litter if
conditions favor deconjugation. These results support the findings of Yonkos (2005)
that approximately half of the E2 response came from conjugated forms of estrogens,
especially as many other conjugation possibilities exist other than those studied here.
Variability was seen in measured concentrations of hormones in chicken litter,
but no distinct trends were apparent. Factors potentially contributing to variability
include the number of flocks that have been in the house since the last complete
clean-out, the age of the current flock, the type of chickens raised, and litter treatment
or prolonged storage of litter. Of these factors, data was available for the age of the
current flock and the number of flocks raised in the houses since the last clean-out.
When the samples were divided based on the current flock age, no significant
difference could be seen between houses with flocks <10 days old (n=4) and those
with flocks >25 days old (n=6). All houses but two had the same number of flocks in
them since the last clean-out, making that comparison less meaningful. Samples were
chosen based on location in the studied region and not for any particular features, so
only a limited analysis of this type is possible. See Appendix B for complete data.
3.2.3 Comparison of Environmental Inputs by Biosolids and Poultry Litter
In order to give some perspective on environmental inputs, average hormone
concentrations were used to estimate the annual load by both chicken litter and
biosolids in the state of Maryland. This state was chosen both because it is the region
from which the samples were obtained and because the large population density and

36
large poultry farm density, especially on the Eastern Shore, make the issue
particularly relevant.
Based on reported yearly land application data for biosolids and estimated
production and application of poultry litter (See Section 1.6), potential yearly loads
were calculated (See Appendix E for more details on the calculations). These values
are reported in Table 6. For this analysis, the average biosolid concentrations over
the last two years were used.
Hormone Inputs (kg/yr)
Source Progesterone Estrone Estrone Sulfate
Biosolids (2 yr avg) 8.0 1.9 ND
Chicken Litter 16 11 5.0 Table 6. Estimated yearly inputs of steroid hormones from biosolids and chicken litter. ND = Not detected Chicken litter has a higher potential to be a source of steroid hormones when
applied to land. A graph of relative inputs is shown in Figure 5. This estimate is
reasonable considering the more extensive processing that takes place in a WTP and
the smaller total dry weight of biosolids that are land applied. However, the
distribution is a statewide average; the actual ratio of inputs by biosolids to inputs by
chicken litter will vary by location. The majority of poultry farming takes places on
Maryland’s Eastern Shore, and due to high costs of shipping, most of the litter is
applied to the farm where it was produced or very nearby. This makes inputs from
chicken litter much more likely in that area compared to farms elsewhere in the state
that are more likely to receive biosolids.

37
The fate of steroid hormones after land application depends on the rate and
pathways of degradation as well as processes such as diffusion into soil and leaching
or runoff into water bodies after rain events. An estimate of the initial Predicted
Environmental Concentration (PECini) in soil was calculated for progesterone, E1,
and E1-S using Equation 1 (Jackson and Eduljee 1994).
CFSDARC
CPECz
yamendmentsoilini ××
×+= )0( (1)
Csoil(0) is the background concentration of the specific hormone in soil,
Camendment is the mean concentration of the hormone in chicken litter or biosolids
(average of the last two years), ARy is the application rate of the soil amendment, D is
the soil density (1.4 x 10⁻³ kg/cm3), Sz is soil depth (taken to be 10 cm), and CF is the
Progesterone
Estrone
E1-S
Chicken Litter
Biosolids
39%
19%
4%
12%
26%
Figure 5. Relative environmental inputs of steroid hormones from biosolids and chicken litter. Red/Maroon = Progesterone, Blue = Estrone, Yellow = E1-S

38
conversion factor (1x108 cm2/ha). For these calculations, the average concentrations
determined for each hormone were converted into wet weight based on 70% moisture
in biosolids and 20% moisture in chicken litter. Given the very limited data on
hormone concentrations in soil, Csoil(0) was assumed to be 0 for these compounds.
This is in agreement with the findings of Beck et al. (2008) that no estrogens were
detected in soils with no history of manure amendment. An average for ARy of 9200
kg/ha was determined from the total amount of biosolids applied in Maryland 2008
(188,220 tons) and the number of acres (46,000) that received biosolid application in
2008 (see section 1.6) (MDE 2009a, MDE 2009b). As the nitrogen content of
chicken litter is approximately the same as that of biosolids, the same application rate
was used. This amendment rate is in agreement with other studies involving chicken
litter or biosolids application to agricultrual land in this region (Jenkins et al. 2008,
Jenkins et al. 2009, Lozano et al. 2010).
The values for PECini of each hormone after land application of biosolids or
chicken litter are given in Table 7. How quickly these hormones dissipate after
application, how much will remain in the soil, and how much will end up in ground or
surface water will depend on the processes listed above. Degradation pathways and
rates are especially important for compounds like E1-S, which will degrade to form
an active hormone whereas the parent was inactive. When poultry litter is applied, E1
concentrations could increase nearly 50% as E1-S is deconjugated.
PECini (ng/kg) Source Progesterone Estrone Estrone Sulfate
Biosolids (2 yr avg) 310 21 ND Chicken Litter 340 230 100 Table 7. Initial Predicted Environmental Concentrations (PECini) of steroid hormones in soil after amendment with biosolids or chicken litter.

39
Chapter 4: Conclusions
This study presents a profile and comparison of steroid hormones seen in
biosolids and chicken litter, two materials which are both applied to agricultural land.
Results show frequent detection of progesterone and E1 in both materials and E1-S
also detected in chicken litter. Concentrations of E1 are higher in chicken litter while
progesterone concentrations are higher in biosolids; however levels of progesterone
are higher than E1 in both materials.
In terms of biosolids data, this study is unique in that it documents levels of
hormones over a period of years, allowing for investigation of concentration trends
and also a larger number of samples. Additionally, progesterone and testosterone,
compounds for which little data is available, were included in the analysis. This
proved to be especially important, and progesterone was one of two compounds
detected in the majority of samples and the one present at the higher concentrations.
While potential effects of steroid estrogens are well documented, little is known about
progesterone, its potential for transport, its fate, or its possible effects when released
into the environment at high concentrations. These results indicate that more work is
needed in this area.
The concentrations of steroid hormones in the biosolids agree well with other
studies considering the variations that are possible due to the variety of treatments
available for sludge. The treatment process will have an effect on hormone levels, as
was seen here in the change in concentration and variability in progesterone levels
(and to a lesser extent, E1) that occurred with the switch to a coarser lime. The
mechanism of the effect caused by the grain size of the lime is not well understood.

40
Future work should include a more detailed study of how liming affects these
hormones, and if this effect is seen in other compounds as well (See Appendix D for
more details). Continued work on biosolids from all types of treatment will aid in the
understanding of these compounds and how processing affects their concentrations.
More studies involving larger sample sets would be especially useful considering the
very heterogeneous nature of biosolids.
Levels of steroid hormones in chicken litter are even less well documented.
While bioassay techniques provide a general measure of estrogenic or androgenic
activity in the litter, this study contributes more concrete analytical measurements of
the concentrations of steroid hormones present. Results indicate that E1 is the
primary estrogen seen, and that conjugated estrogens are present as well. Three
conjugated forms were included here. While E1-S was the only one detected, there
other combinations possible that were not studied and may be present. For instance,
while glucuronated hormones are less stable, there is a chance they will exist in litter
as it is less extensively processed than sludge. These conjugated compounds have the
potential to contribute to the overall estrogenicity of the litter as conditions allow for
deconjugation and reformation of the active hormone.
Progesterone was also present at high levels in the chicken litter. Until now,
very little work has been done with this compound and almost no data on levels in
chicken litter are available. Its consistent presence in these samples suggest that more
work be done in this area both on concentrations present in the litter and also on
potential effects when released into the environment in this way. On the other hand,
testosterone was only detected at trace levels in a few samples. This is in contrast to

41
other studies on this topic, all of which report some level of this hormone. As these
studies used non-specific bioassay techniques, this could indicate the presence of
other androgenic compounds in the litter capable of producing a biological response.
There are other androgens and testosterone metabolites which are potentially present
and future analytical work should investigate these possibilities. Overall, much more
analytical work is needed in this area to better understand which hormones or
hormonally active compounds are present in chicken litter and at what concentrations.
As with biosolids, treatment of chicken litter can effect hormone
concentrations. Levels of hormones in the chicken litter varied, especially
progesterone concentrations. However, a detailed analysis of possible reasons for
variability was beyond the scope of this study. Future work on litter from houses
chosen based on variations in flock characteristics and litter treatment and storage
could improve understanding of the way these differences affect the concentrations of
hormones in chicken litter.
The next step in understanding the potential impacts of steroid hormones
released into the environment with biosolid or poultry litter land application is to
study the processes that will affect their distribution and fate. Very few studies have
investigated hormone levels in soils amended with these materials or what effects
these concentrations may have on soil organisms (Finlay-Moore et al. 2000, Jenkins
et al. 2006, Beck 2008, Jenkins et al 2008). Considering the PECini calculated for
progesterone, E1, and E1-S, more investigations of this type are warranted.
Similarly, while concentrations of hormones in runoff from biosolid- or poultry litter-
amended fields have been investigated, these studies were done with bioassay

42
techniques (Nichols et al. 1997, Busheé et al. 1998, Nichols et al. 1998, Finlay-Moore
et al. 2000, Yonkos 2005, Jenkins et al. 2006, Jenkins et al. 2008, Jenkins et al. 2009).
This work should be expanded to include analytical measurement of the various
estrogens and other hormones.
Application of biosolids and poultry litter to agricultural land is both
necessary and beneficial. While there are risks associated with compounds such as
steroid hormones present in these materials, a greater understanding of the magnitude
of these risks and ways they may be mitigated can make recycling of these waste
materials a truly sustainable practice.

43
Appendix A: Method Development
The first method tried was an adaptation of a method developed by Burkhardt
et al. (2008), which also used ASE extraction, followed by SPE (solid phase
extraction) with Oasis®HLB cartridges (Waters Corporation, Milford, MA, USA) and
Florisil. However, after the conjugated hormones were added to the analyte list, I
found that I was unable to achieve adequate recoveries of these compounds with that
method. Trials were carried out with the method by Nieto et al. (2008), which also
included conjugated hormones, and sufficient improvements were seen in the results
to continue with this method for the analysis of biosolid and chicken litter samples.
In addition to improvements in detection of the conjugated hormones, there was also
an improvement in the recovery of the 13C-E2 internal standard (42% vs. 84%
reported in this study).
The original method described by Nieto et al. (2008) called for freeze-dried
biosolids to be mixed with the alumina as both a dispersant and clean-up material and
packed in an 11 ml extraction cell. The cells used in this experiment were 33 ml, and
therefore some adaptation was needed. To optimize the amount of alumina used, six
replicates of both a chicken litter sample and a biosolid sample were run through the
method using different amounts of alumina. Two samples were run using 5 g, 2 with
10 g, and 2 with 15 g. As there is extra space in the 33 ml cell compared to the 11 ml
cell originally specified, the alumina was packed on the bottom of the cell and sand
was used as the dispersant in order to optimize the contact time of the sample extract

44
with the alumina. Each sample was spiked with standards of all hormones studied.
Recoveries of each standard are shown in Table A1.
Table A 1. Recoveries (%) of standards after extraction and clean-up with three different amounts of alumina Sample E2 E1 E3 EE2 P T E1-S E2-3-S E2-17-SBiosolids
5 g 117 59 120 62 107 117 65 54 8 10 g 105 81 118 75 98 113 41 30 0 15 g 98 72 109 68 79 136 4 3 2
Litter 5 g 98 82 124 78 104 117 66 66 61
10 g 154 94 133 86 96 113 60 56 25 15 g 112 94 95 74 102 136 40 29 6
Free hormones show similar recoveries in all extracts. The recoveries of the
conjugated hormones, however, dropped off when run through increasing amounts of
alumina. This was especially true in the biosolid samples. As there was not a large
decrease in the matrix interferences seen as more alumina was added, 5 grams was
used in order to maximize recoveries of the conjugated hormones.

45
Appendix B: Sample Data
Table A 2. Concentrations of progesterone and estrone detected in each biosolid sample based on dry weight. Averages are reported when both duplicates were quantitated, otherwise the value is the concentration in the quantitated sample or labeled as <LOQ if neither were quantitated. RPD= Relative Percent Difference, lbs = limed biosolids, ND= Not Determined.
Progesterone Estrone Sample ng/g Averages RPD ng/g Averages RPD
lbs 8-28-09 87.7 94.6 15 18.0 15.1 38 lbs 8-28-09 dup 102 12.2
lbs 5-20-09 629 470 67 11.7 11.0 12 lbs 5-20-09 dup 312 10.3
lbs2-26-09 224 280 40 <LOQ 12.0 ND lbs2-26-09 dup 336 12.0
lbs 12-16-08 57.1 60.5 11 3.46 8.61 120 lbs 12-16-08 dup 63.9 13.8
lbs 10-30-08 178 187 10 7.05 11.1 73 lbs 10-30-08 dup 196 15.1
lbs 8-6-08 268 233 30 10.0 8.18 44 lbs 8-6-08 dup 197 6.36
lbs 6-5-08 62.0 54.0 30 3.91 6.33 76 lbs 6-5-08 dup 46.0 8.75
lbs 3-13-08 257 206 50 29.8 21.7 74 lbs 3-13-08 dup 154 13.7
lbs 12-3-07 23.3 36.5 73 12.5 13.4 14 lbs 12-3-07 dup 49.8 14.4
lbs 10-2-07 82.9 102 37 7.97 7.97 ND lbs 10-2-07 dup 121 <LOQ
lbs 8-10-07 6.24 6.24 ND <LOQ <LOQ ND lbs 8-10-07 dup <LOQ <LOQ
lbs 5-30-07 7.53 7.95 11 13.1 16.8 44 lbs 5-30-07 dup 8.38 20.5
lbs 3-30-07 9.74 15.9 78 <LOQ 6.27 ND lbs 3-30-07 dup 22.1 6.27
lbs 1-29-07 <LOQ <LOQ ND <LOQ 2.73 ND lbs 1-29-07 dup <LOQ 2.73
lbs 11-28-06 <LOQ <LOQ ND 3.96 4.71 32 lbs 11-28-06 dup <LOQ 5.45
lbs 9-28-06 <LOQ <LOQ ND 7.60 7.60 ND lbs 9-28-06 dup <LOQ <LOQ
lbs 7-25-06 <LOQ <LOQ ND <LOQ 8.86 ND lbs 7-25-06 dup <LOQ 8.86
lbs 5-25-06 0.95 4.96 162 2.91 3.03 8 lbs 5-25-06 dup 8.98 3.15
lbs 3-6-06 12.7 12.7 ND 5.11 5.11 ND lbs 3-6-06 dup <LOQ <LOQ
lbs 1-5-06 2.90 2.90 ND <LOQ <LOQ ND lbs 1-5-06 dup <LOQ <LOQ
lbs 9-19-05 40.7 39.1 8 6.38 8.83 56 lbs 9-19-05 dup 37.4 11.3
lbs 7-20-05 <LOQ <LOQ ND 2.50 3.41 53 lbs 7-20-05 dup <LOQ 4.32

46
Table A 3. Concentrations of progesterone, estrone, and estrone sulfate in poultry litter samples based on dry weight. <LOQ = peaks below the limit of quantitation.
Progesterone Estrone Estrone Sulfate Sample ng/g Averages RPD ng/g Averages RPD ng/g Averages RPD
96 37.9 35.1 16 55.1 58.2 11 16.4 18.5 22 96 dup 32.4 61.4 20.5
98 121 114 12 36.6 35.2 8 37.2 32.9 26 98 dup 108 33.8 28.5
100 54.9 47.8 30 46.8 45.1 8 35.3 33.9 8 100 dup 40.7 43.4 32.6
101 90.7 79.5 28 48.4 46.8 7 19.1 22.1 27 101 dup 68.2 45.3 25.1
104 51.5 54.9 12 39.4 40.4 5 33.8 30.1 25 104 dup 58.3 41.3 26.4
102 53.7 51.7 8 47.4 51.6 16 20.0 18.8 13 102 dup 49.6 55.8 17.5
103 165 167 3 28.0 33.0 30 35.0 35.4 2 103 dup 169 37.9 35.7
105 50.9 45.9 22 34.4 39.4 26 7.31 6.46 26 105 dup 41.0 44.5 5.61
106 78.5 65.1 41 52.3 55.7 12 20.4 18.1 26 106 dup 51.6 59.1 15.7
107 <LOQ <LOQ ND 34.2 39.1 25 <LOQ <LOQ ND 107 dup <LOQ 44.0 <LOQ
108 50.7 57.1 22 36.2 33.8 14 5.64 5.01 25 108 dup 63.4 31.4 4.38
109 45.9 42.6 16 68.3 51.0 68 7.98 6.92 31 109 dup 39.2 33.7 5.86
Table A 4. Chicken litter samples separated by age of flocks at the time of sampling. T-tests on averages showed no significant differences. For statistical purposes, values <LOQ were estimated at half the concentration of the lowest standard, or 2.5 ng/g. Empty houses were not considered as the time since the last flock was unknown.
Concentration (ng/g dry wt) Concentration (ng/g dry wt) Flock age Progesterone Estrone E1-S Progesterone Estrone E1-S <10 days Empty house
101 79.5 46.8 22.1 103 167 33.0 35.4 102 51.7 51.6 18.8 104 54.9 40.4 30.1 105 45.9 39.4 6.5 Average 111 36.7 32.7 107 16.7 39.1 2.7
Average 48.4 44.2 12.5 >25 days
96 35.1 58.2 18.5 98 114 35.2 32.9
100 47.8 45.1 33.9 106 65.1 55.7 18.1 108 57.1 33.8 5.0 109 42.6 51.0 6.9
Average 60.3 46.5 19.2

47
Appendix C : Chromatogram Comparisons
Figure A 1. Chromatograms of two hormone standards in the same solution run with and without ammonium hydroxide addition 1ppm mix w ammonia
Time5.00 10.00 15.00 20.00 25.00
%
1
5.00 10.00 15.00 20.00 25.00
%
75
5.00 10.00 15.00 20.00 25.00
%
0
5.00 10.00 15.00 20.00 25.00
%
44
ammon120808a6 1: MRM of 8 Channels ES- 274 > 185.2
5.68e322.15
8.612.460.337.235.974.22
19.9018.8916.1311.629.23 14.00
28.8027.6726.2924.66 29.31
ammon120808a6 1: MRM of 8 Channels ES- 269 > 145
6.94e623.03
ammon120808a2 1: MRM of 8 Channels ES- 274 > 185.2
3.18e328.55
25.7923.28
21.4011.111.33 2.46
3.09 8.354.72 5.477.98
9.36
17.3914.8813.12
11.87 14.0016.13
21.0318.64
19.7722.28
25.04
23.53 29.68
ammon120808a2 1: MRM of 8 Channels ES- 269 > 145
2.78e523.03
13C-E2 with ammonium hydroxide addition
E1 with ammonium hydroxide addition
13C-E2 without ammonium hydroxide. No peak present
E1 without ammonium hydroxide. Peak is still clean but shows 10x less sensitivity
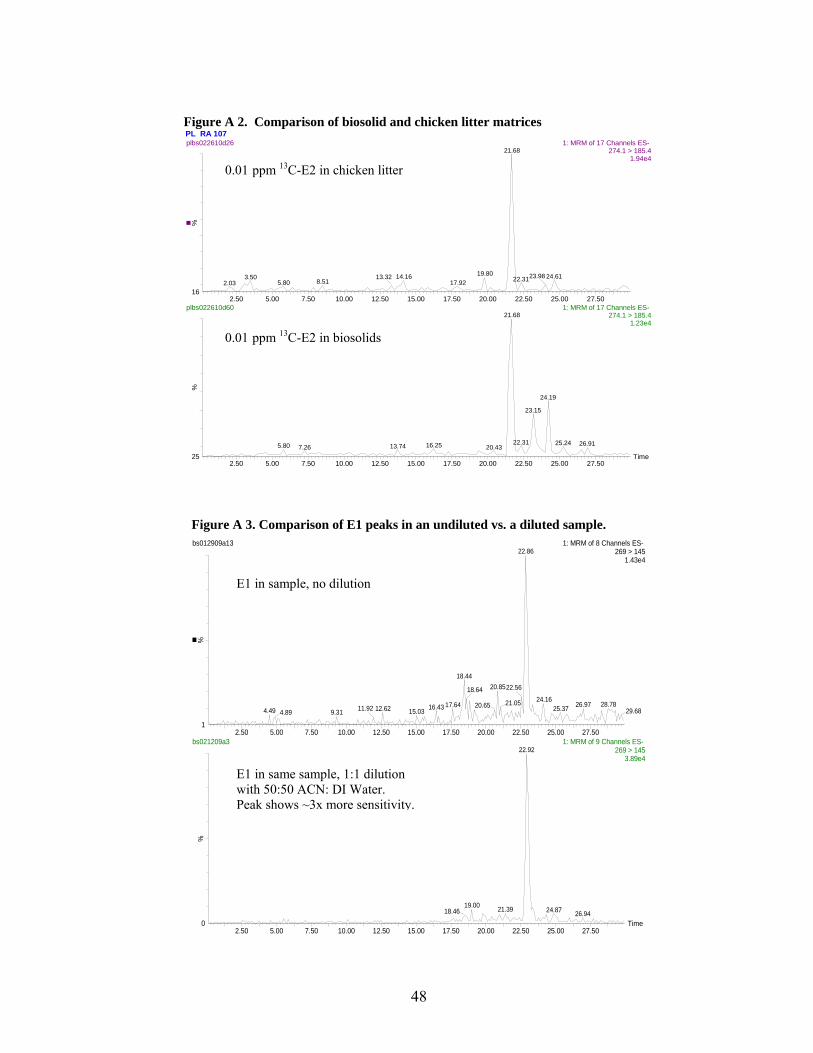
48
Figure A 2. Comparison of biosolid and chicken litter matrices
PL RA 107
Time2.50 5.00 7.50 10.00 12.50 15.00 17.50 20.00 22.50 25.00 27.50
%
25
2.50 5.00 7.50 10.00 12.50 15.00 17.50 20.00 22.50 25.00 27.50
%
16
plbs022610d26 1: MRM of 17 Channels ES- 274.1 > 185.4
1.94e421.68
19.8014.163.502.03 8.515.80
13.3217.92
24.6122.3123.98
plbs022610d60 1: MRM of 17 Channels ES- 274.1 > 185.4
1.23e421.68
16.255.80 13.747.26 20.43
24.19
23.15
22.31 25.24 26.91
lbs 3-30-07
Time2.50 5.00 7.50 10.00 12.50 15.00 17.50 20.00 22.50 25.00 27.50
%
0
2.50 5.00 7.50 10.00 12.50 15.00 17.50 20.00 22.50 25.00 27.50
%
1
bs012909a13 1: MRM of 8 Channels ES- 269 > 145
1.43e422.86
18.44
17.6416.4312.624.49 9.314.89 11.92 15.03
20.8518.64
20.65
22.56
21.05 24.1628.7826.9725.37 29.68
bs021209a3 1: MRM of 9 Channels ES- 269 > 145
3.89e422.92
19.0018.46 21.39 24.87 26.94
E1 in same sample, 1:1 dilution with 50:50 ACN: DI Water. Peak shows ~3x more sensitivity.
E1 in sample, no dilution
0.01 ppm 13C-E2 in chicken litter
0.01 ppm 13C-E2 in biosolids
Figure A 3. Comparison of E1 peaks in an undiluted vs. a diluted sample.
49
Appendix D: Lime Experiment
In order to test the hypothesis that a change to coarser lime resulted in the
increase of progesterone values observed, an experiment was run in which unlimed
sludge was collected and then mixed with either coarse or fine lime. These samples
were then extracted and analyzed according to the experimental method described.
The method for this experiment was as follows. Lime was obtained from a
standard daily shipment received by the studied WTP. In the previous study on lime
incorporation conducted at this plant (North et al. 2008), lime was made finer by
grinding, after which all lime could pass through 2 mm mesh. As equipment for
grinding was not readily available for this study, it was decided that the finer lime
would consist of all lime that passed through a 2 mm sieve. The coarser lime was a
sample taken as it was received. To sieve, approximately 160 grams of lime was
poured onto a series of sieves, ranging from 0.15 mm to 6.35 mm, stacked on a shaker
and shaken for 2 minutes. All lime passed through 6.35 mm mesh, and
approximately 46% was retained on the 2 mm sieve. Of the finer fraction, 98% was
between 0.15 mm and 1.4 mm.
An unlimed sample of sludge was collected from the line after the centrifuges
and before the lime mixers. It was divided into 4 aliquots of 100 g. Two of these
samples were amended with coarser lime and two were amended with finer lime, all a
rate of 15% by dry weight of sludge. All samples were mixed in a KitchenAid stand
mixer for 40 seconds (the time estimated that sludge and lime are mixed before the
limed biosolid collection point). Samples of each mixture were collected and run

50
through the procedure described previously. All samples were run in duplicate along
with a spike and a blank.
The results of the analysis are shown in Figure A4. The pattern seen in the
original sample analysis was
mirrored in these results,
with coarser lime resulting
in significantly higher levels
of progesterone than finer
lime. The smaller but still
noticeable difference
between levels of E1 in
biosolids after amendment
with the coarse vs. fine lime
also indicated a strong trend
(p<0.1).
However, these
results are complicated by
the hormone levels seen in
the unlimed biosolid
samples analyzed. In both cases, amendment with coarse lime resulted in an increase
in the hormone level. The difference in progesterone is significant, and the difference
in E1 indicates a trend. The reason behind this increase is uncertain. It could be that
the increase in temperature and pH that accompanies lime amendment causes
Progesterone
Unlimed Course Fine
ng/g
dry
wei
ght
0
50
100
150
200
250
Estrone
Unlimed Course Fine
ng/g
dry
wei
ght
0
2
4
6
8
10
12
14
16
a
a
b
c
c
c
Figure A 4. Progesterone and estrone concentrations in sludge amended with coarse vs. fine lime. Different letters on the same graph indicate significant differences (p<0.05). Error bars = SEM

51
transformations in the hormones present. As progesterone is a precursor to other
steroid hormones, it is possible that transformations could occur which would result
in the re-formation of this chemical. Also, any conjugated hormones present are
likely to be broken apart in this process which could result in an increase in free
concentrations seen. However, this would not explain why the finer lime, which is
believed to be better incorporated, does not result in this same effect. Finer lime is
potentially deactivated to a greater degree as there is a greater surface area available
to interact with air, which breaks down the CaO. It is therefore possible that, despite
an increase in incorporation, the lime is less effective and does not result in as much
transformation activity. The opposite effect is also possible, that the finer lime is
better incorporated and creates conditions that are actually more effective at
continuing transformations until the compounds are degraded back to original levels.
The coarser lime may leave more space open for the transformed compounds to
remain in their altered conformations.
In order to understand the mechanisms taking place, a more in depth study
will have to be conducted. This experiment should be repeated to see if results are
duplicated. Additionally, ground lime should be compared to the sieved lime used
here. Grinding the lime would increase activity since fresh surface area is exposed to
interact with the sludge. Experiments should also be extended to test the effects of
mixing time and the amount of lime added to the sludge. All of these factors could
result in changes in hormone concentrations.

52
Appendix E: Calculation of Yearly Inputs
For biosolids calculations, the amount of biosolids applied to land in 2008 was
used. This number, 188,220 wet tons, was converted to dry weight by multiplying by
0.3 (30%), which is the average percent solids in the biosolids collected. Based on
this calculation, a dry weight of 56,466 tons of biosolids was applied. This number
was multiplied by the average concentrations of progesterone and E1 and converted
into kg/year to give the values reported in Table 6.
The amount of chicken litter produced per year was calculated using the
formula laid out by the Penn State Agronomy Guide (Penn State 2010). The number
of broilers produced in Maryland, as reported by the 2007 Census of Agriculture was
296,341,690 (USDA 2007). This number was multiplied by the Animal Equivalence
Unit (AEU), 0.0026, and the manure production estimate per AEU per year (0.53805
tons) to give the estimate on litter production of 415,000 (Penn State 2010). The
AEU is based on 1000 lbs of animal weight and takes into account the average weight
of the animals.
For the purpose of this estimate, it was assumed that all of the litter was land
applied besides the ~70,000 which was pelletized. Subtracting this amount from the
production estimate gives a yearly application rate of 345,000 tons. Poultry litter is
approximately 20% water, so the final dry weight is 80% of 345,000, or 276,000.
Once this number was obtained, the inputs were calculated in the same way as the
biosolids inputs and reported in Table 6.

53
Bibliography
Andersen, H., Siegrist, H., Halling-Sørensen, B., & Ternes, T. A. (2003). Fate of estrogens in a municipal sewage treatment plant. Environmental Science and Technology, 37(18), 4021-4026.
Beck, J., Totsche, K. U., & Kogel-Knabner, I. (2008). A rapid and efficient determination of natural estrogens in soils by pressurised liquid extraction and gas chromatography-mass spectrometry. Chemosphere, 71(5), 954-960.
Besse, J.-P., & Garric, J. (2009). Progestagens for human use, exposure and hazard assessment for the aquatic environment. Environmental Pollution, 157(12), 3485-3494.
Burkhardt, M. R., ReVello, R. C., Smith, S. G., & Zaugg, S. D. (2005). Pressurized liquid extraction using water/isopropanol coupled with solid-phase extraction cleanup for industrial and anthropogenic waste-indicator compounds in sediment. Analytica Chimica Acta, 534(1), 89-100.
Busheé, E. L., Edwards, D. R., & Moore Jr, P. A. (1998). Quality of runoff from plots treated with municipal sludge and horse bedding. Transactions of the American Society of Agricultural Engineers, 41(4), 1035-1041.
D'Ascenzo, G., Di Corcia, A., Gentili, A., Mancini, R., Mastropasqua, R., Nazzari, M., et al. (2003). Fate of natural estrogen conjugates in municipal sewage transport and treatment facilities. Science of the Total Environment, 302(1-3), 199-209.
Penn State Cooperative Extension (2010). The Penn State Agronomy Guide 2009-2010: The Pennsylvania State University, State College, PA. Retrieved from http://agguide.agronomy.psu.edu.
Finlay-Moore, O., Hartel, P. G., & Cabrera, M. L. (2000). 17β-estradiol and testosterone in soil and runoff from grasslands amended with broiler litter. Journal of Environmental Quality, 29(5), 1604-1611.
Irwin, L. K., Gray, S., & Oberdörster, E. (2001). Vitellogenin induction in painted turtle, Chrysemys picta, as a biomarker of exposure to environmental levels of estradiol. Aquatic Toxicology, 55(1-2), 49-60.
Isobe, T., Serizawa, S., Horiguchi, T., Shibata, Y., Managaki, S., Takada, H., et al. (2006). Horizontal distribution of steroid estrogens in surface sediments in Tokyo Bay. Environmental Pollution, 144(2), 632-638.

54
Jackson, A. P., & Eduljee, G. H. (1994). An assessment of the risks associated with PCDD's and PCDF's following the application of sewage sludge to agricultural land in the UK. Chemosphere, 29(12), 2523-2543.
Jenkins, M. B., Endale, D. M., Schomberg, H. H., Hartel, P. G., & Cabrera, M. L. (2009). 17[beta]-Estradiol and testosterone in drainage and runoff from poultry litter applications to tilled and no-till crop land under irrigation. Journal of Environmental Management, 90(8), 2659-2664.
Jenkins, M. B., Endale, D. M., Schomberg, H. H., & Sharpe, R. R. (2006). Fecal bacteria and sex hormones in soil and runoff from cropped watersheds amended with poultry litter. Science of The Total Environment, 358(1-3), 164-177.
Jenkins, M. B., Truman, C. C., Siragusa, G., Line, E., Bailey, J. S., Frye, J., et al. (2008). Rainfall and tillage effects on transport of fecal bacteria and sex hormones 17β-estradiol and testosterone from broiler litter applications to a Georgia Piedmont Ultisol. Science of The Total Environment, 403(1-3), 154-163.
Jobling, S., Nolan, M., Tyler, C. R., Brighty, G., & Sumpter, J. P. (1998). Widespread Sexual Disruption in Wild Fish. Environmental Science & Technology, 32(17), 2498-2506.
Johnson, A. C., & Sumpter, J. P. (2001). Removal of endocrine-disrupting chemicals in activated sludge treatment works. Environmental Science and Technology, 35(24), 4697-4703.
Khanal, S. K., Xie, B., Thompson, M. L., Sung, S., Ong, S. K., & Van Leeuwen, J. (2006). Fate, transport and biodegradation of natural estrogens in the environment and engineered systems. Environmental Science and Technology, 40(21), 6537-6546.
Kidd, K. A., Blanchfield, P. J., Mills, K. H., Palace, V. P., Evans, R. E., Lazorchak, J. M., et al. (2007). Collapse of a fish population after exposure to a synthetic estrogen. Proceedings of the National Academy of Sciences of the United States of America, 104(21), 8897-8901.
Koger, C. S., Teh, S. J., & Hinton, D. E. (2000). Determining the sensitive developmental stages of intersex induction in medaka (Oryzias latipes) exposed to 17β-estradiol or testosterone. Marine Environmental Research, 50(1-5), 201-206.
Kolodziej, E. P., Gray, J. L., & Sedlak, D. L. (2003). Quantification of steroid hormones with pheromonal properties in municipal wastewater effluent. Environmental Toxicology and Chemistry, 22(11), 2622-2629.

55
Larsson, D. G. J., Adolfsson-Erici, M., Parkkonen, J., Pettersson, M., Berg, A. H., Olsson, P. E., et al. (1999). Ethinyloestradiol - An undesired fish contraceptive? Aquatic Toxicology, 45(2-3), 91-97.
León, A., Teh, S. J., Hall, L. C., & Teh, F. C. (2007). Androgen disruption of early development in Qurt strain medaka (Oryzias latipes). Aquatic Toxicology, 82(3), 195-203.
Lorenzen, A., Hendel, J. G., Conn, K. L., Bittman, S., Kwabiah, A. B., Lazarovitz, G., et al. (2004). Survey of hormone activities in municipal biosolids and animal manures. Environmental Toxicology, 19(3), 216-225.
Lozano, N., Rice, C. P., Ramirez, M., & Torrents, A. (2010). Fate of triclosan in agricultural soils after biosolid applications. Chemosphere, 78(6), 760-766.
Matejícek, D., Houserová, P., & Kubán, V. (2007). Combined isolation and purification procedures prior to the high-performance liquid chromatographic-ion-trap tandem mass spectrometric determination of estrogens and their conjugates in river sediments. Journal of Chromatography A, 1171(1-2), 80-89.
MDA (2004). Maryland Nutrient Management Law and Regulations, Title 15 Subtitle 20 C.F.R. Maryland. Annapolis, MD: Maryland Department of Agriculture.
MDE (2009a). Facts about... Sewage Sludge. Retrieved from: http://mde.maryland.gov/Programs/LandPrograms/Solid_Waste/index.asp. Baltimore, MD: Maryland Department of the Environment.
MDE (2009b). Volume Comparison of the Sewage Sludge Utilization in the State of Maryland. Retrieved from: http://mde.maryland.gov/Programs/LandPrograms/Solid_Waste/index.asp. Baltimore, MD: Maryland Department of the Environment.
Metcalfe, C. D., Metcalfe, T. L., Kiparissis, Y., Koenig, B. G., Khan, C., Hughes, R. J., et al. (2001). Estrogenic potency of chemicals detected in sewage treatment plant effluents as determined by in vivo assays with Japanese medaka (Oryzias latipes). Environmental Toxicology and Chemistry, 20(2), 297-308.
Moore, P. A., Daniel, T. C., Sharpley, A. N., & Wood, C. W. (1995). Poultry manure management: Environmentally sound options. Journal of Soil and Water Conversation, 50(3), 321-327.
Muller, M., Rabenoelina, F., Balaguer, P., Patureau, D., Lemenach, K., Budzinski, H., et al. (2008). Chemical and biological analysis of endocrine-disrupting

56
hormones and estrogenic activity in an advanced sewage treatment plant. Environmental Toxicology and Chemistry, 27(8), 1649-1658.
Nichols, D. J., Daniel, T. C., Edwards, D. R., Moore Jr, P. A., & Pote, D. H. (1998). Use of grass filter strips to reduce 17β-estradiol in runoff from fescue-applied poultry litter. Journal of Soil and Water Conservation, 53(1), 74-77.
Nichols, D. J., Daniel, T. C., Moore Jr, P. A., Edwards, D. R., & Pote, D. H. (1997). Runoff of estrogen hormone 17β-estradiol from poultry litter applied to pasture. Journal of Environmental Quality, 26(4), 1002-1006.
Nieto, A., Borrull, F., Pocurull, E., & Marcé, R. M. (2008). Determination of natural and synthetic estrogens and their conjugates in sewage sludge by pressurized liquid extraction and liquid chromatography-tandem mass spectrometry. Journal of Chromatography A, 1213(2), 224-230.
North, J. M., Becker, J. G., Seagren, E. A., Ramirez, M., Peot, C., & Murthy, S. N. (2008). Methods for quantifying lime incorporation into dewatered sludge. II: Field-scale application. Journal of Environmental Engineering, 134(9), 762-770.
Orlando, E. F., Kolok, A. S., Binzcik, G. A., Gates, J. L., Horton, M. K., Lambright, C. S., et al. (2004). Endocrine-disrupting effects of cattle feedlot effluent on an aquatic sentinel species, the fathead minnow. Environmental Health Perspectives, 112(3), 353-358.
Pothitou, P., & Voutsa, D. (2008). Endocrine disrupting compounds in municipal and industrial wastewater treatment plants in Northern Greece. Chemosphere, 73(11), 1716-1723.
Routledge, E. J., Sheahan, D., Desbrow, C., Brighty, G. C., Waldock, M., & Sumpter, J. P. (1998). Identification of estrogenic chemicals in STW effluent. 2. In vivo responses in trout and roach. Environmental Science and Technology, 32(11), 1559-1565.
Saaristo, M., Craft, J. A., Lehtonen, K. K., & Lindström, K. (2009). Sand goby (Pomatoschistus minutus) males exposed to an endocrine disrupting chemical fail in nest and mate competition. Hormones and Behavior, 56(3), 315-321.
Shore, L. S., Harel-Markowitz, E., Gurevich, M., & Shemesh, M. (1993). Factors affecting the concentration of testosterone in poultry litter. Journal of Environmental Science and Health - Part A Environmental Science and Engineering, 28(8), 1737-1749.

57
Ternes, T. A., Andersen, H., Gilberg, D., & Bonerz, M. (2002). Determination of estrogens in sludge and sediments by liquid extraction and GC/MS/MS. Analytical Chemistry, 74(14), 3498-3504.
Thomas, K. V., Dye, C., Schlabach, M., & Langford, K. H. (2007). Source to sink tracking of selected human pharmaceuticals from two Oslo city hospitals and a wastewater treatment work. Journal of Environmental Monitoring, 9, 1410-1418.
USDA (2009). 2007 Census of Agriculture. Washington, DC: National Agricultural Statistics Service, United States Department of Agriculture.
USEPA (1994). Plain English Guide to the EPA Part 503 Biosolids Rule. (EPA832-R-93-003). Washington, DC: Office of Wastewater Management, EPA.
USEPA (1999). Biosolids Generation, Use, and Disposal in The United States. (EPA530-R-99-009). Washington, DC: Office of Solid Waste, EPA.
USEPA (2003). CAFO Final Rule, 40 CFR Parts 9, 122, 123, and 412 C.F.R. Washington, DC: United States Environmental Protection Agency
USEPA (2009). Targeted National Sewage Sludge Survey Sampling and Analysis Technical Report. (EPA-822-R-08-016). Washington, DC: Retrieved from http://www.epa.gov/waterscience/biosolids/tnsss-fs.html.
Yonkos, L. T. (2005). Poultry Litter Induced Endocrine Disruption: Laboratory and Field Investigations. Doctor of Philosophy Dissertation/Thesis, University of Maryland.
Zerulla, M., Länge, R., Steger-Hartmann, T., Panter, G., Hutchinson, T., & Dietrich, D. R. (2002). Morphological sex reversal upon short-term exposure to endocrine modulators in juvenile fathead minnow (Pimephales promelas). Toxicology Letters, 131(1-2), 51-63.