STERLING ASSETS INDIA 2 - Home - · PDF fileSTERLING ASSETS INDIA 2 UK INVESTMENT CREATING...
36
STERLING ASSETS INDIA 2 UK INVESTMENT CREATING INDIAN JOBS FEBRUARY 2017 Sponsored by: In association with:
Transcript of STERLING ASSETS INDIA 2 - Home - · PDF fileSTERLING ASSETS INDIA 2 UK INVESTMENT CREATING...

STERLING ASSETS INDIA 2UK INVESTMENT CREATING INDIAN JOBS
FEBRUARY 2017
Sponsored by:
In association with:

PwC
At PwC, our purpose is to build trust in society and solve important problems. We’re a network of firms
in 157 countries with more than 223,000 people who are committed to delivering quality in assurance,
advisory and tax services.
Find out more and tell us what matters to you by visiting us at www.pwc.com
This publication has been prepared for general guidance on matters of interest only, and does not constitute
professional advice. You should not act on the information contained in this publication without obtaining
specific professional advice. No representation or warranty (express or implied) is given as to the accuracy
or completeness of the information contained in this publication, and, to the extent permitted by law,
PricewaterhouseCoopers LLP, its members, employees and agents do not accept or assume any liability,
responsibility or duty of care for any consequences of you or anyone else acting, or refraining to act, in
reliance on the information contained in this publication or for any decision based on it.
PwC refers to the PwC network and/or one or more of its member firms, each of which is a separate legal
entity. Please see www.pwc.com/structure for further details.
© 2017 PwC. All rights reserved.
UK India Business Council
The UK India Business Council believes that the UK-India business partnership creates jobs and growth in
both countries and UK businesses have ideas, technology, services and products that can succeed in India.
The fact that the UK is the No 1 investor in India among G20 countries reinforces this.
The UK India Business Council supports UK businesses with the insights, networks, policy advocacy,
services, and facilities needed to succeed in India.
The organisation’s first-hand experience of helping enter and growing businesses in India makes it uniquely
qualified to help others achieve success whether they are well-established in India or in the early stages of
their engagement.
Working with the UK government and other influential and connected partners, the UK India Business
Council ensures that business interests are conveyed to India’s Union and state legislators and seeks
to influence decisions that will make it easier for UK businesses to operate in India.
For those seeking practical advice, its talented team provides a range of sector-specific research,
market entry and expansion services that help businesses understand and access the opportunities.
For those setting up operations in India, the UK India Business Council provides a home away from home
with a network of business centres in major cities, and an unrivalled network of government and business
contacts, service providers, as well as a team of specialist staff to support business success.
The UK India Business Council’s network is at the heart of its support. Through its wide variety of events
and its member-only sector policy groups, the UK India Business Council enables business people to meet
each other, identify potential partners, suppliers and customers, and to learn from top business leaders and
commentators, including those on its Advisory Council.
3Chapter 3: Our fi ndings: four main drivers of regional productivity diff erences
CONTENTS
Foreword
Carolyn Fairbairn, Patricia Hewitt,Kevin Burrowes 4
Executive summary 6
Sections
1 Share of British investment in India 10
2 Economic impactof British investment 14
3 Geographic impactof British investment 18
4 Success stories 20
5 Successful sustainability strategiesof UK companies in India 24
6 The UK-India bilateral relationship: opportunities and challenges 28
Methodology 30
Annexe 32
About Kantar IMRB 33
About CBI India 34
References 35
4 Foreword
Foreword
In partnership with PwC and the UK India Business Council (UKIBC), the CBI is delighted to introduce the second edition of ‘Sterling assets India’ – a study on the impact of the UK’s foreign direct investmentin India.
Just a few months ago, in November 2016, we were proud to be involved in Theresa May’s
first visit to India as British prime minister. During the meetings that took place between
business and politicians in those few days we were pleased to hear data from the first
edition of Sterling assets India quoted regularly. The report – and the data it contained – has
become a strong source of information on the extent of the UK-India business relationship,
and we hope this second edition helps to build on that by further showcasing the richness
of British investments, with data and case studies from businesses of all sizes and sectors.
This year we have widened the scope of the research, taking into account FDI received
directly from the UK, investments from companies of British parentage through third
countries and re-investment by British companies in India.
We are happy to report that the UK remains the largest G20 investor in India. Indeed, one in
every ten jobs created by FDI in India between April 2000 and September 2016 was created
by British FDI. As of today, 788,000 Indian private sector jobs are supported by British
investments, retaining the UK’s position of creating one in every twenty jobs in India’s
organised private sector.
The facts and figures in this report demonstrate the strength of the relationship and the
strong business eco-system that the UK’s private sector has built in India. This reflects
the fact that the relationship between these two great nations has stood the test of time.

5Foreword
Britain’s changed situation after the Brexit referendum and the bold economic initiatives
taken by India’s prime minister Narendra Modi such as the introduction of the Goods
and Services Tax, demonetisation, and digitalisation of the economy are opening up new
avenues for further enriching the relationship.
While there are new opportunities, there will be new challenges too. In particular, British
investors will be looking for further progress to secure investor protection under the model
Bilateral Investment Treaty (BIT), greater momentum in reducing corporate tax rates and
further improvements in the ease of doing business – as increasingly recognised by India’s
rise up the World Bank’s Ease of Doing Business Index.
But despite these challenges, we have no doubt that the UK-India business relationship
will continue to go from strength to strength, harnessing the huge shared enthusiasm
and passion.
Carolyn Fairbairn Patricia Hewitt Kevin Burrowes
Director-general, CBI Chair, UKIBC Clients & markets
UK executive board
PwC

6 Executive summary
Indian subsidiaries of British firms play a vital role in the Indian economy. While many larger British companies investing in India are well-known names like BP, Vodafone, G4S, HSBC, Rio Tinto and Unilever, several medium-sized businesses (MSBs) from the UK arealso doing business successfully and generating jobs in India forseveral years.
The UK remains the largest G20 investor in India, having invested US$24.07bn in the form
of equity FDI between April 2000 and September 2016. It is the third largest investor in India
after offshore international financial centres like Mauritius and Singapore.
While the first edition of Sterling assets India in 2015 prepared by India-based market
research firm Kantar IMRB dealt with FDI coming directly from the UK and the number of
jobs created between April 2000 and March 2015, this study attempts to widen the scope of
research. This research endeavours to calculate foreign direct investment inflow into India
between April 2000 and September 2016 from the UK. Calculations this year are a sum of
three categories of UK funds inflow:
• Equity FDI that came from the UK directly
• Through re-investment1 from British firms already in India
• Through firms of UK parentage, a majority of which are the top 25 investors from offshore
financial centres like Mauritius and Singapore.
This research estimates that UK companies re-invested US$7.9bn between April 2000
and September 2016.
It is estimated that one in every ten jobs created by FDI in India between April 2000 and
September 2016 were created by UK FDI. This takes the number of jobs created by UK FDI to
371,000 between April 2000 and September 2016,2 against a total estimate of 3.6 million jobs
created in India by FDI during this period. Currently the total number of people employed by
UK companies in India stands at 788,0003 which forms 5.3% of total organised private sector
jobs in India. Hence the UK has maintained its significant role in providing one in every 20
organised private sector jobs in India.
In eighteen months between April 2015 and September 2016, India received FDI from the
UK to the tune of US$1.87bn, while FDI from Mauritius and Singapore was US$5.85bn and
US$4.68bn respectively. Roughly 38,000 jobs were created by UK FDI in these 18 months.
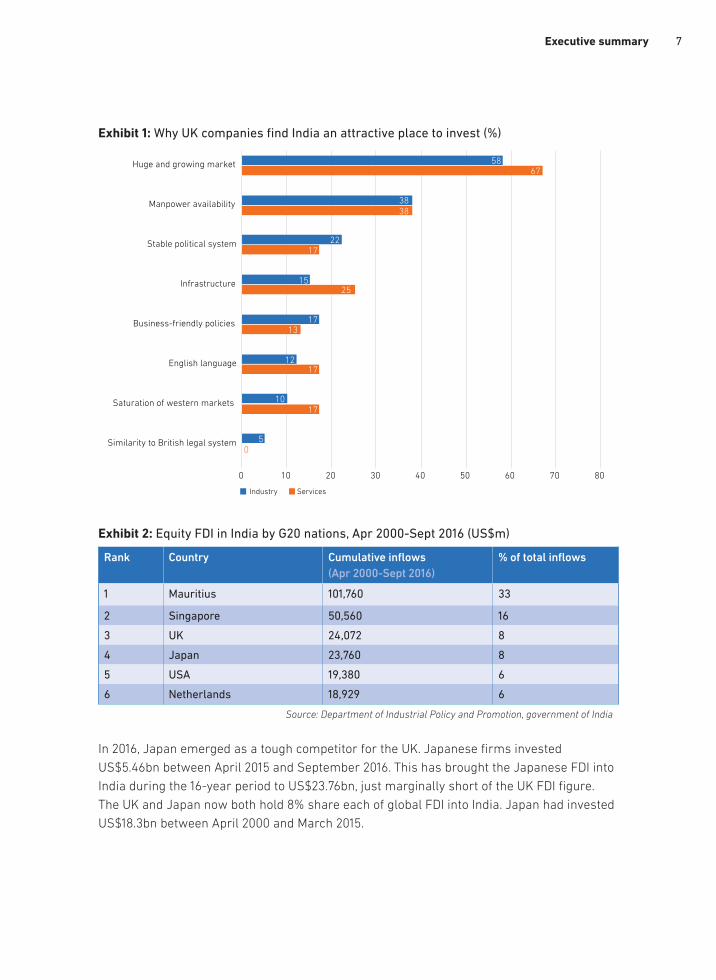
India remains something of an investment magnet to British companies. As Asia’s third
largest economy, India has attracted FDI from the UK into both industry and services sectors
between 2000 and 2016. The main reasons why UK companies are attracted to India are a
growing market, easy talent availability, a stable political system, new business-friendly
policies by state and central governments, use of English as the language of business,
saturation of western markets and similar legal and educational systems.
EX
EC
UT
IVE
SU
MM
AR
Y
7Executive summary
Exhibit 1: Why UK companies find India an attractive place to invest (%)
Exhibit 2: Equity FDI in India by G20 nations, Apr 2000-Sept 2016 (US$m)
Rank Country Cumulative inflows
(Apr 2000-Sept 2016)
% of total inflows
1 Mauritius 101,760 33
2 Singapore 50,560 16
3 UK 24,072 8
4 Japan 23,760 8
5 USA 19,380 6
6 Netherlands 18,929 6
Source: Department of Industrial Policy and Promotion, government of India
In 2016, Japan emerged as a tough competitor for the UK. Japanese firms invested
US$5.46bn between April 2015 and September 2016. This has brought the Japanese FDI into
India during the 16-year period to US$23.76bn, just marginally short of the UK FDI figure.
The UK and Japan now both hold 8% share each of global FDI into India. Japan had invested
US$18.3bn between April 2000 and March 2015.
Industry Services
0 10 20 30 40 50 60 70 80
Similarity to British legal system
Saturation of western markets
English language
Business-friendly policies
Infrastructure
Stable political system
Manpower availability
Huge and growing market 5867
3838
2217
17
17
17
13
1525
12
50
10

8 Executive summary
Exhibit 3: Employment generated by foreign companies in India (Apr 2000-Sept 2016)4
Country Numbers (000)
UK 280
Japan 276
Germany 107
France 62
US 226
Mauritius 1185
Significantly, the UK remained the largest job creator in India via direct FDI. Around 280,000
jobs were created from a combination of equity that came directly from the UK, re-invested
earnings by British companies and other forms of FDI between April 2015 and September
2016. Another 91,145 jobs were created through firms of UK parentage who invested via
other destinations during this time period.
Exhibit 4: British investment in India by sector
Micro-sector Apr ‘00-Sep ‘16 (million) Apr ‘15-Sep ‘16 (million)
Petroleum & natural gas 2,455.71 189.95
Chemicals (other than fertilisers) 6,134.59 474.51
Drugs & pharmaceuticals 4,166.25 322.26
Food processing industries 3,235.65 250.28
Services sector* (includes finance,
banking, insurance, non-finance/
business, outsourcing, R&D, courier,
technical testing and analysis, other)
3,156.12 244.13
Unclassified 4,923.98 380.87
Grand total of equity FDI 24,072.30 1,862.00
According to data from Department of Industrial Policy and Promotion (DIPP), the
chemicals sector received the lion’s share of FDI from the UK at US$6.1bn (25%) followed by
unclassified sectors at US$4.9m (20.35%), drugs and pharmaceuticals at US$4.1bn (17%) and
food processing at US$3.2bn (13.29%).

9Executive summary
Exhibit 5: British Investment by region (all values US$bn)
States receiving equity FDI All countries UK
Apr ’00-Sep ‘16 Apr ’15-Sep ‘16 Apr ’00-Sep ‘16 Apr ’15-Sep ‘16
Maharashtra
(includes Dadra & Nagar
Haveli, Daman & Diu)
92.85 19.73 7.47 0.60
Delhi NCR (also includes
NCR districts of UP
and Haryana)
65.56 16.15 1.80 0.42
Tamil Nadu
(includes Pondicherry)
22.16 5.15 0.33 0.03
Karnataka 21.32 5.20 0.26 0.01
Gujarat 13.65 2.61 0.50 0.07
Andhra Pradesh 12.65 2.63 0.42 0.04
West Bengal
(includes Sikkim, Andaman
& Nicobar Islands)
3.97 0.99 0.28 0.00
Other states/union
territories
77.92 9.11 13.01 0.67
Total FDI (US$bn) 310.08 61.57 24.07 1.84
Significantly more UK firms are investing in the Delhi National Capital Region. In the
18-month period between April 2015 and September 2016, 22.35% of investments from UK
firms came to Delhi. The region received 7.5% of UK investments between April 2000 and
September 2016.
Maharashtra received the maximum investment from the UK at US$7.47bn between April
2000 and September 2016. In the eighteen months between April 2015 and September 2016,
it attracted around US$600m UK FDI which is 32% of the total FDI from the UK during this
time period. States of eastern India led by West Bengal received no investment from the UK
in this period.
One in every ten jobs created by FDI in India between April 2000 and September 2016 was created by UK FDI.

10 Section 1: Share of British investment in India
Share of British investment in India– investment and reinvestment
According to the World Investment Report 2016, published by UNCTAD,5 India is considered the tenth most attractive FDI destination (in terms of FDI Confidence Index) in the world. According to the fDi 2016 report on global greenfield investments of the Financial Times, India overtook China to become the top destination attracting FDI,with nearly 3% share of global FDI of US$1.76trn. In the year 2015-16, total FDI inflow in India was around US$55bn in data publishedby DIPP.6 This was an increase of 23% over 2014-15 (US$45.15bn).
It is worth mentioning that FDI in India hit the ‘take-off’ stage in the year 2006-07 and has
been consistently increasing thereafter. The largest contributor to this inflow is from equity
FDI – ie equity inflow through FIPB7 route, the Reserve Bank of India’s automatic route and
mergers and acquisitions.
Exhibit 6: FDI’s decade of growth in India, 2006-16 (trajectory of FDI inflow in India, US$bn)
SE
CT
ION
1
Equity FDI Reinvested earning Other capital Total FDI
0
10
20
30
40
50
60
2000-01 2006-07 2015-16

11Section 1: Share of British investment in India
Since 2006-07, FDI has grown at a rate (CAGR) of around 10%. However, this period has
also seen wide fluctuations in the inflow with the years 2009-13 (barring the year 2011-12)
experiencing sharp drops in FDI inflow.
UNCTAD’s World Investment Report states that India ranked fourth in terms of receiving FDI
during the year 2006-07, which amounted to US$22.8bn with a growth rate of 155%.
FDI inflow into India surged in 2006-07 due to two major reasons – the first is purely
methodological but the second is real:
• The government of India modified the guidelines for calculation of foreign investment.
The mechanism for arriving at overall FDI figures was modified leading to rise in FDI
figures. Before 2006, the foreign equity component of India joint venture partner was not
calculated as FDI8
• In a bid to attract more FDI, the government in 2006-07 had increased the cap on FDI
on several sectors (see annexe, page 32). Most notable was relaxing of FDI norms in the
telecom sector from 74% to 98% leading to a surge in investments in that sector. Some
significant investments received that year included Vodafone UK which invested US$801m
and Matsushita Japan which brought in US$342m.
Similarly there was another surge in FDI into India in the last couple of years. Since the
government led by Narendra Modi came into power, two major FDI-related sectors were
opened up – namely insurance and defence manufacturing. Foreign investors who could
only invest up to 26% were allowed to invest up to 49% in joint ventures with Indian
partners. Also, the country opened up to 100% FDI in railway-related infrastructure,
health and construction.
Around 18-20% of the total FDI, in 2015-16, came from re-invested earnings. However, this
mode of FDI has been stagnant over the years witnessing a growth (CAGR since 2006-07)
of only 6% (as compared to the double-digit growth of total FDI during the same period).
Exhibit 7: Growing hand in hand: FDI’s impact on GDP (equity FDI & GDP trajectory, 2000-17)
0.0
0.5
1.0
1.5
2.0
2.5
3.0
0.0
7.5
15.0
22.5
30.0
37.5
45.0
16-17 Apr-Sep)
15-1610-1100-01
GDP at current prices ($UStrn)
GD
P (
$U
Str
n)
GD
P (
$U
Sb
n)

12 Section 1: Share of British investment in India
Exhibit 8: UK FDI in India, the break up – equity, re-investments and re-routed investments
(Apr 2000-Sept 2016)
In the period between April 2000 and September 2016, total UK FDI into India was
US$44.37bn. This included equity of 54.15% (US$24.07bn), re-invested earnings of 17%
(US$7.9bn), of other forms of FDI constituted 3.37% at US$1.5bn and investments routed
through other destinations constituted 24.52% (US$10.9bn).
However, UK FDI fell marginally when we compare the two periods April 2000-March 2015
and April 2000-September 2016. While the average per year FDI into India was US$1.48bn
between April 2000 and March 2015, the corresponding figure for the period between
April 2000 and September 2016 fell to US$1.45bn.
UK firms re-invested US$7.9bn between April 2000 and September 2016 in India, generating around 66,000 jobs through re-investment.
Equity FDI US$24.07bn
Reinvested earnings US$7.97bn
Other FDI US$1.5bn
Re-routed FDI US$10.9bn
Source: data interpreted by Kantar IMRB from DIPP and RBI

13Chapter 3: Our fi ndings: four main drivers of regional productivity diff erences

14 Section 2: Economic impact of British investment
Economic impact of British investment
One of the key impacts of FDI is creation of jobs. It is estimated that close to 3.6 million
jobs have been created in India, from April 2000 to September 2016, as a direct result of
FDI influx (which includes equity FDI as well as re-invested earnings and other sources of
FDI). While global FDI created as much as 70% of the jobs in the manufacturing sector, the
services sector is steadily catching up. Between April 2015 and September 2016, around 36%
were created in the services sector alone.
The UK remains the largest G20 investor and job creator, having created 10% (371,000) of
total jobs created by FDI in India between April 2000 and September 2016. British companies
currently employ around 788,000 people in India, thus making the account for 5.3% of total
organised private sector jobs in India.
Exhibit 9: Employment generated in India through total FDI, by sector
Sector in DIPP report Total jobs (‘000) All FDI
Apr ‘00-Mar ‘15 Apr ‘00-Sep ‘16 Apr ‘15-Sep ‘16
Services sector 950.93 1,248.52 297.59
Construction development 372.74 375.62 2.88
Computer hardware & software 264.38 388.20 123.82
Telecommunications 300.32 372.69 72.38
Automobile industry 184.07 234.75 50.69
Drugs & pharmaceuticals 93.65 103.42 9.77
Trading 186.48 308.96 122.48
Chemicals (other than fertilisers) 89.31 107.42 18.11
Power 12.68 14.64 1.96
Hotel & tourism 30.34 37.37 7.03
Metallurgical industries 30.74 33.58 2.84
Others 1,029.53 1,279.29 249.76
Source: interpreted by Kantar IMRB from data by DIPPS
EC
TIO
N 2
15Section 2: Economic impact of British investment
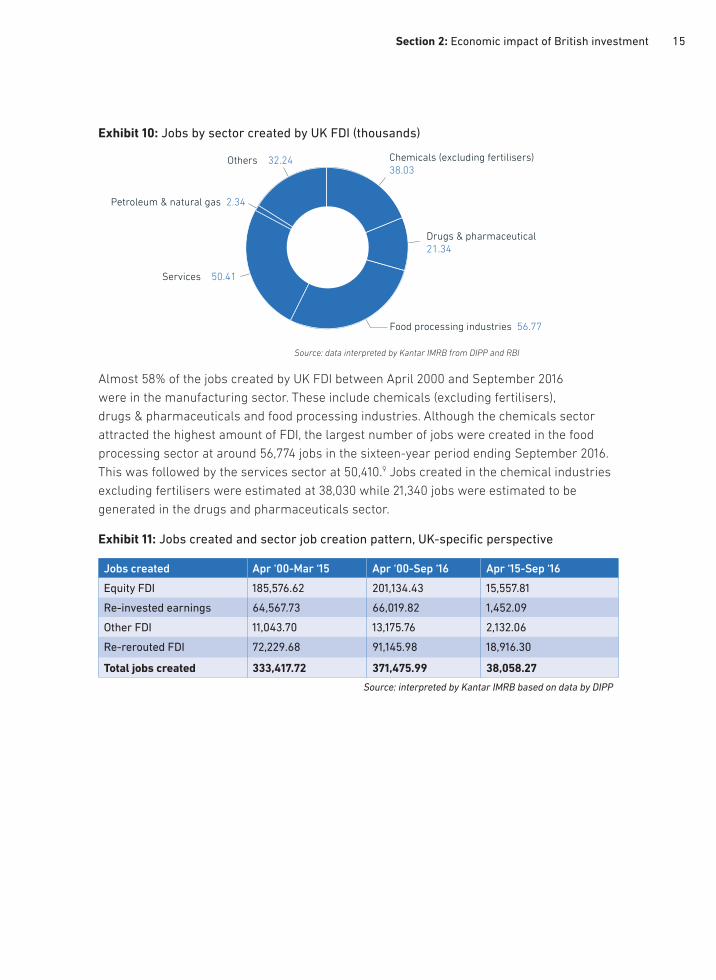
Exhibit 10: Jobs by sector created by UK FDI (thousands)
Almost 58% of the jobs created by UK FDI between April 2000 and September 2016
were in the manufacturing sector. These include chemicals (excluding fertilisers),
drugs & pharmaceuticals and food processing industries. Although the chemicals sector
attracted the highest amount of FDI, the largest number of jobs were created in the food
processing sector at around 56,774 jobs in the sixteen-year period ending September 2016.
This was followed by the services sector at 50,410.9 Jobs created in the chemical industries
excluding fertilisers were estimated at 38,030 while 21,340 jobs were estimated to be
generated in the drugs and pharmaceuticals sector.
Exhibit 11: Jobs created and sector job creation pattern, UK-specific perspective
Jobs created Apr ‘00-Mar ‘15 Apr ‘00-Sep ‘16 Apr ‘15-Sep ‘16
Equity FDI 185,576.62 201,134.43 15,557.81
Re-invested earnings 64,567.73 66,019.82 1,452.09
Other FDI 11,043.70 13,175.76 2,132.06
Re-rerouted FDI 72,229.68 91,145.98 18,916.30
Total jobs created 333,417.72 371,475.99 38,058.27
Source: interpreted by Kantar IMRB based on data by DIPP
Chemicals (excluding fertilisers)
38.03
Drugs & pharmaceutical
21.34
Food processing industries 56.77
Services 50.41
Others 32.24
Petroleum & natural gas 2.34
Source: data interpreted by Kantar IMRB from DIPP and RBI
16 Section 2: Economic impact of British investment
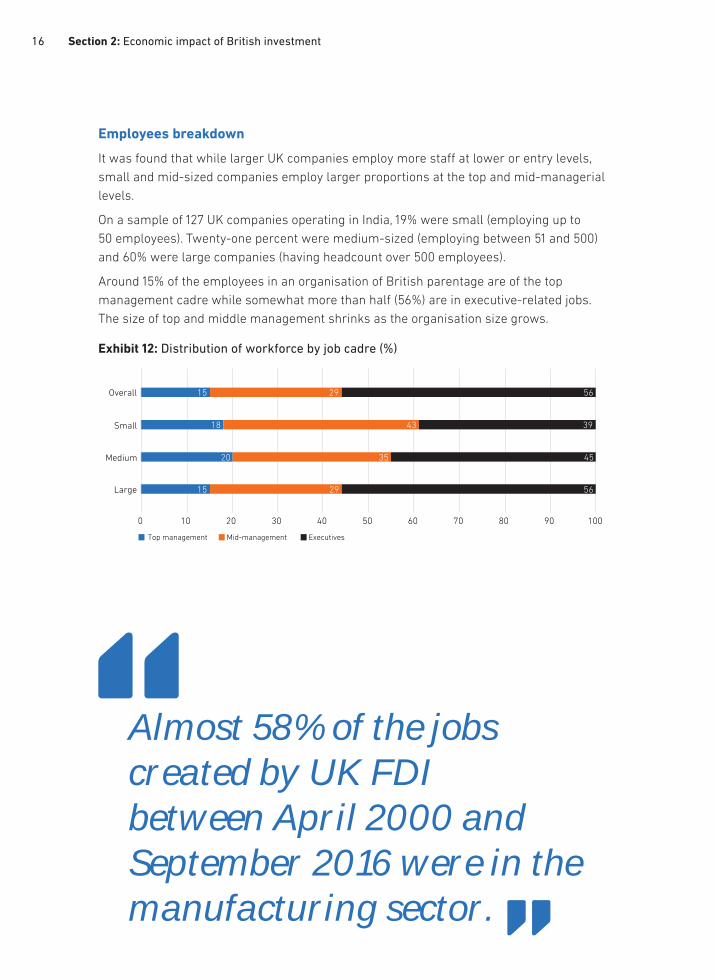
Employees breakdown
It was found that while larger UK companies employ more staff at lower or entry levels,
small and mid-sized companies employ larger proportions at the top and mid-managerial
levels.
On a sample of 127 UK companies operating in India, 19% were small (employing up to
50 employees). Twenty-one percent were medium-sized (employing between 51 and 500)
and 60% were large companies (having headcount over 500 employees).
Around 15% of the employees in an organisation of British parentage are of the top
management cadre while somewhat more than half (56%) are in executive-related jobs.
The size of top and middle management shrinks as the organisation size grows.
Exhibit 12: Distribution of workforce by job cadre (%)
Almost 58% of the jobs created by UK FDI between April 2000 and September 2016 were in the manufacturing sector.
0 10 20 30 40 50 60 70 80 90 100
Large
Medium
Small
Overall 15 29 56
18 43 39
20 35 45
15 29 56
Top management Mid-management Executives

17Chapter 3: Our fi ndings: four main drivers of regional productivity diff erences
18 Section 3: Geographic impact of British investment
Geographic impact of British investment
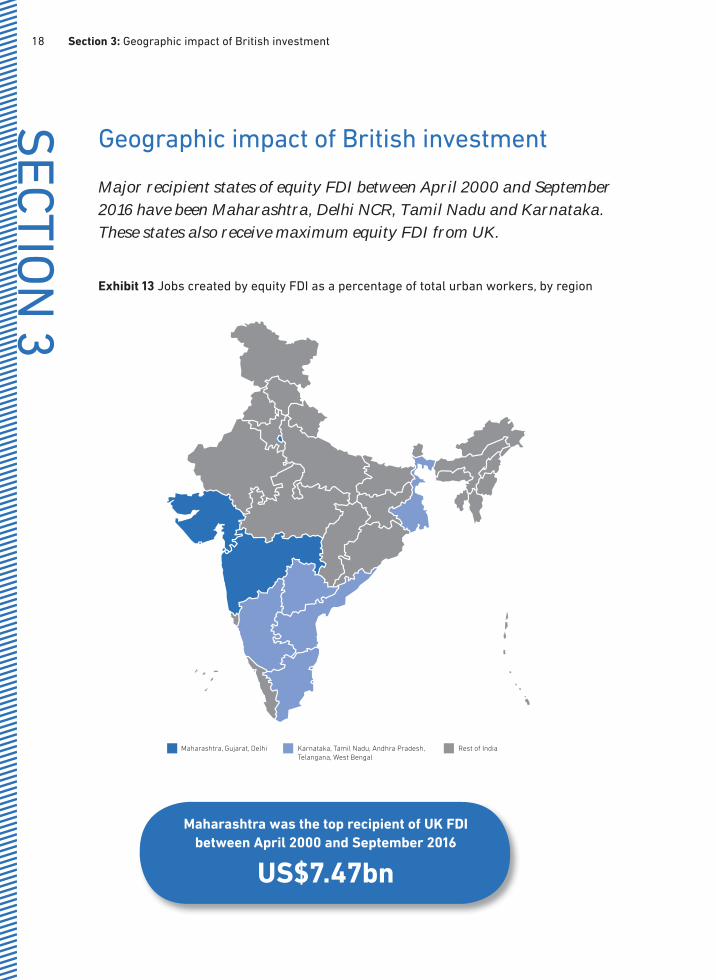
Major recipient states of equity FDI between April 2000 and September 2016 have been Maharashtra, Delhi NCR, Tamil Nadu and Karnataka. These states also receive maximum equity FDI from UK.
Exhibit 13 Jobs created by equity FDI as a percentage of total urban workers, by region
SE
CT
ION
3
Maharashtra was the top recipient of UK FDI
between April 2000 and September 2016
US$7.47bn
Maharashtra, Gujarat, Delhi Karnataka, Tamil Nadu, Andhra Pradesh,
Telangana, West Bengal
Rest of India
19Section 3: Geographic impact of British investment
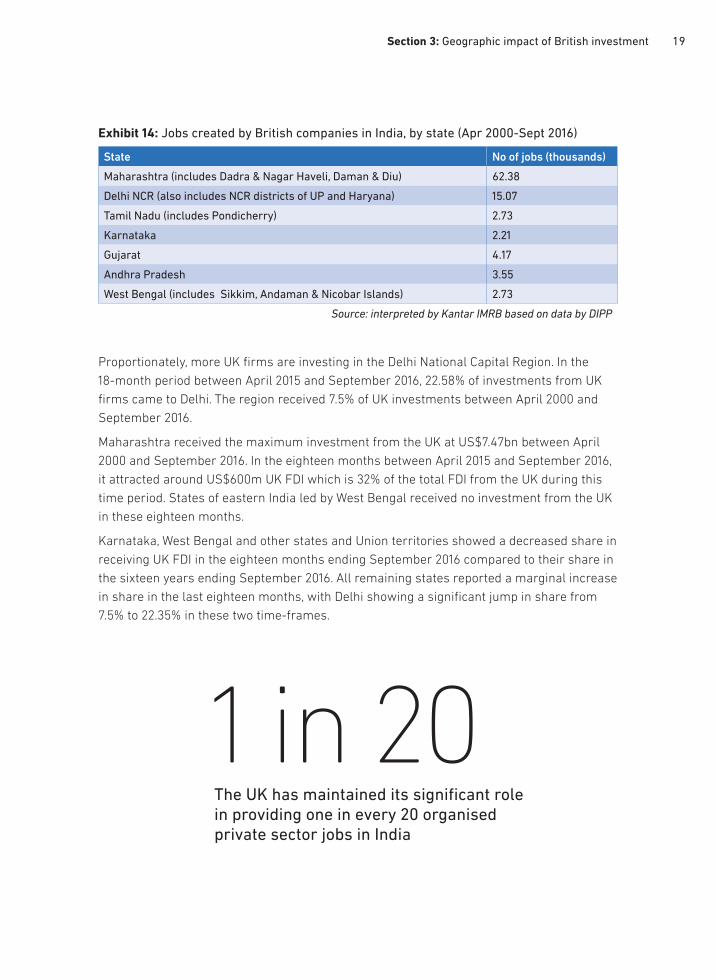
Exhibit 14: Jobs created by British companies in India, by state (Apr 2000-Sept 2016)
State No of jobs (thousands)
Maharashtra (includes Dadra & Nagar Haveli, Daman & Diu) 62.38
Delhi NCR (also includes NCR districts of UP and Haryana) 15.07
Tamil Nadu (includes Pondicherry) 2.73
Karnataka 2.21
Gujarat 4.17
Andhra Pradesh 3.55
West Bengal (includes Sikkim, Andaman & Nicobar Islands) 2.73
Source: interpreted by Kantar IMRB based on data by DIPP
Proportionately, more UK firms are investing in the Delhi National Capital Region. In the
18-month period between April 2015 and September 2016, 22.58% of investments from UK
firms came to Delhi. The region received 7.5% of UK investments between April 2000 and
September 2016.
Maharashtra received the maximum investment from the UK at US$7.47bn between April
2000 and September 2016. In the eighteen months between April 2015 and September 2016,
it attracted around US$600m UK FDI which is 32% of the total FDI from the UK during this
time period. States of eastern India led by West Bengal received no investment from the UK
in these eighteen months.
Karnataka, West Bengal and other states and Union territories showed a decreased share in
receiving UK FDI in the eighteen months ending September 2016 compared to their share in
the sixteen years ending September 2016. All remaining states reported a marginal increase
in share in the last eighteen months, with Delhi showing a significant jump in share from
7.5% to 22.35% in these two time-frames.
1 in 20The UK has maintained its significant role in providing one in every 20 organised private sector jobs in India
20 Section 4: Success stories – MSBs in India
Success stories – MSBs in India
Medium-sized businesses (MSBs) are the driving force behind the UK’s growth. According to the CBI report ‘Life in the fast lane’, it is estimated that despite accounting for less than 2% of businesses, MSBs (firms with 50-499 employees) are responsible for one in six jobs and generate nearly a quarter of private sector revenue in the UK. Here are some select UK MSBs which are scripting a success story and generatingjobs in India.
SE
CT
ION
4
Turner & Townsend
Turner & Townsend established its India business in 2007. It started with a promise
to support global clients wherever they are, and quickly gathered momentum by an
appointment with one of India’s largest corporates – Airtel – providing cost and project
management services on the Unified Network Operating Centre (UNOC) project in 2008.
In India, it offers a full range of services including programme management, project
management, cost management and project controls. It has also been working with
private equity real estate firms offering consultancy on their due diligences.
Turner & Townsend has since firmly established itself in the country with a highly
qualified strong professional team of 125 people between three offices – Mumbai, Delhi
and Bangalore. These locations have serviced projects across India in cities such as
Pune, Kolkata, Chennai, Hyderabad, Chandigarh and Lucknow.
Turner & Townsend continues to support global clients and has been engaged in
India by many local and global firms. Infrastructure is high on Turner & Townsend’s
India agenda. It is actively looking to support the Indian government’s ‘Make in India’
campaign by integrating consulting capability with a proven delivery management
capability. The company recently announced it expects to double the size of its Indian
business by 2020 with new offices in Chennai, Hyderabad and Pune in the pipeline.

21Section 4: Success stories – MSBs in India
Randox
Randox has a significant presence in India for over a decade and has continuous
year-on-year growth in its diagnostic products and medical devices business.
The watershed development for Randox in India was the opening (below) of its
state-of-the-art manufacturing facility in Bangalore, the capital of Karnataka state.
The 30,000-square-foot plant is equipped with internationally acclaimed machines,
including the Adelphi filling machine with an extremely high output capacity.
The company now employs over 100 people nationwide and boasts a loyal customer
base in India. Randox has successfully navigated the complex regulatory landscape
of the Indian market and secured several key contracts. Among such deals, one of the
most notable wins for Randox is the contract with the Rajasthan state government to
provide clinical instruments for the state’s free healthcare programme.
Randox has also tapped into the pulse of the Indian consumer. It understands
the cultural side of the Indian consumer and continues to seek to strengthen this
relationship with the Indian market through music. World-renowned pianist Barry
Douglas was invited to perform with the Symphony Orchestra of India to celebrate
the strong partnership between Randox and the Indian market. Randox’s success in
India cements the company’s position as a global market leader in the diagnostics and
medical devices industry.
22 Section 4: Success stories – MSBs in India
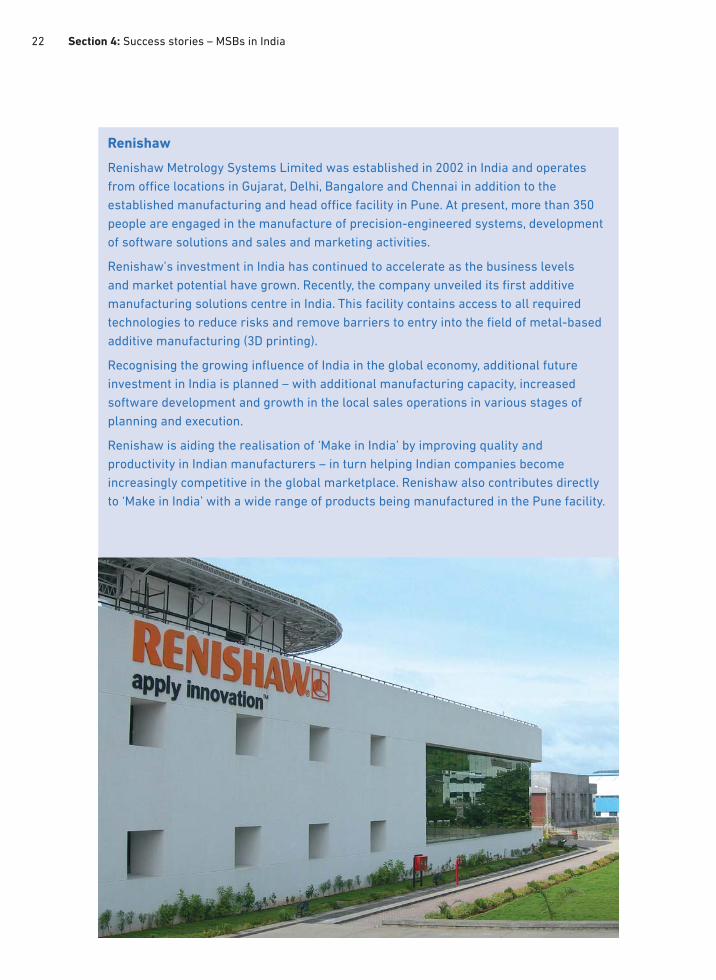
Renishaw
Renishaw Metrology Systems Limited was established in 2002 in India and operates
from office locations in Gujarat, Delhi, Bangalore and Chennai in addition to the
established manufacturing and head office facility in Pune. At present, more than 350
people are engaged in the manufacture of precision-engineered systems, development
of software solutions and sales and marketing activities.
Renishaw’s investment in India has continued to accelerate as the business levels
and market potential have grown. Recently, the company unveiled its first additive
manufacturing solutions centre in India. This facility contains access to all required
technologies to reduce risks and remove barriers to entry into the field of metal-based
additive manufacturing (3D printing).
Recognising the growing influence of India in the global economy, additional future
investment in India is planned – with additional manufacturing capacity, increased
software development and growth in the local sales operations in various stages of
planning and execution.
Renishaw is aiding the realisation of ‘Make in India’ by improving quality and
productivity in Indian manufacturers – in turn helping Indian companies become
increasingly competitive in the global marketplace. Renishaw also contributes directly
to ‘Make in India’ with a wide range of products being manufactured in the Pune facility.

23Section 4: Success stories – MSBs in India
TWI India
TWI has delivered high-quality training in India for more than two decades. Based in
Chennai, TWI India has been operational since January 2012, and co-ordinates courses
on-site, as well as in Mumbai, Kolkata, Cochin, Trichy, Surat, Visakhapatnam and
Hyderabad. Throughout these locations TWI is training and certifying up to 4,500
Indian nationals annually.
TWI’s permanent bases in India also provide new opportunities for local business
partnerships and development of its tailored training portfolio. TWI India is also a
base for technical services in all TWI competences. Indian companies are investing in
engineering quality and productivity by embracing new processes and technologies.
Many Indian companies have utilised TWI’s unique, multidisciplinary range of
technology engineering, training and information services offered – together with
the expertise offered by its materials joining and engineering staff across the world
– organisations to add significant value to their operations.
Globally, the transfer of knowledge and knowhow to industry from a base of research
has been fundamental to TWI’s values since the company’s creation in 1946. Formal
training and certification has been a key aspect of TWI business since the early eighties.
TWI’s portfolio includes training in non-destructive testing, welding inspection, plant
inspection and welding procedures, practical welding, health & safety and specialist
diver training for underwater inspection. Courses are designed for all major industry
sectors including oil and gas, aerospace, construction, power and automotive.
24 Section 5: Successful sustainability strategies of UK companies in India
Successful sustainability strategiesof UK companies in India
The Paris Climate Agreement became effective on 4 November 2016. The deal opened an exciting opportunity for business, putting us on a sustainable low-carbon path, which can provide the framework for business to invest with confidence. The agreement is a commitment by all nations to work towards a more sustainable future. Here are some of the winning sustainability strategies adopted by a section of CBI members working in India.
SE
CT
ION
5
United Spirits Limited (USL)
Environment protection is a strategic priority for USL as it strives to minimise the
environmental impact in areas where it operates. Its strategy includes taking a water-
neutral approach, reducing carbon footprint and increasing use of renewable energy.
USL’s bottling plants and distilleries are mostly situated in semi-urban and rural areas,
where communities often lack basic infrastructure necessary for dignified living.
Its corporate social responsibility activities revolve around providing access to
clean drinking water, sanitation, healthcare facilities, education, and employable skills
to bridge this developmental gap.
The programme has benefitted nearly 40,000 people on water resource management,
built individual and community toilets, conducted health and hygiene programmes and
imparted employable skill training to community women in villages around its plants in
Bhopal, Ganjam, Alwar, Puducherry, and Udaipur.
United Spirits is India’s largest alcohol beverage company and a group company
of Diageo plc, the world’s largest drinks company. It has over 140 brands and 74
production sites, employing 10,000 people.

25Section 5: Successful sustainability strategies of UK companies in India
Mott MacDonald
After the COP21 Paris climate summit, Mott MacDonald made a global commitment to
reinforce its role as a leader in sustainability. In doing so, it influences its clients and
partners by championing solutions to help minimise carbon emissions, resource use
and waste on projects globally, including India. Here are some examples of how the
company has helped projects stay sustainably viable in India:
Mott MacDonald helped tyre manufacturer MRF’s factory in Tamil Nadu by making the
energy and water-intensive processes more efficient. It reduced carbon footprints and
contributed to annual cost savings of US$1m. This enabled the business to produce high
quality tyres at more competitive prices.
As lead technical advisor, the company produced preliminary designs for a 30-year
masterplan for the US$1.25bn Delhi International Airport (DIA – below). Due to climate-
friendly inputs by Mott MacDonald, Terminal 3 of the Delhi airport was awarded LEED
GOLD certification by Indian Green Building Council and Greentech Gold Award in 2008,
2009 and 2011. The company also won the ‘Most innovative multinational corporation
providing benefits to the local market’ at the 2013 British Business Group (BBG) Awards
and 2010 British Construction Industry Awards.
Mott MacDonald has also contributed to the delivery of Mumbai IV water supply project.
Its advice related to reducing and increasing diameter of pipes at strategic points,
helped achieve 30% water savings.
Mott MacDonald has been working in India for 45 years. It provides a wide range of key
services across a project’s entire lifecycle in India’s major markets – such as industry,
transport, water, buildings, energy, environment, health, education, communications,
and institutional development.

26 Section 5: Successful sustainability strategies of UK companies in India
GSK
GSK Consumer Healthcare India is India’s leading fast-moving consumer healthcare
company, with operations across nutrition, wellness, and oral care segments. In India,
it follows an overarching spirit of sustainability, whether in manufacturing or sourcing.
Sustainable manufacturing
The company’s focus on sustainability is highlighted through funding Project Green
Leap, in which it has invested around £9.6m. A few of GSK’s key initiatives to reduce
its carbon footprints in India include:
• Using waste biomass to partially replace coal as a fuel in manufacturing sites
• Energy-efficient LED lights
• Using a vapour absorption machine instead of an electrical chiller to reduce energy use
• Increased energy efficiency in equipment such as boilers
• Construction of a new 1MW biomass-based combined heat and power plant
• Building a 0.5MW roof-top solar photovoltaic plant.
GSK has also invested in rainwater harvesting systems and reuse/recycling of treated
effluent into utilities enabling water to be reused or disposed of safely. This helps
replenish groundwater.
Sustainable sourcing – milk, malt and wheat
One of GSK’s best-known brands is Horlicks, a nutritional supplement for growing
children in India. GSK estimates that about 93% of the water used across the Horlicks
India value chain is utilised in procuring and/or producing raw materials such as milk,
barley and wheat.
Understanding the importance of sustainability in its Horlicks supply chain, GSK
in partnership with The Energy and Resources Institute (TERI), assessed how to
reduce water impact in its supply chain. The assessment also included the local rural
community which supplies supply GSK with the wheat, barley, and milk used
to manufacture Horlicks.
Following the study, GSK piloted a project with a few direct raw material suppliers
which connected to the local rural community. This entailed identifying projects to
address water conservation, rainwater harvesting, wastewater treatment, groundwater
recharge, and rehabilitation of water bodies. The project involves construction of a pond
and two surface dams to hold run-off water in an area. The project demonstrates GSK’s
commitment to ensure sustainability across its supply chain.
GSK Consumer Healthcare India is listed with the Bombay Stock Exchange and National
Stock Exchange in India. GSK Plc is the majority shareholder in GSK Consumer
Healthcare India. GSK India is the manufacturer of several prominent brands in India,
including Eno, Crocin, Iodex, Otrivine, and Sensodyne. They have three manufacturing
locations in India in Punjab, Andhra Pradesh, and Haryana. All plants have the latest
certifications in sustainability indicating the company’s commitment to global quality,
environment health & safety standards.
27Section 5: Successful sustainability strategies of UK companies in India
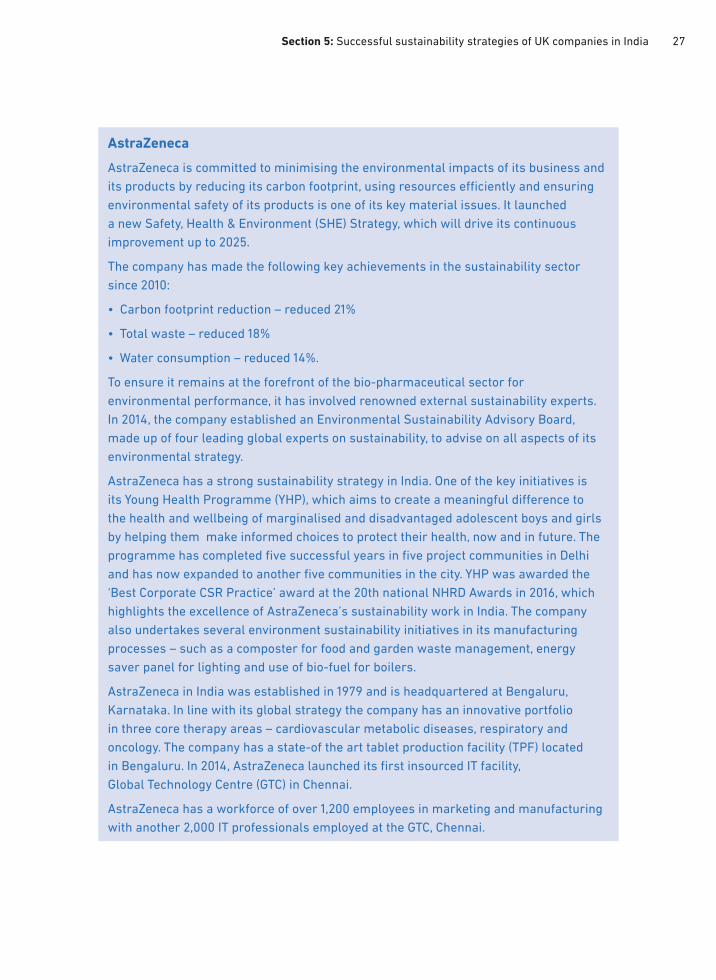
AstraZeneca
AstraZeneca is committed to minimising the environmental impacts of its business and
its products by reducing its carbon footprint, using resources efficiently and ensuring
environmental safety of its products is one of its key material issues. It launched
a new Safety, Health & Environment (SHE) Strategy, which will drive its continuous
improvement up to 2025.
The company has made the following key achievements in the sustainability sector
since 2010:
• Carbon footprint reduction – reduced 21%
• Total waste – reduced 18%
• Water consumption – reduced 14%.
To ensure it remains at the forefront of the bio-pharmaceutical sector for
environmental performance, it has involved renowned external sustainability experts.
In 2014, the company established an Environmental Sustainability Advisory Board,
made up of four leading global experts on sustainability, to advise on all aspects of its
environmental strategy.
AstraZeneca has a strong sustainability strategy in India. One of the key initiatives is
its Young Health Programme (YHP), which aims to create a meaningful difference to
the health and wellbeing of marginalised and disadvantaged adolescent boys and girls
by helping them make informed choices to protect their health, now and in future. The
programme has completed five successful years in five project communities in Delhi
and has now expanded to another five communities in the city. YHP was awarded the
‘Best Corporate CSR Practice’ award at the 20th national NHRD Awards in 2016, which
highlights the excellence of AstraZeneca’s sustainability work in India. The company
also undertakes several environment sustainability initiatives in its manufacturing
processes – such as a composter for food and garden waste management, energy
saver panel for lighting and use of bio-fuel for boilers.
AstraZeneca in India was established in 1979 and is headquartered at Bengaluru,
Karnataka. In line with its global strategy the company has an innovative portfolio
in three core therapy areas – cardiovascular metabolic diseases, respiratory and
oncology. The company has a state-of the art tablet production facility (TPF) located
in Bengaluru. In 2014, AstraZeneca launched its first insourced IT facility,
Global Technology Centre (GTC) in Chennai.
AstraZeneca has a workforce of over 1,200 employees in marketing and manufacturing
with another 2,000 IT professionals employed at the GTC, Chennai.
28 Section 6: The UK-India bilateral relationship – opportunities and challenges
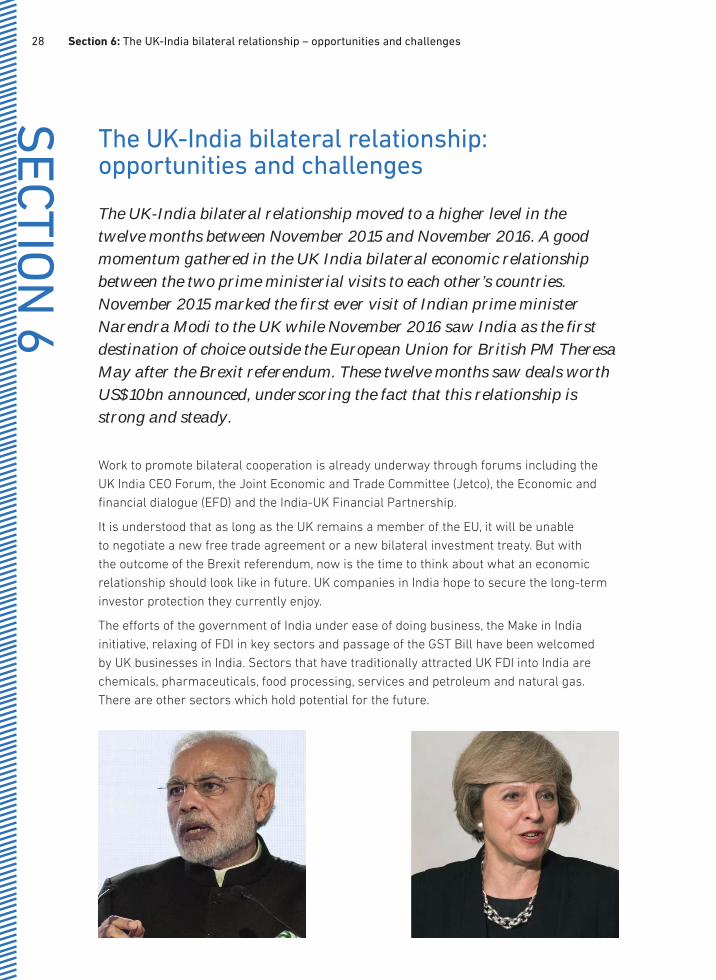
The UK-India bilateral relationship: opportunities and challenges
The UK-India bilateral relationship moved to a higher level in the twelve months between November 2015 and November 2016. A good momentum gathered in the UK India bilateral economic relationship between the two prime ministerial visits to each other’s countries. November 2015 marked the first ever visit of Indian prime minister Narendra Modi to the UK while November 2016 saw India as the first destination of choice outside the European Union for British PM Theresa May after the Brexit referendum. These twelve months saw deals worth US$10bn announced, underscoring the fact that this relationship is strong and steady.
Work to promote bilateral cooperation is already underway through forums including the
UK India CEO Forum, the Joint Economic and Trade Committee (Jetco), the Economic and
financial dialogue (EFD) and the India-UK Financial Partnership.
It is understood that as long as the UK remains a member of the EU, it will be unable
to negotiate a new free trade agreement or a new bilateral investment treaty. But with
the outcome of the Brexit referendum, now is the time to think about what an economic
relationship should look like in future. UK companies in India hope to secure the long-term
investor protection they currently enjoy.
The efforts of the government of India under ease of doing business, the Make in India
initiative, relaxing of FDI in key sectors and passage of the GST Bill have been welcomed
by UK businesses in India. Sectors that have traditionally attracted UK FDI into India are
chemicals, pharmaceuticals, food processing, services and petroleum and natural gas.
There are other sectors which hold potential for the future.S
EC
TIO
N 6

29Section 6: The UK-India bilateral relationship – opportunities and challenges
The following cross-cutting areas of work are likely to dominate business discussions
between the UK and India in the coming years:
Digital economy
The recent demonetisation move by the Indian government has nudged the country towards
a digital future. India is poised to leapfrog to a future where the majority of transactions
will be done digitally. This opens new doors for innovation and entrepreneurship, but data
security and internet penetration may be the biggest challenges. The issue of data security
is one of the main challenges in the EU-India Free Trade Agreement talks. India does not
yet have a comprehensive piece of legislation dealing with data privacy or personal data
protection, and penetration of 3G and 4G telecom services may take more time. Currently
India has a little more than 120 million 3G, 4G subscribers. According to independent
brokerage and investment group CLSA, this figure is expected to rise to 300 million
by March 2018. Similarly, the government is chasing a target of complete electrification
by the end of 2018.
Defence and technology
While the Indian government lifted the FDI cap on defence from 26% to 49% two year ago,
UK companies suggest the need to have a special section on technology cooperation for the
high-tech sector in any future trade and investment agreement between the two countries.
It’s felt that both countries have the capacity to ‘co-create’ technology and this is a potential
that needs to be harnessed by future policymakers – mainly in areas of high-speciality
such as defence.
Education and immigration
Higher education is one of the most valued UK exports to India. The CBI’s recent UK/India
higher education report Bridges to the future mentions CBI support for the view that future
trade arrangements should give businesses prospects for growth and an approach to
migration that supports the economy but also addresses public concerns. Evidence shows
that students coming to the UK are not a major factor in public concern over migration,
which is why it is important for the UK to be seen as open to the best and the brightest.
While some of the new sectors for growth and areas with cross-cutting challenges have
been identified, other sectors which have not received adequate attention in the past but
have great potential are travel, tourism and hospitality, healthcare and deeper liberalisation
of the insurance sector. The CEO Forum, JETCO, EFD and the India UK Financial Partnership
are already involved in several strands of work across major sectors.

30 Methodology
Methodology
Research was carried out by Indian market research firm Kantar IMRB using a combination
of primary and secondary research. It interviewed 127 British companies with operations in
India and extrapolated data to reflect a total of 550 companies. Kantar also utilised available
data on sector-based FDI inflows in India and total number of jobs created in each sector
through FDI investment during the period 2007-2012, to estimate the total number of jobs
generated by foreign companies in India. These estimates were further extrapolated for the
period 2000-2016.
Kantar IMRB estimates that around eight to ten people get direct employment as a result
of each US$1m invested into India via the FDI route (Exhibit 15).
Exhibit 15: Sector-wise jobs norms calculation
Sector Equity FDI (US$ m)(2007–12)
Jobs created (‘000)(2007-12)
Jobs created(per US$1m)
Infrastructure 17.21 191.24 11.11
Cleantech 3.01 5.58 1.86
Energy 13.20 12.56 0.95
Automotive 20.55 219.16 10.67
Chemicals 5.18 32.11 6.20
Consumer goods 6.68 117.26 17.55
Industrials 14.53 205.20 14.12
Metals and mining 34.08 87.94 2.58
Business & financial services 11.36 181.47 15.97
TMT 21.22 268.01 12.63
Life sciences 5.18 26.52 5.12
Aerospace 1.67 12.56 7.52
Logistics 13.20 36.29 2.75
Total 167.07 1,395.90 8.36
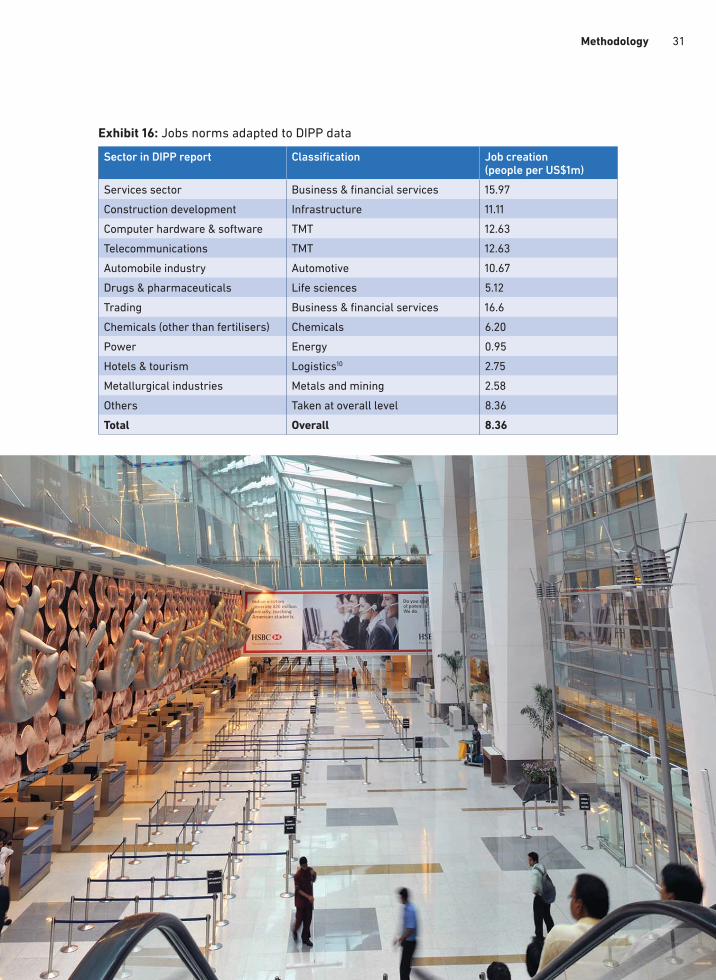
The above sectoral job norms were matched to sectors in DIPP report (Exhibit 16).
31Methodology
Exhibit 16: Jobs norms adapted to DIPP data
Sector in DIPP report Classification Job creation(people per US$1m)
Services sector Business & financial services 15.97
Construction development Infrastructure 11.11
Computer hardware & software TMT 12.63
Telecommunications TMT 12.63
Automobile industry Automotive 10.67
Drugs & pharmaceuticals Life sciences 5.12
Trading Business & financial services 16.6
Chemicals (other than fertilisers) Chemicals 6.20
Power Energy 0.95
Hotels & tourism Logistics10 2.75
Metallurgical industries Metals and mining 2.58
Others Taken at overall level 8.36
Total Overall 8.36

32 Annexe
Annexe
Here are some key initiatives taken by the Indian government in 2005-2006 to incentivise FDI
inflows into India.
a) To allow under the automatic route, FDI up to 100%, for:
• Distillation and brewing of potable alcohol
• Manufacture of industrial explosives
• Manufacture of hazardous chemicals
• Manufacturing activities located within 25km of the Standard Urban Area limits which
require industrial license under the Industries (Development & Regulation) Act 1951
• Setting up green-field airport projects
• Laying of natural gas/LNG pipelines, market study and formulation and investment financing
in the petroleum and natural gas sector
• Cash & carry wholesale trading and export trading.
b) To increase FDI caps to 100% and permit it under the automatic route for:
• Coal and lignite mining for captive consumption
• Setting up infrastructure relating to marketing in petroleum & natural gas sector
• Exploration and mining of diamonds & precious stones.
c) To allow FDI up to 100% under the automatic route in:
• Power trading subject to compliance with regulations under the Electricity Act, 2003
• Processing and warehousing of coffee and rubber. Page 1 of 11.
d) To allow FDI up to 51 % with prior government approval for retail trade of ‘single brand’
products. FDI up to 51% in retail trade of ‘single brand’ products would be subject to the
following conditions:
• Products to be sold should be of a ‘single brand’ only
• Products should be sold under the same brand internationally
• ‘Single brand’ product-retailing would cover only products which are branded
during manufacturing.
e) To allow under the automatic route transfer of shares from residents to non-residents in
financial services, and where Securities & Exchange Board of India (Substantial Acquisition
and Takeover) Regulations are attracted, in cases where approvals are required from the
Reserve Bank of India/Securities & Exchange Board of India (Substantial Acquisition and
Takeover) Regulations /Insurance Regulatory & Development Authority. With this, transfer
of shares from residents to non-residents, including acquisition of shares in an existing
company would be on the automatic route subject to sectoral policy on FDI.
f) To dispense with the requirement of mandatory divestment of 26% foreign equity
in B2B e-Commerce.
Source: (Press note No. 4 (2006 Series) of DIPP. Subject: rationalisation of the FDI policy

33About Kantar IMRB
About
Kantar IMRB
Kantar IMRB is a multi-country market research, survey and business consultancy firm that
offers a range of syndicated data and customised research services. Headquartered in Mumbai
and with operations in over 15 countries, IMRB is a part of the Kantar Group – WPP’s research,
insights and consultancy network.
Established in 1970, Kantar IMRB was modelled on the lines of the British Market Research
Bureau. Kantar IMRB is now a leading provider of market research and insights across south
Asia, the Middle East and north Africa with specialist divisions in quantitative, qualitative,
media, retail, industrial, customer satisfaction, business to business and social and rural
research. Kantar IMRB’s syndicated research offerings include the MarketPulse, the National
Food Survey, Web Audience Measurement (WAM), ITops, and I-Cube reports.
With over 1,200 employees, Kantar IMRB is one of the largest providers of market research
in India in an industry estimated at a minimum of $187m. As the oldest extant market research
company in India, Kantar IMRB has been responsible for establishing the first and only
household panel, the first television audience measurement system and the first radio panel
in the country and has played a key role in the development of market research in India. It has
been rated the ‘Best market research company’ by MRSI, an industry body for several years.
Kantar IMRB’s specialised areas are consumer markets, industrial marketing,
business-to-business marketing, social marketing and rural marketing.
B2B & Industrial team of Kantar IMRB provides market research and consulting services
to B2B and industrial markets. With its repository of knowledge and understanding gained
through studying diverse sectors for several years, this team provides market perspective for
sound decision making. It is the only team of its kind that provides research-based consultancy
to corporates.
At the macro level, B2B & Industrial team offers services covering industry trends, regulatory
environment, economic scenario, international trade and market overview. At the micro level,
it offers services such as product positioning, market segmentation, channel perception,
market sizing, pricing, distribution strategy, product development assistance, product testing,
market forecasting, partner identification, business relationship check, business/industry
overview market diagnostics, corporate image and competitive intelligence. It helps clients
right through the product lifecycle from product development to launching it in the market
to making it successful.
Apart from several syndicated studies, B2B & Industrial team offers research services
to meet clients’ specific requirements. While researching the buyers, users, influencers,
installers, traders, marketers, importers, exporters and manufacturers of the product,
it keeps global perspective of the market situation.
B2B and industrial team services private sector, public sector, government departments
and multilateral agencies. It has clients in all five continents.
www.http://mrbglobal.in/
34 About CBI India
CBI India
The full-time India office of the CBI opened in 2012 in New Delhi, reflecting the importance
of the bilateral economic relationship between India and the UK. The New Delhi office provides
a base from which the CBI can promote members’ interest to an Indian audience.
The CBI in India offers its members the following services:
Information and advice
• Independent, on-the-ground, economic, business and political analysis of the key issues
facing companies in India
• Members receive the CBI’s monthly newsletter India Update
• Company-specific advice is provided through email, in-market and on visits to the UK.
Policy and regulatory issues
Provides a voice to members in India on business matters, in meetings with Indian government
officials and by feeding into UK and EU lobbying activities
Events and networking
• Quarterly briefing of CBI members by the British High Commissioner to India
• Company-specific workshops and roundtable meetings
• Events in partnership with the Foreign and Commonwealth Office, UK India Business Council.
UK Trade and Investment and Indian trade organisations
• Special forums to help members with specific in-market needs.
India-related CBI projects
• Sterling assets India: UK investments creating Indian jobs – published for the first time
for India in 2015
• India was part of the international itinerary for the CBI Leadership Programme delegates
in 2016, for the first time
• The second India Banquet held in London on 29 June 2016
• Yearly India budget podcast by head of KPMG India at Cannon Place, London.
More information:
Shehla Hasan
Country head and policy director, CBI India
E: [email protected]/T: +91 11 3019 4126
Siddhartha Thyagarajan
Policy adviser, CBI India

References
1 Re-investment refers to the reinvestment of earnings. Retained earnings refer to the percentage of net earnings not paid out as dividends, but retained by the company to be reinvested in its core business, or to pay debt. For FDI, reinvestment would imply that earnings in target country are retained in the target country and not repatriated to the home country
2 The first edition of Sterling assets had reported that around 138,000 jobs were created by the UK FDI directly between April 2000 and March 2015. Investments via offshore financial centres and re-investment had not been taken into consideration then
3 Jobs created by UK FDI in India is subset of the total number of people employed by UK companies in India.Total number of people employed by UK companies in India is based on 2015 estimates and interviews conducted in 2016
4 Calculations are based on FDI investment from country multiplied with average job norm factor(EY classification): 8.36 jobs per US$1m investment. Please see methodology section for more clarifications.Job numbers have been rounded off
5 United Nations Conference on Trade & Development
6 Department of Industrial Policy & Promotion, government of India
7 Foreign Investment Promotion Board
8 An Indian company would have indirect foreign investment if the Indian investing company has foreign investment in it. The method of calculation of total foreign investment in an Indian company including indirect foreign investment through other Indian companies has been detailed out in entry 10 of Press Note 2 (2000), Press Note 1 (2006), Press Note 3 (2007) and entry 24 of Press Note 7 (2008) of DIPP
9 According to DIPP’s country-wise report, FDI investment is mentioned only for top five sectors. For the UK,FDI investment of 4,923.98 US$m is mentioned under others and it could be either services or manufacturingor any other sector. It is multiplied by the average job norm of 6.54 (jobs per US$1m) for the remaining sectorsto achieve the total number of jobs created in the other category. However, the sector-wise FDI investment details investment in all sectors from all countries in India. Jobs mentioned under other category for UKcould be either from services or manufacturing or any other sector
10 According to the economic survey of India, services are classified under three categories: financial, real-estate/professional services etc, trade, hotels, transport & communication, public administration, defence and other services. Logistics is not mentioned in the DIPP report but is mentioned in EY’s classification. This report has used the economic survey of India basis and kept logistics under the ‘hotel & tourism’ heading

www.cbi.org.uk
For further information on this report,or for a copy in large text format contact:
Shehla Hasan Country head and policy director, CBI India
T: +91 11 3019 4126E: [email protected]
Product code: 11665
February 2017
© Copyright CBI 2017
The content may not be copied,
distributed, reported or dealt
with in whole or in part without
prior consent of the CBI.
www.cbi.org.uk