Stereotypes of Age Differences in Personality Traits ...wyc/chan_mccrae-2012.pdf · Age...
17
Stereotypes of Age Differences in Personality Traits: Universal and Accurate? Wayne Chan National Institute on Aging Robert R. McCrae Baltimore, Maryland Filip De Fruyt Ghent University Lee Jussim Rutgers University Corinna E. Löckenhoff Cornell University Marleen De Bolle Ghent University Paul T. Costa Jr. and Angelina R. Sutin National Institute on Aging Anu Realo University of Tartu Ju ¨ri Allik University of Tartu and the Estonian Academy of Sciences Katsuharu Nakazato Iwate Prefectural University Yoshiko Shimonaka Bunkyo Gakuin University Martina Hr ˇebı ´c ˇkova ´ and Sylvie Graf Academy of Sciences of the Czech Republic Michelle Yik Hong Kong University of Science and Technology Marina Brunner-Sciarra Cayetano Heredia University Nora Leibovich de Figueora and Vanina Schmidt University of Buenos Aires Chang-kyu Ahn Pusan National University Hyun-nie Ahn Ewha Womans University Maria E. Aguilar-Vafaie Tarbiat Modares University Jerzy Siuta and Barbara Szmigielska Jagiellonian University Thomas R. Cain Hampshire College Jarret T. Crawford The College of New Jersey Khairul Anwar Mastor Universiti Kebangsaan Malaysia Jean-Pierre Rolland Universite ´ Paris Ouest Nanterre La De ´fense Florence Nansubuga Makerere University Daniel R. Miramontez San Diego Community College District Veronica Benet-Martı ´nez Pompeu Fabra University Je ´ro ˆme Rossier University of Lausanne Denis Bratko University of Zagreb Iris Marušic ´ Institute for Social Research in Zagreb Jamin Halberstadt and Mami Yamaguchi University of Otago Journal of Personality and Social Psychology © 2012 American Psychological Association 2012, Vol. ●●, No. ●, 000–000 0022-3514/12/$12.00 DOI: 10.1037/a0029712 1
Transcript of Stereotypes of Age Differences in Personality Traits ...wyc/chan_mccrae-2012.pdf · Age...

Stereotypes of Age Differences in Personality Traits:Universal and Accurate?
Wayne ChanNational Institute on Aging
Robert R. McCraeBaltimore, Maryland
Filip De FruytGhent University
Lee JussimRutgers University
Corinna E. LöckenhoffCornell University
Marleen De BolleGhent University
Paul T. Costa Jr. and Angelina R. SutinNational Institute on Aging
Anu RealoUniversity of Tartu
Juri AllikUniversity of Tartu and the Estonian Academy of Sciences
Katsuharu NakazatoIwate Prefectural University
Yoshiko ShimonakaBunkyo Gakuin University
Martina Hrebıckova and Sylvie GrafAcademy of Sciences of the Czech Republic
Michelle YikHong Kong University of Science and Technology
Marina Brunner-SciarraCayetano Heredia University
Nora Leibovich de Figueora and Vanina SchmidtUniversity of Buenos Aires
Chang-kyu AhnPusan National University
Hyun-nie AhnEwha Womans University
Maria E. Aguilar-VafaieTarbiat Modares University
Jerzy Siuta and Barbara SzmigielskaJagiellonian University
Thomas R. CainHampshire College
Jarret T. CrawfordThe College of New Jersey
Khairul Anwar MastorUniversiti Kebangsaan Malaysia
Jean-Pierre RollandUniversite Paris Ouest Nanterre La Defense
Florence NansubugaMakerere University
Daniel R. MiramontezSan Diego Community College District
Veronica Benet-MartınezPompeu Fabra University
Jerome RossierUniversity of Lausanne
Denis BratkoUniversity of Zagreb
Iris MarušicInstitute for Social Research in Zagreb
Jamin Halberstadt and Mami YamaguchiUniversity of Otago
Journal of Personality and Social Psychology © 2012 American Psychological Association2012, Vol. ●●, No. ●, 000–000 0022-3514/12/$12.00 DOI: 10.1037/a0029712
1

Goran KneževicBelgrade University
Thomas A. MartinSusquehanna University
Mirona GheorghiuQueens University
Peter B. SmithUniversity of Sussex
Claudio BarbaranelliLa Sapienza University
Lei WangPeking University
Jane Shakespeare-FinchQueensland University of Technology
Margarida P. LimaUniversity of Coimbra
Waldemar Klinkosz and Andrzej SekowskiJohn Paul II Catholic University of Lublin
Lidia Alcalay and Franco SimonettiPontificia Universidad Catolica de Chile
Tatyana V. AvdeyevaUniversity of St. Thomas
V. S. PramilaAndhra University
Antonio TerraccianoNational Institute on Aging
Wayne Chan, National Institute on Aging, Baltimore, Maryland; RobertR. McCrae, Baltimore, Maryland; Filip De Fruyt, Department of Devel-opmental, Personality, and Social Psychology, Ghent University, Ghent,Belgium; Lee Jussim, Department of Psychology, Rutgers University;Corinna E. Löckenhoff, Department of Human Development, CornellUniversity; Marleen De Bolle, Department of Developmental, Personality,and Social Psychology, Ghent University; Paul T. Costa Jr. and AngelinaR. Sutin, National Institute on Aging; Anu Realo, Department of Psychol-ogy, University of Tartu, Tartu, Estonia; Juri Allik, Department of Psy-chology, University of Tartu and the Estonian Academy of Sciences,Tallinn, Estonia; Katsuharu Nakazato, Faculty of Social Welfare, IwatePrefectural University, Iwate, Japan; Yoshiko Shimonaka, Department ofHuman Studies, Bunkyo Gakuin University, Bunkyo, Japan; MartinaHrebıckova and Sylvie Graf, Institute of Psychology, Academy of Sciencesof the Czech Republic, Prague, Czech Republic; Michelle Yik, Division ofSocial Science, Hong Kong University of Science and Technology, Kow-loon, Hong Kong; Marina Brunner-Sciarra, Faculty of Psychology, Cay-etano Heredia University, Lima, Peru; Nora Leibovich de Figueora andVanina Schmidt, Department of Psychology, University of Buenos Aires,Buenos Aires, Argentina; Chang-kyu Ahn, Department of Education, Pu-san National University, Busan, South Korea; Hyun-nie Ahn, Departmentof Psychology, Ewha Womans University, Seoul, South Korea; Maria E.Aguilar-Vafaie, Department of Psychology, Tarbiat Modares University,Tehran, Iran; Jerzy Siuta and Barbara Szmigielska, Institute of Psychology,Jagiellonian University, Krakow, Poland; Thomas R. Cain, School ofCognitive Science, Hampshire College; Jarret T. Crawford, Department ofPsychology, The College of New Jersey; Khairul Anwar Mastor, School ofGeneral Studies, Universiti Kebangsaan Malaysia, Bangi, Malaysia; Jean-Pierre Rolland, UFR STAPS, Universite Paris Ouest Nanterre La Defence,Nanterre, France; Florence Nansubuga, Institute of Psychology, MakerereUniversity, Kampala, Uganda; Daniel R. Miramontez, Office of Institu-tional Research and Planning, San Diego Community College District;Veronica Benet-Martınez, Department of Political and Social Sciences,Pompeu Fabra University, Barcelona, Spain; Jerome Rossier, Institute ofPsychology, University of Lausanne, Lausanne, Switzerland; Denis
Bratko, Department of Psychology, University of Zagreb, Zagreb, Croatia;Iris Marušic, Institute for Social Research in Zagreb, Zagreb, Croatia;Jamin Halberstadt and Mami Yamaguchi, Department of Psychology,University of Otago, Dunedin, New Zealand; Goran Kneževic, Departmentof Psychology, Belgrade University, Belgrade, Serbia; Thomas A. Martin,Department of Psychology, Susquehanna University; Mirona Gheorghiu,School of Psychology, Queens University, Belfast, United Kingdom; PeterB. Smith, School of Psychology, University of Sussex, Falmer, UnitedKingdom; Claudio Barbaranelli, Department of Psychology, La SapienzaUniversity, Rome, Italy; Lei Wang, Department of Psychology, PekingUniversity, Beijing, China; Jane Shakespeare-Finch, School of Psychologyand Counseling, Queensland University of Technology, Brisbane, Austra-lia; Margarida P. Lima, Faculty of Psychology and Educational Science,University of Coimbra, Coimbra, Portugal; Waldemar Klinkosz and An-drzej Sekowski, Department of Psychology, John Paul II Catholic Univer-sity of Lublin, Lublin, Poland; Lidia Alcalay and Franco Simonetti, Es-cuela de Psicologıa, Pontificia Universidad Catolica de Chile, Santiago,Chile; Tatyana V. Avdeyeva, Graduate School of Professional Psychology,University of St. Thomas; V. S. Pramila, Department of Psychology,Andhra University, Visakhapatnam, India; Antonio Terracciano, NationalInstitute on Aging.
This research was supported in part by the Intramural Research Programof the National Institutes of Health, National Institute on Aging. Robert R.McCrae and Paul T. Costa Jr. receive royalties from the NEO Inventories.Anu Realo and Juri Allik were supported by Estonian Ministry of Educa-tion and Science Grant SF0180029s08. Martina Hrebıckova and SylvieGraf were supported by Czech Science Foundation Grant P407/10/2394.Portions of this research were presented at the 13th Annual Meeting of theSociety for Personality and Social Psychology, January 26–28, 2012, SanDiego, CA, and at the 16th European Conference on Personality, July10–14, 2012, Trieste, Italy. We thank Christopher J. Soto for providingmean scores.
Correspondence concerning this article should be addressed to WayneChan or Antonio Terracciano, National Institute on Aging, 251 BayviewBoulevard, Suite 100, Baltimore, MD 21224. E-mail: [email protected] or [email protected]
2 CHAN ET AL.

Age trajectories for personality traits are known to be similar across cultures. To address whether stereotypesof age groups reflect these age-related changes in personality, we asked participants in 26 countries (N �3,323) to rate typical adolescents, adults, and old persons in their own country. Raters across nations tendedto share similar beliefs about different age groups; adolescents were seen as impulsive, rebellious, undisci-plined, preferring excitement and novelty, whereas old people were consistently considered lower onimpulsivity, activity, antagonism, and Openness. These consensual age group stereotypes correlated stronglywith published age differences on the five major dimensions of personality and most of 30 specific traits, usingas criteria of accuracy both self-reports and observer ratings, different survey methodologies, and data fromup to 50 nations. However, personal stereotypes were considerably less accurate, and consensual stereotypestended to exaggerate differences across age groups.
Keywords: aging, stereotypes, cross-cultural, five factor model, personality perception
Supplemental materials: http://dx.doi.org/10.1037/a0029712
Laypersons often have intuitive notions of life span develop-ment, influenced by literary, philosophical, and media repre-sentations, as well as their personal observations. They canreadily report their beliefs on the social, emotional, physical,and cognitive features of adolescents, adults, and old persons(e.g., Buchanan & Holmbeck, 1998; Gruhn, Gilet, Studer, &Labouvie-Vief, 2011; Löckenhoff et al., 2009), and these ste-reotypes are thought to contribute to societal attitudes andprejudices toward these groups (Nelson, 2002; Zebrowitz &Montepare, 2000). In this article, we quantify the perceivedpersonality trait profiles of adolescents, adults, and the oldusing a comprehensive measure of the five-factor model (FFM)of personality (Digman, 1990). We assess perceptions of theseage groups in 26 countries around the world to test whetherthese views are culture-bound or universal, and we evaluate theaccuracy of stereotypes of age differences.
Research on age stereotypes generally asks participants to listattributes that describe a group. These free-response assess-ments have revealed multifaceted beliefs regarding adolescentsand the elderly. For example, the elderly are described asdemanding but kind (Hummert, 1990; Hummert, Garstka,Shaner, & Strahm, 1994), and pitiful and not particularly capa-ble (Fiske, Cuddy, Glick, & Xu, 2002). Adolescents have beendescribed as rebellious and moody (Gross & Hardin, 2007), yethardworking and intelligent (Buchanan & Holmbeck, 1998). Inorder to encompass these multifaceted beliefs in a comprehen-sive personality profile, we used the FFM framework, whichproposes that personality traits can be organized into five dis-tinct domains, namely, Neuroticism, Extraversion, Openness toExperience, Agreeableness, and Conscientiousness. Each do-main can be further divided into lower order facets (Costa &McCrae, 1995). The structure of the FFM has been shown toreplicate across age, gender, and culture (McCrae, 2004). Thus,by using a common measure of personality perception, we candetermine whether adolescent boys and girls, men and women,and old men and old women are consistently perceived to differacross the full range of personality traits.
A number of studies have tested the hypothesis that raters indifferent cultures have substantially different views of adoles-cents and the old (Boduroglu, Yoon, Luo, & Park, 2006; Yun &Lachman, 2006). Social stereotypes of the elderly vary widelyamong different ethnic groups (Liu, Ng, Loong, Gee, & Weath-erall, 2003), as do cultural ideals and practices surrounding
elder care and treatment (Harvey & Yoshino, 2006). Nationalgroups also vary in their perception and treatment of adoles-cents; Americans used more socially negative words to describeadolescents than did the Chinese (Boduroglu et al., 2006), andmothers’ reactions to hyperactive boys differ cross-culturally(Gidwani, Opitz, & Perrin, 2006). Personality stereotypes ofdifferent age groups, however, may be more similar acrossnations (N. Haslam, Bastian, Fox, & Whelan, 2007; Igier &Mullet, 2003). In particular, Cuddy, Norton, and Fiske (2005)found that stereotypes of the old as high in warmth and low incompetence generalized to six different nations. Furthermore,age-linked social role influences on personality perception,such as marriage and child rearing (Wood & Roberts, 2006), arelikely to be similar across cultures. We further develop thisresearch area by assessing stereotypes about different agegroups with an FFM measure of the five major factors and 30facets in samples from 26 countries. We aim to determine thecontent and consistency of age stereotypes across cultures andcompare the relative strength of age and culture on such per-sonality stereotypes.
By using the FFM, we can also evaluate stereotype accuracyby comparing stereotypical perceptions with published self-reported and observer-rated personality data for each age group.Measures of assessed personality differences across the lifespan show patterns that are similar across cultures (Donnellan& Lucas, 2008; Lucas & Donnellan, 2009; McCrae et al., 2004;McCrae, Terraciano, et al., 2005; Soto, John, Gosling, & Potter,2011). The age differences seen in cross-sectional studies aresimilar to the age trajectories observed in longitudinal studies(Lucas & Donnellan, 2011; Roberts, Walton, & Viechtbauer,2006; Terracciano, McCrae, Brant, & Costa, 2005). Roughlyspeaking, Extraversion, Openness, and Neuroticism generallydecline, and Agreeableness and Conscientiousness generallyincrease, during most of the adult life span. However, thestrength and direction of these age effects are less clear forsome personality factors during some portions of the life span,such as at old age. For example, some studies find Opennessdeclining through adulthood (Donnellan & Lucas, 2008; Lucas& Donnellan, 2011; McCrae et al., 2005; Specht, Egloff, &Schmukle, 2011; Terracciano, McCrae, Martin, & Costa, 2005),but others report relative stability (Roberts et al., 2006), or evenincreases (Soto et al., 2011). There are also mixed findings onwhether Conscientiousness linearly increases through age (Rob-
3PERSONALITY STEREOTYPES OF AGING

erts et al., 2006; Soto et al., 2011) or peaks in middle age andthen declines (Donnellan & Lucas, 2008; Lucas & Donnellan2011; Terracciano, McCrae, et al., 2005). Given these discrep-ancies in the literature, we use data from multiple publishedstudies to evaluate the accuracy of age stereotypes.
Do perceived age differences in personality accurately matchactual age differences, or are they baseless stereotypes? Liter-ature on the accuracy of personality stereotypes might supporteither hypothesis. On the one hand, FFM assessments of genderstereotypes roughly match actual sex differences in personalityacross cultures (Williams, Satterwhite, & Best, 1999); on theother hand, previous work generally found little correspondencebetween stereotypes of national character and mean levels ofpersonality in a particular country (Terracciano, Abdel-Khalek,et al., 2005; but see Realo et al., 2009; Rogers & Wood, 2010).Perhaps age stereotypes are exaggerated, but have a kernel oftruth (Jussim, 2012; Jussim, McCauley, & Lee, 1995). A fewstudies have assessed the trajectory of age stereotypes within asingle country, focusing on the five major factors of personal-ity. In the United States, 68-year-old targets were rated loweron Neuroticism and Extraversion, and higher on Openness,Agreeableness, and Conscientiousness, compared with 17-year-olds, 28-year-olds, and 45-year-olds (Wood & Roberts, 2006).However, in another American sample, participants rated 69-year-old targets lower on Openness and Conscientiousnesscompared with 41-year-old and 22-year-old targets (Slotter-back, 1996), but no differences were found for the other threefactors. Australian raters perceived age-normative linear de-clines for Neuroticism, Extraversion, and Openness, and in-creases for Agreeableness and Conscientiousness (Haslam etal., 2007). French participants additionally perceived curvilin-ear age differences, where the age-normative trends abovereversed directions for very old (85-year-old) targets on allfactors save Openness (Igier & Mullet, 2003). In the presentstudy, we extend this work by examining the accuracy of agestereotypes across a large number of cultures.
Study Design
There are two senses in which psychologists use the termstereotype (Jussim, 2012). Consensual stereotypes refer to col-lective beliefs about a target group, whereas personal stereo-types—what Haslam and Wilson (2000) called personal be-liefs—refer to the views that a single person has about a group.Issues of universality and accuracy should be addressed at bothlevels, but the main focus of the present study was on consen-sual stereotypes of age groups, operationalized as the mean ofa sample of personal stereotypes. Thus, we were concerned withsuch questions as “Do Chileans in general hold the same beliefsabout personality in the old as Estonians, and are these beliefscorrect?”
In an ideal design, the personal stereotypes sampled would berepresentative of all members of a country, as would the criteria,personality trait assessments. The same instrument would be usedto assess traits and stereotypes of traits, so that they would bedirectly comparable, and the same countries would provide data onperceptions and assessed traits (e.g., Allik, Mottus, & Realo, 2010;Realo et al., 2009). However, the data for such an ideal design toassess age stereotypes are not yet available. Therefore, in this
study we make a series of assumptions that allow us to estimateuniversality and accuracy of age stereotypes, and we test many ofthese assumptions by using a variety of data sources. Convergenceacross these different analyses should give confidence in theconclusions.
In this study, we assessed personality perceptions of the typicaladolescent, adult, and older person, using an FFM measure, in-cluding lower order facets, in 26 countries across the globe. Todefine the boundaries of each age group, we also asked ourparticipants to report their perceptions on the beginning and endage for adolescence, adulthood, and old age (cf. Toothman &Barrett, 2011). We evaluated the relative contributions of targetage, gender, and culture to perceptions of personality, and theextent to which age stereotypes generalized across cultures. Wethen quantified the relationship of the stereotypical perceptionsassessed in the present study with self-reports and observer ratingsof personality traits from published studies, on the consensual aswell as the personal level.
The present design contributes to the literature on age-basedpersonality stereotypes in several theoretically important ways.First, our cross-national study systematically measures the contentand consistency of age-based personality stereotypes in 26 geo-graphically and culturally diverse countries, and may help settlecontroversy regarding the degree to which these stereotypes differacross countries. By extension, this research may shed light on therole of cultural ideals and practices in lay personality perception.Second, in extant research on personality stereotypes, few studieshave examined lower order facets of personality. Because age-based personality differences vary among lower order facetswithin the same factor (Roberts et al., 2006; Soto et al., 2011;Terracciano, McCrae, et al., 2005), an assessment of age stereo-types and accuracy beyond the five major factors provides morenuanced information than available from previous research. Fi-nally, we go beyond previous qualitative assessments of the accu-racy of age stereotypes by statistically comparing our data withmultiple criterion samples, allowing quantitative conclusionsabout stereotype accuracy.
Method
Procedure
Participants from 26 countries1 (N � 3,470) completed thequestionnaires in the primary (or official) language of their locale.These participants were previously described in detail in Löcken-hoff et al. (2009). One hundred forty-seven participants wereexcluded on the basis of data quality (incomplete surveys orevidence of random responding), leaving 3,323 participants in thepresent study (N per site � 49–283, Mdn N per site � 100; see
1 In this article, we use country or nation to refer to the political units inour sample, including the Hong Kong Special Administrative Region of thePeople’s Republic of China. Although we are fully aware that Hong Kongis not a country separate from Mainland China, linguistic, political, andsociocultural differences between the two regions justify analysis of HongKong separately from Mainland China.
4 CHAN ET AL.

Table 1). About two thirds of participants were female and mostwere in their early 20s, except for subsamples in Italy, SouthKorea, and the United States. They were assigned either males orfemales as targets then rated the personality traits of the typicaladolescent, adult, and old person in their country in counterbal-anced order.
Participants also reported their perceptions of the beginning andend ages of adolescence, adulthood, and old age with responses tosingle items: “What age do you consider [age group]? From XX toYY.” Adolescence was perceived to start at a median age of 13 (M �13.38, SD � 2.72) years and end at a median age of 19 (M � 20.28,SD � 3.90) years. Adulthood was perceived to start at 21 (M � 22.70,SD � 4.92) years and end at 59 (M � 56.79, SD � 13.68) years. Oldage was perceived to start at 60 (M � 59.72, SD � 8.50) years. Table1 lists age perception means by country. In analyses comparing agestereotypes with actual age differences in self-report personality data,these perceived age cutoffs were used to categorize previously pub-lished data into one of the three age groups.
Measures
National Character Survey. Stereotypes about the three agegroups were assessed using the National Character Survey (NCS;Terracciano, Abdel-Khalek, et al., 2005), which consists of 30bipolar items corresponding to the 30 facets of the Revised NEOPersonality Inventory (NEO-PI-R; Costa & McCrae, 1992). NCSdomain scores are calculated by summing six facets for each of thefive factors. In order to facilitate comparison with previouslypublished data, raw scores on the NCS were transformed toT-scores2 using norms based on stereotype ratings of the typicalmember of one’s own country, without any specification of age orgender, collected from 49 different countries (Terracciano, Abdel-Khalek, et al., 2005). Thus, in this article we express ratings of thetypical male or female of a given age in a specific country relativeto ratings of people in general. (Using norms from the presentsample did not substantially change findings.)3
Comparison data. To provide quantitative estimates of theaccuracy of perceived age differences in personality, we used self-reports and observer ratings for different age groups drawn from theprior literature. Specifically, we used personality self-reports on thedomain level from nationally representative samples in Britain andGermany (Donnellan & Lucas, 2008), self-reports of domains andsome facets from a large Internet sample in English-speaking coun-tries (Soto et al., 2011), self-reports on domain and facet levels froma cross-sectional sample in the United States (McCrae, Martin, &Costa, 2005), and observer ratings of personality on the facet levelfrom a large cross-national study (McCrae, Terracciano, et al., 2005).All data sources reported T-scores in the original publication.
In the nationally representative British and German samples(Donnellan & Lucas, 2008), personality was assessed using a15-item version of the Big Five Inventory (John & Srivastava,1999). Participants completed the personality measure in English(British sample) or German (German sample). On the basis of theage cutoffs reported in the present study, we used the 16–19 agegroup as the adolescent self-reported personality (British N �1,007; German N � 1,344), aggregated the 20–29, 30–39, 40–49,and 50–59 age groups as the adult self-reported personality (Brit-ish N � 7,433; German N � 14,126), and aggregated the 60–69,
70–79, and 80–85 age groups as the old self-reported personality(British N � 3,381; German N � 5,379).
Soto et al. (2011) reported data from a volunteer sample ofInternet survey participants from English-speaking countries (theUnited States, Canada, the United Kingdom, Ireland, Australia,and New Zealand). Participants rated their own personality usingthe 44-item version of the Big Five Inventory, which includes thefive major domains of personality and can be used to assess 10 ofthe 30 facets of the NEO-PI-R (Soto & John, 2009). Again, usingage cutoffs derived from the present study, we aggregated the datainto adolescents (13–20, N � 540,934, age M � 17.34), adults(21–59, N � 704,191, age M � 31.93), and the old (60–65, N �8,797, age M � 61.86).
To establish the correspondence of the NCS with self-reportedpersonality across all 30 facets, we compared our data with resultsfrom an American cross-sectional study using the NEO PersonalityInventory-3 (NEO-PI-3), a revision of the NEO-PI-R (McCrae,Martin, & Costa, 2005). This sample has a broad age span, rangingfrom 14 to 90 years, with respondents in the age range 18–30overrepresented by design. We aggregated the self-report data intoadolescents (14–20, N � 500, age M � 17.62), adults (21–59, N �526, age M � 37.57), and the old (60�, N � 109, age M � 69.10).
In addition to evaluating stereotype accuracy relative to self-report data, we also drew on observer ratings. Specifically, wecompared perceptions of adolescents and adults in the presentsample with NEO-PI-R personality ratings of students (M � 19.8years, N � 5,095) and adults (M � 49.9 years, N � 6,128) byobservers who knew these individuals well (McCrae, Terracciano,et al., 2005). That study reported data from 50 countries, and, likethe present sample, included both English- and non-English-speaking samples.
Analyses of Accuracy
To quantify accuracy within each trait, it is necessary to com-pare mean stereotype scores with mean observed trait scores for
2 T-scores, familiar to personality assessors, are mathematically equiv-alent linear transformations of z scores, with a mean of 50 and standarddeviation of 10. Both metrics are indicated in the figures.
3 In comparing stereotypes and personality assessments, a particularlyimportant consideration is the use of a common metric. Because differentinstruments are used, raw scores cannot be compared, and it is necessary tostandardize all scores using appropriate norms before making comparisons.This is the usual procedure when personality assessments are comparedacross instruments, but it is arguable that the norms used to standardizestereotype ratings may differ systematically from those used to standardizeself-reports: Variance may be substantially lower in stereotype ratings,because all personal stereotypes may agree strongly on each target group’scharacteristics. Under that scenario, standardized age differences in stereo-type scores would appear to be exaggerated.
Fortunately, that objection can be addressed. The NCS has been used inother studies for both self-reports and ratings of typical group members. Inone study (Allik, Mottus, & Realo, 2010), self-reports of Russians andratings of the typical Russian were gathered. Across 30 trait scales, themean standard deviations were very similar (1.05 and 1.07, respectively).In another, data from six Northeastern European nations (Realo et al.,2009) also showed comparable mean standard deviations for self-reports(0.98) and national stereotype ratings (0.97; A. Realo, personal communi-cation, December 4, 2011). Thus, stereotype data, when standardized,should be fully comparable to personality assessment data.
5PERSONALITY STEREOTYPES OF AGING

three age groups. Calculating Pearson correlations within each traitwould not be appropriate due to the low number of data points (i.e.,the three mean ratings of adolescents, adults, and the old);4 instead,we calculated agreement for each domain and facet using twoindices of profile agreement, Cattell’s (1949) coefficient of patternsimilarity, rp, and the coefficient of profile agreement, rpa
(McCrae, 2008). We calculated rp and rpa between perceived andobserved means, with each age group as a profile element (k � 3).
Cattell’s (1949) index is sensitive only to the mean-squaredistance between standardized profile elements; it yields highvalues whenever the two profiles are close. McCrae’s (2008) indexis intended to be a refinement of rp that also takes into account theextremeness of scores, because agreement on extreme scores ismore noteworthy than agreement on average scores. When dealingwith group data (as in the present application), this means that rpa
is more conservative than rp, because group means tend towardaverage values. These coefficients are roughly comparable to aPearson correlation, but are best interpreted as an index of relativeeffect size.
To assess overall accuracy of age stereotypes across traits, wecomputed Pearson correlations across the 15 domain scores (5 fac-tors � 3 age groups) or the 90 facet scores (30 facets � 3 age groups).Because observer ratings of personality traits were available only for
adolescents and adults, we correlated the age differences reported inMcCrae, Terracciano, et al. (2005) with perceived mean differencesbetween adolescents and adults in the present study across the 30 facetscores to assess overall accuracy. To assess the overall accuracy ofage stereotypes on a per-country basis, we repeated the above facet-level analyses separately for each country.
Results
Scale Reliability and Rater Effects
In order to evaluate the reliability of the NCS domain scoresobtained in the present study, we first calculated Cronbach’s alphafor the five factor scales from the 3,323 individual responses; these
4 The median overall similarity Pearson correlation between perceivedand self-reported means was .99 (range � .92–.99) across the five domainsof personality using data from McCrae, Martin, and Costa (2005). Themedian distinctive similarity Pearson correlation (Furr, 2008) betweenperceived and self-reported means was .97 (range � .93–.99). Therefore,rpa is the more conservative and realistic estimate of profile agreement inthis case.
Table 1Sample Characteristics by Country
Country Language N Age % Male
Adolescence Adulthood Old age Accuracy
Start End Start End Start ra rb
Argentina Spanish 128 23.2 15 13.4 22.3 27.1 59.7 62.9 .65 .82Australia English 90 21.6 21 12.2 18.5 20.3 62.6 61.0 .67 .84Chile Spanish 87 19.4 51 13.5 20.2 25.9 59.0 62.6 .67 .86Croatia Croatian 96 21.0 16 14.3 21.3 24.0 57.7 61.0 .63 .77Czech Republic Czech 215 22.5 22 13.4 20.2 21.2 58.9 59.6 .67 .71United Kingdom English 93 20.2 20 12.3 18.4 20.8 65.9 63.6 .69 .75Estonia Estonian 110 22.1 28 13.7 21.2 21.3 63.3 58.6 .70 .75France French 100 22.3 24 12.0 18.5 20.8 64.4 64.0 .71 .77Hong Kong Chinese 162 20.7 62 13.9 23.1 24.4 55.4 57.9 .65 .72India English 49 19.4 0 16.3 24.8 25.8 43.1 53.5 .54 .34Iran Farsi 113 28.0 42 12.6 19.0 30.5 53.6 57.4 .70 —c
Italy Italian 151 29.9 41 13.2 19.9 24.0 63.2 66.6 .63 .78Japan Japanese 271 19.8 17 15.8 23.7 23.1 56.1 61.5 .65 .58Mainland China Chinese 91 21.6 40 12.9 20.8 21.8 50.7 57.9 .70 .74Malaysia Malay 100 22.0 29 14.4 23.0 23.5 42.5 47.6 .54 .82New Zealand English 94 19.2 26 12.3 18.2 20.6 58.9 59.3 .66 .65Peru Spanish 136 19.0 45 13.6 19.9 24.8 51.9 59.2 .71 .80Poland Polish 193 23.5 28 14.5 21.3 22.8 54.1 62.5 .61 .72Portugal Portuguese 89 23.4 22 12.3 17.5 19.3 63.5 62.7 .73 .49Russia Russian 94 22.9 27 12.5 17.5 24.2 52.8 55.9 .65 .36South Korea Korean 118 25.8 46 13.6 19.7 21.5 59.5 62.9 .68 .66Serbia Serbian 94 20.5 17 13.3 20.6 26.1 55.5 58.4 .64 .80Slovakia Slovak 138 20.0 31 13.3 19.8 20.9 59.4 61.2 .68 .76Switzerland French 97 20.9 20 12.8 19.7 22.2 65.7 64.2 .70 .77Uganda English 98 22.9 46 12.5 19.0 19.0 49.8 49.8 .59 .71United States English 316 23.2 43 11.7 18.0 21.1 55.1 58.7 .63 .83Total 3,323 22.3 31 13.4 20.3 22.7 56.9 59.8 .74 .85
M 127.81 22.1 30 13.3 20.2 23.0 57.0 59.6 .66 .71Mdn 100.00 21.8 28 13.3 19.9 22.5 58.3 60.3 .67 .75SD 60.49 2.6 14 1.1 1.9 2.7 6.2 4.3 .05 .14
a Correlation (N � 90) of perceived trait level for each age group on each facet with corresponding means from American self-report data (McCrae, Martin,& Costa, 2005). b Correlation (N � 30) across the 30 facets of the mean adult–adolescent stereotype difference with the mean adult–student observer-ratedpersonality difference in that country (McCrae, Terracciano, et al., 2005). c Observer-rated personality difference data were not available from Iran.
6 CHAN ET AL.

values were .62, .65, .70, .64, and .77 for Neuroticism, Extraver-sion, Openness, Agreeableness, and Conscientiousness, respec-tively, which are acceptable for six-item scales. A principal com-ponents analysis was conducted on the 30 items, and five factorswere extracted and rotated toward the American NEO-PI-R factorstructure (Costa & McCrae, 1992) to evaluate the adequacy withwhich the FFM was represented by the NCS items. Factor con-gruence coefficients were .90, .84, .74, .91, and .90 for Neuroti-cism, Extraversion, Openness, Agreeableness and Conscientious-ness, respectively. All these values are well beyond chance(McCrae et al., 1996), and three of them are clear replications(Lorenzo-Seva & ten Berge, 2006). Extraversion shows a marginalreplication, whereas Openness is weak. Interjudge reliability(ICC[1,k]) of the mean values for each Culture � Gender � AgeGroup was calculated for each NCS domain and facet (see Table
2); these values ranged from .63 to .95 (Mdn � .87), suggestingthat respondents generally agree on the perceived personality fea-tures that differentiate these groups. The internal consistencies,factor structure, and interjudge reliabilities of the NCS scales aresimilar to those reported previously (Terracciano, Abdel-Khalek,et al., 2005).
Because our raters were disproportionately female college stu-dents, we examined the influence of rater gender and age on agestereotypes. We first calculated the mean NCS scores for each ofthe targets separately for male and female raters and then exam-ined the degree of agreement across the 30-facet profile. Todetermine agreement, we used three complementary measures ofprofile similarity. In order to account for correspondence in levelas well as shape, we computed double-entry intraclass correlations(ICCs; McCrae, 2008). The standard Pearson correlation is a
Table 2NCS Means by Age, Interrater Reliability, Agreement With Criterion, and Exaggeration Ratios
Trait
Mean T-score ICC
rpa with NEO-PI-3
Exaggeration ratio
Adolescent Adult Old (1, 1) (1, k) All ratings First rating
NNCS: Neuroticism 56.87 47.73a 47.84a .04 .85 .53 2.05 1.73ENCS: Extraversion 53.72 50.37 40.77 .07 .91 .62 1.41 1.07ONCS: Openness 59.50 50.71 42.28 .08 .93 .60 2.00 1.60ANCS: Agreeableness 46.56 47.77 54.06 .06 .89 .54 0.84 0.77CNCS: Conscientiousness 41.52 55.19 52.08 .04 .84 .56 2.35 2.06N1NCS: Anxiety 51.83 50.73 47.88 .07 .91 .49 1.14 0.80N2NCS: Angry hostility 54.58 49.30a 49.45a .06 .90 .50 0.98 0.87N3NCS: Depression 48.96a 48.75a 52.25 .05 .87 .46 1.08 0.65N4NCS: Self-consciousness 52.43 46.67 47.50 .05 .89 .48 3.30 2.80N5NCS: Impulsiveness 58.13 47.72 42.54 .02 .71 .54 3.16 2.62N6NCS: Vulnerability 57.11 49.05 53.79 .04 .84 .49 1.67 1.27E1NCS: Warmth 49.01a 48.78a 51.04 .07 .90 .48 1.48 1.46E2NCS: Gregariousness 51.00 49.94 43.05 .04 .83 .53 1.45 1.01E3NCS: Assertiveness 50.63 53.84 48.30 .02 .75 .48 1.01 0.63E4NCS: Activity 53.75 52.83 41.26 .08 .92 .56 2.29 1.72E5NCS: Excitement Seeking 56.62 47.52 37.63 .06 .91 .77 1.14 0.99E6NCS: Positive Emotions 52.50 48.49 44.95 .10 .93 .53 1.51 1.08O1NCS: Fantasy 58.98 45.91 43.45 .05 .88 .62 1.79 1.38O2NCS: Aesthetics 48.26 50.16 49.42 .12 .95 .46 0.39 0.18O3NCS: Feelings 51.48 50.08 49.35 .08 .92 .48 0.38 0.24O4NCS: Actions 60.42 52.14 42.87 .03 .80 .53 2.96 2.43O5NCS: Ideas 52.92 51.07 44.61 .08 .92 .54 1.49 1.08O6NCS: Values 60.02 53.03 44.28 .02 .72 .50 2.84 2.42A1NCS: Trust 55.28 47.02 49.53 .03 .80 .35 1.19 0.74A2NCS: Straightforwardness 48.23 49.49 55.75 .03 .80 .56 0.86 0.84A3NCS: Altruism 47.70 50.14 52.81 .05 .86 .51 1.25 1.24A4NCS: Compliance 44.62 48.46 53.93 .03 .81 .55 1.03 0.83A5NCS: Modesty 44.77 49.06 54.48 .05 .88 .54 1.48 1.18A6NCS: Tender-Mindedness 47.23 48.11 50.06 .10 .93 .47 0.87 0.81C1NCS: Competence 42.94 53.30 46.17 .03 .87 .53 1.99 1.77C2NCS: Order 44.98 54.60a 54.92a .01 .63 .55 2.06 1.73C3NCS: Dutifulness 43.57 52.60 53.39 .05 .87 .56 1.54 1.38C4NCS: Achievement Striving 46.39 54.01 45.40 .03 .79 .49 3.47 2.62C5NCS: Self-Discipline 44.96 52.83 51.35 .04 .86 .53 1.49 1.32C6NCS: Deliberation 42.05 54.01 57.02 .03 .77 .58 2.38 2.00
FacetM .05 .85 .52 1.66 1.34Mdn .05 .87 .53 1.48 1.21Minimum .01 .63 .35 0.38 0.18Maximum .12 .95 .77 3.47 2.80
Note. N � 3,323. Exaggeration ratios � SDstereotype/SDself-report for the three age groups. NCS � National Character Survey; ICC � intraclass correlation;NEO-PI-3 � NEO Personality Inventory-3.a Difference between means ns.
7PERSONALITY STEREOTYPES OF AGING

measure of the overall similarity of two profiles, and distinctivesimilarity Pearson correlations are the correlations of two profilesnet of normative agreement (Furr, 2008). Similarity between maleand female raters for each of the groups rated (e.g., the correlationof males’ with females’ perceptions of adolescent females) washigh (ICC � .67–.89, Mdn � .73; overall similarity r � .71–.89,Mdn � .78; distinctive similarity r � .73–.91, Mdn � .79),suggesting that stereotypes of age and gender did not differ mark-edly as a function of rater gender. We also examined effects ofrater age in the three countries where data were available fromadult raters (Italy, college N � 86, Mage � 25.42 years, range �18–35 years, adult N � 65, Mage � 37.00 years, range � 22–79years; South Korea, college N � 93, Mage � 22.14, range � 19–28years, adult N � 25, Mage � 38.72 years, range � 29–52 years;United States, college N � 285, Mage � 21.13 years, range �17–56 years, adult N � 31, Mage � 41.75 years, range � 22–74years). In each country, we calculated ICCs, overall similarity, anddistinctive similarity between adult and college-age raters’ meanratings of the targets. ICC values ranged from .50 to .95 (Mdn �.86), overall similarity values ranged from .52 to .96 (Mdn � .87),and distinctive similarity values ranged from .80 to .95 (Mdn �.85), suggesting that the present results may generalize to adultraters.
Effects of Target Gender and Culture
To examine effects of target gender and culture on stereotypes,we conducted a three-way Target Age � Target Gender � Cultureanalysis of variance (ANOVA). Across the 35 domain and facetscales, age accounted for 1%–36% of the variance (M � 13%,Mdn � 10%), gender accounted for 0%–4% of the variance (M �1%, Mdn � 0%), and culture accounted for 1%–5% of the variance(M � 2%, Mdn � 2%). Interaction effects were found for Age �Culture, accounting for 1%–7% of the variance (M � 3%, Mdn �3%). No other interaction effects exceeded 1% of variance. Theseanalyses suggested that the data could be collapsed across genderand culture to focus on age group stereotypes.
Additional analyses support that decision. Figure 1 shows a plotof the age differences in mean stereotype ratings on the five factorswith each country represented by a separate line. The plot illus-trates that cultural differences and the Age � Culture interactionswere minor in comparison with the age difference trend commonacross countries.5 We also examined the cross-cultural consistencyof age group profiles by calculating coefficient alpha, using the30-facet mean T-scores in the three age groups as cases (n � 90)and countries as items (k � 26). Cronbach’s alpha was .99, with amedian-corrected item/total correlation of .89, and none lower than.65. Methodologically, this implies that scores can appropriately becombined across countries; substantively, it means that perceptionsof the personality traits of adolescents, adults, and old people areessentially universal.
Perceived Age Differences in Traits
Post hoc analyses, explicating the main effects of age in thethree-way ANOVAs reported above, revealed that mean percep-tions of all age groups on all domains and facets were significantlydifferent from each other, except for five pairwise comparisons(see Table 2). Age group differences are portrayed in Figures 2
through 7. At the domain level, Neuroticism was perceived to behighest in adolescents; Extraversion and Openness were lowestamong the old and highest among adolescents, and Agreeablenesswas highest among the old. Conscientiousness was perceived to behighest in adults and lowest in adolescents. This pattern is gener-ally consistent with existing data on cross-sectional and longitu-dinal personality differences by age (e.g., Soto et al., 2011; Ter-racciano, McCrae, et al., 2005).
In general, the facets follow the same pattern of age differencesas the domains to which they are assigned. There are, however,some variations. For example, old people are perceived to behigher rather than lower than adolescents in Depression; adoles-cents are perceived to be higher rather than lower than old peoplein Trust; and a curvilinear trend is seen for stereotypes of Asser-tiveness, in which adults are considered highest. In addition, thereis some differentiation among facets with regard to the magnitudeof age differences. Impulsiveness, Excitement Seeking, Fantasy,Modesty, and Deliberation show effects that are stronger than thatof the overall domain to which they are assigned.
Comparison of facet trends across domains reveals other pat-terns. Among the facets showing the greatest cumulative agedifferences are Excitement Seeking and Impulsiveness, whichdecline, and Self-Discipline and Deliberation, which increase withage. These traits have been conceptualized as aspects of impulsiv-ity (Whiteside & Lynam, 2001), and people everywhere apparentlybelieve impulsivity declines markedly with age. Competence,Achievement Striving, Assertiveness, and (low) Vulnerability allshow curvilinear trends, implying that people are thought to bestrongest and most effective in midlife (cf. Cuddy et al., 2005).These curvilinear patterns were also seen in a longitudinal study ofself-reports (Terracciano, McCrae, et al., 2005), although in thatAmerican sample the traits did not peak until about age 65.
Agreement With Self-Reported Personality Data
Black bars in Figures 2–7 show the mean levels of assessedpersonality traits for each age group in data from McCrae, Martin, andCosta (2005) and suggest that there is considerable agreement be-tween perceptions and assessments; thus, age stereotypes appear to berelatively accurate. At the domain level, we calculated rp and rpa
values comparing NCS data with self-reported personality scores.Using the McCrae, Martin, and Costa (2005) American data depictedin Figure 2, rps for Neuroticism, Extraversion, Openness, Agreeable-ness, and Conscientiousness were .92, .95, .80, .91, and .86, respec-tively; the corresponding rpas were .53, .60, .60, .56, and .56. For theDonnellan and Lucas (2008) British sample, corresponding rps (rpas)were .84, .89, .71, .92, and .84 (.49, .56, .54, .49, and .57); for theirGerman sample, they were .72, .79, .69, .92, and .89 (.41, .50, .50, .49,and .61). The corresponding values using the Soto et al. (2011)domains of personality were .88, .69, .39, .94, and .91 (.50, .44, .29,.51, and .59). Except for the domain of Openness in the Soto data, thislevel of agreement is comparable to that found when comparingfive-factor profiles of individuals from self-reports and ratings ofknowledgeable observers (McCrae, 2008).
5 Factor-level means by country and age group used to generateFigure 1, as well as facet-level means, can be found in SupplementaryTable 1.
8 CHAN ET AL.

At the facet level, we made comparisons using the 10 facetsassessed in Soto et al. (2011); the median rpa with the correspondingNCS facets was .49 (range � .36–.56); all rps exceeded .66. Themedian rpa of the NCS facets with the McCrae, Martin, and Costa(2005) self-report data was .52 (range � .35–.77; see Table 2); all rpsexceeded .62. The general accuracy of age group stereotypes thusappears to extend to the full range of personality traits, although with
some variation in magnitude. The weakest agreement was found forTrust; as Figure 6 shows, adolescents are perceived as being moretrusting than adults, when in fact they are less trusting. The strongestagreement was seen for Excitement Seeking, where very large de-clines with age were seen in both perceptions and self-reports.
To summarize the overall accuracy of personality stereotypesacross all age groups, we correlated the mean perceived value for
Figure 1. Mean perceptions of adolescents, adults, and the old on the five personality factors, separated bycountry. Within each personality factor, targets were plotted in age order.
Figure 2. Mean perceptions of adolescents, adults, and the old on the five personality factors. Solid black barsrepresent self-report personality data from McCrae, Martin, and Costa (2005).
9PERSONALITY STEREOTYPES OF AGING
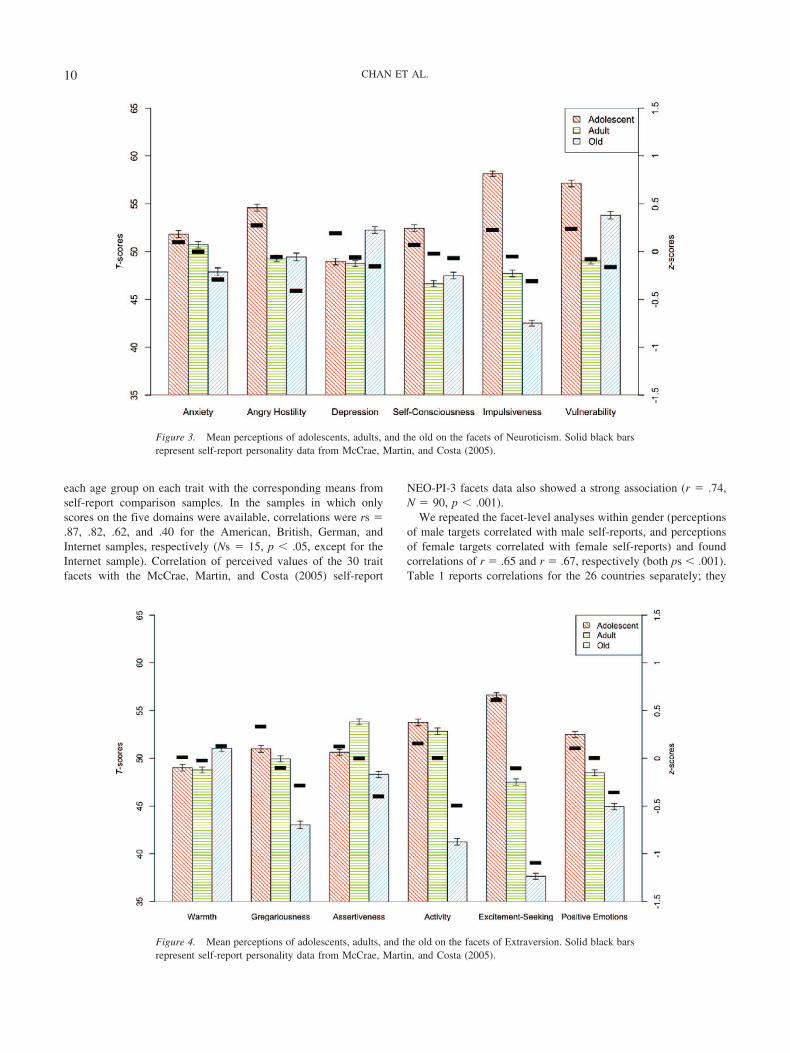
each age group on each trait with the corresponding means fromself-report comparison samples. In the samples in which onlyscores on the five domains were available, correlations were rs �.87, .82, .62, and .40 for the American, British, German, andInternet samples, respectively (Ns � 15, p � .05, except for theInternet sample). Correlation of perceived values of the 30 traitfacets with the McCrae, Martin, and Costa (2005) self-report
NEO-PI-3 facets data also showed a strong association (r � .74,N � 90, p � .001).
We repeated the facet-level analyses within gender (perceptionsof male targets correlated with male self-reports, and perceptionsof female targets correlated with female self-reports) and foundcorrelations of r � .65 and r � .67, respectively (both ps � .001).Table 1 reports correlations for the 26 countries separately; they
Figure 3. Mean perceptions of adolescents, adults, and the old on the facets of Neuroticism. Solid black barsrepresent self-report personality data from McCrae, Martin, and Costa (2005).
Figure 4. Mean perceptions of adolescents, adults, and the old on the facets of Extraversion. Solid black barsrepresent self-report personality data from McCrae, Martin, and Costa (2005).
10 CHAN ET AL.

range from .54 in India to .73 in Portugal (all ps � .001). Corre-lations of perceptions with self-reports across the 30 facets withinage groups yielded rs � .71 for adolescents, .50 for adults, and .84for the old (Ns � 30, ps � .01). These findings indicate that theoverall accuracy of personality stereotypes did not depend uponthe gender, culture, or age group of the target.
Agreement With Observer Ratings of Personality
To quantify the correspondence of the mean differences in NCSratings of adults and adolescents with mean differences in observerratings of personality for these two age groups, we used as crite-rion the difference between mean observer ratings of adults andstudents on the NEO-PI-R as reported in McCrae, Terracciano, etal. (2005) and found a strong association across the 30 facets (r �.85, N � 30, p � .001; see Figure 8).6 To further investigatewhether this association holds in each country, we repeated theabove analyses within each of the 25 countries with availablestereotype and observer data. Across these 25 countries, mediancorrelations between stereotypes and observer ratings were .75(see Table 1, last column). The sole country where correspondencebetween stereotypes and observer ratings failed to reach conven-tional significance (India, r � .34) was the country with thesmallest sample size. These data suggest that NCS ratings of agegroups correspond not only to self-reports but also to observerratings of personality traits and that the correspondence of stereo-type and observer ratings is broadly similar across nations.
Exaggeration of Stereotypes
A visual observation of Figures 2–7 suggests that the meanperceptions of each trait for each age group are more extreme thanself-reported means. For example, the mean difference on Neurot-
icism between the perceived adolescent and the old is d � .90, butonly d � .54 in self-report data (McCrae, Martin, and Costa,2005). To make comparisons of the target effects, we calculatedthe standard deviation of the standardized mean perceptions ofadolescent, adult, and old targets for each domain and facet, aswell as the standard deviation of the three corresponding self-reported means. The resulting ratio, SDPerceptions/SDSelf-reports,quantifies the relative dispersion of perception and self-reportmeans. For four of the domains and 25 of the facets, this ratio isgreater than 1.0 (facet M � 1.66; see Table 2), suggesting that ingeneral, age stereotypes are exaggerated relative to assessed agedifferences.
However, at least some of that exaggeration may be related toour study design. Participants each rated all three age groups, andit is possible that a contrast effect lead to more extreme ratings forthe second and third targets rated. To examine that possibility, werepeated the analyses using only the first rating from each partic-ipant. As Table 2 shows, across the 30 facets, the mean standarddeviation ratio is 1.34, suggesting that about half of the exagger-ation remained.
The appearance of exaggeration may also be due to the use ofnonrepresentative samples in the criterion: Samples of conve-nience may represent a select group with less variation than thepopulation. To address that possibility, we repeated the exagger-ation analyses using the self-report domain means from the na-tionally representative German and British samples, and the re-sulting standard deviation ratios across the five domains were at
6 When we compared observer rating mean differences with the per-ceived differences between old and adolescent groups, the correlation was.77.
Figure 5. Mean perceptions of adolescents, adults, and the old on the facets of Openness. Solid black barsrepresent self-report personality data from McCrae, Martin, and Costa (2005).
11PERSONALITY STEREOTYPES OF AGING

least as large as the standard deviation ratios from the nonrepre-sentative sample (German SD ratio range � 1.90–3.01, M � 2.56;British SD ratio range � 1.43–5.40, M � 3.86), indicating that theexaggeration is not merely an artifact of a particular comparisonsample or instrument.
Individual Differences in Stereotype Perceptions
The above results demonstrated stereotype accuracy at the con-sensual level; averaged age stereotypes tend to be accurate reflec-tions of the average personality traits of persons at each age group.
Figure 6. Mean perceptions of adolescents, adults, and the old on the facets of Agreeableness. Solid blackbars represent self-report personality data from McCrae, Martin, and Costa (2005).
Figure 7. Mean perceptions of adolescents, adults, and the old on the facets of Conscientiousness. Solid blackbars represent self-report personality data from McCrae, Martin, and Costa (2005).
12 CHAN ET AL.

Any particular individual’s idiosyncratic stereotypes, however,may or may not be accurate. In order to investigate further, weexamined individual differences in the perception of personalitystereotypes, and the accuracy of those perceptions. To quantify thevariability in personal age stereotypes, we calculated ICC(1,1)s foreach of the five domains and 30 facets across all raters and ratings.As shown in Table 2, reliability on the personal level was low,suggesting that whereas good reliability could be obtained on theconsensual level by aggregating across a large number of raters,interindividual variability was high. People have distinctive ideasabout the personality traits of different age groups, although theyshare a common gist that is revealed by aggregation.
The accuracy of stereotype perceptions on the personal level can berepresented by the correspondence of a particular individual’s stereo-types with self-reported personality of each age group. We examinedpersonality perceptions for the 3,042 participants who had complete
ratings of adolescents, adults, and the old, and correlated each indi-vidual’s ratings with the observed means from the McCrae, Martin,and Costa (2005) self-report data across the 90 Facet � Age Groupcases. The distribution of personal stereotype accuracy correlations ispresented in Figure 9. Most correlations (95.6%) are positive, andmany (77.7%) are statistically significant (r � .21, p � .05). How-ever, the mean correlation (calculated using the Fisher z transforma-tion) is only .34 (SD � .18), and not one of the participants was asaccurate as the consensual stereotype profile (r � .74). This suggeststhat, at the personal level, age stereotypes of personality traits arevariable and only modestly accurate.
Discussion
This article presented a large-scale, cross-national study ofperceived personality profiles of typical adolescents, adults, and
Figure 8. Scatterplot of the difference score between adult stereotypes and adolescent stereotypes in T-scores(x axis) against the difference score between observer reports of adult personality and adolescent personality (yaxis). N � Neuroticism; E � Extraversion; O � Openness to Experience; A � Agreeableness; C �Conscientiousness.
13PERSONALITY STEREOTYPES OF AGING

the old. Across countries, there was a consistent profile attributedto typical adolescents, who were seen as impulsive, preferringexcitement and novelty, and rebellious and undisciplined, relativeto adults. Compared with adults, old people were consistentlyconsidered less impulsive and lower in activity, more agreeable,and more likely to prefer routine. Compared with both adolescentsand the old, adults were perceived as highest in competence,achievement striving, assertiveness, and the least vulnerable tostress. These views were broadly consistent with assessed person-ality of adolescents, adults, and the old (Donnellan & Lucas, 2008;McCrae, Martin, and Costa, 2005; Soto et al., 2011) on meanlevels as well as trajectory. Finally, the agreement between agestereotypes and observer-rated personality held in the vast majorityof countries, illustrating a pancultural correspondence of consistentage stereotypes with assessed personality.
ANOVAs showed that the effect of target age accounted for amuch greater proportion of variance in perceived traits than did targetgender or culture. There were some main effects for culture—differences in perceived national character—and some significantAge � Culture interactions, suggesting that there are subtle differ-ences in the ways nations perceive personality across the life span.Future research may investigate possible correlates of these relativelysubtle differences. Nevertheless, perceptions of age differences ingeneral are similar across cultures. For example, in countries asdiverse as Argentina, Uganda, Iran, and Malaysia—and in all othercountries examined here—old people were perceived to be moreagreeable and less extraverted than adolescents (see SupplementaryTable 1). This suggests that the processes behind the perception of agedifferences are similar across cultures, at least for personality traits(see also Löckenhoff et al., 2009).
It is possible that stereotypes may drive personality changethrough the life span, as has been argued for perceived socialnorms (Wood, Gosling, & Potter, 2007) and age-indexed occupa-tional and social roles (Wood & Roberts, 2006). But the mostplausible and parsimonious explanation for the robustness of agestereotypes across 26 countries is that people everywhere basetheir beliefs about aging on real age differences in personality.
Perceptions of the typical adolescent, adult, and old personalityprofiles corresponded closely with assessed mean-level personalitytraits at different ages, and this was true across instruments,languages, samples, and methods of measurement. The sole lowassociation between self-reported personality domains and percep-tions of typical personality was found for Openness in the Internetsample (Soto et al., 2011), which may be due to a self-selectioneffect: “middle-aged adults who choose to complete questionnairesin exchange for personality feedback may be especially concernedwith understanding themselves, an aspect of Openness” (Soto etal., 2011, p. 343), leading to higher Openness scores in adult andolder participants than would be expected.
Agreement between age stereotypes and actual age differences inpersonality in the present study is similar to the correspondencebetween gender stereotypes and assessed personality in the previousliterature (Costa, Terracciano, & McCrae, 2001; Williams et al.,1999). At the same time, our findings stand in contrast to the lack ofassociation between national character stereotypes and mean levels ofpersonality traits in different countries (Terracciano, Abdel-Khalek, etal., 2005). One possible explanation may be that national characterstereotypes have complex origins and are strongly influenced byeconomic (Chan et al., 2011) and geographical factors (McCrae,Terracciano, Realo, & Allik, 2007). They could be fostered deliber-ately to unify previously disparate peoples (e.g., Germany), to definean identity that contrasts with an influential neighbor (e.g., Canada),or to maintain a separate identity within a larger political unit (e.g.,Hong Kong vis-a-vis China). None of these mechanisms would beexpected to distort age stereotypes.
To the extent that age stereotypes are accurate, they becomeuseful as a source of information on the life span development ofpersonality traits. For example, in self-report data, Agreeablenesstends to increase from adolescence to middle adulthood at aboutthe same rate as Conscientiousness (McCrae et al., 1999), whereasin observer rating data, increases in Agreeableness are consider-ably smaller (McCrae, Terracciano, et al., 2005). An examinationof Figure 8 shows that the facets of Conscientiousness consistentlyshow larger perceived age differences than the facets of Agree-ableness; thus, in this respect, age stereotypes are more consistentwith observer rating data than with self-report data.
Another example where sources of life span data disagree on thedirectionality as well as the magnitude of personality change is onOpenness. In our stereotype data, Openness is lower throughadulthood and old age, consistent with some studies (e.g., Lucas &Donnellan, 2011) but not others (e.g., Soto et al., 2011). In old agewe also find a reversal of maturational trends in Conscientiousnessand Neuroticism that is similar to some previous research (e.g.,Terracciano, McCrae, et al., 2005), but in contrast to others (e.g.,Roberts et al., 2006). Stereotypes of older adults are also notuniformly positive or negative (cf. Hummert, 1990); positive per-ceptions of Agreeableness contrast with negative perceptions ofExtraversion and Openness. By extension, personality changethrough the life span also does not take a uniformly positive ornegative trajectory.
Inaccuracies in Age Stereotypes
Despite overall agreement, there were discrepancies betweenperceived age differences and self-reported personality on a fewtraits. The old were perceived to be more depressed than other age
Figure 9. Distribution of correlations between profiles for personal-levelage stereotypes of personality and mean self-reported personality fromMcCrae, Martin, and Costa (2005).
14 CHAN ET AL.

groups, although in personality surveys, young adults are actuallymore likely to report depression (e.g., Soto et al., 2011), andepidemiological evidence suggests that major depression is signif-icantly less prevalent in the old (e.g., Kessler et al., 2010). Ado-lescents are thought to be more trusting than adults, perhapsbecause laypeople confuse the inexperience of youth with intrinsicgullibility. Similarly, adults may be seen as most assertive becausecareer trajectories are expected to peak in midlife.
Furthermore, across the majority of personality facets, perceivedage differences were exaggerated compared with actual age differ-ences. One possible explanation for exaggeration is that the retentionand recall of traits may be biased by the stereotype relevance of eachtrait to a particular age group (e.g., Banaji, Hardin, & Rothman,1993). For instance, the application of the trait “impulsive” to thetypical adolescent may be due to easier recall of adolescent exemplarsdriving recklessly, even though the majority of adolescents will neverbe cited for reckless driving. As a result, the perceptions of impulsiv-ity in adolescents would be exaggerated compared with assessedimpulsivity. Similarly, the easy recall of inactive old people in nursinghomes may lead to the exaggerated perception that the typical oldperson is low in activity level, though only a small minority (3.1%) ofpeople over the age of 65 in the United States were in nursing homesat the time of the 2010 census (Werner, 2011). A corollary to thiseffect is that counterstereotypic traits and behaviors are not recalled asfrequently (Hamilton & Rose, 1980), exacerbating the exaggeration ofstereotypes.
Another possibility is that the observed inaccuracies are in factbased on faulty assumptions. The knowledge that elders are nearthe end of their lives may result in the assumption that they mustbe in despair about death and have ceased to strive for achieve-ments. Raters may exaggerate the prevalence of disability anddementia in old age and attribute vulnerability, incompetence, andlower activity to all old persons. These assumptions may becomeself-reinforcing (Mendoza-Denton & Mischel, 2007), resulting in abiased view of stereotype-relevant traits in each age group.
Stereotypical views of age groups are even less accurate at thepersonal level. Indeed, we found substantial individual differencesin age stereotypes, and the perceptions of any particular individualwere less accurate than the group consensus. Although most indi-viduals rate age stereotypes in the same direction as actual agegroup differences in personality, some do not. Mean levels of agestereotypes across individuals are reasonably accurate reflectionsof mean levels of personality in different age groups, but anyparticular individual’s personal stereotypes might not be accurate.
Limitations and Future Directions
Limitations of the present study suggest new directions forresearch. As mentioned above, an ideal design would assess bothage stereotype perceptions and personality with representativenational samples from the same set of countries, using identicalinstruments that have demonstrated scalar equivalence in all lan-guages. That design would allow a direct and an unambiguouscomparison of perceptions with realities, including their relativemagnitude—for example, exaggeration. In the absence of suchdata, the present results appear to represent a reasonable approx-imation, given converging patterns of evidence that support thevalidity of our assumptions.
We chose a mix of published comparison studies, including bothrepresentative and nonrepresentative samples. Across the five cri-terion samples, representativeness did not affect the correspon-dence between stereotypes and self-reported or observer-ratedpersonality. College students’ perceptions of different age groupswere generally consistent across countries, not uniformly positiveor negative, and in line with actual age differences in mean-levelpersonality, suggesting that students are trustworthy informantsabout age stereotypes. Data from college-aged and adult raters inour Italian, South Korean, and U.S. samples also suggested thatpersonality perceptions were similar for young adults and middle-aged adults. Other published data from the United States alsoconfirm modest rater age effects for personality perception (Wood& Roberts, 2006). Furthermore, in one French study, rater ageaccounted for less than a tenth of the variance in the personalityperception of the young, middle-aged, and the old (Igier & Mullet,2003). Nevertheless, future research should continue investigatingpossible rater effects, such as rater age, occupation, or personalitytraits, in stereotype perception.
Participants made clear differentiations between adolescent ver-sus adult targets and between adult versus old targets in theirperceptions of typical personality. A sample of Australian under-graduates perceived personality change as a linear process for eachof the five factors (Haslam et al., 2007). Research on longitudinalpersonality change, however, has shown a notable difference be-tween young adulthood (20–30), during which time personalitychange is more rapid, and middle adulthood (30–50), during whichtime personality change is more gradual (e.g., Roberts et al., 2006).Future studies of age stereotypes in personality should use adoles-cent, young adult, middle adult, and old targets, and assess theaccuracy of this more differentiated view of aging.
Another concern is that our survey instrument (NCS) used onlyone item to represent each of the 30 facets in the NEO-PI-3 andNEO-PI-R; longer instruments, such as the brief version of theNEO-PI-3 (McCrae & Costa, 2007), would provide more reliableand accurate data. Despite our choice of a brief survey instrument,correlations between stereotypes obtained by our instrument, andpersonality data reported with various long and short instrumentswere substantial. Because age perceptions do not vary widelyacross countries, future studies might survey a smaller number ofcountries using a longer instrument.
In conclusion, this large cross-national investigation of age stereo-types of personality profiles expands our scientific knowledge aboutthe perception of these age groups. Establishing that there is cross-cultural similarity in the perception of adolescents, adults, and the oldsuggests that findings on personality perception can apply around theworld. The near universality of age perceptions bodes well for futureageism research and the cross-cultural applicability of interventionsdesigned for age bias reduction. However, this universality also in-cludes inaccuracies and exaggerations in personality perception andsuggests that ageism may be related to pancultural processes. As theproportion of the world’s population in old age increases, analysis ofthe content, accuracy, and biases of age personality perceptions be-comes more important socially as well as scientifically.
References
Allik, J., Mottus, R., & Realo, A. (2010). Does national character reflectmean personality traits when both are measured by the same instrument?
15PERSONALITY STEREOTYPES OF AGING

Journal of Research in Personality, 44, 62– 69. doi:10.1016/j.jrp.2009.10.008
Banaji, M. R., Hardin, C., & Rothman, A. J. (1993). Implicit stereotypingin person judgment. Journal of Personality and Social Psychology, 65,272–281. doi:10.1037/0022-3514.65.2.272
Boduroglu, A., Yoon, C., Luo, T., & Park, D. (2006). Age-related stereo-types: A comparison of American and Chinese cultures. Gerontology,52, 324–333. doi:10.1159/000094614
Buchanan, C. M., & Holmbeck, G. N. (1998). Measuring beliefs aboutadolescent personality and behavior. Journal of Youth and Adolescence,27, 607–627. doi:10.1023/A:1022835107795
Cattell, R. B. (1949). rp and other coefficients of pattern similarity. Psy-chometrica, 14, 279–298. doi:10.1007/BF02289193
Chan, W., McCrae, R. R., Rogers, D. L., Weimer, A. A., Greenberg, D. M.,& Terracciano, A. (2011). Rater wealth predicts perceptions of outgroupcompetence. Journal of Research in Personality, 45, 597–603. doi:10.1016/j.jrp.2011.08.001
Costa, P. T., & McCrae, R. R. (1992). Revised NEO Personality Inventory(NEO PI-R) and NEO Five-Factor Inventory (NEO-FFI) professionalmanual. Lutz, FL: Psychological Assessment Resources.
Costa, P. T., & McCrae, R. R. (1995). Domains and facets: Hierarchicalpersonality assessment using the Revised NEO Personality Inventory.Journal of Personality Assessment, 64, 21–50. doi:10.1207/s15327752jpa6401_2
Costa, P. T., Terracciano, A., & McCrae, R. R. (2001). Gender differencesin personality traits across cultures: Robust and surprising findings.Journal of Personality and Social Psychology, 81, 322–331. doi:10.1037/0022-3514.81.2.322
Cuddy, A. J. C., Norton, M. I., & Fiske, S. T. (2005). This old stereotype:The pervasiveness and persistence of the elderly stereotypes. Journal ofSocial Issues, 61, 267–285. doi:10.1111/j.1540-4560.2005.00405.x
Digman, J. M. (1990). Personality structure: Emergence of the five-factormodel. In M. R. Rosenzweig & L. W. Porter (Eds.), Annual review ofpsychology (Vol. 41, pp. 417–440). Palo Alto, CA: Annual Reviews.
Donnellan, M. B., & Lucas, R. E. (2008). Age differences in the Big Fiveacross the life span: Evidence from two national samples. Psychologyand Aging, 23, 558–566. doi:10.1037/a0012897
Fiske, S. T., Cuddy, A. J. C., Glick, P., & Xu, J. (2002). A model of (oftenmixed) stereotype content: Competence and warmth respectively followfrom perceived status and competition. Journal of Personality andSocial Psychology, 82, 878–902. doi:10.1037/0022-3514.82.6.878
Furr, R. M. (2008). A framework for profile similarity: Integrating simi-larity, normativeness, and distinctiveness. Journal of Personality, 76,1267–1316. doi:10.1111/j.1467-6494.2008.00521.x
Gidwani, P. P., Opitz, G. M., & Perrin, J. M. (2006). Mothers’ views ofhyperactivity: A cross-cultural perspective. Developmental and Behav-ioral Pediatrics, 27, 121–126. doi:10.1097/00004703-200604000-00006
Gross, E. F., & Hardin, C. D. (2007). Implicit and explicit stereotyping ofadolescents. Social Justice Research, 20, 140–160. doi:10.1007/s11211-007-0037-9
Gruhn, D., Gilet, A-L., Studer, J., & Labouvie-Vief, G. (2011). Age-relevance of person characteristics: Persons’ beliefs about developmen-tal change across the lifespan. Developmental Psychology, 47, 376–387.doi:10.1037/a0021315
Hamilton, D. L., & Rose, T. L. (1980). Illusory correlation and themaintenance of stereotypic beliefs. Journal of Personality and SocialPsychology, 39, 832–845. doi:10.1037/0022-3514.39.5.832
Harvey, C. D. H., & Yoshino, S. (2006). Social policy for family caregiversof elderly: A Canadian, Japanese, and Australian comparison. Marriageand Family Review, 39, 143–158. doi:10.1300/J002v39n01_08
Haslam, N., Bastian, B., Fox, C., & Whelan, J. (2007). Beliefs aboutpersonality change and continuity. Personality and Individual Differ-ences, 42, 1621–1631. doi:10.1016/j.paid.2006.11.001
Haslam, S. A., & Wilson, A. (2000). In what sense are prejudicial beliefs
personal? The importance of an in-group’s shared stereotypes. BritishJournal of Social Psychology, 39, 45– 63. doi:10.1348/014466600164327
Hummert, M. L. (1990). Multiple stereotypes of elderly and young adults:A comparison of structure and evaluations. Psychology and Aging, 5,182–193. doi:10.1037/0882-7974.5.2.182
Hummert, M. L., Garstka, T. A., Shaner, J. L., & Strahm, S. (1994).Stereotypes of the elderly held by young, middle-aged, and elderlyadults. Journal of Gerontology: Psychological Sciences, 49, P240–P249.
Igier, V., & Mullet, E. (2003). Application of the five-factor model ofpersonality to intergenerational perception. Journal of Gerontology:Psychological Sciences, 58B, P177–P186. doi:10.1093/geronb/58.3.P177
John, O. P., & Srivastava, S. (1999). The Big-Five trait taxonomy: History,measurement, and theoretical perspectives. In L. A. Pervin & O. P. John(Eds.), Handbook of personality: Theory and research (3rd ed., pp.102–138). New York, NY: Guilford Press.
Jussim, L. J. (2012). Social perception and social reality: Why accuracydominates bias and self-fulfilling prophecy. New York, NY: OxfordUniversity Press.
Jussim, L. J., McCauley, C. R., & Lee, Y. T. (1995). Why study stereotypeaccuracy and inaccuracy? In Y. T. Lee, L. J. Jussim, & C. R. McCauley(Eds.), Stereotype accuracy: Towards appreciating group differences(pp. 3–27). Washington, DC: American Psychological Association. doi:10.1037/10495-001
Kessler, R. C., Birnbaum, H., Bromet, E., Hwang, I., Sampson, N., &Shahly, V. (2010). Age differences in major depression: Results from theNational Comorbidity Survey Replication (NCS-R). Psychological Med-icine, 40, 225–237. doi:10.1017/S0033291709990213
Liu, J. H., Ng, S. H., Loong, C., Gee, S., & Weatherall, A. (2003). Culturalstereotypes and social representations of elders from Chinese and Eu-ropean perspectives. Journal of Cross-Cultural Gerontology, 18, 149–168. doi:10.1023/A:1025108618426
Löckenhoff, C. E., De Fruyt, F., Terracciano, A., McCrae, R. R., De Bolle,M., Costa, P. T., . . . Yik, M. (2009). Perceptions of aging across 26cultures and their culture-level associates. Psychology and Aging, 24,941–954. doi:10.1037/a0016901
Lorenzo-Seva, U., & ten Berge, J. M. F. (2006). Tucker’s congruencecoefficient as a meaningful index of factor similarity. Methodology, 2,57–64.
Lucas, R. E., & Donnellan, M. B. (2009). Age differences in personality:Evidence from a nationally representative Australian sample. Develop-mental Psychology, 45, 1353–1363. doi:10.1037/a0013914
Lucas, R. E., & Donnellan, M. B. (2011). Personality development acrossthe life span: Longitudinal analyses with a national sample from Ger-many. Journal of Personality and Social Psychology, 101, 847–861.doi:10.1037/a0024298
McCrae, R. R. (2004). Human nature and culture: A trait perspective.Journal of Research in Personality, 38, 3–14. doi:10.1016/j.jrp.2003.09.009
McCrae, R. R. (2008). A note on some measures of profile agreement.Journal of Personality Assessment, 90, 105–109. doi:10.1080/00223890701845104
McCrae, R. R., & Costa, P. T. (2007). Brief versions of the NEO-PI-3.Journal of Individual Differences, 28, 116–128. doi:10.1027/1614-0001.28.3.116
McCrae, R. R., Costa, P. T., de Lima, M. P., Simoes, A., Ostendorf, F.,Angleitner, A., . . . Piedmont, R. (1999). Age differences in personalityacross the adult life span: Parallels in five cultures. DevelopmentalPsychology, 35, 466–477. doi:10.1037/0012-1649.35.2.466
McCrae, R. R., Costa, P. T., Hrebıckova, M., Urbanek, T., Martin, T. A.,Oryol, V. E., . . . Senin, I. G. (2004). Age differences in personality traits
16 CHAN ET AL.

across cultures: Self-report and observer perspectives. European Journalof Personality, 18, 143–157. doi:10.1002/per.510
McCrae, R. R., Martin, T. A., & Costa, P. T. (2005). Age trends and agenorms for the NEO Personality Inventory-3 in adolescents and adults.Assessment, 12, 363–373. doi:10.1177/1073191105279724
McCrae, R. R., Terracciano, A., Realo, A., & Allik, J. (2007). Climaticwarmth and national wealth: Some culture-level determinants of nationalcharacter stereotypes. European Journal of Personality, 21, 953–976.doi:10.1002/per.647
McCrae, R. R., Terracciano, A., & 78 Members of the Personality Profilesof Cultures Project. (2005). Universal features of personality traits fromthe observer’s perspective: Data from 50 cultures. Journal of Personalityand Social Psychology, 88, 547–561. doi:10.1037/0022-3514.88.3.547
McCrae, R. R., Zonderman, A. B., Costa, P. T., Jr., Bond, M. H., &Paunonen, S. V. (1996). Evaluating replicability of factors in the Re-vised NEO Personality Inventory: Confirmatory factor analysis versusProcrustes rotation. Journal of Personality and Social Psychology, 70,552–566.
Mendoza-Denton, R., & Mischel, W. (2007). Integrating system ap-proaches to culture and personality: The cognitive-affective processingsystem. In S. Kitayama & D. Cohen (Eds.), Handbook of culturalpsychology (pp. 175–195). New York, NY: Guilford Press.
Nelson, T. D. (2002). Ageism: Stereotyping and prejudice against olderpersons. Cambridge, MA: MIT Press.
Realo, A., Allik, J., Lönnqvist, J.-E., Verkasalo, M., Kwiatkowska, A.,Kööts, L., . . . Renge, V. (2009). Mechanisms of the national characterstereotype: How people in six neighbouring countries of Russia describethemselves and the typical Russian. European Journal of Personality,23, 229–249. doi:10.1002/per.719
Roberts, B. W., Walton, K. E., & Viechtbauer, W. (2006). Patterns ofmean-level change in personality traits across the life course: A meta-analysis of longitudinal studies. Psychological Bulletin, 132, 1–25. doi:10.1037/0033-2909.132.1.1
Rogers, K. H., & Wood, D. (2010). Accuracy of United States regionalpersonality stereotypes. Journal of Research in Personality, 44, 704–713. doi:10.1016/j.jrp.2010.09.006
Slotterback, C. S. (1996). Projections of aging: Impact of generationaldifferences and the aging process on perception of adults. Psychologyand Aging, 11, 552–559. doi:10.1037/0882-7974.11.3.552
Soto, C. J., & John, O. P. (2009). Ten facet scales for the Big FiveInventory: Convergence with NEO PI-R facets, self-peer agreement, anddiscriminant validity. Journal of Research in Personality, 43, 84–90.doi:10.1016/j.jrp.2008.10.002
Soto, C. J., John, O. P., Gosling, S. D., & Potter, J. (2011). Age differencesin personality traits from 10 to 65: Big Five domains and facets. Journal
of Personality and Social Psychology, 100, 330–348. doi:10.1037/a0021717
Specht, J., Egloff, B., & Schmukle, S. C. (2011). Stability and change ofpersonality across the life course: The impact of age and major lifeevents on mean-level and rank-order stability of the Big Five. Journal ofPersonality and Social Psychology, 101, 862– 882. doi:10.1037/a0024950
Terracciano, A., Abdel-Khalek, A. M., Adam, N., Adamovova, L., Ahn,C. K., Ahn, H. N., . . . McCrae, R. R. (2005, October 7). Nationalcharacter does not reflect mean personality trait levels in 49 cultures.Science, 310, 96–100. doi:10.1126/science.1117199
Terracciano, A., McCrae, R. R., Brant, L. J., & Costa, P. T. (2005).Hierarchical linear modeling analysis of the NEO-PI-R scales in theBaltimore Longitudinal Study of Aging. Psychology and Aging, 20,493–506. doi:10.1037/0882-7974.20.3.493
Toothman, E. L., & Barrett, A. E. (2011). Mapping midlife: An examina-tion of social factors shaping conceptions of the timing of middle age.Advances in Life Course Research, 16, 99 –111. doi:10.1016/j.alcr.2011.08.003
Werner, C. A. (2011). The older population: 2010 Census Briefs,C2010BR-09. Washington, DC: U.S. Government Printing Office.
Williams, J. E., Satterwhite, R. C., & Best, D. L. (1999). Panculturalgender stereotypes revisited: The five factor model. Sex Roles, 40,513–525. doi:10.1023/A:1018831928829
Whiteside, S. P., & Lynam, D. R. (2001). The five factor model andimpulsivity: Using a structural model of personality to understand im-pulsivity. Personality and Individual Differences, 30, 669–689.
Wood, D., Gosling, S. D., & Potter, J. (2007). Normality evaluations andtheir relation to personality traits and well-being. Journal of Personalityand Social Psychology, 93, 861–879. doi:10.1037/0022-3514.93.5.861
Wood, D., & Roberts, B. W. (2006). The effect of age and role informationon expectations for Big Five personality traits. Personality and SocialPsychology Bulletin, 32, 1482–1496. doi:10.1177/0146167206291008
Yun, R. J., & Lachman, M. E. (2006). Perceptions of aging in two cultures:Korean and American views on old age. Journal of Cross-CulturalGerontology, 21, 55–70. doi:10.1007/s10823-006-9018-y
Zebrowitz, L. A., & Montepare, J. M. (2000). “Too young, too old”:Stigmatizing adolescents and elders. In T. F. Heatherton, R. B. Kleck,M. R. Hebl, & J. G. Hull (Eds.), The social psychology of stigma (pp.334–373). New York, NY: Guilford Press.
Received February 13, 2012Revision received June 19, 2012
Accepted July 19, 2012 �
17PERSONALITY STEREOTYPES OF AGING