Stereotypes in Person-to-Person Lending: Evidence from ... · average loan size by RMB 2,600 ($400)...
55
0 Stereotypes in Person-to-Person Lending: Evidence from Debt Crowdfunding Iftekhar Hasan Fordham University, Bank of Finland and University of Sydney 45 Columbus Avenue, 5 th Floor, New York, NY 10023, USA E-mail: [email protected] Phone: 646 312 8278 Qing He School of Finance, Renmin University of China E-mail: [email protected] Haitian Lu School of Accounting and Finance, Hong Kong Polytechnic University E-mail: [email protected] Abstract How much do stereotypes affect person-to-person economic exchange? Empirical evidence from a debt-crowdfunding website reveals that individual borrowers from high-social-capital regions enjoy higher funding success, larger loan and bid size, lower interest rates, and more concentrated loan ownership. The effect is more pronounced among borrowers with no credit history or of lower quality. Dyadic data show lenders from regions higher in social capital offer smaller loans at higher interest rates to borrowers from lower-social-capital regions. We consider a range of explanations and find our results most easily explained by investors using region- based stereotypes as a heuristic when making credit decisions. Key words: Stereotype, Social Capital, Person-to-Person Lending, Debt Contracting. JEL Classification Code: Z10, G10, O16.
Transcript of Stereotypes in Person-to-Person Lending: Evidence from ... · average loan size by RMB 2,600 ($400)...

0
Stereotypes in Person-to-Person Lending:
Evidence from Debt Crowdfunding
Iftekhar Hasan
Fordham University, Bank of Finland and University of Sydney
45 Columbus Avenue, 5th Floor, New York, NY 10023, USA
E-mail: [email protected]
Phone: 646 312 8278
Qing He
School of Finance, Renmin University of China
E-mail: [email protected]
Haitian Lu
School of Accounting and Finance, Hong Kong Polytechnic University
E-mail: [email protected]
Abstract
How much do stereotypes affect person-to-person economic exchange? Empirical evidence from
a debt-crowdfunding website reveals that individual borrowers from high-social-capital regions
enjoy higher funding success, larger loan and bid size, lower interest rates, and more
concentrated loan ownership. The effect is more pronounced among borrowers with no credit
history or of lower quality. Dyadic data show lenders from regions higher in social capital offer
smaller loans at higher interest rates to borrowers from lower-social-capital regions. We consider
a range of explanations and find our results most easily explained by investors using region-
based stereotypes as a heuristic when making credit decisions.
Key words: Stereotype, Social Capital, Person-to-Person Lending, Debt Contracting.
JEL Classification Code: Z10, G10, O16.

1
Introduction
Stereotypes, defined as widely held thought or impressions concerning the attributes that
characterize a group, are ubiquitous in human interactions. The social psychology literature
views stereotypes as a “representativeness” heuristic for human decision making (Kahneman and
Tversky 1972; Schneider 2004). Prior economic work has used field experiments to study
stereotypes in markets. For example, Bertrand and Mullainathan (2004) sent fictitious resumes to
employers using African-American- or White-sounding names to test labor market
discrimination. Akerlof and Kranton (2000) claimed that identity – a person’s sense of self
relative to others – influences preferences and economic outcomes. Also, one’s lower (higher)
self-image may evoke anxiety and discomfort (confidence and comfort) in oneself and may
impact economic actions and notions of others e.g., different race, class and regions. In this
paper, we study identity and stereotypes in the credit market, the investigation of which has in
the past been difficult because of a shortage of observational data on person-to-person credit.
Over the past years, however, technological innovations in finance have enabled online credit
transactions between anonymous individuals without intermediaries. Moreover, improvements in
the underwriting process allow a loan to be crowdfunded by multiple lenders. These unique
features allow for the observation not only of “self-image” and the “wisdom of the crowd,” i.e.,
the market’s aggregate assessment of borrowers, but also for dyadic analysis of how individual
lenders assess a borrower. This article fills a gap by using data from real transactions on a
person-to-person (P2P) lending website in China.
Stereotypes take many forms. In this paper we focus on lender stereotypes regarding the
“representative” social capital of a borrower’s home province. Unlike institutions that screen
borrowers using algorithms, stereotypical thinking among individuals is “instantaneous”
(Durlauf and Fafchamps, 2006), exogenous to each economic transaction (Bottazzi, Da Rin, and
Hellmann, 2016), and can be overweighed in probability judgements (Bordalo et al. 2016). As
Zingales (2015) pinpoints:
“Even within the United States, immigrants from different locations seem to carry a ‘cultural’ marker, which fades only slowly over time. Americans of Swedish origin are more trusting, more in favor of redistribution, and less thrifty than Americans of Italian origin, in the same way that Swedes are more trusting, more in favor of redistribution, and less thrifty than Italians.”
2
We hypothesize that when individual lenders are uncertain about a borrower’s quality, they
use region-based identity and stereotypes as a mental shortcut to make investment decisions.
Stereotypes affect credit outcomes through a lender’s judgment of the probability of
opportunistic behavior on the part of borrowers from a certain region. In high-social-capital
regions, reciprocity and cooperative norms help to constrain opportunistic behaviors, even in the
absence of strong legal and market institutions (Coleman, 1988).1 This is so because dense social
networks intensify internal sanctions such as social ostracism (Uhlaner, 1989) and stigmatization
(Posner, 2000), and heighten negative moral sentiments associated with perpetuating
opportunistic behaviors (Elster, 1989), causing borrowers from such regions to be assigned a
higher probability of behaving cooperatively. This leads to the prediction that, all else being
equal, borrowers from high-social-capital regions have higher funding success and, conditional
upon this success, receive more favorable debt terms than do borrowers from regions of low
social capital.
To measure regional social capital we employ a battery of proxies. The objective is to capture
the civic norms and social trust in a province, two elements that both Coleman (1990) and
Putman (1993) refer to as manifestation of social capital. We first include (population-weighted)
voluntary blood donation without compensation, as well as registered NGO members in a
province (Guiso, Sapienza, and Zingales 2004). We also employ two national surveys. One asks
respondents to rank “the top 5 provinces where the enterprises are most trustworthy” (Zhang and
Ke, 2003). The other asks respondents to rate “how trustworthy are the people in your city”
(Knack and Keefer, 1997). Our fifth proxy, a composite trust index, is based on a principal
component analysis (PCA) of the four variables.
We find strong evidence that the social capital of a province positively affects their borrowers’
loan outcomes. Ceteris paribus, individuals from regions higher in social capital enjoy a higher
probability that their loans will be fully funded; they are also able to borrow larger amounts, at
lower interest rates. These borrowers also have more concentrated loan ownership, suggesting
1 Other eco-social conditions, such as the legal environment (Qian and Strahan, 2007), and culture-level religiosity
(Cai and Shi, 2014) may have similar effects in constraining opportunistic behavior. However, as Kranton (1996)
shows, reciprocal exchange can be a self-enforcing and self-sustaining system. In this study, we control for
alternative institutions, but note that our proxies of regional social capital capture non-legal and non-religious social
norms that constrain self-serving behaviors.

3
less risk-sharing demand from loan investors. The economic magnitude of regional social capital
is non-trivial: A one-standard-deviation increase in our provincial trust index increases the
average loan size by RMB 2,600 ($400) and reduces the adjusted interest rate by 1.2 percent.
Our result is robust to the control of variables at borrower, loan, and region levels, individual-
lender fixed effects, the Heckman correction on funding success, and bootstrapping tests.
To the extent that regional social capital can be endogenous, we employ two instruments
related to the formation of cooperative norms in a province. The first traces a province’s
agricultural history of growing rice versus wheat (Talhelm et al. 2014). The second investigates
the proportion of the largest ethnic group in the total population of a province (Easterly and
Levin 1997). Our instrumental variable analysis strongly supports the baseline result.
If our proposition is correct that lenders use stereotypes as a mental shortcut to ease their
decision making, then the theory of adverse selection (Akerlof, 1970) predicts that such
stereotyping will benefit borrowers whose credit quality (by hard information) is “below the
stereotypical average.” Our findings are in accordance with this prediction: The interaction effect
shows that stereotypes are more significant when borrowers are female, have lower income, and
shorter work experience. We also find that stereotyping is more frequently used for borrowers
with no previous credit history on the website (“first-time” borrower), and when their education
level is low.
We carefully test several alternative hypotheses. The first is in-group bias (Yamagishi et al.
1988; Cornell and Welch, 1996; Huff and Kelley, 2003; Guiso, Sapienza, and Zingales, 2009).
For example, Fisman, Paravisini, and Vig (2017) find that cultural proximity (shared codes,
beliefs, and ethnicity) between borrowers and bank loan officers increases loan size and reduces
default. Giannetti and Yafeh (2012) find that banks offer smaller loans at higher interest rates to
more culturally distant borrowers. To examine how common traits between lender and borrower
affect debt contracting, we take advantage of a large sample of loans where complete personal
information of counterparties is available.2 Specifically, we assess how observable differences
between each lender-borrower pair (e.g., age, gender, credit rating, education, marital status,
income, home ownership, work experience, and home environment) affect lending outcomes.
2 This is so because some lenders are also borrowers on the same platform, thus must supply personal information.

4
After controlling for these differences, we find robust results that individual lenders bid less
(more) and require higher (lower) interest rates when their borrowers are more downwardly
(upwardly) distant in social capital, thereby confirming our baseline findings.
We next investigate the alternative explanation of the investor’s “home bias” (Coval and
Moskowitz 1999; Grinblatt and Keloharju 2001; Chan, Covrig and Ng 2005). Two pieces of
evidence suggest that this phenomenon does not drive our results. First, we show that our finding
is robust after excluding loans in which both lenders and borrowers are from the same province.
Second, in our dyadic level analysis, by allowing the effect of social capital to depend on
whether the home provinces of the counterparties share the same border (Rose 2004), we find the
effect of social capital attenuates, but remains significant, when lender and borrower are
geographically distant. Finally, we test other sources of stereotypes. Duarte, Siegal, and Young
(2012) show that trustworthy appearance in borrower photographs is associated with better loan
outcomes. This argument is irrelevant here, however, since the P2P website employed in our
study does not allow borrowers to post photos. On the other hand, we see little evidence of
stereotypes based on age, gender, or social groups.
Our main conclusion, that region-based stereotypes affect person-to-person economic
exchange, has several economic implications. The first is the value of social capital in economics
and finance. Knack and Keefer (1997) show that country social capital is associated with
measurable economic performance. Guiso, Sapienza, and Zingales (2004) find that regions of
high social capital have deeper financial markets. At the firm level, studies find that firms in
regions of higher social capital show higher financial reporting quality (Garrett, Hoitash, Prawitt,
2014), less variance in returns (Hilary and Hui 2009), and more innovation (Laursen, Masciarelli,
and Prencipe, 2012). A few studies examine the value of social capital in credit. For example,
Guiso, Sapienza, and Zingales (2004) show that households in regions of higher social capital in
Italy have greater access to institutional credit. Wu, Firth, and Rui (2014) provide evidence that
Chinese firms located in higher-trust regions obtain more trade credit from suppliers. Hasan et al.
(2015) find that U.S. firms headquartered in high-social-capital counties enjoy favorable loan
conditions. However, none of this work addresses lending between individuals and none
distinguishes between local and non-local credit. We fill this gap by focusing on the online
environment, where anonymous individuals extend credit to others. To the best of our knowledge,

5
this paper provides the first empirical evidence on region-based stereotypes in person-to-person
lending.
This paper also contributes to emerging work that studies the determinants of funding on P2P
platforms. Duarte, Siegal, and Young (2012) show that trustworthy appearance in a borrower’s
photographs is associated with better loan outcomes. Lin, Prabhala, and Viswanathan (2013) find
that the friendship network on the P2P platform increases the likelihood of a loan being funded
and reduces interest rates. Their findings are consistent with the role of signaling in reducing
information friction. Our test of regional social capital differentiates from theirs in that we point
to the impact of social capital as providing environmental pressure constraining opportunistic
behaviors. We show that high regional social capital facilitates not only in-group trust, but also
out-group perceptions of the quality of borrowers from the region. In this regard, our evidence
finds synergy with a stream of country-of-origin (COO) literature that documents the impact of
perceptions about a country on an individual’s evaluation of that country’s products in
international business (Li and Wyer, 1994; Lampert and Jaffe, 1996; Newburry Gardberg, and
Belkin, 2006; Knight, Holdsworty, and Mather, 2007). We confirm the COO effect in person-to-
person economic exchange using regional evidence from China.
Finally, we contribute to research on the effects of geographical, cultural, and other
heterogeneities between trading partners on trust-intensive contracts, such as credit. Fisman,
Paravisini, and Vig (2017) find cultural proximity (shared codes, beliefs, and ethnicity) between
borrowers and bank loan officers increases loan size and reduces default. Giannetti and Yafeh
(2012) find that cultural distance between bank loan officers and borrowers leads to more
restrictive loan terms. We extend this line of research by showing that gaps in regional social
capital increase distrust. Lenders from high-trust regions are more cautious when lending to
borrowers from low-trust regions.
The remainder of this paper proceeds as follows: Section II introduces the mechanism of
online marketplace lending and institutional settings in China. Section III describes our sample
data and variables. Section IV presents empirical results, and Section V draws conclusions.

6
1. Institutional Background
This paper presents novel evidence from the emerging market of China. In such markets,
formal institutions such as laws are often ineffective in protecting investors (La Porta et al. 1998),
necessitating alternative governance, such as that based on social capital. For historical reasons,
e.g., ethnicity, regional dialect, culture and geography, social capital in China is unevenly
distributed among its 31 provinces. For example, using data from the World Values Survey, Ang,
Cheng, and Wu (2015) show that value differences among provinces in China are often greater
than those across as many as 13 European countries.
The formal credit market in China is dominated by banks, with five state banks splitting
almost half the total loan market. The capital market is relatively underdeveloped, and a majority
of listed firms are owned or controlled by the government (Allen, Qian, and Qian, 2005). Not
surprisingly, most bank credit is extended by state-owned banks to state-owned enterprises
(SOEs) or to large private firms, while private small- and medium-sized firms face substantial
obstacles in obtaining external finance from the formal financial sector (He, Xue, and Zhu, 2017).
“Shadow banks,” financial firms outside the formal banking sector, primarily serve the
financial needs of the vast private sector (Elliott, Kroeber, and Yu, 2015). These financial firms
take various forms, such as trust companies, inter-corporate loans via financial institutions
(“entrusted loans”), microfinance companies, guarantee firms, leasing companies, pawn shops
and various unofficial lenders. They perform credit functions similar to those of banks, but are
not subject to the same intensive banking regulations.
In the past decade, the investment and credit demand of Chinese individuals has surged along
with the country’s rising middle class, and technological development in finance has greatly
facilitated person-to-person lending on the Internet. China has over 700 million Internet users,
many of whom have developed the habit of shopping online and making digital payments.3
3 In a survey by Ernst & Young (2017) of 20 markets, in China, 58% of consumers have used Fintech savings and
investment services, compared with 27% of US consumers. The contrast is even greater for the adoption of Fintech

7
Unlike in the U.S., where borrowers are required to have a minimum FICO score to enter the
P2P lending market,4 in China anyone with an identity card and a bank account can post loan
requests on the website.5 Data from Wangdaizhijia show that the number of operating OML
websites soared from only 10 in 2010 to 3,984 by March 2016, and facilitated cumulatively
RMB 1.745 trillion ($ 268.4 billion) in loans. Although this emerging market is relatively small
compared with the country’s colossal financial system,6 by any measure of size, China is the
world’s leader in online marketplace lending (The Economist, 2017).
2. Sample and Variables
3.1 Measuring Province-level Social Capital
Trust, cooperative norms, and associations within groups each fall within the elastic
definitions that scholars have applied to the term social capital (Knack and Keefer, 1997). In
online marketplace lending, lenders and borrowers are anonymous strangers. We focus on the
provincial social capital of borrowers because lenders choose borrowers (not vice versa) based
on an array of borrower information, including a borrower’s (ID card-consistent) place of origin.
Following the social capital literature in economics and finance, we measure provincial
social capital using the following indicators: voluntary blood donation, NGO participation,
enterprise trustworthiness, and citizen trustworthiness. Our first measure is voluntary blood
donation per capita in a province. As Guiso, Sapienza, and Zingales (2004) argue, there are
neither legal nor economic incentives to donate blood. The activity is likely driven by individuals’
civic-mindedness in overcoming collective action problems. Several notes regarding this variable
are in order: First, following Ang, Cheng, and Wu (2015), this variable is measured as the
milliliters of blood donated voluntarily in a province, divided by its population in 2000, the only
borrowing services, with 46% of Chinese consumers indicating they have used these services, compared with 13%
of US consumers. See EY Fintech Adoption Index 2017, available at:
http://www.ey.com/Publication/vwLUAssets/ey-fintech-adoption-index-2017/$FILE/ey-fintech-adoption-index-
2017.pdf 4 For example, In the U.S., online marketplaces such as Prosper require a minimum FICO score of 640, Lending
Club requires a minimum of 660 for borrowers to engage in the market. 5 Note that, in China, there is no personal credit scoring system such as FICO in the U.S., nor is there a personal
bankruptcy law to protect creditors. 6 For example, the outstanding balance of P2P credit is roughly 0.8% of China’s total bank loans in 2016. (The
Economist, 2017).
8
year that complete province-level data from the Chinese Society of Blood Transfusion is
available.7 Second, in China, the blood donation law clearly states that blood can only be
collected by the National Blood Center (NBC) of China, and is without compensation. The NBC
has operating branches in all provinces, and adopts the same medical procedures across all
regions, mitigating the concern that the blood donation level is affected by differences in the
quality of healthcare or medical infrastructure among provinces. We conjecture that individuals
who live in regions with high incidences of blood donation are under higher social pressure and
internal norms to behave cooperatively. Table 1 Panel B (Column 2) shows large variance
among Chinese provinces, with an average blood donation of 3.43 ml/1000 people in Shanghai
to only 0.017 in Yunnan.
Our second indicator is NGO participation, measured by the number of people registered in
non-governmental organizations (NGOs) per thousand people in a province. NGOs are typically
funded by donations and operated by volunteers, with aims to address social needs such as
poverty reduction, environmental protection, and rights of disadvantaged groups. Individuals
growing up in regions with higher NGO participation typically are more civic-minded, more
caring, and less likely to behave in an opportunistic manner. Our provincial NGO participation
data are hand-collected from the Chinese Civil Affairs Statistical Yearbook of 2010.8 Panel B
(Column 3) shows Shanghai as the province with highest NGO participation (4.4 registered NGO
members per thousand population), and the lowest is Tibet, with only 0.03.
Apart from outcome-based proxies of social capital, we measure the perception of Chinese
citizens on the “trustworthiness” of non-specific members of another, or their own, province. Our
third measure, provincial “enterprise trustworthiness,” draws from a national survey of Chinese
enterprises in 2000 (Zhang and Ke, 2003).9 In this survey, questionnaires were sent to over
15,000 managers of companies in every province of China. Over 5,000 usable responses were
received and respondent managers cover firms from every two-digit industry and ownership type.
Specifically, our “enterprise” variable is elicited from their answers to the question, “According
to your experience, could you list the top five provinces where the enterprises are most
7
We are grateful to Ang, Cheng, and Wu (2015) for sharing these data with us. 8 For a robustness test, we use the average of the level from 2010 to 2015, and the results are similar across those years.
9 A similar, enterprise trustworthiness survey was used by Burns, Meyers, and Bailey (1993) and Guiso, Sapienza, and Zingales
(2009) in five major European Community countries.

9
trustworthy?” We assign scores to each ranking of provinces and aggregate them to obtain the
province’s average score of enterprise trustworthiness.10
Panel B (Column 4) shows Shanghai
(22.7) leads Chinese provinces in enterprise trustworthiness, followed by Beijing (16.6) and
Guangdong (10.1). The least enterprise-trustworthy province appears to be Hainan (0.1).
Our fourth measure, “citizen trustworthiness,” follows Wu, Firth, and Rui (2014) and uses
data from the China General Social Survey (CGSS). The CGSS was conducted jointly by the
Survey Research Center of the Hong Kong University of Science and Technology and the
Sociology Department of the Renmin University of China in 2003, and received 5,894 completed
responses. Respondents encompass Chinese residents in 125 counties from 28 provinces. Our
“citizen” variable is elicited from respondent answers to one question, “How trustworthy are the
people in your city?” The response ranges from 1 (“highly untrustworthy”) to 5 (“highly
trustworthy.”). We calculate province i’s level of trustworthiness by aggregating the average
score of citizens from that province. One important caveat is that, unlike the third measure,
“enterprise,” which is based on respondents’ ranking of other provinces, our fourth measure,
“citizen,” reflects in-group bias, i.e., people tend to place higher generalized trust in people from
their own cities, even if the overall social-capital level of that province may be low. Consistent
with this conjecture, Panel B (Column 5) shows much smaller variances among scores given by
citizens of each province. Shanghai ranks second (2.40), surpassed by Jiangxi (2.442), and the
least trusting provinces appear to be Gansu (2.014) and Guizhou (2.014).
To account for intrinsic biases/limitations of each indicator, we construct a composite,
provincial “trust” index by applying principal component analysis (PCA). Table 1 (Panel A)
shows the results of the PCA for our proxies of trust. This method shows that only one
component has an eigenvalue larger than one (2.967). All four indicators have positive loadings
and closely correlate with the index. Our composite index gives roughly equal weighting to
blood donation, participation in NGOs and enterprise trustworthiness, but somewhat lower
weights to the citizen trustworthiness score. Based on the composite trust index (Panel B,
Column 1), Shanghai, Beijing, and Guangdong are the three most trusting provinces, while
Gansu, Guizhou, and Yunnan are the least trusting.
10
To alleviate the home bias, Zhang and Ke (2003) created another score by excluding managers who select their own province
as one of the top five. They show the two scores are not significantly different from each other.

10
[Insert Table 1 here]
3.2 The Renrendai Online Marketplace
Much of our data comes from the Renrendai online marketplace (“RRD”), which contains
loan- and investment-level data for all its transactions from September 2010 to December 2015.
RRD is one of the largest P2P lending platforms in China, following the model of the Lending
Club in the U.S. Since its official launch in 2010, RRD has over 2.5 million members and
facilitated 13 billion RMB (USD 2 billion) in funded loans as of Dec 31, 2015. We obtained this
proprietary dataset from Changsha Aijie Information Technology Co. Ltd (Aijie).
The lending process on RRD begins with a loan application. Users join renrendai.com by
providing a cell phone number, which is verified by the website. To post a loan request on RRD,
a prospective borrower must go through additional verification. Borrowers should have a valid
national identity card, a valid bank account,11
and provide personal information about themselves
including age, gender, education, income, marital status, home ownership, employment
information, and address. This information is verified by RRD, which also requires borrowers to
provide supporting materials, e.g., a copy of their National ID card, work certification, and
diploma. All users are identified by a username that is chosen when registering.
A minimum credit rating grade is obtained once the three items listed above are verified. To
make a loan request, called a listing, borrowers must supply a title, description, loan amount, and
maturity. All loans are unsecured personal loans, and their maturity ranges from one to 48
months. In addition, each listing shows personal information, such as age, gender, education,
income, marital status, home ownership, employment information, and location. RRD normally
takes from one to three working days to verify loan information. Loans with incomplete
information or are unverified are not allowed for online listing.
Two important features for listings on RRD are worth highlighting: First, unlike other
platforms, on RRD, borrowers are not allowed to upload their photograph. Duarte, Siegal, and
11
Bundling one’s bank account to one’s RRD user account enables the transfer of money in loan transactions. If the
user does not have a bank account, the RRD would automatically create a bank account for the user at Minsheng
Bank.

11
Young (2012) show that on Prosper, a trustworthy appearance in the borrower’s photographs is
associated with better loan outcomes. Therefore, this factor can be safely dismissed in our setting.
Second, borrowers have no choice in their interest rate: RRD assigns an interest rate and
calculates monthly repayment based on its proprietary credit-rating model and the self-reported
information of the borrower.12
This is a useful feature of the institutional setting, since given the
pre-set interest rate, the equilibrium outcome of whether the loan is provided depends directly on
the willingness of lenders to supply credit at the given interest rate.
Individual lenders on RRD can choose one of two channels to make an investment on loan
listings. The “automatic bidding” (zidongbiao) channel allows lenders to lock in a sum of money
on RRD with pre-set criteria for bidding and authorizes RRD to make investments for them once
the eligible loan listings are available. The other channel, “manual bidding” (sanbiao), requires
lenders to manually select and make investment decisions themselves. In this study we use the
manual bidding channel data, since this method is P2P lending in its essence, for it reflects
bounded rationality of individual lenders based on the information they have, their cognitive
limitations, and the finite amount of time they have to make a decision.
For manual bidding, a listing is typically open for several days. Figure 1 shows the entry page
for lenders, where all active listings are shown with borrower’s user ID, loan title, borrowing
amount, asking rate, credit rating, percentage completed, and time remaining. Lenders can search,
filter, and sort these listings. By clicking on a specific listing, lenders can observe additional
information about the listing, such as loan description, borrower’s age, gender, place of origin,
education, income, home ownership, and authentication status, but no photograph of the
borrower is allowed (Figure 2).
To bid on a listing, a lender must submit the bid amount. The minimum bid amount is RMB
50 (USD 7.7) and RRD does not encourage one lender to bid for the whole loan. A listing that
12
The exact credit rating model used by RRD to assign a credit rating is unknown due to its proprietary nature.
However, unlike in the U.S. where an individual’s FICO scores can be obtained, in China the personal credit score
system is non-existent. Each P2P claims to have its own credit-rating model based on available information. For
example, RRD classifies borrower credit ratings into seven categories: AA, A, B, C, D, E, and HR (high risk). A
minimum rating is acquired when the borrower supplies the minimum information required by RRD to open an
account. If borrowers voluntarily provide more documentary proof, such as a bank income statement or home-
ownership certificate, and these details are verified by the website, their credit rating will increase. Moreover, if the
borrower has a good repayment history on this platform, the credit rating will also increase.

12
reaches 100 percent funding status becomes a successful loan, otherwise the borrower receives
zero funding. As a result, a successful loan typically has multiple lenders. Once a successful loan
is verified by RRD, funds are transferred from lender(s) to borrower, minus a platform service
fee. The service fee varies depending on the borrower’s credit rating.
Subsequently, borrowers are obligated to repay the principal and interest in monthly
installments. The repayments are proportionally distributed to the lenders of the loan. If a
repayment is overdue (i.e., there is insufficient fund in the borrower’s bank account to repay the
interest), RRD makes several attempts to recover the loan, including email, text messages, and
calling the borrower. However, as a platform, RRD does not bear the credit risk of the borrower.
3.3 Variables of Interest and Controls
Appendix A includes detailed definitions for each variable and Table 2 contains summary
statistics on the variables. We categorize our variables of interest into: (1) listing and loan, (2)
borrower, (3) provincial environment, and (4) lender characteristics. Each is introduced in order.
We obtain information on the funding success or failure of each loan listing. For each funded
loan, we obtain the size (in RMB), maturity (in months), interest rate (in basis point spread over
benchmarked lending rate of PBOC), number of lenders involved, stated purpose of the loan (in
descriptive text), number of words used to describe a loan, and its default status.
For each borrower, we obtain the user ID, age, gender, place of origin (province), marital
status, income range, education, work experience, home ownership status, and borrowing history
on RRD. We also obtain the credit rating assigned to each borrower by RRD (in seven categories:
AA, A, B, C, D, E, and HR).
For provincial institutional variables, other than the five trust measures described above, we
first include GDP per capita to measure the economic environment. To capture the legal
environment of a province we include the number of law offices per ten thousand residents. The
density of law offices captures the demand for legal services in a province and is positively
associated with the rule of law (Ray, Shleifer, and Vishny, 1996). We proxy the financial
environment of a province as follows: Loan is the ratio of total bank loans to provincial GDP,

13
which measures the size of the financial market (Rajan and Zingales, 1998). In our regressions,
institutional variables of a province in the year t-1 are matched with loans originating in year t.
3.4 Summary Statistics
Our sample comprises 247,565 loan listings on RRD with complete information on each
variable from September 2010 to December 2015. Panel A of Table 2 reports that about 24.9
percent of loan listings are fully funded. Of the 61,641 fully funded loans, the mean of loan size
varies significantly from RMB 48.1 thousand (USD 7,400) to 3 million (USD 461,538). On
average, the loan rate is 2.13 times the bench market lending rate, with significant variation from
0.59 to 5.38 times the bench market lending rate. Compared with the stability of China’s
benchmark lending rate, these large pricing differences, at least in part, reflect differences in
borrower risks. The mean and median loan maturity is 18.78 and 18 months, respectively. We
construct an additional variable longterm, which is a dummy variable that equals one if the loan
maturity is more than 12 months, and zero otherwise. It shows that 80 percent of borrowers
request a long-term loan. Loan ownership also varies considerably across borrowers. The
average loan has 35.48 lenders, ranging from 1 to 1370 lenders. Finally, about five percent of
funded loans incur default.
Panel B reports the summary statistics of demographics, income, and educational information
for each borrower. The statistics suggest that most borrowers are young, male, married, less
educated, have low credit scores and a credit history on RRD. In addition, the median income
level of borrowers is less than ten thousand RMB (USD 1,538) per month, and only 44 percent
of borrowers own a home.
Panel C of Table 1 also reports the summary statistics for provincial-level variables. It shows
that there is a large variation in the development of the economy and financial markets across
China’s provinces.
[Insert Table 2 here]
It is worth mentioning that we do not include either province-level and borrower-level fixed
effects in most of our regressions, because our trust index is time-invariant for all borrowers in

14
the same province. In addition, most borrowers have only one loan in our sample period.
However, to examine the impact of the interactions between borrowers’ characteristics and the
trust index on loan items (Table 5), we perform province-level fixed-effect regressions, while
dropping all provincial-level variables.
3. Social Capital and Credit: Loan-level Empirical Results
In our regression model, we begin by testing how social trust affects loan characteristics and
the probability of a listing being fully funded. We next consider how investors’ reliance on social
trust varies across characteristics of heterogeneous borrowers, such as their credit history and
education. In a robustness check, we implement a two-stage, least squares instrument regression.
4.1 Funding Success
Table 3 reports the logit regression result of a listing being fully funded. Specification 1
includes our trust index with all available information on the borrower’s characteristics and
regional environmental variables. Consistent with our expectation, it shows that social trust in
the borrower’s home province increases the probability that a listing will be fully funded. The
coefficient is statistically significant at the one-percent confidence level. As the reported
coefficients are the effect of a marginal change in the regressors on the probability of obtaining a
loan, we can estimate the economic size of this trust effect. All else being equal, the probability
of obtaining a loan for borrowers in the highest-trust province (Shanghai) is 1.5 percentage
points (or 5 percent) higher probability of obtaining a loan than in the lowest-trust province
(Gansu).
The signs of control variables are consistent with our expectation. For example, borrowers
with higher credit rating, personal income, and education level, and with longer work experience
have a greater probability of receiving fully funded loans. On the other hand, we find that
borrowers with home ownership and those with larger numbers of prior loans have a lower
probability of receiving fully funded loans. This finding is consistent with investors’ being more
hesitant to fund borrowers with other concurrent liabilities (e.g., a mortgage on their home or

15
other outstanding loans on RRD). Finally, we find female borrowers are less likely to have their
loans fully funded than are male borrowers.
All provincial-level control variables have the expected sign and most of them are
statistically significantly different from zero. The level of per capita GDP and measure of
financial development (loan) of a province have a positive and statistically significant effect on
funding probability. In contrast, in areas with a relatively stronger legal environment, a
borrower’s loan listing is less likely to be funded.13
In specifications 2-5, we check the robustness of findings by using four proxies of
trustworthiness, while keeping the same set of controlling variables. These checks show that
three out of our four trustworthiness proxies (with the exception of “citizen”) are positively and
statistically significantly related to funding probability.
[Insert Table 3 here]
4.2 Loan Ownership, Size and Pricing
Table 4 uses the same specifications to estimate the effect of trust on the number of lenders
for a given loan (Ownership), loan size (Amount) and pricing (Interest rate), using all fully
funded loans. In addition, we also controlled for whether the loan is long term (maturity over 12
months) or short term (maturity below 12 months). Panel A of Table 4 reports the estimated
effects of our trust index on these variables. We find first that a borrower’s credit profile, income,
and education produce expected results, i.e., a better rated, educated, and high-income borrower
with longer work experience can borrow larger amounts at lower interest rates. Loan ownership
becomes more diffuse when borrowers are old, female, married, and have higher credit scores,
higher income levels, and own a home. Many of these results are consistent with the findings of
the small business lending literature (e.g., Petersen and Rajan, 1994). As expected, a long-term
loan is also associated with a larger loan amount, higher interest rate, and diffused ownership.
Turning to our trust index, we find that social trust in a borrower’s home province has a
negative and statistically significant effect on the number of lenders for a given loan (Columns (1)
and (2)). It indicates that there is more risk-sharing demand by investors when borrowers are
13
One possible explanation is that the efficiency of the legal system reduces the reliance on peer-to-peer lending for
external finance.

16
perceived as less trustworthy. This result is consistent with Ongena and Smith (2000) and Qian
and Strahan (2007), who show that the credit rights in a country are positively associated with
concentration of loan ownership. In addition, the level of per capita GDP has a positive effect on
the number of lenders for a given loan.
We find a positive and statistically significant association between the trust index and loan
amount in both specifications (Columns (3) and (4)). The economic effect of trust is also large: A
one-standard-deviation increase in social trust is associated with a 2-thousand RMB increase in
loan amount. Thus, impressions regarding a borrowers’ trustworthiness have a positive effect on
loan size.
Finally, results in Columns 5 and 6 show that our trust index is negatively related to loan
interest rates, and that the coefficients are both statistically and economically significant. A one-
standard-deviation increase in a borrower’s trust index leads to about a 0.7% decline in interest
rate. Taking an extreme case, a loan to a borrower in Gansu (where the trust index is -1.887)
would charge an interest rate around 3.1 percent higher than a loan to a borrower in Shanghai
(where the trust index is 5.768). Thus, borrowers from higher-trust regions are more likely to
obtain credit at a lower interest rate. Table 4 also shows that borrowers pay a lower interest rate
in provinces where their home legal environment is stronger, consistent with the finding of Qian
and Strahan (2007). Finally, greater economic and financial development is associated with
higher interest rates (Column (4)).
Panel B of Table 4 repeats the tests in Panel A, using our four proxies of borrower social trust,
controlling for borrower characteristics, regional environment, and loan maturity. It shows that
most proxies of social trust are negatively (and significantly) related to loan ownership,
positively (and significantly) related to loan size, and negatively (and significantly) related to
interest rate, thereby validating our baseline results.
[Insert Table 4 here]
4.3 When Does Social Capital Matter More?

17
If our proposition is correct that investors assess borrower quality based on the social capital
of their origins, then we expect that the marginal benefit of social capital to differ between low-
and high-quality borrowers. The hypothesis is that lower-quality borrowers would benefit more
from the high social capital of their region, given the adverse selection (Akerlof 1970).
To test this hypothesis, we first study whether the effect of social capital on credit varies
across borrower gender, income, and work experience. Table 5 reports provincial-level, fixed-
effect regressions relating to funding success and our ownership, loan size, and pricing variables
to the control variables and the interactions of trust and various borrower characteristics. Each
cell shows the estimates for the interactions between trust and specific borrower characteristics,
e.g., age, gender, marital status, income, and work experience. The direct effect of trust is not
identified in models of the province fixed-effect regressions, as the fixed effects absorb any
cross-province variations. Since many loans are made in each province but there is no variation
in our within-province trust index, we cluster errors across all borrowers in the same province.
We first find that the impact of our trust index on loan ownership varies significantly with
borrower gender, income, and work experience. Given the overall negative effect of trust on the
number of lenders (Table 4), the positive coefficients for the interactions of borrower income and
trust and work experience and trust suggest that social trust affects loan ownership more
significantly when a borrower has lower income and shorter work experience. The interaction
between trust and gender is negative, suggesting that trust affects loan ownership most when the
borrower is female. We also find that marital status, borrower income and work experience
complement the effects of trust on loan size. Married borrowers, with a higher level of income
and longer work experience, who live in trust-intensive provinces, obtain the largest loan
amounts (Columns 5 and 6). Regarding the interest rate of a loan, we find that the interaction
between work experience and trust is positive. Thus, given that the overall relation between trust
and interest rate is significantly negative (Table 4), the impact of trust on lowering interest rates
is stronger for borrowers with shorter work experience.
[Insert Table 5 here]
18
4.3.1 Less-educated Borrowers
We separately investigate the impact of social capital on borrowers with low and high levels
of education, because prior research has shown that an individual’s human capital is closely
correlated with education (Lusardi and Mitchell 2008; Behrman et al., 2012), and that borrowers
with lower levels of education are often discriminated against for credit by formal financial
institutions. Thus, if regional social capital benefits lower-quality borrowers, we expect its effect
on credit to be stronger for lower than for higher educated borrowers. To test this hypothesis, we
re-estimate our benchmark specifications, splitting the sample between borrowers with higher
and lower education levels. A borrower is classified as high (low) education if his or her highest
qualification is a bachelor’s degree or above (post-tertiary or below).
Table 6 Panel A presents the results. The first two columns report the logit estimates of the
effect of social trust on the likelihood of funding success. Social trust has no significant impact
on the funding success of highly educated borrowers. In contrast, however, in the sample with
less-educated borrowers, the effect is twice as large and is statistically significant at the one-
percent confidence level.
Columns (3) and (4) show that our trust index has a negative and statistically significant
effect on the number of lenders in both subsamples. It seems that the number of lenders is more
sensitive to social capital among highly educated people, but the difference between the less- and
the highly educated groups is not statistically significant.
Columns (5) and (6) show that the effect of social capital on loan size is both large and
statistically significant among less-educated borrowers but is insignificantly negative among
highly educated borrowers. The difference between them is statistically significant at the five-
percent level.
Columns (7) and (8) report the estimated impact of social capital on interest rates.
Surprisingly, the loan interest rate is more sensitive to social capital among highly educated
people. This difference is also statistically significant at the five-percent level. In conjunction
with the impact of social trust on loan size, our results suggest that lenders are more willing to
fund larger loans to under-educated borrowers from regions of high social capital but are less
willing to charge lower interest rates.

19
4.3.2 First-time Borrowers
On the RRD platform, a significant proportion of borrowers engage in more than one credit
transaction. Rajan (1992) argues that such repeated interaction provides lenders with soft
information about a borrower’s credit quality. If social capital reduces information friction in
person-to-person lending, then we expect its effect to be larger in severe information
asymmetries, i.e., for “first-time” borrowers with no credit history on the platform. Panel B of
Table 6 separately reports the regressions of social trust on our variables of interest on the sub-
sample of “first-time” and “repeat” borrowers. The results in Columns (1)-(8) confirm this
conjecture. With the exception of loan amount, the coefficients for the trust index on funding
success, loan ownership, and interest rate are all statistically and economically stronger for first-
time than for repeat borrowers.
[Insert Table 6 here]
4.4 Robustness Tests on Sample and Selection
Our results so far have shown significant and pervasive correlations between regional social
capital and loan outcomes for borrowers. To gain more confidence in the causal relationship, we
perform the following robustness tests.
First, we are concerned that a large sample such as ours can make insignificant results to
become statistically significant, i.e., yield type 1 errors. To check the robustness of our results,
we implement a bootstrap method. More specifically, we draw a subsample that contains half as
many observations as the whole sample and repeat our regression analysis for this subsample.
We then replicate this procedure 1000 times and obtain the resulting bootstrap statistics.
Columns (1)-(4) of Table 7 presents the bootstrap results, and shows that we obtain similar
results.
Next, we address the issue of selection bias. Data on loan contract terms allow us to
investigate how social capital affects loan size, pricing, and ownership. However, this data set is
conditional on loans being fully funded. Loans not receiving 100 percent funding are not
included in our sample. To correct for this possible problem, we employ the Heckman two-step
treatment effects procedure. In the first equation, we estimate the probability that a loan will be

20
fully funded, where the dependent variable is a dummy for the approval of loan lists. This
equation uses the same specification as in Column (1) of Table 3. In the second equation, we use
the inverse Mills’ ratio to correct the selection bias for the performance equations. These
equations use the same specifications (1), (3) and (5) of Table 4. Columns (5)-(7) of Table 7
present the results of a Heckman selection model, and we find that the effect of social capital on
loan ownership, size, and pricing remains significant.
[Insert Table 7 here]
4.5 Unobserved Heterogeneity and Instrumental Variable Analysis
Region-based social capital is clearly not randomly assigned. Nor, however, is it a choice
variable. Accordingly, we treat regional social capital as both historically and econometrically
predetermined. The main identification challenge, hence, is not self-selection but is systematic
differences between high- and low-social-capital regions. In our regressions, we control for
observable differences such as economic, legal, and financial environments to ensure that they
do not drive any differences in borrower loan outcomes, which results in unobserved
heterogeneity.
Short of random assignment, the presence of unobserved heterogeneity in observational data is
inevitable; however, it is important to note what it does and does not affect in our setting.
Unobserved heterogeneity does not affect the validity of the fact that borrowers from high-
social-capital regions have better loan outcomes, regardless of any systematic unobservable
dimensions of difference between high- and low-trust regions. It may, however, affect our
interpretation of this fact. In other words, do our trust index and proxies truly capture social trust,
or do they merely reflect unobservables?14
To tackle this potential problem, we employ an
instrumental variable approach.
We employ two instruments related to the cooperative norms in a province. The first is the
province’s agricultural history. Talhelm et al. (2014) find Chinese regions that have a history of
farming rice have a more cooperative culture than those with a history of growing wheat.
Farmers in rice-growing regions are more likely to form cooperative labor exchanges, especially
14
For example, regional social capital can be highly correlated with government intervention.

21
when transplanting and harvesting, which are activities that must be completed within a short
window of time. In economic terms, paddy rice makes cooperation more valuable, encouraging
rice farmers to form tight relationships based on reciprocity and to avoid behaviors that create
conflict. In comparison, wheat is easier to grow. Wheat does not need to be irrigated, and wheat
farmers can rely on rainfall, which they do not coordinate with their neighbors. Consequently,
we calculate the logarithm of “rice suitability” index of Chinese regions (Rice_suit). The index is
a z score of the environmental suitability of each province for growing wetland rice, based on the
United Nations Food and Agriculture Organization’s Global Agro-ecological Zones database.
Our second instrumental variable is the proportion of the largest ethnic group in a province’s
total population (Ethic). Prior studies have shown that ethnic diversity is associated with
increases in social conflict (Easterly and Levin 1997) and reduces the trust environment in an
area (Guiso, Sapienza, and Zingales, 2009). There are 56 ethnic groups unequally distributed
across China’s 31 provinces, each with its own language, core values, and customary beliefs. The
diversity of ethnic groups in a region increases communication costs and, thus, should be
inversely related to cooperative behaviors (Ang, Cheng, and Wu, 2015).
To argue the exclusion restriction, it is conceivable that regional rice suitability and number
of different ethnic inhabitants, developed over many generations, cannot directly affect any traits
of today’s Internet lending, other than through their impact on the norms and behaviors of
borrowers from a specific region. This argument is consistent with an eco-social approach in
cross-cultural psychology (Berry et al. 1992; Georgas, van de Vijver, and Berry 2004), which
argues that biological and cultural adaptations are implanted in the human capital of a social
system, as well as in the psychological characteristics of that population.
Table 8 reports the results from the instrument variable regression of both probit and linear
models for funding success, and linear regression models for loan ownership, amount, and
interest rate, respectively. We also control for loan and borrower variables, regional
environmental variables, and year fixed effects, but their coefficients are not reported for brevity.
The first-stage results in Panel B show that both variables are positively and statistically
significantly correlated with the trust index. The partial F-statistics in the first stage total more
than 10,000, which is sufficiently large to alleviate concerns regarding weak instrumental

22
variables. The rice-suitable index and the population percentage of major ethic groups are strong
predictors of the level of trust. The second-stage results presented in Panel A of Table 8 clearly
show that the trust index is still a strong determinant of funding success, loan ownership, amount,
and interest rate.
[Insert Table 8 here]
4. Dyadic-level Analysis
One important feature of debt crowd funding is that each loan is sliced into smaller
investments by multiple lenders. On the RRD platform, lenders are encouraged to diversify their
risk by bidding in small amounts to different borrowers. This procedure allows us to conduct
more informative, dyadic-level analysis by observing the size of the stake that an individual
lender is willing to invest for a specific borrower, and at what interest rate.
In our dyadic-level analysis, each unit of observation is a lender-borrower pair. We first
examine the robustness of our baseline results by controlling for lender fixed effects. We then
isolate a subsample of lender-borrower dyads for which we can collect individual characteristics
at both ends of the loan. This enables the investigation of how lender-borrower dissimilarities
affect credit outcomes.
5.1 Lender fixed effects
In our fully funded loans, we identify a sample of 2,173,006 investment observations, in
which 114,123 lenders invest in 61,641 loan listings. Each observation represents a lender-
borrower pair. A borrower who obtains funding from multiple lenders will generate multiple
observations. We conduct a multivariate ordinary least squares (OLS) regression analysis in
lenders’ bid amount and interest rate, modeled as a function of borrowers’ characteristics:
𝑏𝑖𝑑_𝑎𝑚𝑜𝑢𝑛𝑡𝑖𝑗,𝑡(𝑖𝑛𝑡𝑒𝑟𝑒𝑠𝑡𝑖𝑗,𝑡) = 𝛽0 + 𝛽1𝑡𝑟𝑢𝑠𝑡𝑗 + 𝛽2𝑐𝑜𝑛𝑡𝑟𝑜𝑙𝑗,𝑡 + 𝛿𝑖 + 𝛿𝑡 + 𝑒𝑖𝑗,𝑡 (1)
where 𝑏𝑖𝑑_𝑎𝑚𝑜𝑢𝑛𝑡𝑖𝑗,𝑡 (𝑖𝑛𝑡𝑒𝑟𝑒𝑠𝑡𝑖𝑗,𝑡) represents the bid amount (interest rate) of lender i in
borrower j in time t. 𝑡𝑟𝑢𝑠𝑡𝑗 is the social capital of borrower j, 𝑐𝑜𝑛𝑡𝑟𝑜𝑙𝑗,𝑡 represents loan and
borrowers’ characteristics and regional economic and financial variables. 𝛿𝑖 , 𝛿𝑡 represent the
lender fixed effect and year fixed effect, respectively. 𝑒𝑖,𝑡 are standard errors.

23
Results presented in Table 9 confirm the baseline finding: A borrower’s social capital has a
positive impact on a lender’s bid amount, and a negative impact on interest rate. These effects
are all statistically significant at the one-percent level. A one-standard deviation increase in the
borrower’s social capital increases the lender’s investment by 86.1 RMB, an increase of almost a
fifth in the median amount of a lender’s investment (500RMB).
[Insert Table 9 here]
5.2 Lender-Borrower Pairs
One caveat to note with our data is that, although RRD assigns each lender a unique user ID,
it does not require lenders to provide their personal information. Fortunately, a group of lenders
is also borrowing on the same platform and, thus, is required to provide personal information.
This generates a sizable paired sample, in which both borrowers’ and lenders’ information is
available.
We use the lender’s user ID to match the ID of borrowers, which provides us 1,745 unique
lenders who invest in 22,084 loan projects, generating 51,796 lender-borrower pairs with
complete information. Since we know the location of both lenders and borrowers, we can
measure the physical distance between them (the distance of provincial capitals between a lender
and a borrower).
Panel A of Table 10 reports summary statistics for the main variables of both lenders and
borrowers. Individuals from high-social-capital regions are more likely to be lenders. The
difference in social trust between the two groups is economically large and statistically
significant. Borrowers are more likely to be female, married, older, less-educated, with shorter
work experience, and are less likely to own property. Interestingly, borrowers tend to have
higher credit ratings and income, indicating the importance of repayment ability. In addition,
lenders are more likely to come from rich regions with better legal and financial development.
Panel B of Table 10 shows the investment information for our subsample. The mean and
median size of lender investment are 1,000 RMB and 300 RMB, respectively. Most loans are
long term and charge 2.22 times the benchmark lending interest rates15
. The mean and median
15
One natural concern is that borrower-lenders can differ from non-borrower lenders in systematic ways. For example, one can
expect borrower-lenders to be less risk-averse than ordinary lenders. Assuming that is true, then we should find systematic

24
distances between lender and borrower are 968.07 KM and 969.31 KM, respectively, suggesting
that most lending take place across provinces.
Panel C reports results from the following multivariate OLS regression analysis in lenders’ bid
amounts (𝑏𝑖𝑑_𝑎𝑚𝑜𝑢𝑛𝑡𝑖𝑗,𝑡) and interest rates (𝑖𝑛𝑡𝑒𝑟𝑒𝑠𝑡𝑖𝑗,𝑡)
𝑏𝑖𝑑_𝑎𝑚𝑜𝑢𝑛𝑡𝑖𝑗,𝑡(𝑖𝑛𝑡𝑒𝑟𝑒𝑠𝑡𝑖𝑗,𝑡) = 𝛽0 + 𝛽1𝑑_𝑡𝑟𝑢𝑠𝑡 + 𝛽2𝑑_𝑐𝑜𝑛𝑡𝑟𝑜𝑙𝑡 + 𝑑𝑖𝑠𝑡𝑎𝑛𝑐𝑒𝑖,𝑗 + 𝛿𝑡 + 𝑒𝑖𝑗,𝑡 (2)
where 𝑑_𝑡𝑟𝑢𝑠𝑡 represents the difference per social-capital region between lender i and
borrower j. The negative (positive) value implies that borrowers come from higher (lower)
social-capital regions than do lenders. Thus, results from applying this formula allow us to
estimate directly whether loans flow from individuals in low-social-capital regions to individuals
in high-social-capital regions, or whether the interest rate is lower when individuals in low-
social-capital regions extend loans to individuals in high-social-capital regions. 𝑑_𝑐𝑜𝑛𝑡𝑟𝑜𝑙𝑡
represents the difference for control variables between lender i and borrower j. We also include
the physical distance between lender i and borrower j (𝑑𝑖𝑠𝑡𝑎𝑛𝑐𝑒𝑖,𝑗). Since the distance between
lender i and borrower j is time invariant, 𝑑𝑖𝑠𝑡𝑎𝑛𝑐𝑒𝑖,𝑗 also captures the lender-borrower pair fixed
effect in our regression.
The first three columns in Panel C report results for lenders’ bid amount in a given loan with
different specifications. In line with previous findings, the negative coefficient of the difference
in trust (d_trust) confirms that individuals in low-social-capital regions lend more to those from
high-social-capital regions. We also find that the bid amount increases when the borrower is
female, married, and has longer work experience (the coefficients of these variables are negative).
Finally, the positive coefficients in the variables of age, education, law_office and pgdp means
that bid amount increases as the lenders are older, more highly educated, and from regions with
better legal and economic development than are borrowers. The distance between lender and
borrower seems to have a limited impact on bidders’ investment.
Columns (4) to (6) report the results on the interest rate with different specifications. The
coefficient of the difference in social capital (d_trust) is positive and statistically significant at
the one-percent level, indicating that interest rate decreases as the borrower has higher social
differences in loan properties between our average and paired-loan sample. However, as Panel B shows, there are no statistically
significant differences in loan terms, as reported in Table 2. This result mitigates concerns about selection bias.

25
capital than the lender. The positive coefficients on the differences in control variables, i.e., age,
gender, education, and marital status confirm that interest rates decrease as the borrowers are
older, female, married, and more highly educated in rich regions. We also find that interest rates
decline as the lenders have lower credit scores than the borrowers. Finally, the positive
coefficient in lndistance means that interest rates rise with an increase in the distance between
lender and borrower.
Taken together with results of Table 9, these results suggest that lenders from high-social-
capital regions offer smaller loans at higher interest rates to borrowers from low-social-capital
regions.
[Insert Table 10 here]
5.3 Social Capital or Home Bias?
It is conceivable, however, that the effect of regional social capital on credit merely reflects
the “home bias” of the investor. Prior work has shown that investors tend to trust counterparties
in their home more than those in remote regions (Grinblatt and Keloharju, 2001), for distance is
associated with higher cost of information (Petersen and Rajan, 2002). For example, Coval and
Moskowitz (1999) find US investment managers exhibit a strong preference for locally
headquartered firms. Chan, Covrig, and Ng (2005) show that mutual fund managers allocate a
disproportionately larger proportion of their investments to domestic stocks. Therefore, our
results might be spurious if they are driven by lenders’ overweighting borrowers in a few high-
social-capital provinces.
To disentangle the effect of home bias from that of social capital on credit, we perform the
following tests. We first exclude investments in which both lenders and borrowers are from the
same province. We then include an indicator variable, which equals one if the two provinces
share the same border (border), and zero otherwise. We repeat the regression in Panel C of
Table10, and include both the dummy variable border and the interaction term border*d_trust.
Results in the first two columns show a slightly larger impact of the difference in social capital
between lender and borrower (d_trust) on the loan offering, relative to that estimated in Table 10.

26
Thus, the effect of social capital persists after including only cross-border investments. The
coefficient of border is negative and statistically significant at the 10-percent level, indicating
that lenders tend to offer smaller loans to borrowers in adjacent provinces. Furthermore, the
interaction term border*d_trust is significantly positive, which is the opposite sign as the effect
of d_trust, indicating that social capital affects loan size more when lenders’ and borrowers’
provinces are not adjacent.
Columns (3) and (4) of Table 11 shows that the impact of the difference in social capital
between lender and borrower (d_trust) on the interest rate is similar to those in Table 10. Lenders
from high-social-capital regions require higher interest rates from borrowers from low-social-
capital regions. This result still holds when we exclude investments in which both lenders and
borrowers are from the same province. In addition, the interaction term border*d_trust is
significantly negative in Column (4), which is opposite in sign to the effect of d_trust. This result
suggests that social capital has a stronger effect on interest rates when lenders’ and borrowers’
provinces are not adjacent.
Taken together, these results suggest that our results are not driven by the home bias of
investors. Moreover, social capital has a more pronounced impact on loan contracts when lenders
offer loans to remote borrowers.
[Insert Table 11 here]
5. Conclusion
How much do region-based stereotypes affect person-to-person economic exchange? We
answer this question using highly granular data from a debt-crowdfunding website. Drawn on the
real credit that individual lenders extend to a stranger, we find that borrowers from high-social-
capital regions have higher funding success, larger loan and bid size, lower interest rates, and
more concentrated loan ownership. Our evidence is consistent with the theory that the collective
reputation of a region, which develops generation by generation, has positive externalities on
their agents’ access to finance, especially from “outside” and “outgroup” investors. To the best

27
of our knowledge, this is the first paper to investigate the role of regional social capital in direct
rather than institutional lending.
We also find that borrowers of inferior credit quality benefit the most from the social capital of
their home province. This is consistent with adverse selection, but also sheds light on the
financial inclusion theory: low-income, low-education borrowers and those without credit history
are likely to be rejected by formal financial institutions, such as banks. Our result shows these
disadvantaged people can leverage on their home region’s social capital to access finance
through the Internet.
Finally, our evidence shows that the informative role of regional social capital becomes
weaker when counterparties share geographical or other similarities. To the extent that regional
social capital provides environmental pressure against opportunistic behavior, our results show a
possible supplementary relationship between heterogeneous networks in person-to-person
economic exchange.

28
References
Ahern, K. R., D. Daminelli, and C. Fracassi. 2015. Lost in translation? The effect of cultural
values on mergers around the world. Journal of Financial Economics 117(1): 165–189.
Akerlof, G. A. 1970. The market for" lemons": Quality uncertainty and the market mechanism.
The Quarterly Journal of Economics 84(3): 488–500.
Akerlof, G. A. and R.E., Kranton, 2000. Economics of Identity. Quarterly Journal of
Economics, August, 715-753.
Allen, F. J. Qian, and M.J. Qian, 2005, Law, finance, and economic growth in china, Journal of
Financial Economics 77, 57-116.
Ang, J. S., Y. Cheng, and C. Wu. 2015. Trust, investment, and business contracting. Journal of
Financial and Quantitative Analysis 50(3): 569–595.
Arrow, K. J. 1973. Information and economic behavior. Stockholm: Federation of Swedish
Industries.
Bae, K.H., and V.K. Goyal, 2009, Creditor Rights, Enforcement, and Bank Loans. The Journal
of Finance 64, 823–60.
Behrman J.R. , O. S. Mitchell, C.K. Soo, and D. Bravo. 2012. How Financial Literacy Affects
Household Wealth Accumulation. American Economic Review 102(3): 300–304.
Berry, J.W., Poortinga, Y. H., Segall, M. H., and Dasen, P. R. 1992. Cross-cultural psychology:
Research and applications. New York, NY: Cambridge University Press.
Bertrand, M and S. Mullainathan. 2004. Are Emily And Greg More Employable Than Lakisha
And Jamal? A Field Experiment On Labor Market Discrimination. American Economic
Review 94: 991-1013.

29
Biggerstaff, L., D. C. Cicero, and A. Puckett. 2015. Suspect CEOs, unethical culture, and
corporate misbehavior. Journal of Financial Economics 117(1): 98–121.
Bordalo P., Coffman K., Gennaioli N. and Shleifer A. 2016. Stereotypes. Quarterly Journal of
Economics 131(4): 1753-1794.
Bottazzi, L., M. Da Rin, and T. Hellmann. 2016. The importance of trust for investment:
Evidence from venture capital. Review of Financial Studies 29(9): 2283–2318.
Bourdieu, P. 1986. The Forms of Capital, in J.G. Richardson (ed.) Handbook of theory and
research for the sociology of education. New York: Greenwood Press, 1986, pp. 241-58.
Burns, P, A. Myers, and A. Bailey, 1993. Cultural Stereotypes and Barriers to the Single Market,
3i/Cranfield European Enterprise Centre, Cranfield School of Management Working Paper
SWP 20/93.
Cai, J., and G. Shi. 2014. Value of Faith: Evidence on Religious Environment and Cost of Debt.
Working Paper, Drexel University.
Chan, K., V. Covrig, and L. Ng. 2005. What determines the domestic bias and foreign bias?
Evidence from mutual fund equity allocations worldwide, Journal of Finance 60, 1495-
1534.
Coleman, J.S. 1988. Social Capital in the Creation of Human Capital. American Journal of
Sociology, 94S95-S120.
Coleman, J.S. 1990. Foundations of social theory. Cambridge, MA: Harvard University Press.
Cornell, Bradford, and Ivo Welch, 1996, Culture, information, and screening discrimination,
Journal of Political Economy 104, 542-71.
Coval, J. D., and T. J. Moskowitz. 1999, Home bias at home: Local equity preference in
domestic portfolios. The Journal of Finance 54, 2045-2073.
Davidson, R., A. Dey, and A. Smith. 2015. Executives’ “off-the-job” behavior, corporate culture,
and financial reporting risk. Journal of Financial Economics 117(1): 5–28.

30
DeBacker, J., B. T. Heim, and A. Tran. 2015. Importing corruption culture from overseas:
Evidence from corporate tax evasion in the United States. Journal of Financial Economics
117(1): 122–138.
Delhey, Jan, Kenneth Newton, and Christian Welzel, 2011, How general is trust in “most
people”? Solving the radius of trust problem, American Sociological Review 76, 786-807.
Djankov, S., E. Glaeser, R. La Porta, F. Lopez-de-Silanes, and A. Shleifer. 2003. The new
comparative economics. Journal of Comparative Economics 31(4): 595–619.
Duarte, J., S. Siegel, and L. Young. 2012. Trust and credit: The role of appearance in peer-to-
peer lending. Review of Financial Studies 25(8): 2455–2484.
Durlauf, S. and M. Fafchamps. 2006. Social capital. In Handbook of economic growth.
Amsterdam: Elsevier.
Easterly, W., and R. Levine. 1997. Africa's growth tragedy: Policies and ethnic divisions. The
Quarterly Journal of Economics 112(4): 1203–1250.
Elliott, D., A. Kroeber, and Q. Yu. 2015. Shadow Banking in China: A Primer. Brookings
Institution
Elster, J. 1989. Social Norms and Economic Theory. The Journal of Economic Perspectives 3(4):
99-117.
Fisman, R., and E. Miguel. 2007. Corruption, norms, and legal enforcement: Evidence from
diplomatic parking tickets. Journal of Political Economy 115(6): 1020–1048.
Fisman, R., Paravisini, D., and Vig, V. 2017. Cultural proximity and loan outcomes. American
Economic Review 107 (2), 457-492.
Freedman, S., and G. Z. Jin. 2008. Do social networks solve information problems for Peer-to-
Peer lending? evidence from Prosper.com,” NET Institute Working Paper.
Garrett, Jace, Rani Hoitash, and Douglas F. Prawitt, 2014, Trust and financial reporting quality,

31
Journal of Accounting Research 52, 1087-1125.
Gambetta, D. 2000. Can we trust trust? In Gambetta, D. (Ed.) Trust: Making and breaking
cooperative relations, University of Oxford: 213-237.
Georgas, J., Van De Vijver, F. J., & Berry, J. W. 2004. The ecocultural framework, ecosocial
indices, and psychological variables in cross-cultural research. Journal of Cross-Cultural
Psychology, 35(1), 74-96.
Giannetti, Mariassunta, and Yishay Yafeh, 2012, Do cultural differences between contracting
parties matter? Evidence from syndicated bank loans, Management Science 58, 365-383.
Graham, J. R., S. Li, and J. Qiu. 2008. Corporate misreporting and bank loan contracting.
Journal of Financial Economics 89(1): 44–61.
Grinblatt, M., and M. Keloharju, 2001, What makes investors trade? The Journal of Finance 56,
589-616.
Guiso, L. 2012. Trust and Insurance Markets, Economic Notes, Review of Banking, Finance and
Monetary Economics, 41, 1-26.
Guiso, L., P. Sapienza, and L. Zingales. 2004. The role of social capital in financial development.
American Economic Review 94: 526–556.
Guiso, L., P. Sapienza, and L. Zingales. 2006. Does culture affect economic outcomes? The
Journal of Economic Perspectives 20(2): 23–48.
Guiso, L., P. Sapienza, and L. Zingales. 2008. Trusting the stock market. The Journal of Finance
63(6): 2557–2600.
Guiso, L., P. Sapienza, and L. Zingales. 2009. Cultural biases in economic exchange? Quarterly
Journal of Economics 124: 1095–1131.

32
Hasan, I., K.H. Chun, Q. Wu, and H. Zhang. 2015. Social capital and debt contracting: Evidence
from bank loans and public bonds. Journal of Financial and Quantitative Analysis 52(3):
1017-1047.
He, Q., C. Xue and C, Zhu. (2017). Financial Development and Patterns of Industrial
Specialization: Evidence from China. Review of Finance 21(4): 1593-1638
Hilary, Gilles, and Kai Wai Hui, 2009, Does religion matter in corporate decision making in
america?, Journal of Financial Economics 93, 455-473.
Hilton, James L., and William von Hippel, 1996, Stereotypes, Annual Review of Psychology 47,
237-271.
Huff, Lenard, and Lane Kelley, 2003, Levels of organizational trust in individualist versus
collectivist societies: A seven-nation study, Organization Science 14, 81-90.
Kanagaretnam,K., G.J. Lobo C. Wang and D. Whalen. 2017. Cross-country Evidence on the
Relationship between Societal Trust and Risk-Taking by Banks, Journal of Financial and
Quantitative Analysis (forthcoming)
Karpoff, J. M., D. S. Lee, and G. S. Martin. 2008. The consequences to managers for financial
misrepresentation. Journal of Financial Economics 88(2):193–215.
Karpoff, J. M., D. S. Lee, and V. P. Vendrzyk. 1999. Defense procurement fraud, penalties, and
contractor influence. Journal of Political Economy 107(4), 809–842.
Kahneman, D, and A. Tversky. 1972. ‘Subjective Probability: A Judgment of Representativeness.
Cognitive Psychology 3, 430–454.
Klein, B., and K. B. Leffler. 1981. The role of market forces in assuring contractual performance.
Journal of Political Economy 89(4), 615–641.
Knack, S., and P. Keefer. 1997. Does social capital have an economic payoff? A cross-country
investigation. The Quarterly Journal of Economics 112(4), 1251–1288.

33
Knight, J. D. Holdsworth, and D. Mather, 2007, Determinants of trust in imported food products:
Perceptions of european gatekeepers, British Food Journal 109, 792-804.
Kranton, R.E. 1996. Reciprocal Exchange: A Self-Sustaining System. The American Economic
Review, 86 4:830-851.
La Porta, R., F. Lopez-de-Silanes, A. Shleifer, and R. W. Vishny. 1997. Legal determinants of
external finance. The Journal of Finance 52(3), 1131–1150.
La Porta, R., F. Lopez-de-Silanes, A. Shleifer, and R. W. Vishny. 1998. Law and finance.
Journal of Political Economy 106(6), 1113–1155.
Lampert, S.I and Jaffe, E.D. 1998 A dynamic approach to country-of-origin effect, European
Journal of Marketing, 32, 61-78.
Laursen, K. F. Masciarelli, A. Prencipe, 2012 Regions Matter: How Localized Social Capital
Affects Innovation and External Knowledge Acquisition. Organization Science 23(1), 177-
193.
Li, Wai-Kwan, and Robert S. Wyer, 1994, The role of country of origin in product evaluations:
Informational and standard-of-comparison effects, Journal of Consumer Psychology 3,
187-212.
Lin, M., N. R. Prabhala, and S. Viswanathan. 2013. Judging borrowers by the company they
keep: Friendship networks and information asymmetry in online peer-to-peer lending.
Management Science 59(1), 17–35.
Liu, D., D. Brass, Y. Lu, and D. Chen. 2015. Friendships in online peer-to-peer lending: Pipes,
prisms, and relational herding. MIS Quarterly 39(3), 729–742.
Lusardi, A., and O. Mitchell. 2008, Planning and Financial Literacy. How Do Women Fare?
American Economic Review 98(2), 413-417.
Mironov, M. 2015. Should one hire a corrupt CEO in a corrupt country? Journal of Financial
Economics 117(1), 29–42.

34
Newburry, William, Naomi A. Gardberg, and Liuba Y. Belkin, 2006, Organizational
attractiveness is in the eye of the beholder: The interaction of demographic characteristics
with foreignness, Journal of International Business Studies 37, 666-686.
Ongena, Steven, and David C. Smith, 2000, What determines the number of bank relationships?
Cross-country evidence, Journal of Financial Intermediation 9, 26-56.
Petersen, M. A., and R. G. Rajan, 2002, Does distance still matter? The information revolution in
small business lending, The Journal of Finance 57, 2533-2570.
Pevzner, M., F. Xie, and X. Xin. 2015. When firms talk, do investors listen? The role of trust in
stock market reactions to corporate earnings announcements. Journal of Financial
Economics 117(1), 190–223.
Posner, R. 1980. A Theory of Primitive Society, with Special Reference to Law.” Journal of Law
and Economics, 23, 1–53.
Putnam, R. 1993. Making Democracy Work: Civic Traditions in Modern Italy. Princeton, NJ:
Princeton University Press
Qian, J., and P.E. Strahan, 2007. How Laws and Institutions Shape Financial Contracts: The
Case of Bank Loans. The Journal of Finance 62, 2803–34.
Rajan, R.G. 1992. Insiders and outsiders: The choice between informed and arm's-length debt.
The Journal of Finance 47, 1367-1400.
Rajan, R. G., and L. Zingales, 1998, Financial dependence and growth, The American Economic
Review 88, 559-586.
Rose A.K. 2004. Do we really know that the WTO increases trade? American Economic Review
94(1), 98-114.
Schneider, D, 2004. The Psychology of Stereotyping (New York: Guilford Press).

35
Talhelm, T., X. Zhang, S. Oishi, C. Shimin, D. Duan, X. Lan, and S. Kitayama. 2014. Large-
scale psychological differences within China explained by rice versus wheat agriculture.
Science 344(6184), 603–608.
The Economist. 2017. “In Fintech, China shows the way: Advanced technology, backward banks
and soaring wealth make China a leader in fintech”. Feb 25th, 2017.
http://www.economist.com/news/finance-and-economics/21717393-advanced-technology-
backward-banks-and-soaring-wealth-make-china-leader
Uhlaner, C. 1989. Rational Turnout: The Neglected Role of Groups. American Journal of
Political Science, 33, 390–422.
Wu, W., Firth, M., Rui, O.M., 2014. Trust and the provision of trade credit. Journal of Banking
& Finance 39, 146-159.
Yamagishi, Toshio, 1988, The provision of a sanctioning system in the United States and Japan,
Social Psychology Quarterly 51, 265-271.
Zhang, W., and R. Ke. 2003. Trust in China: A cross-regional analysis. William Davidson
Institute Working Paper No. 586. Available at SSRN: https://ssrn.com/abstract=577781.
Zingales, L. 2015. The “cultural revolution” in finance. Journal of Financial Economics 117(1):
1–4.

36
Table 1 Social Trust Proxies
Panel A represents the results of applying principal component analysis to four proxies of social trust: Namely,
blood donation, NGO participation, enterprise trustworthiness and citizen trustworthiness. Proportion
explained, eigenvalue and factor loading for the first factor are presented. The social trust index (Trust) is
constructed by applying loadings (coefficient) to standardized four proxies of social trust. Panel B reports the
values of trust index and four proxies across regions. The definitions and data sources of all variables are
presented in Appendix A.
Panel A Principal component analysis
Panel B Measures of trustworthiness across regions
Blood Donation NGO participation Enterprise Citizen
Loadings 0.5201 0.5380 0.5423 0.3822
Proportion explained 0.742
Eigenvalue 2.967
Province Trust Blood NGO Enterprise Citizen
Shanghai 5.768 3.433 4.380 22.7 2.402
Beijing 4.035 3.314 3.594 16.6 2.225
Guangdong 2.193 1.331 3.145 10.1 2.344
Zhejiang 1.530 1.259 3.361 3.5 2.321
Shandong 1.389 1.454 2.088 6.4 2.382
Jiangsu 1.135 1.179 2.846 5.7 2.239
Fujian 0.269 1.086 1.599 0.9 2.374
Tianjing 0.224 0.828 2.326 1.7 2.251
Jiangxi -0.068 0.115 1.849 0.2 2.442
Hainan -0.207 0.654 1.893 0.1 2.283
Hebei -0.225 1.315 1.328 1.4 2.207
Shanxi -0.308 1.428 1.642 0.6 2.125
Liaoning -0.314 1.383 1.881 1.9 2.046
Hubei -0.316 0.760 2.104 0.5 2.175
Chongqing -0.365 0.554 2.380 0.5 2.150
Shaanxi -0.373 0.807 1.935 0.7 2.173
Heilongjiang -0.628 1.050 1.056 0.7 2.208
Hunan -0.703 0.540 1.316 0.4 2.249
Henan -0.810 1.174 1.151 0.6 2.111
Sichuan -0.938 0.309 1.780 0.9 2.119
Guangxi -1.014 0.272 1.182 0.6 2.225
Anhui -1.015 0.489 1.501 0.4 2.127
Xinjiang -1.044 0.494 1.068 1.1 2.175
Inner -1.178 0.703 1.086 0.7 2.100
Jilin -1.637 0.495 0.897 0.7 2.033
Yunnan -1.649 0.017 1.056 1.4 2.075
Guizhou -1.864 0.383 0.826 0.2 2.014
Gansu -1.887 0.230 0.938 0.3 2.014
Ningxia . . 1.118 0.2 .
Qinghai . . 0.741 0.2 .
Tibet . . 0.034 . .

37
Table 2 Summary Statistics
Panel A reports the summary statistics of listing and loan characteristics. Panel B reports the summary
statistics of demographic, income and education information of borrowers. Panel C reports the summary
statistics of trustworthiness measures, economic and financial variables. The definitions and data sources of all
variables are presented in Appendix A.
Variable mean sd min p50 max N
Panel A: Listing and Loan characteristics
fund 0.249 0.432 0 0 1 247565
words 114.560 70.317 0 94 244 247565
amount 4.81 7.01 0.3 3.78 300 61641
maturity 18.78 10.16 1 18 48 61641
longterm 0.80 0.40 0 1 1 61641
interest rate 2.13 0.31 0.588 2.146 5.379 61641
ownership 35.48 48.96 1 22 1370 61637
default 0.05 0.23 0 0 1 61641
bid_time 4417.94 29838.70 0 37 603037 61637
Panel B: Borrower’s characteristics
age 32.679 7.456 17 31 73 247563
gender 0.136 0.343 0 0 1 247565
grade 5.976 1.939 1 7 7 247565
edu 1.933 0.780 1 2 4 247201
marriage 0.556 0.497 0 1 1 247525
income 3.131 1.221 1 3 6 246811
house 0.428 0.495 0 0 1 247565
work_exp 2.351 1.019 1 2 4 246557
past_num 4.152 5.654 1 3 148 247565
Panel C: Provincial variables
Trust_index 0.000 1.722 -1.887 -0.340 5.768 28
Trust1: blood 0.966 0.802 0.017 0.783 3.433 28
Trust2: Ngo 1.745 0.944 0.034 1.599 4.380 31
Trust3: enterprise trust 2.730 5.161 0.100 0.700 22.700 30
Trust4: citizen trust 2.200 0.120 2.014 2.191 2.442 28
pgdp 1.116 0.387 0.554 1.026 2.515 186
loan 0.567 1.098 0.095 0.288 7.790 186
law_office 0.163 0.143 0.060 0.123 0.894 186

38
Table 3 Funding Success
This Table presents results from logit regressions of the Fund indicator onto measures of trustworthiness, trust
index (Column 1) and four proxies of trustworthiness (Column 2-5), as well as sets of control variables. We
report the estimated marginal effects, and the Pseudo R2. Year dummies are also included. Robust standard
errors are reported in parentheses. ***, **, and * denote statistical significance at the 1%, 5%, and 10% level,
respectively. The definitions and data sources of all variables are presented in Appendix A.
(1) (2) (3) (4) (5)
Trust_index 0.002***
(0.001)
blood
0.002*
(0.001)
Ngo
0.004***
(0.001)
enterprise
0.001***
(0.000)
citizen
-0.008
(0.005)
age 0.001*** 0.001*** 0.001*** 0.001*** 0.001***
(0.000) (0.000) (0.000) (0.000) (0.000)
gender -0.007*** -0.007*** -0.007*** -0.007*** -0.007***
(0.002) (0.002) (0.002) (0.002) (0.002)
grade -0.072*** -0.072*** -0.072*** -0.072*** -0.072***
(0.000) (0.000) (0.000) (0.000) (0.000)
edu 0.006*** 0.006*** 0.006*** 0.006*** 0.006***
(0.001) (0.001) (0.001) (0.001) (0.001)
marriage 0.008*** 0.008*** 0.009*** 0.008*** 0.009***
(0.001) (0.001) (0.001) (0.001) (0.001)
income 0.004*** 0.004*** 0.004*** 0.004*** 0.004***
(0.000) (0.000) (0.000) (0.000) (0.000)
house -0.004*** -0.005*** -0.004*** -0.004*** -0.005***
(0.001) (0.001) (0.001) (0.001) (0.001)
work_exp 0.007*** 0.007*** 0.007*** 0.007*** 0.007***
(0.001) (0.001) (0.001) (0.001) (0.001)
words 0.000*** 0.000*** 0.000*** 0.000*** 0.000***
(0.000) (0.000) (0.000) (0.000) (0.000)
past_num -0.002*** -0.002*** -0.002*** -0.002*** -0.002***
(0.000) (0.000) (0.000) (0.000) (0.000)
law_office -0.051*** -0.052*** -0.044*** -0.060*** -0.045***
(0.007) (0.008) (0.006) (0.008) (0.006)
loan 0.010*** 0.010*** 0.008*** 0.012*** 0.009***
(0.002) (0.002) (0.002) (0.002) (0.002)
pgdp 0.002*** 0.003*** 0.002*** 0.002*** 0.004***
(0.000) (0.000) (0.000) (0.000) (0.000)
Observations 243,489 243,489 245,087 244,962 243,489
Pseudo R-squared 0.599 0.599 0.598 0.598 0.599

39
Table 4 Loan ownership, size and pricing
This table presents the regression results of ownership, amount and interest rate for a given loan onto measures
of trustworthiness as well as different set of control variables. Panel A reports the results for trust index. Panel
B reports the results for four proxies of trustworthiness index respectively. Borrowers’ personal characteristics
and regional economic and financial variables are included, but not reported for simplicity. Robust standard
errors are reported in parentheses. ***, **, and * denote statistical significance at the 1%, 5%, and 10% level,
respectively. The definitions and data sources of all variables are presented in Appendix A.
Panel A: Social Trust index
Ownership Amount Interest rate
(1) (2) (3) (4) (5) (6)
Trust_index -0.009** -0.009** 0.115*** 0.116*** -0.004*** -0.004***
(0.004) (0.004) (0.043) (0.043) (0.001) (0.001)
age 0.010*** 0.010*** 0.048*** 0.047*** -0.000*** -0.001***
(0.001) (0.001) (0.004) (0.004) (0.000) (0.000)
gender 0.087*** 0.081*** 0.597*** 0.587*** -0.005*** -0.009***
(0.009) (0.009) (0.084) (0.086) (0.002) (0.002)
grade -0.096*** -0.078*** -0.722*** -0.695*** 0.042*** 0.051***
(0.003) (0.003) (0.031) (0.041) (0.001) (0.001)
edu 0.017*** 0.020*** 0.201*** 0.205*** -0.012*** -0.011***
(0.005) (0.005) (0.048) (0.048) (0.001) (0.001)
marriage 0.069*** 0.071*** 0.215*** 0.219*** -0.018*** -0.016***
(0.009) (0.009) (0.044) (0.044) (0.002) (0.002)
income 0.151*** 0.154*** 1.005*** 1.010*** -0.013*** -0.011***
(0.003) (0.003) (0.023) (0.022) (0.001) (0.001)
house 0.164*** 0.167*** 1.450*** 1.454*** 0.061*** 0.063***
(0.008) (0.008) (0.096) (0.094) (0.003) (0.003)
work_exp -0.059*** -0.049*** 0.093** 0.108*** -0.003** 0.002
(0.004) (0.004) (0.046) (0.041) (0.001) (0.001)
words -0.014*** -0.011*** -0.088*** -0.084*** -0.002*** -0.000
(0.001) (0.000) (0.004) (0.006) (0.000) (0.000)
past_num 0.001*** 0.001*** 0.005*** 0.004*** -0.000*** -0.000***
(0.000) (0.000) (0.001) (0.001) (0.000) (0.000)
longterm 0.273*** 0.410** 0.148***
(0.011) (0.181) (0.005)
law_office -0.056 -0.040 -0.121 -0.096 -0.166*** -0.157***
(0.059) (0.058) (0.564) (0.562) (0.022) (0.021)
Loan 0.022 0.024 0.116 0.120 0.056*** 0.058***
(0.016) (0.016) (0.095) (0.095) (0.005) (0.005)
Pgdp 0.010*** 0.007** 0.035* 0.031 0.006*** 0.005***
(0.003) (0.003) (0.021) (0.020) (0.001) (0.001)
Constant 1.688*** 1.529*** -3.266*** -3.505*** 2.745*** 2.659***
(0.087) (0.084) (0.408) (0.403) (0.111) (0.113)
Observations 61,027 61,027 61,031 61,031 61,031 61,031
R-squared 0.184 0.191 0.141 0.142 0.239 0.262

40
Panel B Four proxies of Social Trust
Ownership Amount Interest
(1) (2) (3) (4) (5) (6) (7) (8) (9) (10) (11) (12)
blood 0.010
0.197**
-0.011***
(0.010)
(0.100)
(0.002)
Ngo
-0.015**
0.327***
-0.018***
(0.007)
(0.054)
(0.002)
enterprise
-0.003***
0.039***
-0.002***
(0.001)
(0.014)
(0.000)
citizen
-0.193***
0.622***
-0.022**
(0.040)
(0.217)
(0.011)
Loan and
borrower
variables yes yes yes yes yes yes yes yes yes yes yes yes
Regional
variables yes yes yes yes yes yes yes yes yes yes yes yes
Constant 1.372*** 1.094*** 1.159*** 1.328*** -0.930*** -1.026*** -0.769** -2.192*** 1.954*** 1.821*** 1.999*** 1.976***
(0.176) (0.196) (0.175) (0.167) (0.333) (0.334) (0.335) (0.582) (0.135) (0.134) (0.135) (0.135)
Observations 61,027 61,150 61,142 61,027 61,031 61,154 61,146 61,031 61,031 61,154 61,146 61,031
R-squared 0.191 0.191 0.191 0.191 0.096 0.097 0.097 0.096 0.248 0.248 0.248 0.248

41
Table 5 Province fixed-effect regressions
This table reports how the interactions of trust and borrower’s characteristics affect the funding probability and loan ownership, size and pricing. Each
entry reports the estimates for the interactions of trust and specific borrower’s characteristics, namely age, gender, marriage, income and working
experience, respectively. Loan, borrowers’ personal characteristics and regional economic and financial variables are included, but not reported. Year,
and regional fixed effects are included. Robust standard errors clustered at province level are reported in parentheses. ***, **, and * denote statistical
significance at the 1%, 5%, and 10% level, respectively. The definitions and data sources of all variables are presented in Appendix A.
Fund Ownership Amount Interest rate
(1) (2) (3) (4) (5) (6) (7) (8)
age*Trust_index -0.0000 -0.0000 0.0003 0.0003 0.0068 0.0061 0.0003* 0.0002
(0.0001) (0.0001) (0.0005) (0.0005) (0.0043) (0.0040) (0.0001) (0.0001)
gender*Trust_index -0.0013 -0.0012 -0.0184** -0.0182** 0.1111 0.1388 -0.0019 -0.0019
(0.0012) (0.0011) (0.0068) (0.0067) (0.1265) (0.1353) (0.0029) (0.0027)
marriage*Trust_index 0.0002 0.0002 0.0092 0.0090 0.1946*** 0.1802*** -0.0007 -0.0013
(0.0010) (0.0010) (0.0070) (0.0066) (0.0462) (0.0486) (0.0020) (0.0019)
income*Trust_index 0.0005 0.0005 0.0088* 0.0087* 0.2240*** 0.2209*** -0.0008 -0.0007
(0.0008) (0.0008) (0.0049) (0.0051) (0.0595) (0.0517) (0.0017) (0.0017)
work_exp*Trust_index -0.0006 -0.0006 0.0185*** 0.0190** 0.2854*** 0.2706*** 0.0033* 0.0032*
(0.0005) (0.0005) (0.0066) (0.0069) (0.0464) (0.0463) (0.0017) (0.0017)
Loan and borrower
variables
yes yes yes yes yes yes yes Yes
Regional variables no yes no yes no yes no Yes
Year fixed effect yes yes yes yes yes yes yes Yes
Province fixed effect yes yes yes yes yes yes yes Yes
Observations 243,489 243,489 61,027 61,027 61,031 61,031 61,031 61,031

42
Table 6: Sub sample analysis
Panel A re-runs regressions in a subsample, splitting the sample on the basis of the level of education of the
borrower. A borrower is defined as low educated if his or her highest qualification is below bachelor’s degree.
Consequently, a borrower is defined as highly educated if his or her highest qualification is a bachelor’s degree
or above. Panel B re-runs regressions in a subsample, splitting our sample into those of first borrowing, which
take place when a borrower appears for the first time on the RRD platform (First) and the rest (Non).
Borrowers’ personal characteristics and regional economic and financial variables are included. The difference
is the coefficient of trust index in low education (first time) group minus the coefficient of trust index in high
education (non-first time) group. Year dummies are also included. Robust standard errors are reported in
parentheses. ***, **, and * denote statistical significance at the 1%, 5%, and 10% level, respectively. The
definitions and data sources of all variables are presented in Appendix A.
Panel A Low- and high-educated borrowers
Fund Ownership Amount Interest rate
Low High Low High Low High Low High
Trust_index 0.002*** 0.001
-0.009* -0.021***
0.138** -0.007 -0.004*** -0.010***
(0.001) (0.001)
(0.005) (0.008)
(0.054) (0.082) (0.001) (0.002)
Loan and
borrower variables yes yes yes yes yes yes yes yes
Regional variables yes yes yes yes yes yes yes yes
Year fixed effect yes yes yes yes yes yes yes yes
R-squared 0.187 0.204 0.156 0.127 0.287 0.193
Pseudo R2 0.625 0.531
Observations 184447 59042
45484 15543
45487 15544 45487 15544
Dif 0.001 0.012 0.145** 0.006**
Panel B First- and non-first time Borrowers
Fund Ownership Amount Interest rate
First Non First Non First Non First Non
Trust_index 0.0025*** 0.0017**
-0.0081* -0.0044
0.0787* 0.4839*** -0.0034*** 0.0080
(0.0007) (0.0008)
(0.0043) (0.0095)
(0.0413) (0.1728) (0.0008) (0.0052)
Loan and
borrower variables yes yes yes yes yes yes yes yes
Regional variables yes yes yes yes yes yes yes yes
Year fixed effect yes yes yes yes yes yes yes yes
R-squared
0.1387 0.1952
0.1352 0.1063 0.2939 0.1060
Pseudo R2 0.69 0.2441
Observations 121,095 122,394
49,841 11,186
49,844 11,187 49,844 11,187
Dif 0.0008* -0.0037 -0.4052** -0.0114***

43
Table 7 Alternative specifications
This Table presents results from a series of regressions of the funding indicator, loan ownership, size and
pricing onto our trust index, and sets of control variables. In Column (1)-(4), we implement a bootstrap method,
which draws a subsample that has half as many observations as the whole sample, and repeat our regression
analysis for this subsample. In Column (5)-(7), we employ the Heckman two-step treatment effects procedure
to correct the selection bias. Loan, borrowers’ personal characteristics and regional economic and financial
variables are included, but not reported. Year and regional fixed effects are included. Robust standard errors
clustered at province level are reported in parentheses. ***, **, and * denote statistical significance at the
1%, 5%, and 10% level, respectively. The definitions and data sources of all variables are presented in
Appendix A.
Bootstrap Selection
Fund Ownership Amount Interest rate Ownership Amount Interest rate
(1) (2) (3) (4) (5) (6) (7)
Trust Index 0.002** -0.010* 0.115* -0.004*** -0.010** 0.117* -0.004***
(0.001) (0.006) (0.061) (0.001) (0.004) (0.027) (0.001)
Loan and borrower variables yes yes yes yes yes yes yes
Regional variables yes yes yes yes yes yes yes
Year fixed effect yes yes yes yes yes yes yes
IML -0.498*** 4.676*** -0.225***
(0.033) (0.228) (0.009)
R-squared 0.1838 0.1414 0.2386
Pseudo R2 0.599
Wald chi2 9996.47 6293.54 7055.58
Observations 243,489 61,027 61,031 61,031 244,960 244,964 244,964

44
Table 8 Instrumental Variable Analysis This table reports the first and second stage result of our instrumental variable analysis. Our first instrument
rice_suit, is suitability of each province for growing wetland rice based on the United Nations Food and
Agriculture Organization’s Global Agro-ecological Zones database. The second instrument is Ethnic, is the
fraction of the largest ethnic group in a province. Borrowers’ personal characteristics and regional economic
and financial variables are included. Year dummies are also included. Robust standard errors are reported in
parentheses. ***, **, and * denote statistical significance at the 1%, 5%, and 10% level, respectively. The
definitions and data sources of all variables are presented in Appendix A.
(1) (2) (3) (4) (5)
Fund
Fund Ownership Amount Interest rate
Panel A: Second stage
Trust_index 0.018** 0.002** -0.021*** 0.203*** -0.007***
(0.008) (0.001) (0.007) (0.050) (0.002)
Constant 1.124*** 1.673*** -2.078*** 2.728***
(0.016) (0.087) (0.373) (0.112)
Loan and borrower variable yes yes yes yes yes
Regional variable yes yes yes yes yes
Year fixed effect yes yes yes yes yes
Observations 241,370 241,370 60,882 60,886 60,886
R-squared 0.681 0.183 0.108 0.236
Panel B: First Stage
rice_suit 0.479*** 0.479*** 0.461*** 0.462*** 0.462***
(0.002) (0.002) (0.004) (0.004) (0.004)
ethnic 2.396*** 2.396*** 2.727*** 2.747*** 2.747***
(0.011) (0.011) (0.029) (0.029) (0.029)
Loan and borrower variable yes yes yes yes yes
Regional variable yes yes yes yes yes
Year fixed effect yes yes yes yes yes
R-squared
0.820 0.805 0.805 0.805
Loglikelihood -322825.63
Partially F-statistics for the joint
significance of the instruments
57778.9 13319.4 13476.9 13476.9
Over-identification(P value J stat) 0.065 0.061 0.163 0.417

45
Table 9 Lender fixed effect
This table estimates the basic regressions by controlling lender fixed effect. RRD platform assigned a unique id
to its customers. A lender can bid for many loan lists. This enables us to control the lender fixed effect. The
regression results of bid_amount and interest rate of a given investment onto differences of measure of
trustworthiness index as well as control variables. Borrowers’ personal characteristics and regional economic
and financial variables are included. Year dummies are also included. Robust standard errors are reported in
parentheses. ***, **, and * denote statistical significance at the 1%, 5%, and 10% level, respectively. The
definitions and data sources of all variables are presented in Appendix A.
bid amount Interest rate
(1) (2) (3) (4)
Trust_index 0.004*** 0.005*** -0.003*** -0.003***
(0.000) (0.000) (0.000) (0.000)
age -0.000 0.000 -0.000*** -0.000***
(0.000) (0.000) (0.000) (0.000)
gender 0.002*** 0.003*** -0.005*** -0.006***
(0.001) (0.001) (0.000) (0.000)
grade -0.009*** -0.011*** 0.041*** 0.047***
(0.001) (0.001) (0.000) (0.000)
edu 0.001** 0.001 -0.002*** -0.001***
(0.000) (0.000) (0.000) (0.000)
marriage 0.000 0.000 -0.012*** -0.011***
(0.001) (0.001) (0.000) (0.000)
income 0.010*** 0.010*** -0.007*** -0.007***
(0.001) (0.001) (0.000) (0.000)
house 0.006*** 0.006*** 0.054*** 0.055***
(0.001) (0.001) (0.000) (0.000)
work_exp 0.022*** 0.021*** 0.006*** 0.011***
(0.001) (0.001) (0.000) (0.000)
words 0.000*** 0.000*** -0.000*** -0.000***
(0.000) (0.000) (0.000) (0.000)
past_num -0.000 -0.000*** -0.002*** -0.000***
(0.000) (0.000) (0.000) (0.000)
longterm
-0.043***
0.168***
(0.004)
(0.002)
law_office 0.011** 0.004 -0.146*** -0.120***
(0.005) (0.005) (0.003) (0.002)
loan -0.002 -0.001 0.042*** 0.039***
(0.001) (0.001) (0.001) (0.001)
pgdp -0.000 0.000 0.005*** 0.004***
(0.000) (0.000) (0.000) (0.000)
Constant -0.049 -0.021 2.378*** 2.271***
(0.031) (0.031) (0.032) (0.034)
Observations 2,173,006 2,173,006 2,173,006 2,173,006
R-squared 0.009 0.010 0.278 0.325
Number of Investors 114,123 114,123 114,123 114,123

46
Table 10 Lender-borrower pairs
Panel A reports the summary statistics for both lenders and borrowers. We conduct t-value tests for the
mean difference and Wilcoxon signed-ranks tests for the median difference, respectively. Panel B reports
the summary statistics of the lender’s investment. Panel C estimates the basic regressions using lender-
borrower pairs. All variables, including controls are in the value of difference between that of lenders and
borrowers. d_ represents the variable of lenders minus the corresponding variables of borrowers. Year
dummies are also included. Robust standard errors are reported in parentheses. ***, **, and * denote statistical
significance at the 1%, 5%, and 10% level, respectively. The definitions and data sources of all variables are
presented in Appendix A.
Panel A Characteristics for lenders and borrower
Panel B Characteristics for investment
variable mean sd min p50 max
bid_amount 0.10 0.40 0.00 0.03 30.00
Interest rate 2.22 0.39 0.59 2.15 5.38
maturity 15.25 9.63 1.00 12.00 48.00
longterm 0.69 0.46 0.00 1.00 1.00
distance 968.07 561.87 0.00 969.31 3463.17
Lender
Borrower
Dif
variable mean median
mean median
mean median
Trust_index 1.944 1.530 0.870 0.269
1.075*** 1.261***
age 35.404 33 38.708 37
-3.304*** -4.000***
gender 0.034 0 0.153 0 -0.119*** 0.000***
grade 5.124 6 3.422 2
1.702*** 4.000***
edu 2.681 3 1.989 2
0.692*** 1.000***
marriage 0.742 1 0.786 1
-0.044*** 0.000***
income 3.159 3 3.998 4
-0.839*** -1.000***
house 0.700 1 0.472 0
0.228*** 1.000***
work_exp 2.724 3 2.560 2
0.164*** 1.000***
past_num 7.062 2 4.770 1 2.293*** 1.000***
law_office 0.323 0.160 0.193 0.149 0.130*** 0.010***
loan 1.398 1.113 1.130 1.002 0.268*** 0.111***
pgdp 5.759 5.925 5.194 5.171 0.564*** 0.754***

47
Panel C Regression Analysis using Differences between Lenders and Borrowers
bid amount interest rate
(1) (2) (3) (4) (5) (6)
d_Trust_index -0.009*** -0.009*** -0.009***
0.007*** 0.007*** 0.007***
(0.001) (0.001) (0.001)
(0.001) (0.001) (0.001)
d_age 0.001*** 0.001*** 0.001***
0.001*** 0.001*** 0.001***
(0.000) (0.000) (0.000)
(0.000) (0.000) (0.000)
d_gender -0.022*** -0.022*** -0.022***
0.043*** 0.039*** 0.039***
(0.006) (0.006) (0.006)
(0.003) (0.003) (0.003)
d_grade -0.000 -0.000 -0.000
-0.044*** -0.042*** -0.042***
(0.001) (0.001) (0.001)
(0.001) (0.001) (0.001)
d_edu 0.003* 0.003* 0.003*
0.007*** 0.008*** 0.008***
(0.002) (0.002) (0.002)
(0.001) (0.001) (0.001)
d_marriage -0.013*** -0.012*** -0.012***
0.032*** 0.030*** 0.030***
(0.003) (0.003) (0.003)
(0.003) (0.003) (0.003)
d_income 0.001 0.001 0.001
-0.002** -0.001 -0.001
(0.001) (0.001) (0.001)
(0.001) (0.001) (0.001)
d_house 0.004* 0.004 0.004
-0.019*** -0.011*** -0.010***
(0.003) (0.003) (0.003)
(0.003) (0.003) (0.003)
d_work_exp -0.003** -0.003** -0.003**
-0.033*** -0.030*** -0.030***
(0.001) (0.001) (0.001)
(0.001) (0.001) (0.001)
longterm
-0.023*** -0.022***
0.005 0.005
(0.006) (0.006)
(0.005) (0.005)
words
0.000*** 0.000***
-0.001*** -0.001***
(0.000) (0.000)
(0.000) (0.000)
d_law_office 0.100*** 0.100*** 0.101***
-0.082*** -0.081*** -0.082***
(0.015) (0.015) (0.015)
(0.013) (0.013) (0.013)
d_loan -0.009* -0.010** -0.010**
-0.024*** -0.021*** -0.021***
(0.004) (0.004) (0.004)
(0.005) (0.005) (0.005)
d_pgdp 0.005*** 0.005*** 0.005***
0.003*** 0.003*** 0.003***
(0.001) (0.001) (0.001)
(0.001) (0.001) (0.001)
lndistance
-0.001
0.002*
(0.001)
(0.001)
Constant 0.033*** 0.020*** 0.024***
2.699*** 2.776*** 2.767***
(0.006) (0.007) (0.009)
(0.056) (0.056) (0.056)
Observations 48,677 48,677 48,677
48,677 48,677 48,677
R-squared 0.006 0.006 0.006 0.243 0.248 0.249

48
Table 11 Trust and Border
This table estimates the basic regressions using lender-borrower pairs. All variables, including controls are in
the value of difference between that of lenders and borrowers. d_ represents the variables of lenders minus the
corresponding variables of borrowers. Interaction term, d_Trust_index*border, and Year dummies are also
included. Robust standard errors are reported in parentheses. ***, **, and * denote statistical significance at
the 1%, 5%, and 10% level, respectively. The definitions and data sources of all variables are presented in
Appendix A.
Bid amount Interest rate
(1) (2) (3) (4)
d_Trust_index -0.010*** -0.010*** 0.007*** 0.007***
(0.001) (0.001) (0.001) (0.001)
d_age 0.001*** 0.001*** 0.002*** 0.001***
(0.000) (0.000) (0.000) (0.000)
d_gender -0.021*** -0.021*** 0.043*** 0.039***
(0.006) (0.006) (0.003) (0.003)
d_grade -0.001 -0.001 -0.043*** -0.041***
(0.001) (0.001) (0.001) (0.001)
d_edu 0.003 0.003 0.007*** 0.008***
(0.002) (0.002) (0.001) (0.001)
d_marriage -0.014*** -0.013*** 0.035*** 0.032***
(0.004) (0.004) (0.003) (0.003)
d_income 0.001 0.001 -0.003*** -0.002*
(0.001) (0.001) (0.001) (0.001)
d_house 0.005* 0.004 -0.019*** -0.011***
(0.003) (0.003) (0.003) (0.003)
d_work_exp -0.003** -0.003** -0.033*** -0.030***
(0.001) (0.001) (0.001) (0.001)
longterm
-0.021***
0.011**
(0.006)
(0.005)
words
0.000***
-0.001***
(0.000)
(0.000)
d_law_office 0.101*** 0.101*** -0.078*** -0.077***
(0.015) (0.015) (0.013) (0.013)
d_loan -0.009** -0.010** -0.025*** -0.022***
(0.004) (0.005) (0.005) (0.005)
d_pgdp 0.005*** 0.005*** 0.003*** 0.003***
(0.001) (0.001) (0.001) (0.001)
d_Trust_index*border 0.005*** 0.005*** -0.002 -0.003*
(0.002) (0.002) (0.002) (0.002)
border -0.007* -0.007* 0.006 0.006
(0.004) (0.004) (0.005) (0.005)
Constant 0.031*** 0.016* 2.823*** 2.899***
(0.007) (0.009) (0.069) (0.068)
Observations 45,691 45,691 45,691 45,691
R-squared 0.006 0.007 0.245 0.250

49
Appendix A: Variable definition and data resource
Definitions source
Borrowers' characteristics
grade Credit score of the borrowers when the listing is created,
ranging from 1 (high) to 7 (low) RRD
age The age of borrower RRD
gender A dummy variable that equals 1if the borrower is female and
zero otherwise RRD
education
Equals 4 if the borrower’s highest qualification is a master’s
degree or above; 3 if the borrower’s highest qualification is a
bachelor’s degree; 2 if the borrower’s highest qualification is
post-tertiary; and 1 if the borrower’s highest qualification is
secondary or below. RRD
work_exp
Employment length in years. Possible values are between 1
and 4 where 1 means less than one year,2 means between one
and three years, 3 means between three years and five years, 4
means more than five years. RRD
income
monthly income provided by the borrower during registration.
Possible values are between 1 and 6 where 1 indicate less
than one thousand RMB, 2 means between one and five
thousand, 3 means between five thousand and ten thousand, 4
means between ten thousand and twenty thousand, 5 means
between twenty thousand and fifty thousand, 6 means more
than fifty thousand RRD
marriage A dummy variable that equals 1if the borrower is married,
and zero otherwise RRD
house A dummy variable that equals 1if the borrower has housing,
and zero otherwise RRD
ownership The number of bids placed on a listing when the listing is
fully funded RRD
past_num The number of past borrowing RRD
nonperform The number of past overdue loans RRD
Loan information
interest rate The interest rate that borrower pays on the loan. The rate is
adjusted by the benchmark rate of PBOC RRD
amount The requested loan amount in ten thousands of RMB RRD
bid amount The amount that lenders bid on the loan in ten thousands of
RMB RRD
maturity The loan maturity in months RRD
fund An indicator equals one if a listing is fully funded and zero
otherwise RRD
ownership Number of lenders in a given loan
listing date The date when the listing is created RRD
bid time The time (in seconds) between the time the listing is created
and the time the listing is fully funded RRD
title The loan title provided by the borrower RRD
content The state provided by the borrower in the loan application RRD
words number of words used by the borrower in the listing text. RRD
default An indicator that equals one if the loan status is "repayment
by platform", or "overdue" and is zero otherwise. RRD

50
Trust variable
Trust_index constructed by applying loadings (coefficient) to standardized
four proxies of social trust Authors’ estimation
blood The milliliters of blood donated voluntarily in a province,
divided by its population in 2000
The Chinese Society of
Blood Transfusion in
2000
Ngo
The participation of NGO is measured as registered members
of non-governmental organizations (NGO) per thousand
population in a province.
China Statistical
Yearbook, various years
enterprise
Enterprise Survey System (Trust 3: Enterprise trust). In this
survey, managers answer the following question: “According
to your experience, could you list the top five provinces where
the enterprises are most trustworthy?” Zhang and Ke (2003)
citizen
The response to the following question: “How trustworthy are
the people in your city?” The response ranges from 1 (“highly
untrustworthy”) to 5 (“highly trustworthy.”). We capture a
region’s level of trustworthiness by its cities’ average score in
a province.
China General Social
Survey (CGSS)
Provincial variable
pgdp GDP in the province in ten thousands of RMB divided by
population in the province
China Statistical
Yearbook, various years
law_office
Number of law office units per ten thousands population in a
province
Provincial reports of
qualification
examinations for
attorneys and certified
accountants, Various year
loan Ratio of total bank loans to GDP in a province China Statistical
Yearbook, various years
rice_suit
The logarithm of “rice suitability”, which is a z score of the
environmental suitability of each province for growing
wetland rice based on the United Nations Food and
Agriculture Organization’s Global Agro-ecological Zones
database (27).
the United Nations Food
and Agriculture
Organization’s Global
Agro-ecological Zones
database
ethic
The population percentage of major ethic groups in a
province.
China Statistical
Yearbook

51
Figure 1 Entry page
Total amount of loans
facilitated
Total number of loans
facilitated Total amount of interest
earned
List of the biddings Financing
calculator
Tips: the regular tender offering time is 11: 00, 13: 30, and 17: 00, other tender offering time is random.
Million yuan Loans MM yuan
Cash flow
Cash flow
Cash flow
Cash flow
Cash flow
Cash flow
Cash flow
Cash flow
Cash flow
Cash flow
Cash flow
Decoration
Decoration
Daily consumption
Daily consumption
Daily consumption
Decoration
Decoration
Production operation expansion
Production operation expansion
Loan Use Annual interest rate Amount Maturity Progress
132,500.00 Yuan
Yuan
70,000.00 Yuan
187,500.00 Yuan
135,000.00 Yuan
71,800.00 Yuan
135,200.00 Yuan
130,000.00 Yuan
118,900.00 Yuan
189,000.00 Yuan
104,000.00 Yuan
89,200.00 Yuan
145,500.00 Yuan
156,000.00 Yuan
116,400.00 Yuan
145,500.00 Yuan
30,300.00 Yuan
91,000.00 Yuan
101,900.00 Yuan
28,300.00 Yuan
91,500.00 Yuan
48 Months
Yuan
36 Months
Yuan
48 Months
Yuan
48 Months
Yuan
48 Months
Yuan
48 Months
Yuan
48 Months
Yuan
48 Months
Yuan
36 Months
Yuan
36 Months
Yuan
36 Months
Yuan
36 Months
Yuan
36 Months
Yuan
36 Months
Yuan
36 Months
Yuan
36 Months
Yuan
36 Months
Yuan
36 Months
Yuan
36 Months
Yuan
24 Months
Yuan
Fully Funded
Fully Funded
Fully Funded
Fully Funded
Fully Funded
Fully Funded
Fully Funded
Fully Funded
Paying
Paying
Paying
Fully Funded
Fully Funded
Fully Funded
Fully Funded
Fully Funded
Fully Funded
Fully Funded
Fully Funded
Fully Funded
Fully Funded
Fully Funded
Fully Funded
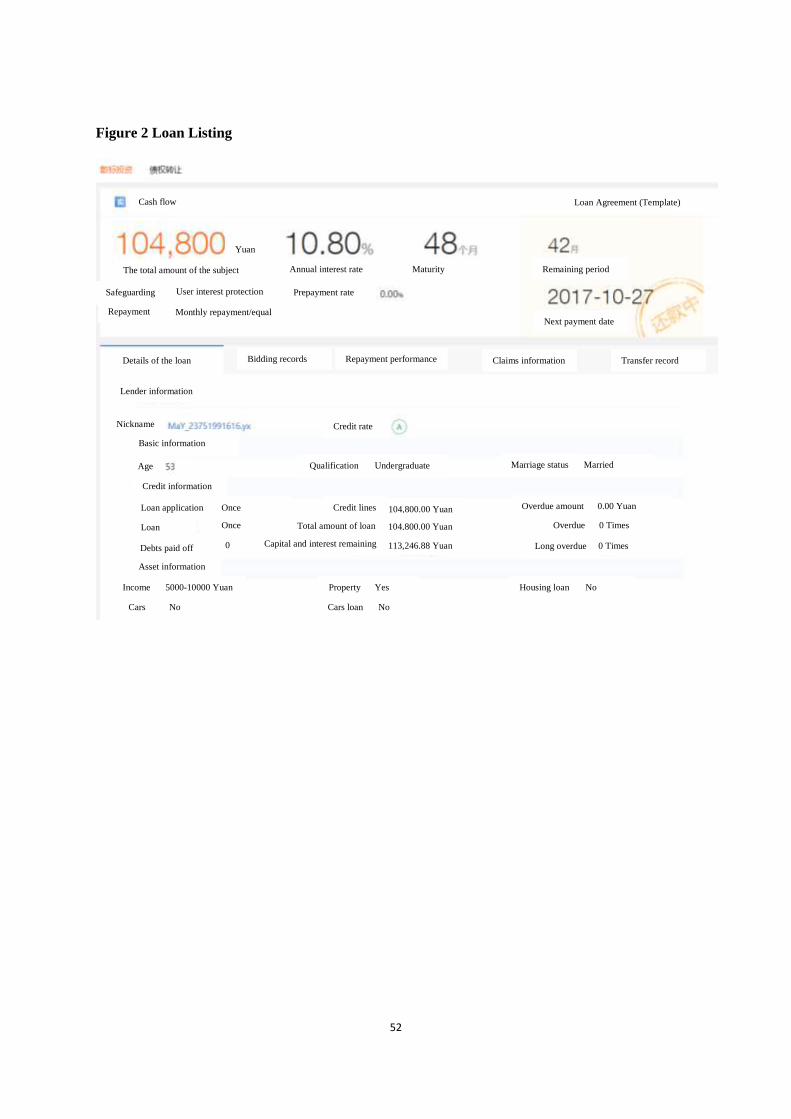
52
Figure 2 Loan Listing
Cash flow
Yuan
Annual interest rate Maturity Remaining period The total amount of the subject
Loan Agreement (Template)
Prepayment rate
Next payment date Monthly repayment/equal
User interest protection
Repayment
Safeguarding
Details of the loan Bidding records Repayment performance Claims information Transfer record
Lender information
Nickname Credit rate
Age Qualification Undergraduate
Basic information
Marriage status Married
Credit information
Loan application Once
Loan Once
Credit lines 104,800.00 Yuan
Total amount of loan 104,800.00 Yuan
Capital and interest remaining 113,246.88 Yuan
Overdue amount 0.00 Yuan
Overdue 0 Times
Debts paid off 0 Long overdue 0 Times
Income 5000-10000 Yuan Property Yes Housing loan No
Cars No Cars loan No
Asset information

53
Working information Company industry Commonweal organizations Company size Less than 10 people
B City
B
Chengdu, Sichuan
B
Years of service
B
More than 5 years
B
Position
B
Regular employee
B
Reviewing status
B
Project
B
Status
B
Pass date
B Credit report
B
Identity authentication
auauquthenticationauthe
nticationauthenticationB
Working authentication (working class)
Income authentication
auauquthenticationauthe
nticationauthenticationB
Field authentication
auauquthenticationauthe
nticationauthenticationB
Completed
B
Completed
B
Completed
B
Completed
B
Completed
B
1. Renrendai undertakes to always uphold objectivity and impartiality principles, strictly control the risk, and exercise due diligence in authenticating the
borrower's information, but does not guarantee that the authenticated information is 100% correct.
2. If the borrower is long-term overdue, his/her personal information will be publicized.
3. The Renrendai platform is only an information publishing platform. It does not provide any guarantee or promise to protect the borrower in any
express or implied manner. The lender should make independent judgment and make decisions based on its investment preferences and risk tolerance,
and bear the risk of their own funds and responsibilities. Market risk, the investment need to be cautious.
Use of funds
auauquthentic
ationauthentic
ationauthentic
ationB
Status: Minsheng Bank has accepted
Narrative
auauquthe
nticationau
thenticatio
nauthentic
ationB
Company staff, now living in Chengdu, Sichuan Province, engaged in public management, social organizations and international organizations industry, job
income is stable, loans for cash flow. The above information has been field certification Fang Youzhong letter company inspection certification. At the same
time, the auditors of the information provided by the borrower is true and effective, in line with the loan approval criteria.
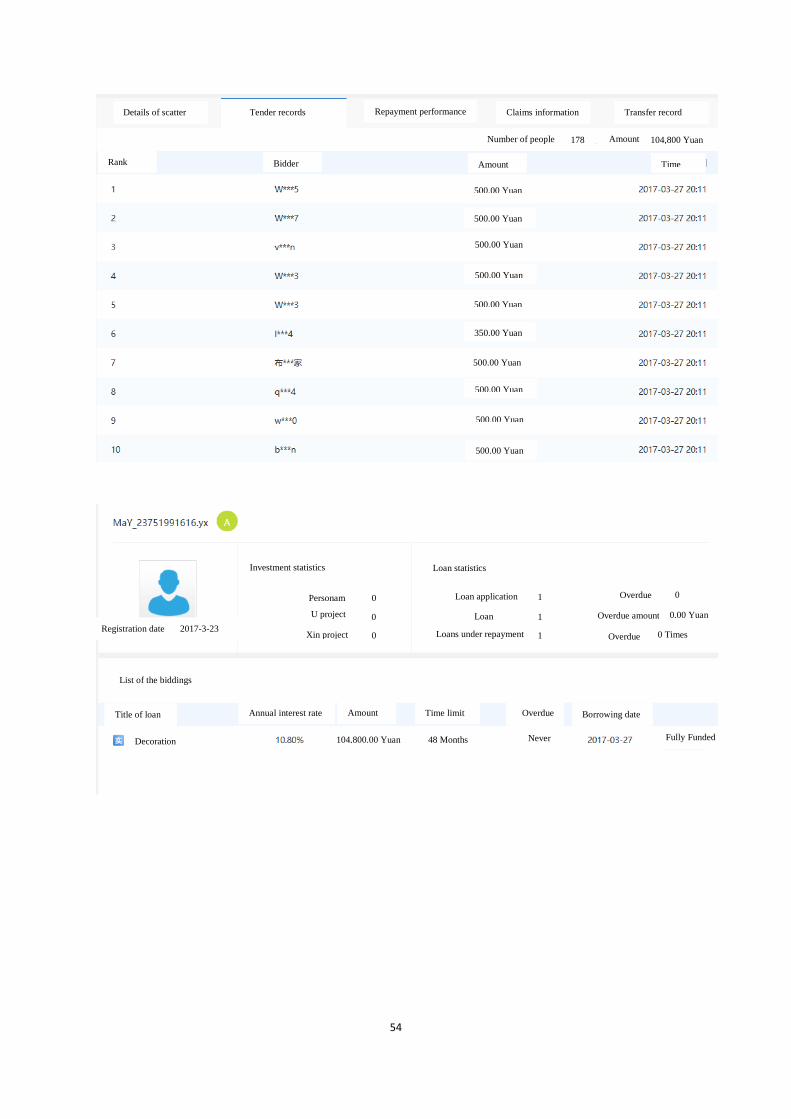
54
Details of scatter Tender records Repayment performance Claims information Transfer record
Number of people Amount 178 104,800 Yuan
Rank Bidder Amount Time
500.00 Yuan
500.00 Yuan
500.00 Yuan
500.00 Yuan
500.00 Yuan
500.00 Yuan
500.00 Yuan
500.00 Yuan
500.00 Yuan
350.00 Yuan
Registration date 2017-3-23
Investment statistics Loan statistics
U project
Personam
Xin project
0
0
0
1
1
1 0
Overdue amount
Overdue
Overdue
0.00 Yuan
0 Times
Loan
Loan application
Loans under repayment
List of the biddings
Title of loan
Decoration
Annual interest rate Amount Time limit
Fully Funded
Funded 48 Months
Yuan
104,800.00 Yuan Never
Yuan
Overdue
Yuan
Borrowing date