Stephen I. Chazen President & CEO UBS Global Oil … · OCCIDENTAL PETROLEUM CORPORATION Stephen I....
37
OCCIDENTAL PETROLEUM CORPORATION Stephen I. Chazen President & CEO UBS Global Oil & Gas Conference 2015 May 19, 2015
Transcript of Stephen I. Chazen President & CEO UBS Global Oil … · OCCIDENTAL PETROLEUM CORPORATION Stephen I....

OCCIDENTAL PETROLEUM CORPORATION
Stephen I. Chazen President & CEO
UBS Global Oil & Gas Conference 2015 May 19, 2015
Overriding Goal is to Maximize Total Shareholder Return • We believe this can be achieved through a combination of:
• Oil and gas production growth of 5% to 8% per year over the long-term; − Executing on our capital program with a focus on growing our U.S. oil production
• Allocating and deploying capital with a focus on achieving well above cost-of-capital returns (ROE and ROCE);
– Return Targets* • Domestic – 15+% • International – 20+%
− Continued improvement in our capital and drilling efficiency − Start-up of long-term projects
• Providing consistent, annual dividend growth;
• Maintaining a strong balance sheet. − Single ‘A’ Investment Grade rating
Key Messages & Strategy
2 * Assumes moderate product prices

Large Integrated Majors Company Market Cap ($B) XOM $369 CVX $202 RDS $199 BP $129 TOT $122 ENI $69
Characteristics • Low or no growth • Higher returns • Stronger B/S; lower risk • Free cash flow • Consistent dividend growth
Why own Oxy?
Independent E&Ps Company Market Cap ($B) COP $82 EOG $52 APC $46 APA $25 PXD $25 MRO $19
Characteristics • Generally higher growth • Lower returns • Weaker B/S; higher risk • No free cash flow • Little or no dividends • Moving from gassy to oily
Oxy has positive elements of both groups, appealing to investors who seek a combination of moderate growth, above average returns and consistent dividend growth.
Oxy Uniquely
Positioned
$61 billion
3 Updated as of 5/6/2015
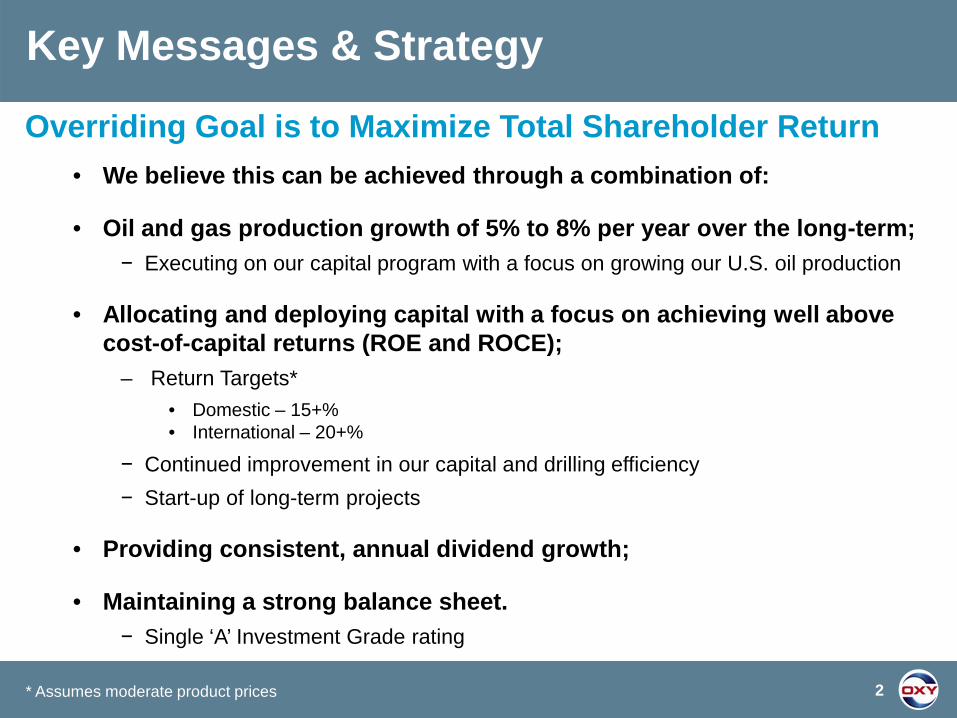
Medium-Term Objectives
4
CASH FLOW GROWTH
COST SAVINGS
Permian Resources production growth
Al Hosn project start-up
Gradual Commodity price recovery
~$400 million of captured cost savings year-to-date
Capital savings re-deployed into additional activity in Permian Basin
Cash Flow Neutral after capital spending and dividend outlays by 4Q 2015 at around $60/bbl oil
Succession Plan Announced
5
• Oxy’s board of directors has approved a CEO succession plan and promoted Vicki A. Hollub to Senior Executive Vice President of Occidental and President – Oxy Oil and Gas, responsible for operations in the United States, Middle East region and Latin America.
• The board plans for Ms. Hollub, who has served as Executive Vice President of Occidental and President, Oxy Oil and Gas – Americas, since 2014, to succeed Stephen I. Chazen as CEO of Occidental after a thorough transition period.
• Ms. Hollub has nearly 35 years of experience in the oil and gas industry, holding a variety of technical and leadership roles, both domestic and international.
• In 2013, Ms. Hollub was appointed Vice President of Occidental Petroleum Corporation and Executive Vice President, U.S. Operations, Oxy Oil and Gas.
• She previously served as Executive Vice President, California Operations; and President and General Manager, Permian Basin operations.

Cash Flow Priorities
1. Base/Maintenance Capital
2. Dividends
3. Growth Capital
4. Share Repurchase
5. Acquisitions
6
• Raised the dividend by 4+%, the 13th year of consecutive increases.
• Expect to be able to continue to grow our dividend for many years into the future.
– The new ethylene cracker which comes on in 2017 will provide a substantial boost in our distributable cash flow.
– Our base oil business in Abu Dhabi, Oman and the Permian Basin EOR production will support cash flow and grow modestly over time.
– High rates of growth in cash flow and profits will come from our Permian Resources business.
• We remain mindful of the need for close attention to drilling for profits not just volume growth.
• Our overall financial strength gives us confidence that we will be able to spend what we need, in a range of product prices, and still grow our dividends.
Confidence In Cash Flow = Dividend Increase
7
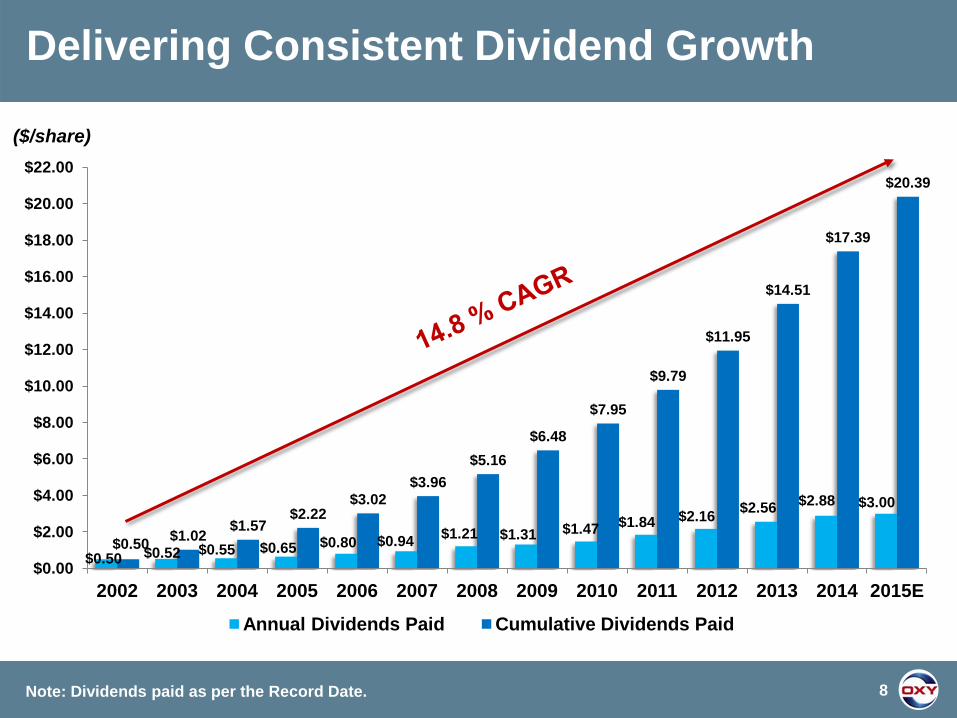
$0.50 $0.52 $0.55 $0.65 $0.80 $0.94 $1.21 $1.31 $1.47 $1.84 $2.16 $2.56 $2.88 $3.00
$0.50 $1.02 $1.57 $2.22
$3.02 $3.96
$5.16 $6.48
$7.95
$9.79
$11.95
$14.51
$17.39
$20.39
$0.00
$2.00
$4.00
$6.00
$8.00
$10.00
$12.00
$14.00
$16.00
$18.00
$20.00
$22.00
2002 2003 2004 2005 2006 2007 2008 2009 2010 2011 2012 2013 2014 2015E
Annual Dividends Paid Cumulative Dividends Paid
($/share)
Delivering Consistent Dividend Growth
8 Note: Dividends paid as per the Record Date.

• Over the last 5 quarters we have repurchased 28.4 million shares of our stock and have ~69 million shares remaining under our current program authorization.
• We will continue to repurchase shares subject to the stock price and market conditions and expect to ultimately repurchase the entire amount.
Active Share Repurchase Program
9
Shares Outstanding (mm) 12/31/14 3/31/2015 Weighted Average – Basic 773.1 769.6
Weighted Average – Diluted 773.4 769.6
Basic Shares Outstanding 770.6 767.6

Oil and Gas Focus Areas
Latin America
• Leading position in the Permian Basin.
• Permian Resources is a growth driver.
• Al Hosn Project, Oman and Qatar.
• Additional opportunities for growth with partner countries.
• Highest margin operations in Colombia.
• Additional opportunities for moderate growth with partner.
Oxy will be positioned to grow
• Oil production • Earnings & Cash Flow
per share • ROCE • Dividend stream
OxyChem High FCF, moderate growth business.
Oxy Midstream Integrated pipeline and marketing business to maximize realizations.
Oxy Runs A Focused Business
10
MENA
United States
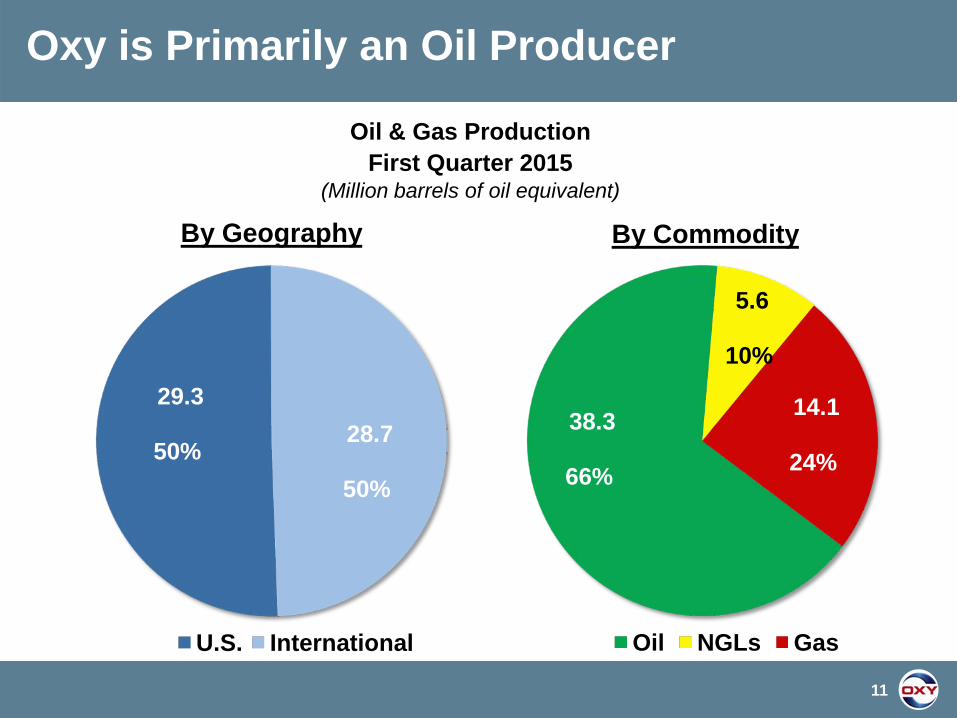
29.3
50% 28.7
50%
By Geography
U.S. International
38.3
66%
5.6
10%
14.1
24%
By Commodity
Oil NGLs Gas
Oxy is Primarily an Oil Producer
Oil & Gas Production First Quarter 2015
(Million barrels of oil equivalent)
11

591 591
FY2013 FY2014 Permian Growth
Al Hosn & Other Int'l
2015 Production Outlook
• U.S. oil production grew 14% in 1Q15 on a year-over-year basis.* • Increased Permian Resources production guidance to 105 - 108 MBOED. • Al Hosn expected to average 25 MBOED in 2Q15 and 35 MBOED for FY 2015. • In the U.S., we expect oil production growth of 8% this year, partially offset by
modest declines in NGLs and natural gas production. • Expect FY 2015 production to grow by 60 - 80 MBOED.
Company-wide 2015 Oil & Gas Production Outlook (MBOED)
12
Delivering on Production Growth
650 – 670
30 – 33
* Excludes Hugoton oil production which was sold in 2Q14.
30 – 45
13
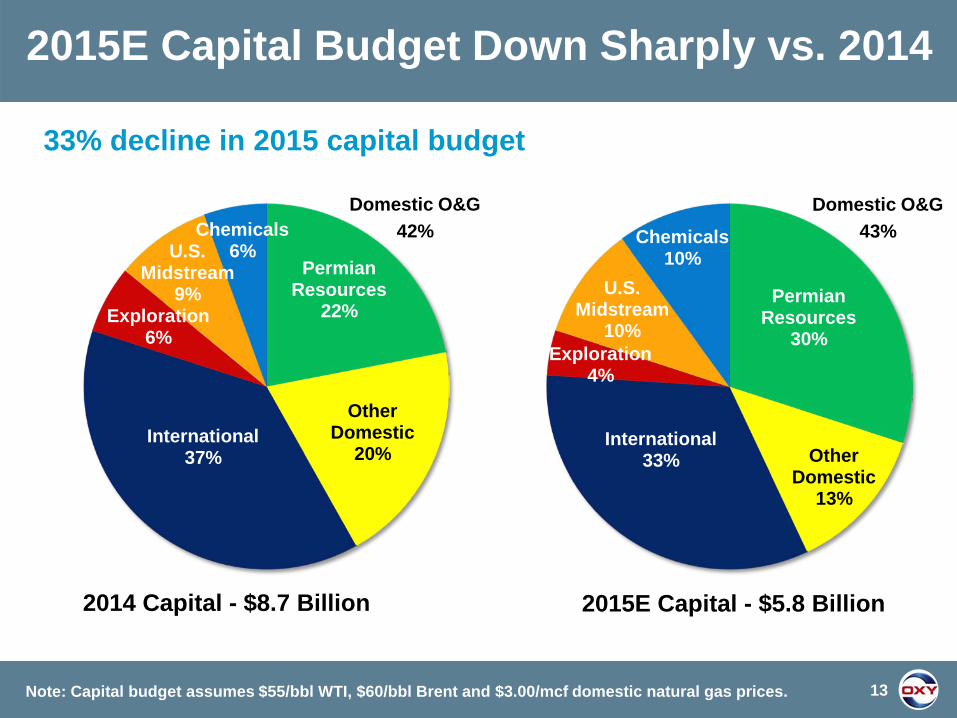
2015E Capital Budget Down Sharply vs. 2014
Note: Capital budget assumes $55/bbl WTI, $60/bbl Brent and $3.00/mcf domestic natural gas prices.
2014 Capital - $8.7 Billion
Permian Resources
22%
Other Domestic
20% International
37%
Exploration 6%
U.S. Midstream
9%
Chemicals 6%
Permian Resources
30%
Other Domestic
13%
International 33%
Exploration 4%
U.S. Midstream
10%
Chemicals 10%
Domestic O&G 43%
2015E Capital - $5.8 Billion
Domestic O&G 42%
33% decline in 2015 capital budget

• Through the success of our drilling program and capital efficiency initiatives, we lowered our F&D costs over recent years.
• We expect our DD&A expense to be ~$15 / BOE in 2015, a decrease from ~$17 / BOE in 2014.
• DD&A rate of growth should flatten out as recent investments come online and F&D costs decline.
• The success of our organic reserve additions and capital efficiencies achieved demonstrates the significant progress we have made in turning the Company into a competitive domestic producer.
14
5-Year Avg.
3-Year Avg.
2014 5-Year Avg.
3-Year Avg.
2014
U.S. Total
$20.48 $18.66
$16.89
$21.90 $20.24
($ / BOE)
$12.18
Organic F&D Costs*
*5 Year and 3 Year averages include revisions; 2014 excludes revisions.
Capital Efficiency Continues to Improve

• Total company capital expenditures for the 1Q15 were $1.7 bn and we expect our quarterly expenditures to continue to ramp down through the year.
• Based on our lower pace of spending in 1Q15 and continued cost efficiency gains, we expect total capital spending for 2015 to be below our original guidance of $5.8 bn.
• Oil and gas spent $1.5 bn, with Permian Resources expenditures nearly 50% of the total, and the remaining $200 mm split about evenly between Chemical and Midstream.
• 4Q15 exit rate of capital would imply an annualized spending level of ~$4 bn.
15
Capital Spending Ramps Down Through Year
1Q15A 2Q15E 3Q15E 4Q15E
Permian Resources
Remaining Oil & Gas
Midstream & Chemicals
$1.7 bn
~$1.0 bn
2015 Capital Budget

• As we capture price savings from suppliers and improve efficiencies, we are able to do more with less spending.
• Given our large acreage position and deep inventory, we have the flexibility to defer drilling and appraisal activity.
• Although we will likely outspend our cash flow during 1H15, we expect that by 4Q15 our operating cash flow will cover our capital and dividends, at oil prices of roughly $60/bbl.
2015 Capital Budget and Domestic Drilling Rigs
16
Capital Program 2015 Evolution
0%
25%
50%
75%
100%
1Q15 2Q15E 3Q15E 4Q15E
Capital Budget Domestic Drilling Rigs
Note: 1Q15 is the baseline index; subsequent quarters are a % of 1Q15

• Largest oil producer and operator in Permian Basin.
• Significant investments in infrastructure to support the upstream provide low operating costs, advantaged realized prices and competitive advantages.
• ~60% of Oxy’s Permian oil production is from CO2 related EOR projects – Oxy’s most profitable business.
• The EOR business (mainly CO2) will continue to generate significant FCF.
• Permian Resources is the cornerstone growth asset of the domestic business.
• Substantial acreage position with significant resource development potential.
• We have shifted toward horizontal drilling and expect the Resources business to grow rapidly.
Permian Basin Is The Core Domestic Asset
Oxy Acreage
Oil Pipelines
CO2 Pipelines
17

Tota
l Ope
rate
d Pr
oduc
tion,
Tho
usan
d B
OEP
D Cumulative
% of total 2.3 million
BOEPD
Oxy is the Largest Permian Basin Producer
18 Source: IHS Energy Feb and Mar 2014, 6 MCF/BOE excluding estimated CO2 production.
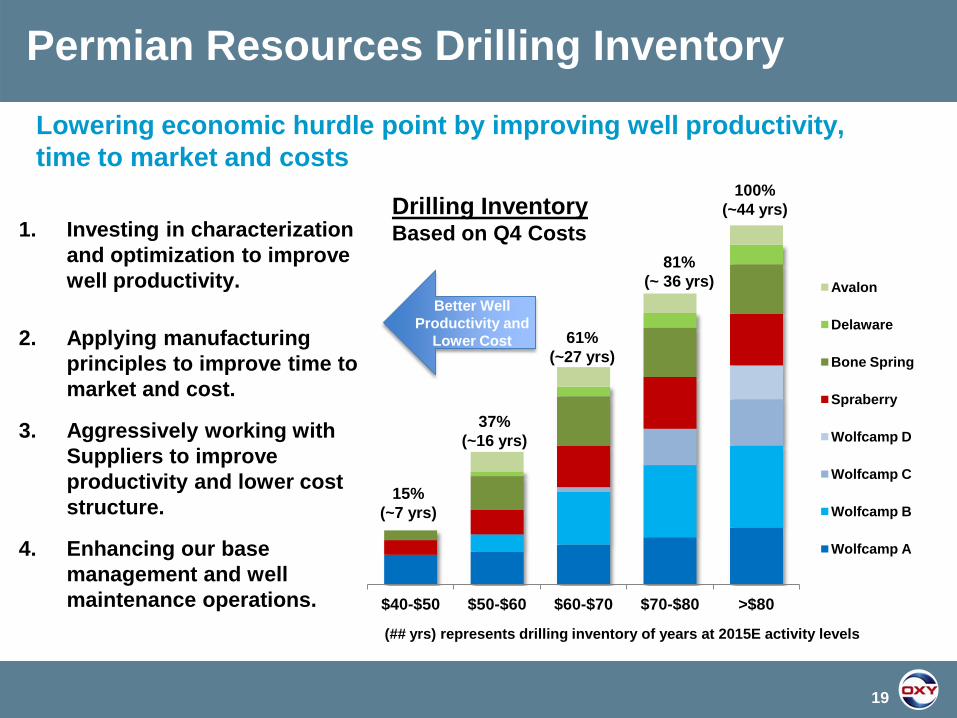
$40-$50 $50-$60 $60-$70 $70-$80 >$80
Avalon
Delaware
Bone Spring
Spraberry
Wolfcamp D
Wolfcamp C
Wolfcamp B
Wolfcamp A
1. Investing in characterization and optimization to improve well productivity.
2. Applying manufacturing principles to improve time to market and cost.
3. Aggressively working with Suppliers to improve productivity and lower cost structure.
4. Enhancing our base management and well maintenance operations.
19
(## yrs) represents drilling inventory of years at 2015E activity levels
Lowering economic hurdle point by improving well productivity, time to market and costs
Drilling Inventory Based on Q4 Costs
Better Well Productivity and
Lower Cost
15% (~7 yrs)
37% (~16 yrs)
61% (~27 yrs)
81% (~ 36 yrs)
100% (~44 yrs)
Permian Resources Drilling Inventory

87 75 85 86
150
59 71 70
126
2Q14 3Q14 4Q14 1Q15
Drilled Online
17 19 25 21 13
7 5 4
4
2Q14 3Q14 4Q14 1Q15
Horizontal Vertical
20
Permian Resources Summary
*Assumes $60/bbl WTI oil prices
48 57 64 75 84
98 107 120
2011 2012 2013 2014 4Q14 1Q15 2015E 2016E*
Increased 2015 production guidance from 100 MBOED to 105 - 108 MBOED
Production (MBOED) Average Rig Count
Wells Drilled / Online
Remainder 2015
Remainder 2015

Achieved 17% increase in BOED and 22% increase in BOPD vs. Q414
1Q14 2Q14 3Q14 4Q14 1Q15 Drill 67 87 75 85 86 Online 67 59 71 73 126
0
20
40
60
80
100
120
Wel
l Cou
nt
WELL ACTIVITY
Permian Resources Summary
Total Production (BOED)
1Q 2015 98,000
Oil Production (BOPD) vs. 4Q-2014 vs. 1Q-2014
62,000 22% Increase 68% Increase
Capital Expenditures $728MM
Active Rigs 25
Wells Drilled 86 / 61Hz
Wells Online 126 / 67 Hz (+20 Hz v Q4)
1Q 2015 126 Wells Online
21

• Faster drilling
• Less idle time
• More frac stages per day
• Integrated planning
• Infrastructure investments in water handling, storage, gathering and takeaway
• Step change in capital efficiency should allow for increased activity with fewer drilling rigs and structural long-term cost reductions
(# o
f Day
s)
22
Step Change in Efficiency – Our Total Time To Market Is Down 50%
2014 YTD TARGET
Drilling Completion Hook-Up

• Some of the captured cost savings have been re-deployed into higher activity levels than planned for the remainder of 2015.
2015E Domestic Drilling Rigs
23
Domestic Drilling Rig Evolution For 2015
31
11 10 9
31
14 13 13
0
5
10
15
20
25
30
35
1Q15 2Q15E 3Q15E 4Q15E
January Plan Current Outlook

Move to Manufacturing Mode Has Significantly Reduced Well Costs
$5.3 $3.6 $3.5
$5.6
$4.7 $3.0
$-
$2.0
$4.0
$6.0
$8.0
$10.0
$12.0
2014 Current Target
GR
OSS
WEL
L C
OST
$M
M
WELL COST Delaware WC-A 4,500‘ HZ
Drilling Completion
Manufacturing Mode Drilling / Completions
$10.9
$8.3
$6.5
43
31
26
14 16
0
5
10
15
20
25
30
35
40
45
50
2014 Feb Mar Best Target
DRILL DAYS Delaware WC-A 4,500’
Spud to Rig Release
24

$3.7 $2.8 $2.5
$2.9
$2.9 $3.0
$-
$1.0
$2.0
$3.0
$4.0
$5.0
$6.0
$7.0
$8.0
2014 Current Target
GR
OSS
WEL
L C
OST
$M
M
WELL COST New Mexico Bone Spring HZ
Drilling Completion
$4.0 $3.3 $2.9
$5.7
$4.6 $4.3
$-
$2.0
$4.0
$6.0
$8.0
$10.0
2014 Current Target
GR
OSS
WEL
L C
OST
$M
M
WELL COST SCR Spraberry 10,000‘ HZ
Drilling Completion
Manufacturing Mode Drilling / Completions
$9.7
$7.9 $7.2
$6.6
$5.7 $5.5
25
Move to Manufacturing Mode Has Significantly Reduced Well Costs
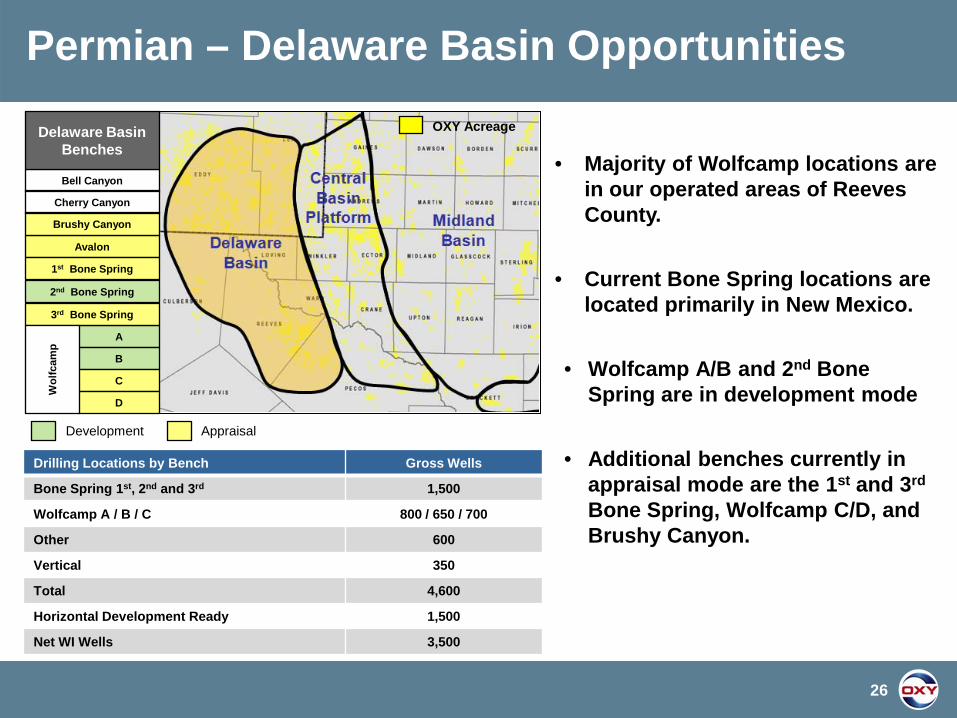
Appraisal
A
Avalon
Brushy Canyon
Cherry Canyon
Bell Canyon
Delaware Basin Benches
1st Bone Spring
2nd Bone Spring
3rd Bone Spring
B
Development
C
D
Wol
fcam
p
Drilling Locations by Bench Gross Wells
Bone Spring 1st, 2nd and 3rd 1,500
Wolfcamp A / B / C 800 / 650 / 700
Other 600
Vertical 350
Total 4,600
Horizontal Development Ready 1,500
Net WI Wells 3,500
OXY Acreage
• Majority of Wolfcamp locations are in our operated areas of Reeves County.
• Current Bone Spring locations are located primarily in New Mexico.
• Wolfcamp A/B and 2nd Bone Spring are in development mode
• Additional benches currently in appraisal mode are the 1st and 3rd Bone Spring, Wolfcamp C/D, and Brushy Canyon.
26
Permian – Delaware Basin Opportunities

Appraisal Development Exploration
Drilling Locations by Bench Gross Wells
Spraberry 450
Wolfcamp A / B / C / D 250 / 350 / 550 / 700
Vertical 200
Total 2,500
Horizontal Development Ready 1,050
Net WI Wells 2,300
OXY Acreage
• Majority of Wolfcamp locations are in our operated areas of Martin, Midland and Andrews Counties.
• Wolfcamp A & B and Spraberry are in development mode.
• Additional benches currently in appraisal mode are the Clearfork and Wolfcamp C & D.
Midland Basin Benches
D / CLINE
C B A
Lower Spraberry Middle Spraberry Upper Spraberry
Clear Fork
Ellenburger Simpson
Mississippian Lime Barnett Shale
Montoya
Wol
fcam
p
San Andres Grayburg
Yates
27
Permian – Midland Basin Opportunities
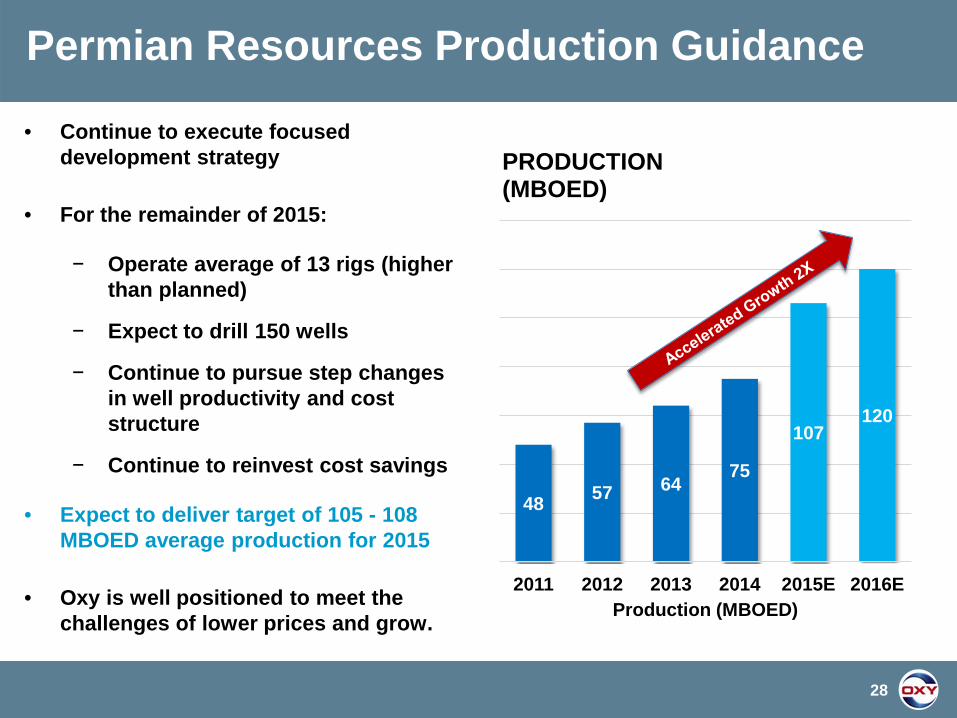
Permian Resources Production Guidance
• Continue to execute focused development strategy
• For the remainder of 2015:
− Operate average of 13 rigs (higher than planned)
− Expect to drill 150 wells
− Continue to pursue step changes in well productivity and cost structure
− Continue to reinvest cost savings
• Expect to deliver target of 105 - 108 MBOED average production for 2015
• Oxy is well positioned to meet the challenges of lower prices and grow.
48 57 64 75
107 120
2011 2012 2013 2014 2015E 2016E Production (MBOED)
PRODUCTION (MBOED)
28

• ~150,000 BOEPD of low cost production.
• Most active and largest EOR operator in the Permian Basin with 30 active floods.
• Over 40 years of successful CO2 flooding experience.
• High working interest in over 350 properties.
• Operate 2 CO2 source fields • Handle 2 BCFD of gas
through: − 12 gas processing plants
− 1,900 miles of pipeline
CO2 Supply and Processing
29
Permian EOR – Consistent Generator of Cash
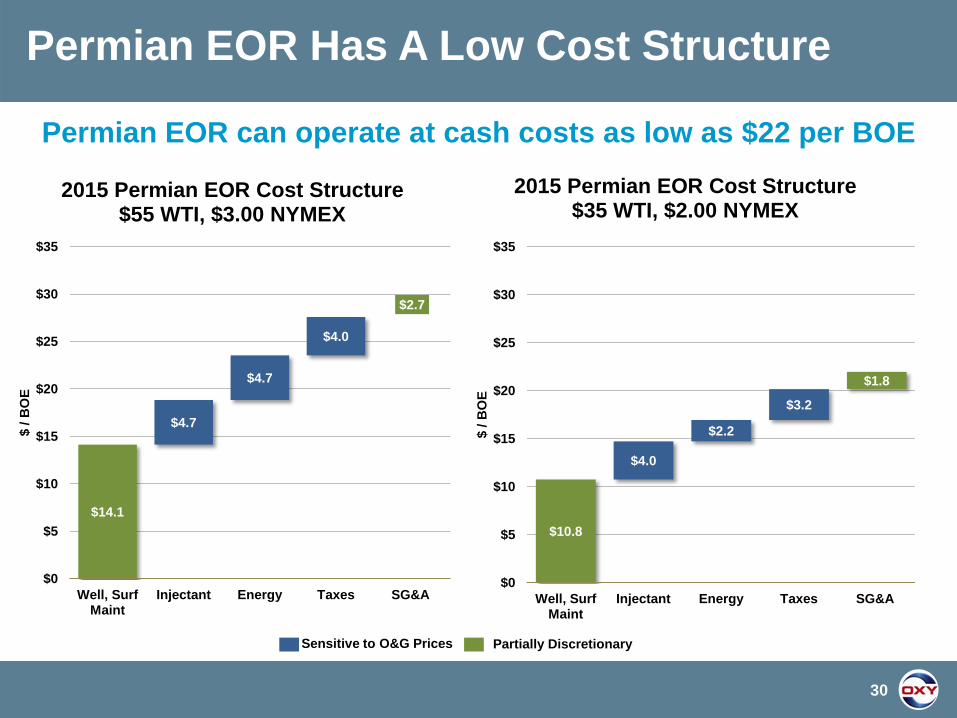
Permian EOR Has A Low Cost Structure
Sensitive to O&G Prices Partially Discretionary
$14.1
$4.7
$4.7
$4.0
$2.7
$0
$5
$10
$15
$20
$25
$30
$35
Well, Surf Maint
Injectant Energy Taxes SG&A
$ / B
OE
2015 Permian EOR Cost Structure $55 WTI, $3.00 NYMEX
$10.8
$4.0
$2.2
$3.2
$1.8
$0
$5
$10
$15
$20
$25
$30
$35
Well, Surf Maint
Injectant Energy Taxes SG&A
$ / B
OE
2015 Permian EOR Cost Structure $35 WTI, $2.00 NYMEX
30
Permian EOR can operate at cash costs as low as $22 per BOE

Cushing
Houston
Corpus Christi
LongHorn
Cactus 2Q15
Centurion
Central/ Midland Basins SENM/
DE Basins
Midland-South
Slaughter Basin
BridgeTex Started Up in Late Sept 2014
Seaway
WTG
Owned
3rd Party
31
Oxy Permian Gathering / Takeaway
BridgeTex
Colorado City

• Some of the longer lead time investments we have been making over the past couple of years will start contributing to our results this year. – Continued preferential access and commitment to the BridgeTex
pipeline which started in late September will improve our Permian price realizations.
– The Al Hosn Gas Project started its initial production in the beginning of 1Q’15 and started contributing to our cash flow.
– OxyChem Ingleside Ethylene Cracker.
– Oxy Ingleside Energy Center.
• As these projects come on line in 2015 - 17, we expect them to make significant contributions to our earnings, cash flow, and improve our overall returns.
32
Long-term Growth Investments

• We completed the Al Hosn gas project, on budget and on time.
• It is currently producing ~25,000 BOED (net to Oxy) and will ramp up through the year.
• FY 2015 volumes from Al Hosn should average ~35,000 BOED (net to Oxy) with more than 40% of production coming from NGLs and condensate.
• At full run-rate production, annualized operating cash flow is expected to be $300 to $600 million depending on commodity prices.
33
Al Hosn Gas Project Continues To Ramp Up
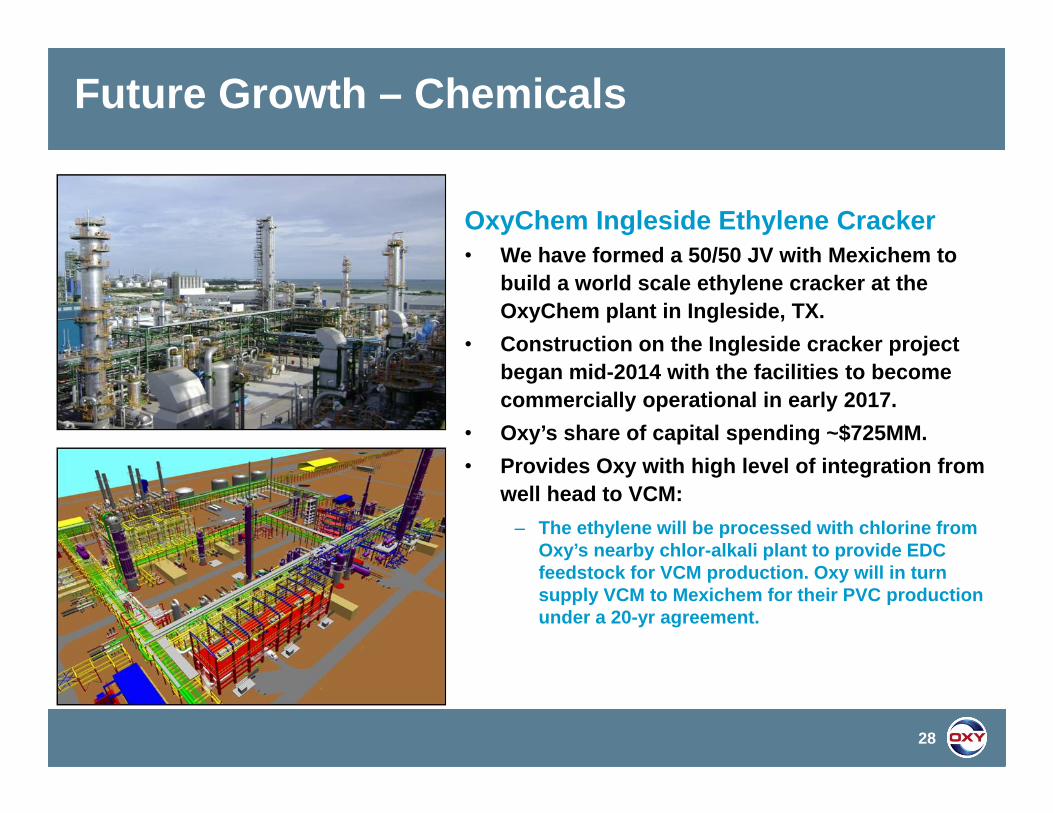
Future Growth – Chemicals
OxyChem Ingleside Ethylene Cracker• We have formed a 50/50 JV with Mexichem to
build a world scale ethylene cracker at the OxyChem plant in Ingleside, TX.
• Construction on the Ingleside cracker project began mid-2014 with the facilities to become commercially operational in early 2017.
• Oxy’s share of capital spending ~$725MM.• Provides Oxy with high level of integration from
well head to VCM:– The ethylene will be processed with chlorine from
Oxy’s nearby chlor-alkali plant to provide EDC feedstock for VCM production. Oxy will in turn supply VCM to Mexichem for their PVC production under a 20-yr agreement.
28

Future Growth – Ingleside Energy Center
Provides flexibility and avoids congested ship channel
• Terminaling
- LPG: 60-100 MB/d (2Q 2015)
- Crude/Condensate: 200-300 MB/d (1H 2016)
- Storage: 2 - 4 MM BBLS
• Future processing options
OxyChem Plant
35

Cautionary Statement Portions of this presentation contain forward-looking statements and involve risks and uncertainties that could materially affect expected results of operations, liquidity, cash flows and business prospects. Words such as "estimate," "project," "predict," "will," "would," "should," "could," "may," "might," "anticipate," "plan," "intend," "believe," "expect," "aim," "goal," "target," "objective," "likely" or similar expressions that convey the prospective nature of events or outcomes generally indicate forward-looking statements. Factors that may cause Occidental's results of operations and financial position to differ from expectations include but are not limited to: global commodity pricing fluctuations; supply and demand considerations for Occidental’s products; higher-than-expected costs; the regulatory approval environment; reorganization or restructuring of Occidental's operations; not successfully completing, or any material delay of, field developments, expansion projects, capital expenditures, efficiency projects, acquisitions or dispositions; lower-than-expected production from development projects or acquisitions; exploration risks; general economic slowdowns domestically or internationally; political conditions and events; liability under environmental regulations including remedial actions; litigation; disruption or interruption of production or manufacturing or facility damage due to accidents, chemical releases, labor unrest, weather, natural disasters, cyber attacks or insurgent activity; failure of risk management; changes in law or regulations; or changes in tax rates. You should not place undue reliance on these forward-looking statements, which speak only as of the date of this presentation. Unless legally required, Occidental does not undertake any obligation to update any forward-looking statements, as a result of new information, future events or otherwise. Material risks that may affect Occidental’s results of operations and financial position appear in Part 1, Item 1A “Risk Factors” of Occidental's 2014 Form 10-K.
36