Stephan Schmitt-Degenhardt August 2013 regional perspecti… · A regional perspective on poverty...
51
A regional perspective on poverty in Myanmar Stephan Schmitt-Degenhardt August 2013 This research was commissioned by UNDP Myanmar based on the data of the Integrated Household and Living Conditions Assessment (IHLCA) conducted under the support of UNDP, UNICEF and SIDA. The opinions do not necessarily reflect the institutional points of view.
Transcript of Stephan Schmitt-Degenhardt August 2013 regional perspecti… · A regional perspective on poverty...

A regional perspective on poverty in Myanmar
Stephan Schmitt-Degenhardt
August 2013
This research was commissioned by UNDP Myanmar based on the data of the Integrated Household and LivingConditions Assessment (IHLCA) conducted under the support of UNDP, UNICEF and SIDA. The opinions do notnecessarily reflect the institutional points of view.
Poverty in Myanmar 2
ContentsExecutive summary ................................................................................................................................. 4
Introduction............................................................................................................................................. 6
The state of poverty and inequality ........................................................................................................ 7
Poverty incidence ................................................................................................................................ 7
Overall poverty incidence................................................................................................................ 7
Poverty Gap ......................................................................................................................................... 8
Changes in the poverty gap............................................................................................................. 8
Adjusted poverty lines and gaps ..................................................................................................... 9
Poverty and ethnicity .................................................................................................................... 10
Poverty dynamics .............................................................................................................................. 11
Poverty dynamics and inertia........................................................................................................ 11
Reasons for poverty entry ............................................................................................................. 13
Hypothetical cost to eliminate poverty............................................................................................. 14
Income and poverty .............................................................................................................................. 15
Employment ...................................................................................................................................... 15
Labour force .................................................................................................................................. 15
Underemployment gap ................................................................................................................. 15
Migration ....................................................................................................................................... 19
Main occupation............................................................................................................................ 20
Own account workers.................................................................................................................... 22
Agriculture ......................................................................................................................................... 23
Land ownership ............................................................................................................................. 23
Mechanization............................................................................................................................... 26
Most significant problem .............................................................................................................. 26
Crop losses..................................................................................................................................... 27
Conclusion: poverty in Myanmar .......................................................................................................... 29
Second Part ........................................................................................................................................... 31
Development potentials for the selected states and regions ............................................................... 31
Development potentials for the selected states and regions ............................................................... 32
Technical note ................................................................................................................................... 32
Ayeyarwady ....................................................................................................................................... 34
Bago................................................................................................................................................... 36
Chin.................................................................................................................................................... 39
Magway ............................................................................................................................................. 41
Poverty in Myanmar 3
Mandalay........................................................................................................................................... 43
Mon ................................................................................................................................................... 45
Shan................................................................................................................................................... 47
Final remarks ..................................................................................................................................... 51

Poverty in Myanmar 4
Executive summary
Myanmar is at a critical moment in its development. The economic and political decisions of todaywill have serious implications for the development path the country will be taking. These years are sorelevant because of the political transformation process, and because of the current internationalcommodity boom: if Myanmar specialises on primary products it risks embarking on a sub-optimalgrowth trajectory of volatile export earnings and an economic structure that is easier subject tovolatile shocks and special interest groups. Instead, Myanmar should target early on a steadymovement towards more complex products services, and a more diversified industrial and tradestructure.
At the crossroads of India, China and ASEAN, Myanmar is of high geopolitical interest. As integral andlong standing part of the ASEAN community, its political and commercial future is anchored in thistrading block. But open trade with China, India and also Bangladesh, should be fostered as long as itis beneficial for the wellbeing of the involved partners.
Myanmar’s poverty rate and depth are rather on the low side for a nation at this development stage.Its poverty is shallow, with the median income only 25% above the poverty line. Small improvementscan thus bring a large number of people out of poverty, but already small shocks can also bring aneven larger number of people into poverty. Due to its very low consumption inequality, GDP growthcan translate at a larger ratio into poverty reduction.
Overall, the country would need annually 850 billion Kyat, or 2.3% of its GDP (2010), to lift all its poorup to the poverty line, if cash transfers could be fully targeted and no transaction cost occurred. Ineffect, the median poor endures an annual poverty gap of 50,000 Kyat – or some 25 to 30 days ofpaid work.
The availability of work is, however, not the major obstacle to poverty reduction. Rather, the work isnot equally distributed and paid for: as a whole, the Myanmar people do work weekly 60 millionhours too much, i.e., beyond the 44 hour week. If the workload would be perfectly distributed,Myanmar could provide jobs for additional 1.34 million people. The real issue is one of a very lowreturn on the labour invested. This low return is likely to have three major reasons: low skills and lowcapital usage lead to low productivity, underdeveloped market structures further reduce productivityand increase cost, and unbalanced market powers lead to an imposed capping of wages. If there isthe will, all three can be handled.
Because Myanmar is exposed to many natural –but in principle preventable- calamities, costingannually 8% of agricultural output or 500 billion Kyat, it needs to invest into mitigation andadaptation strategies. Land fragmentation into unsustainably small plots hamper developmentespecially in Chin and Shan. But household indebtedness is looming as potentially the largestproblem: the median poor has debts of 60,000 Kyat, mostly for consumptive purposes. Dependingupon the loan source, this household most likely pays between 8,000 and 12,000 Kyat monthly forinterest alone, resulting in 96,000 to 144,000 Kyat annually, or two to three poverty gaps! In otherwords, if the poor were credit free, the half would not be poor anymore!
This report confirms what many reports have outlined before: the country requires a diversificationinto more complex products, while not neglecting the agricultural sector which will remain for a longtime the breadwinner for most households. It requires investments into infrastructure and especially

Poverty in Myanmar 5
electricity and IT communication. And it requires a predictable macroeconomic framework withcapable, strong and accountable institutions. Development requires finance. But it would be wrongto hastily overrun the country with money from foreign investors or wealthy locals: these wouldobtain the bacons of investment, leave for a long time to come the development potential of localsmall and medium investors in the dry. It could quickly turn out to be too much, too soon.1
Myanmar is a country of vast opportunities. It is in the hand of the Government to develop theseopportunities, and to do so in such a way that they are “in the interest of the entire people, not inthe interest of a handful of people” (Sai Mauk Kham, Vice President of Myanmar, May 2012).2
1 See Rieffel & Fox. (2013). Too much too soon.2 See International Crisis Group, 2012, p. 10

Poverty in Myanmar 6
Introduction
Based on the results of the Integrated Household Living Conditions Surveys (IHLCS) of 2005 and 2010,various reports have already been written. These reports analyse the poverty profile, povertydynamics, poverty and the Millennium Development Goals (MDG), the role of remittances, access tofinance, transport infrastructure and trade, food insecurity and vulnerability, and do also providetechnical and qualitative background information on these surveys.
This report's purpose is to attempt, as far as the data allow, a regional analysis of the causes ofpoverty. Based on this analysis, potentials to improve the wellbeing of the regional populations areoutlined. Seven regions3 have been selected for a more intensive analysis, and for each of theseregions, UNDP is in the process of preparing separate analytical reports.
The report looks predominantly at expenditure poverty. It focuses on the median poor (versus theaverage), and takes as "unit of measurement" the median poverty gap: how much would variouschanges contribute to reduce the cost incurred by the poor household, or increase its income, interms of closing this median poverty gap?
In so doing, the report does also attempt to provide national and particularly regional policy makerswith benchmarks to assess policy proposals. As so many reports have already been written, thisreport avoids where possible elaborate repetitions and refers instead to the said documents.
3 Ayeyarwady, Bago, Chin, Magway, Mandalay, Mon, and Shan.

Poverty in Myanmar 7
The state of poverty and inequality
Poverty incidence
Overall poverty incidence
Between 2005 and 2010, Myanmar managed to reduce the poverty incidence and the povertydepth by almost 7 percentage points (from 29.6% to 22.7%), or by 5.2% annually. In internationalcomparison, Myanmar did therefore perform well in terms of poverty reduction: regionally, only SriLanka, Thailand and Viet Nam reduced their poverty by a higher annual percentage (over longerperiod, though).4 In the same time, GDP increased by 7.8% annually.5 It has been estimated that a 1%increase in income can cut poverty in highly equal countries by 4.3% - the relation in Myanmarappears to be about 1.5% poverty reduction for each percent GDP growth.6
The overall poverty rate changes substantially if measured according to the internationally usedpoverty lines of US$ 1.25 and US$ 2.00 per day, at purchase power parity (PPP): at US$ 1.25 (PPP) itdecreases to only 1.7%, and at US$ 2.00 (PPP) per day it increases to 26.5%.7
Figure 1: Distribution of adult equivalent expenditures
Note:for better visibility, expenditures above 1.5 mio Kyat have been cut off
4 ADB. 2012d5 http://www.economywatch.com/economic-statistics/Myanmar/GDP_Constant_Prices_National_Currency/ (in constant prices, nationalcurrency)6 Note: Unless otherwise noted all data stem from the UNDP IHLCS 2005 or IHLCS 2010, and the reports related to these surveys.Discrepancies between this report and other published reports can and do occur, as the calculation methods used differ. Each IHLCS isbeing conducted in two phases with the same households, but set about 6 months apart. Depending upon the purpose, the UNDP PovertyProfile usually creates averages of both phases, while this report relies in most cases only on the results of the first of these phases.Further, the UNDP Poverty Profile did at times exclude outliers, while this report includes them, unless otherwise noted. Therefore, thisreport relies more on median values, which do better reflect the situation of the “typical” poor.77 World Bank PPP exchange rate of 535.61 Kyat per US$ (PPP), calculated at 365 days per year. This yields an equivalent of 244,372 Kyatand 390,995 Kyat for the respective poverty lines.
0,00 500000,00 1000000,00 1500000,00
totexpn: Normalized consumption expenditure per ae for a year
0
100
200
300
Cou
nt
$1.25 Line Nat.Pov.Line

Poverty in Myanmar 8
But poverty reduction was uneven between the States and Regions (S/R) of the Union. While thepoverty incidence decreased in almost all S/R by up to 66%, it increased in Ayeyarwady, Kayin,Rakhine and Yangon. Five of the S/R fall out of one standard deviation from the mean.8 These areBago (West) and Kayah as "over-performers", and Ayeyarwady and Rakhine as "underperformers".The underperformance of Ayeyarwady is likely to be the consequence of cyclone Nargis.
The poverty rate in rural areas was 1.8 times higher than in urban areas. As it was only 1.6 times in2005, inequality between urban and rural areas increased slightly. These rations are howeveraverage for the Asia-Pacific region: they reach 18 in Bhutan, almost 6 in Viet Nam, and go down toaround par value in Armenia. Out of 22 countries, Myanmar is slightly above median (ADB. 2012d).
The median person had however only slightly more disposable income than in 2005. As thecompound inflation rate between 2005 and 2010 was around 128%,9 a basket of goods equivalent tothe median consumption expenditure of 194,233 Kyat in 2005 would cost 422,851 Kyat in 2010. Theactual 2010 median expenditure was 477,109 Kyat per year, leaving an increase of 54,258 Kyat (in2010 prices) over five years, or 2.4% annually.10 This calculation disregards relative price changes. Asthe price of single most important consumption expenditure of the people, rice, increased in thesame period by about 134.7%,11 parts of this calculated improvement are likely to have been eatenup by relative price increases of rice alone.
Poverty Gap
The poverty gap (or poverty depth or poverty intensity) indicates the depth of poverty, andcorrespondingly the cost of bringing poor people up to the poverty line.
Changes in the poverty gap
The median poverty gap at union level is almost 50,000 Kyat (49,237 Kyat) per poor person. As apoor household has in average 6.13 members, and a median of 6, one can roughly state that the‘typical’ or median poor household would require additional discretionary income of 300,000 Kyatannually to pass the poverty line (Table A3).
Between 2005 and 2010, Myanmar managed to reduce in all States and Regions (S/R) the povertygap, and partially significantly. Reductions, adjusted for 2010 prices, were in average 31%, andmedian 33%. So while the median person in Myanmar did not gain much real income, the medianpoor person did Table A4).
8 Note that the standard deviation is very large (28.4).9 World Bank data. Note that different organisations assume different inflation rates for this period. See table A1: Inflation rates, in theannex.10 The average expenditure increased by only 0.7% annually, indicating a more equal expenditure distribution over the population.11 According to CSO data, 1 Pyi of Emata rice cost in 2005 318.74 Kyat, and in 2009 737.25 Kyat, which is an annual increase of 23.32%. As2010 data are not available, it is assumed that its price increased from 2009 to 2010 roughly in line with overall inflation of 1.47% (WorldBank data), yielding a compound price increase of 134.7%. Note that the IHLCS revealed an actual average price of Emata of 916 Kyat in2010.

Poverty in Myanmar 9
Figure 4: Poverty gaps in constant MMK 2005 and 2010
The average shortfall (at Union level) of 60,184 was more or less equivalent to 30 days of income peryear (at 2,000 Kyat per day). This does first not appear unachievable to solve, if compared to India’s100 days programme. But it has to be seen on a per person level and needs to be adjusted toworkdays per household member who can work (economic dependency ratio).
Adjusted poverty lines and gaps
Poverty can be reduced by increasing the income of the poor, or by reducing the cost of goods andservices they consume. It must be noted that a fixed monetary poverty line could quickly lead to theassumption that only income increases of poor households can reduce poverty. This, however, is byno means the case: poverty is multi-facetted, and a poor household does not care about the absoluteamount of income he receives, but about the purchase power of this income.
There are regional disparities in the purchase power of households, which are not sufficientlyreflected in the establishment of one national poverty line. These cost differences have beenaccounted for at household level with the help of the ‘Passche Price Index’. But for an accuratecalculation of regional differences in the cost of living, information on regionally adjustedconsumption baskets is necessary. As this information is missing, a statistically correct break-down ofthe poverty and food poverty line to State and Region level is not possible. Nevertheless, includingthe PPI in the poverty gap calculations can provide at least an indicator of direction, assuming that allStates and Regions consume the same basket of goods.
47373
42786
34098
75092
56363
29808
39492
41761
51959
45774
52582
41897
43441
59426
42399
65906
41121
49238
63686
52542
53675
135848
106419
85217
45294
70474
71471
69564
72040
70246
74198
94412
68142
88349
67983
73653
Ayeyarwady
Bago (East)
Bago (West)
Chin
Kachin
Kayah
Kayin
Magwe
Mandalay
Mon
Rakhine
Sagaing
Shan (South)
Shan (North)
Shan (East)
Taninthayi
Yangon
Total
2005, in 2010 prices 2010

Poverty in Myanmar 10
Table 1: Actual average PPI by S/R and adjusted overall and food poverty lines
AveragePPI
Revised poverty line Revised foodpoverty line
Myanmar 1,0 376151 274990
Kachin 1,1 341956 249991
Kayah 0,97 387785 283495
Kayin 1,09 345093 252284
Chin 1,01 372427 272267
Sagaing 0,98 383828 280602
Taninthayi 1,05 358239 261895
Bago (East) 0,97 387785 283495
Bago (West) 0,92 408860 298902
Magway 0,96 391824 286448
Mandalay 0,99 379951 277768
Mon 1,09 345093 252284
Rakhine 0,83 453195 331313
Yangon 1,06 354860 259425
Shan (South) 1,04 361684 264413
Shan (North) 1,1 341956 249991
Shan (East) 1,14 329957 241219
Ayeyarwady 0,94 400161 292543Note: These PPI adjusted poverty lines do not reflect variations in the consumption baskets
and are therefore only to be seen as rough approximations
In all S/R but Kachin, Kayin, Mon, Shan and Taninthayi, the de facto poverty gap experienced by thehouseholds is more severe than the calculated. The additional gap makes in average about 8% forthose S/R where it is higher, with Rakhine (almost 21%) and Bago West (almost 13%) suffering the byfar highest discrepancies.
Poverty and ethnicity
There are no significant variations between the expected and the actual poverty rate of ethnicities.As the IHLCS does not ask for the ethnic background of the respondents, the main language spokenwas used as proxi for ethnicity. As expected, the median poverty gap is highest for the Chin speakingand lowest for the Kayah speaking people. For those S/R, where the mother tongue spoken is anindicator for the S/R, the ranking remains however roughly the same between S/R and mothertongue. Only the Kayin people do appear to be somewhat poorer as people than the average of theKayin state. The sample is however too small to analyse further. Should the population census still bevalid it appears as if the survey underrepresented the Kayin and the Hindi/other Indian and foreignlanguages, and overrepresented the other indigenous languages.

Poverty in Myanmar 11
Table 2: Poverty gap according to mother tongue
Mother tongue N% of poorin survey Mean Median
Median poverty gapof S/R
Estimatedpopulationby census
% ofsurvey
Kachin 95 2.25% 58580 46724 56363 1.4% 1.3%
Kayah 12 0.28% 51647 35648 29808 0.4% 0.4%
Kayin 129 3.06% 61905 50411 39492 6.2% 3.1%
Chin 251 5.71% 76864 71354 75092 2.2% 2.4%
Mon 65 1.54% 55310 47990 45774 2.4% 2.2%
Myanmar 2557 60.59% 55943 46632 n.a. 69.0% 71.1%
Rakine 167 3.96% 57299 49746 52582 4.5% 4.1%Shan 387 9.17% 60590 50772 (East) 43441
(North) 59426
(South) 42399
8.5% 7.2%
Otherindigenouslanguage 298 7.06% 61866 55765 n.a. 0.1% 4.6%
Chinese 28 0.66% 68853 48617 n.a. 0.7% 0.8%
Hindi/otherIndian language 34
5.47%
56973 46610 n.a.
4.6% 2.9%Other foreignlanguage 197 60629 57787 n.a.
Total 4220 100% 58618 49238 100% 100%
Poverty dynamics
All considerations so far look at the poverty stock, missing out on the dynamics of poverty: whilesome people remain chronically poor, others do enter into poverty and exit from it (churn). It isusually more economical to help preventing that people do not fall into poverty, than getting themout of poverty.
As the survey can track only a part of the households surveyed in 2005 again in 2010, the availabledata do not allow in depth analysis.
Poverty dynamics and inertia
In most S/R there were more escapes from poverty than entries into poverty. Overall, the relationwas about 1.5 to 1, that is, for every 1.5 persons escaping from poverty, one person entered poverty.Again, Chin has the highest percentage of entries into poverty, but the smallest number.

Poverty in Myanmar 12
Figure 5: Poverty dynamics according to S/R
Note that the provided numbers show the cases in the survey, and not the total cases.
Poverty "inertia" appears to be mostly low. The comparison of entries and escapes in relation to thetotal poor shows the real poverty dynamics. Such dynamics can also reflect social and politicalchoice: the fast movement up and down the business success ladder is promoted in countries like theUSA, but countries like Japan do tend to prefer safer and slower movements. A low ratio (as in Chin)shows a rather stable society -by choice or not-, with little movement and much inertia.Development initiatives will have to start here much earlier to “pick the people up where theystand”. One the other hand, could expect that it is easier to get people out of poverty in the moreagile environments of Mon, Bago and upwards.
978
1086
116
1340
1600
329
1413
684
187
69
386
1069
229
497
9709
846
340
290
710
301
66
646
494
72
11
336
1122
260
234
5884
1051
588
98
505
398
450
761
267
144
27
230
1306
265
703
6649
4478
4053
59
3128
5825
2620
2906
1890
1195
253
885
3101
980
5663
36540
Ayeyarwaddy
Bago
Chin
Kachin
Kayah
Kayin
Magwe
Mandalay
Mon
Sagaing
Shan
Rakhine
Tanintharyi
Yangon
Myanmar total
Escapes from poverty Chronic poor Entries into poverty Non-poor

Poverty in Myanmar 13
Figure 6: Poverty inertia by S/R
Reasons for poverty entry
The poverty dynamics report highlights some key reasons why people enter into poverty. These arepredominantly the effects of storms, floods and stagnant water, and the lack of, loss of, or inability towork. This is not surprising. But entrants into poverty are also much less likely than the chronicallypoor to be associated with agriculture and more likely to be associated with manufacturing,construction, trades/repairs and other - presumably because of a loss of markets or job.
Based on an analysis of 2007, the following table shows which groups of people are most vulnerableand therefore likely to enter into poverty.
Table 3: Vulnerable groups by S/R
Source: UNDP. Poverty, Food Insecurity and Vulnerability: Issues and strategies, based on UNDP (2007)
0.420.650.660.66
0.680.710.72
0.740.77
0.820.830.84
0.870.9
0.92
Chin
Shan
Tanintharyi
Mandalay
Rakhine
Ayeyarwaddy
Kachin
Myanmar total
Magwe
Mon
Bago
Yangon
Kayah
Sagaing
Kayin

Poverty in Myanmar 14
Hypothetical cost to eliminate poverty
The total cost to overcome poverty would be annually 850,682 million Kyat, or 2.3% of GDP.12 Thisneeds to be added to the resources Myanmar is already investing into support for the poor.International experience shows however that perfect targeting of the poor exclusively is almostimpossible. The actual resources needed to overcome poverty through direct cash transfer wouldtherefore be significantly higher, potentially double.
Figure 7: Annual cost to overcome poverty through cash transfers (million Kyat)
Eradication of food poverty only would cost Myanmar 86,372 million Kyat, that is, one tenth of theabove poverty budget.
Figure 8: Annual cost to overcome food poverty only through cash transfers
12 Myanmar’s GDP was in 2010 36,436.34 billion Kyat (Source: http://www.economywatch.com/economic-statistics/Myanmar/GDP_Current_Prices_National_Currency/)
Ayeyarwaddy ,137273 Bago, 50686
Chin, 33271
Kachin, 100646
Kayah, 42526Kayin, 26329
Magwe,79582
Mandalay,54930
Mon, 14375
Rakhine, 169165
Sagaing, 2765Shan, 35717
Tanintharyi,41615
Yangon, 61802
Ayeyarwaddy ,16685 Bago, 1921
Chin, 5447
Kachin,7629
Kayah, 3298Kayin, 1153
Magwe, 6995Mandalay, 5929Mon, 1471
Rakhine, 18202
Sagaing, 154Shan, 4772
Tanintharyi,6740
Yangon, 5933

Poverty in Myanmar 15
From purely financial perspective, these charts set the benchmark for planning poverty reductionprojects. Projects that cost more than the indicated amount per year should not enjoy priority. Inother words, Chin, though being the poorest state , should only receive a maximal allocation of33,271 million Kyat per year, as this would be the direct cost of cash transfer to bring all people tothe poverty line (assuming perfect targeting). Costly infrastructure or similar projects might createmore overall benefit in other states. Effective measures to get people out of poverty do likely differbetween regions.
Income and poverty
Employment
Labour force
In absolute terms, poor households offer more labour than non-poor, whereas the average of urbanand rural households is almost the same. But in terms relative to household size, poor households doactually offer slightly less labour (0.65 labour force per household member versus 0.67 for non-poor).The employment rate is high, and the female labour force participation rate is among the highest inthe region (0.91).13
Work appears to be rather equally distributed over the months of the year, with a total average of45,281 out of 95,021 surveyed people who worked every month, which would be equivalent to anaverage employment rate of 46.7%, and a maximum in October (48.5%) and a minimum in April(46.4%). The seasonal variations thus do not seem to be strong. These data are however lower thanwhat national statistics as well as the IHLCA itself stated (Table A33, A34, A35).
Underemployment gap
Underemployment is a serious problem in Myanmar. Underemployment is defined as working lessthan 44 hours per week. But how does this reflect on the situation of the household? As within theeconomy as a whole, there might be some members within a household that are actually workingmore than 44 hours (in other words, they are “over-employed”), and others who work less.Aggregating such individual potential over- and underemployment across the household members athousehold level and dividing by the household’s labour force yields the average householdunderemployment gap per household member. The histogram shows that this is distributed like anormal curve with the peak at full employment throughout the Myanmar economy.
13 Source: International Labour Organization. Key Indicators of the Labor Market (accessed 22 March 2012).

Poverty in Myanmar 16
Figure 13: Underemployment gap
The whole economy generates more work than the available labour force can provide based on a44 hour work week: projecting the survey results to the whole economy of 59.13 million people, theMyanmar people do work almost 60 million hours (precisely 58,864,343 hours) too much (or 1 hourper person)14. Expressed differently, the economy could provide 1.34 million additional full timejobs, if work could be distributed equally. The problem of underemployment is hence not one ofinsufficient labour demand, but of an unfavourable labour distribution.
As can be expected, the underemployment at household level is negatively correlated withhousehold expenditure, though less than one might expect (only -0.11**). Yet, the averageunderemployment gap per household is only slightly lower for poor households than for non-poor. Infact: both are “over-employed”, the poor household with 4.3 hours weekly (median: 6.0 hours), andthe non-poor with 5.6 hours (median: 8.0 hours).
It can be concluded from this that it is not underemployment which leads to poverty, but the lowreturn of employment received by poor (versus non-poor). In case of employed people, the lowreturn is a result of low wages. In fact, since 2005, real wages have barely grown. In case of self-employed, it is likely a result of low productivity. Further, as the labour supply curve bents below acertain minimal income (the household offers more labour the lower the return, to make both endsmeet), one can assume that poor people would offer more labour to make both ends meet, if morepaid labour was available.
14 The household survey collected data on 95,021 people, or 0.1607% of the population.
-100,00 -50,00 0,00 50,00
Average Underemployment Gap HH
0
500
1000
1500
2000
Cou
nt

Poverty in Myanmar 17
Figure 14: Growth rate of real wages
Source: ADB. 2012. Myanmar in transition: Opportunities and challenges
Growth creates employment. The wage employment elasticity of growth in developing Asia between2001 and 2011 has been 0.57, i.e., for each percent of growth, employment grew by 0.57%. Itreaches from 0.23 in Sri Lanka to 0.82 in Viet Nam.15
Between 2005 and 2010, the average household has reduced its workhours by over 7 hours, andthe median about 4 hours per week. This appears substantial, especially considering thatsimultaneously, the household managed to reduce the poverty gap. This could indicate that acomparatively high productivity (and wage) increase took place.
The differences in the underemployment gap of female and male headed households is small. Yet,female headed households offer more labour per household member than male headed. And urbanhouseholds do provide more work hours than rural, again indicating rather a lack of opportunity inrural areas.
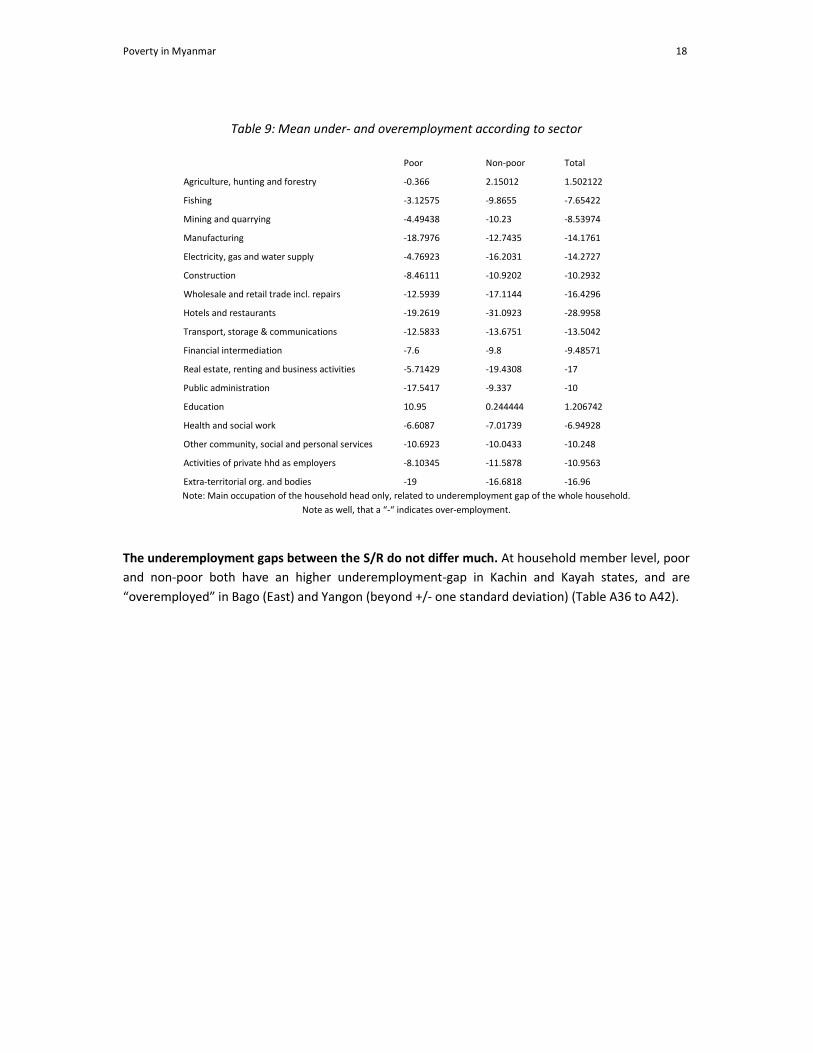
Poor and non-poor work least in the agricultural sector, and most in hotels and restaurants. Thedistribution of the sectoral work loads can be regarded as roughly typical.
15 Asian Development Outlook 2012
Poverty in Myanmar 18
Table 9: Mean under- and overemployment according to sector
Poor Non-poor Total
Agriculture, hunting and forestry -0.366 2.15012 1.502122
Fishing -3.12575 -9.8655 -7.65422
Mining and quarrying -4.49438 -10.23 -8.53974
Manufacturing -18.7976 -12.7435 -14.1761
Electricity, gas and water supply -4.76923 -16.2031 -14.2727
Construction -8.46111 -10.9202 -10.2932
Wholesale and retail trade incl. repairs -12.5939 -17.1144 -16.4296
Hotels and restaurants -19.2619 -31.0923 -28.9958
Transport, storage & communications -12.5833 -13.6751 -13.5042
Financial intermediation -7.6 -9.8 -9.48571
Real estate, renting and business activities -5.71429 -19.4308 -17
Public administration -17.5417 -9.337 -10
Education 10.95 0.244444 1.206742
Health and social work -6.6087 -7.01739 -6.94928
Other community, social and personal services -10.6923 -10.0433 -10.248
Activities of private hhd as employers -8.10345 -11.5878 -10.9563
Extra-territorial org. and bodies -19 -16.6818 -16.96Note: Main occupation of the household head only, related to underemployment gap of the whole household.
Note as well, that a “-“ indicates over-employment.
The underemployment gaps between the S/R do not differ much. At household member level, poorand non-poor both have an higher underemployment-gap in Kachin and Kayah states, and are“overemployed” in Bago (East) and Yangon (beyond +/- one standard deviation) (Table A36 to A42).

Poverty in Myanmar 19
Table 10: Average household underemployment gap per household member and S/R
poor non-poor Total
Median Mean Median Mean Median Mean
Kachin (+) 3.78 (+) 3.77 (+) 1.33 (+) 1.81 (+) 2.00 (+) 2.44
Kayah (+) 2.50 (+) 4.64 (+) 3.27 (++) 4.17 (+) 3.20 (+) 4.21
Kayin 0.45 -0.51 0.67 -0.09 0.67 -0.14
Chin -1.17 -0.41 -3.00 -2.41 -2.00 -1.17
Sagaing 1.63 1.67 0.93 0.23 1.00 0.43
Taninthayi -3.33 -1.80 -3.56 -2.28 -3.33 -2.15
Bago (East) (- -) -8.00 (-) -5.85 (-) -6.00 (-) -4.10 (-) -6.00 (-) -4.40
Bago (West) 1.50 1.96 (+) 1.33 0.82 (+) 1.33 0.97
Magway 1.00 1.66 1.00 1.10 1.00 1.24
Mandalay (-) -5.00 (-) -4.68 -4.00 -3.64 -4.00 (-) -3.88
Mon -4.40 -2.86 -2.00 -1.54 -2.40 -1.72
Rakhine -0.14 0.89 1.00 0.97 0.67 0.94
Yangon (-) -5.25 (-) -4.92 (-) -4.75 (-) -5.83 (-) -4.82 (-) -5.70
Shan (South) -1.33 -0.79 -2.67 -1.13 -2.62 -1.07
Shan (North) 1.33 1.29 -4.00 -3.52 -2.00 -1.92
Shan (East) -2.00 -0.50 -2.50 -1.27 -2.40 -1.00
Ayeyarwady -3.00 -1.49 -4.00 -2.60 -4.00 -2.28
Total -1.26 -0.47 -1.58 -1.14 -1.39 -0.89
Stdev 3.21 2.95 2.74 2.51 2.68 2.51
Migration
Based on survey figures there were about one million migrants in 2010.16 This does possibly excludethe emigrants – those who settled abroad or in other regions without an intention of return. Thisfigure is highly likely on the very low side: alone in Thailand there were about 1.45 million migrantworkers officially registered in 2012. As unofficial migration is likely to be significantly higher thanofficial migration, the apparent discrepancy is large.
But only 6.3% of the households have migrant workers, with poor households being about 30% morelikely to have migrant workers than non-poor households. But there are strong variations betweenthe S/R: Chin, Taninthayi and Kayin do, for example, have up to five times more migrant sendinghouseholds as the national average. As well, they would send by far the most migrant workers outper household.
Remittances are very important for those households who receive them: at Union level,remittances make up about 57% of overall household expenditures (or 1.1 million Kyat per year),with 75% for rural and 45% for urban households. But at Union level, the importance of remittancesdoes not appear very high, as it is only 3.4%. Based on these figures, the whole country would havereceived about US$ 80 million in 2010, lower than the World Bank’s estimate of US$ 133 million,which itself was however assumed to be a very low estimate.
16 All information based on UNDP. 2013. Role of remittances in economic wellbeing and poverty. Note that these results must be treatedwith much care: the survey is unlikely to be really representative, and the data base for such analysis appeared to be very small.

Poverty in Myanmar 20
Overall, remittance receiving households have 6% higher consumption expenditures as thosewithout, ranging among the S/R from 14% less (Taninthayi) to 30% more (Mandalay). Amongremittance receiving households, remittance income increases (not uniformly) from about 500,000Kyat annually for the poorest decile, to 1.6 million Kyat for the richest – over the whole populationthis translates into 20,000 Kyat to 110,000 Kyat.
But throughout the Union, food poverty, general poverty, and the poverty gap is higher forremittance receiving households than for non-receiving. If correct, this would indicate that especiallythe poorest of the poor send workers out for migration, confirming the poverty alleviation functionof migration and remittances. These poorest, however, are likely to be very low skilled, and only ableto afford migration to the least favourable areas, thus being able to send only marginal amounts backhome.
There appear to be very strong variations between the S/R. Though Chin, Taninthayi and Kayinappear to receive per migrant worker less remittances –pointing to potentially lower skills- theyreceive in average per household over the whole S/R the by far highest amounts: about three timesthe national average for Kayin and Chin, but also for Mon, and about two times the average forTaninthayi. In Chin, the poorest state of all, this average amount (of over 186,000 Kyat) is about 12%of the overall household consumption expenditures, and 40% of the total expenditures of remittancereceiving households (Table A43).
Main occupation
Over 50% of the households are engaged in agriculture as their main business. Wholesale, retailtrade and repairs is the second largest business with over 15%. All other sectors can be considered assmall to irrelevant. Across the major businesses, poor and non-poor are almost equally distributed.As can be expected, poor are slightly more active in low-skilled jobs such as agriculture, fishingmining, and construction, while non-poor are more present in more skill intensive jobs such as hotelsand restaurants and transportation.
One sector deserves special attention: wholesale, retail and trade, which is significant in size andwhere poor are much less represented as could be expected. The reason can be found in the spatialdistribution of the expenditure quintiles: the lower the income quintile, the higher is the likelihood tolive in a rural area. But retail businesses require a certain market volume to become profitable. Thismarket volume is much likelier in urban areas, despite the higher competition. It can be observedthat in the first three quintiles the shares are relatively equal, but that they remain constant in ruralareas, and ‘take off’ in urban areas. One might be able to conclude that the chances to grow with aretail business are much higher in urban areas. Though in total less people live in urban areas, thereare more retail businesses (almost 60%).
Given the above argument of the limited market size in rural areas, interventions that support retailor service business creation in rural areas might cement rather than reduce poverty, and willcertainly reduce the profit margins of all other businesses active in the same sector and village.
Other community, social and personal services seem to be even more a business of the poor, andone which does not provide strong income generation and growth potential even in urban areas: thepercentile distribution in urban areas is rather equal, while in rural areas the business ispredominantly focused on the poorer section of the population.

Poverty in Myanmar 21
Table 11: Trade or business as main job of first household member
Poor Non-poor Total
Agriculture, hunting and forestry 57,3% 49,1% 51,0%
Fishing 4,1% 2,5% 2,9%
Mining and quarrying 2,2% 1,6% 1,7%
Manufacturing 4,1% 4,0% 4,0%
Electricity, gas and water supply ,3% ,5% ,4%
Construction 4,5% 3,9% 4,0%
Wholesale and retail trade incl. repairs 10,6% 17,5% 15,9%
Hotels and restaurants 1,0% 1,4% 1,3%
Transport, storage & communications 3,3% 5,2% 4,8%
Financial intermediation ,1% ,2% ,2%
Real estate, renting and business activities ,3% ,5% ,5%
Public administration ,6% 2,0% 1,7%
Education 1,0% 3,0% 2,5%
Health and social work ,6% ,9% ,8%Other community, social and personalservices 8,6% 5,6% 6,3%
Activities of private hhd as employers 1,4% 2,0% 1,8%
Extra-territorial org. and bodies ,1% ,2% ,1%
100,0% 100,0% 100,0%
Men are much more likely to be engaged in agriculture or fishing; women are more likely to beengaged in trade, education, other services and, interestingly, manufacturing. But split for businessesran by poor households, many of the differences disappear: the only remaining are that also poorwomen-headed households are more substantially likely to be engaged in manufacturing and trade.
Checking for differences in expenditure quintiles of men and women in manufacturing businessesshows that there are none: the percentages are quite equally distributed among all. But includingspatial distribution as explanatory variable shows, again, that urban businesses do better.
There are some smaller concentrations of business sectors across the S/R. Below table marks thoseimportant sectors which are above or below one standard deviation. It shows that, e.g., Chin statehas some over-reliance on agriculture, despite its unfavourable climate, but has too less transportrelated businesses, despite its urgent need. Bago (East), where the future airport shall beconstructed, has very little construction skills available. Mandalay and, clearly, Kayah (because ofbiased selection) and Yangon are the potential manufacturing power houses. And Ayeyarwady has astronger reliance on services, which have, as seen, lesser potential for advancement to higherquintiles.

Poverty in Myanmar 22
Table 12: Sectoral concentrations across S/R
Agriculture,hunting andforestry
Manufac-turing
Construc-tion
Wholesaleand retailtrade incl.repairs
Transport,storage &communi-cations
Othercommunity,social andpersonalservices
Kachin 54.31 1.76 2.99 12.48 (-) 1.93 6.68
Kayah 49.34 (+) 6.58 (+) 7.24 15.79 (+) 9.21 (-) 2.63
Kayin 51.60 1.74 4.36 16.72 (+) 7.56 7.85
Chin (+) 66.23 3.90 2.60 (-) 9.74 (-) 0.97 5.52
Sagaing 59.75 3.16 3.82 12.19 2.79 3.63
Taninthayi (-) 36.40 2.49 5.12 15.79 4.39 6.29
Bago (East) 53.71 5.43 (-) 2.10 16.94 5.43 4.10
Bago (West) 64.00 2.58 3.32 15.11 2.83 (-) 2.21
Magway 60.67 2.26 2.85 11.71 3.68 4.69
Mandalay 43.70 (+) 8.34 5.00 17.10 5.38 7.23
Mon 45.21 3.72 (+) 7.05 19.95 5.05 5.98
Rakhine 41.06 1.81 2.47 16.98 5.11 (+) 13.52
Yangon (-) 17.65 (+) 8.78 (+) 6.78 (+) 31.48 (+) 11.39 6.87
Shan (South) 64.01 2.99 3.81 11.61 2.82 4.48
Shan (North) (+) 64.92 2.40 4.92 11.80 5.25 (-) 2.84
Shan (East) 73.14 (-) 1.73 3.29 11.61 2.77 (-) 2.08
Ayeyarwady 48.68 3.15 2.96 16.63 4.54 (+) 10.14
Total 50.97 4.03 4.01 15.90 4.77 6.29
StDev 13.50413 2.253918 1.632549 4.97854 2.644386 2.987998
Own account workers
Overall, 22% of the household members –or one person per household- work on own account(median: 16.7%). But 42.4% of the households are without any own account worker. Should each ofthe own account workers effectively run a different business and register it, Myanmar’s businessdensity rate would be 220 (220 businesses per 1000 population), which is about sevenfold the worldaverage of around 30. This average takes however only registered businesses into account, and theglobal informal sector can be assumed to be at least double the formal sector in terms of numbers(i.e., a hypothetical density rate of about 90 to 100). Still, Myanmar’s business sector appears to beat least twice the global average. One can conclude that the vast majority of Myanmar’s businessesare so called ‘necessity businesses’, which is a clear sign of poverty and lack of opportunity.
The percentage of household members working on own account is not correlated with thehousehold expenses. In fact, in the poorest expenditure quintile the share of own account workers islower than in the other quintiles. The share of own account workers in rural areas is higher than inurban areas, showing also that employment is more difficult to obtain in rural areas.
Men and women headed households have on average similar shares of own-account workers, butthe median for male headed is about 17%, it is 0% for female headed households. This shows aslightly more two poled distribution of own-account workers among female headed households than

Poverty in Myanmar 23
among male: over 50% (50.8%) do not have any own-account workers in the household (versus40.3% for male), and those who have, have a high share (Table A44 to A56).
Especially the Shan and the Chinese speaking stand out as having a high percentage of own-accountworkers.
Table 13: Own account workers as % of households by language spoken
Mother tongue Mean Median NKachin ,22446 ,14286 247Kayah ,28576 (+) ,25000 83Kayin ,22745 ,16667 569Chin ,25833 (+) ,25000 447Mon ,22281 ,20000 411Myanmar ,20627 ,14286 13229Rakine ,19571 ,14286 755Shan (+) ,33747 (+) ,25000 1336
Other indigenous language (+) ,31594 (+) ,25000 850Chinese (+) ,35442 (+) ,33333 151Arabic ,20051 ,20000 19
Hindi/other Indian language ,19759 ,16667 140Other foreign language (-) ,07860 (-) ,00000 372Total ,22171 ,16667 18609Standard deviation(unweighted)
,073 ,081
Agriculture
Land ownership
About 45% of the people own land, with an average acreage of 6.25 and a median of 4. Thoughthere are ten times more rural than urban based land owners, the rural population also makes up70% of the total population, thus, effectively leading to 14% of the urban and 59% of the ruralpopulation being landowners. It is interesting to note that the average landholding does not differmuch between urban and rural populations.
Chin has the smallest average and median rural land holding (2.1 and 2.0 acre, respectively), beingabout 34% and 50% of the overall mean and median. This is followed by Shan (East), and, in terms ofmedian only, Rakhine, Kachin, Kayin, and Shan (South). All others have at least 4 acres mean/medianlandholding.

Poverty in Myanmar 24
Table 14: Landownership and landlessness by S/R
Landowners
Mean Median Landless % Spatial %
Kachin URBAN 4.76 3.00 0.57 0.17
RURAL 5.44 3.00 0.29 0.83
Kayah URBAN 5.36 4.25 0.75 0.12
RURAL 5.31 4.00 0.19 0.88
Kayin URBAN 12.02 2.85 0.83 0.09
RURAL 4.83 3.50 0.39 0.91
Chin URBAN 2.22 1.50 0.63 0.14
RURAL 2.10 2.00 0.05 0.86
Sagaing URBAN 6.71 5.00 0.83 0.08
RURAL 7.76 6.00 0.31 0.92
Taninthayi URBAN 9.88 6.00 0.69 0.19
RURAL 7.68 5.00 0.56 0.81
Bago (East) URBAN 8.04 6.25 0.92 0.06
RURAL 9.22 6.00 0.56 0.94
Bago (West) URBAN 6.59 5.50 0.83 0.10
RURAL 6.21 4.00 0.49 0.90
Magway URBAN 5.25 3.00 0.85 0.07
RURAL 5.19 4.00 0.35 0.93
Mandalay URBAN 4.18 3.00 0.95 0.06
RURAL 5.64 4.00 0.50 0.94
Mon URBAN 10.43 7.00 0.79 0.12
RURAL 9.49 6.10 0.51 0.88
Rakhine URBAN 5.43 1.50 0.88 0.08
RURAL 4.26 3.00 0.52 0.92
Yangon URBAN 17.78 10.00 0.99 0.06
RURAL 8.65 7.00 0.65 0.94
Shan (South) URBAN 2.90 2.00 0.84 0.07
RURAL 4.34 3.50 0.20 0.93
Shan (North) URBAN 3.50 2.00 0.74 0.10
RURAL 4.82 4.00 0.14 0.90
Shan (East) URBAN 2.73 2.00 0.58 0.15
RURAL 3.34 2.20 0.13 0.85
Ayeyarwady URBAN 15.19 8.00 0.90 0.07
RURAL 9.10 6.00 0.55 0.93
TOTAL URBAN 6.66 3.30 0.86 0.09
RURAL 6.21 4.00 0.41 0.91
TOTAL 6.25 4.00 0.55 0.52
As expected, the size of the landholding is positively correlated with the household expenditures.Male headed households have about 50% larger landholdings as female headed (mean and median).

Poverty in Myanmar 25
All households of the survey sample together own 52,747 acre. Extrapolated to whole of Myanmarthis would be equivalent to 32.892 million acre17 or 13.1 million hectare under private ownership.
30% of the poor are reported to have land holdings of 5 acre or larger. In fact, there are householdswith up to 60 acre of land that do still fall under the category “poor”. In comparison, the LIFTbaseline study18 found that 1.3% of households with landholdings of 5 acre and above reported amonthly average income of below 25,000 Kyat (or 80% of the poverty line), and 7.8% below 50,000Kyat. Poverty despite such larger landholdings might be a sign of either infertile land, or no resourcesto cultivate the land. 240 poor households have 3 acre which is also the median landownership. Themodal value of poor is 2 acre (289 households).
A landholding of 3 acre might be seen as indicator to be the minimal landholding required to be ableto break out of poverty, based on agriculture alone. The table shows that agriculture as main sourceof income increases from the landholding category “>0 to 1” to “>3 to 4” acre, and hovers thereafteraround 90% (with the last two size groups as exceptions, probably induced by the low sample size). Itthus appears to be that a farm of above 3 acre might roughly generate sufficient work and income tobe seen as the major job. On the other hand, the average land holding of poor agriculturalhouseholds is 4.4 acre, while that of non-poor is 7.3 acre, indicating that probably at least 5 acre arerequired to break out of poverty (Table A57 to A60).
Table 15: Landholding, poverty and farming
Poor in generalPoor with agriculture as mainincome
Poor farmersas % of poor
Landholding FrequencyCumulativePercent Frequency
CumulativePercent
>0-1 324 17.36334 244 15.83387 75.3%
>1 to 2 420 39.87138 322 36.7294 76.7%
>2 to 3 332 57.66345 276 54.63984 83.1%
>3 to 4 216 69.23901 190 66.9695 88.0%
>4 to 5 193 79.58199 168 77.87151 87.0%
>5 to 6 91 84.45874 82 83.19273 90.1%
>6 to 7 70 88.21008 65 87.41077 92.9%
>7 to 8 44 90.56806 37 89.81181 84.1%
>8 to 9 31 92.22937 28 91.62881 90.3%
>9 to 10 50 94.9089 43 94.41921 86.0%
>10 to 15 61 98.17792 57 98.11811 93.4%
>15 to 20 23 99.4105 21 99.48086 91.3%
>20 to 30 9 99.89282 6 99.87021 66.7%
>30 to 60 2 100 2 100 100.0%
17 52,747 / 0.1607%18 LIFT Baseline Survey Report 2012

Poverty in Myanmar 26
Mechanization
Only 2.1% (133) of the surveyed households were mechanised (ownership or co-ownership oftractors), and thereof only 9 poor households.19 Mechanisation of the farm is positively correlatedwith household expenditure, though with a surprisingly low coefficient of 0.108** (Table A61 toA63).
Most significant problem
Drought, followed by pests and floods are seen by the respondents as the most significantproblems. The multiple-choice answers provided by the survey are partially overlapping: irrigation is,e.g., the principal answer to droughts, and low crop yields are the consequence of a variety ofproblems.
It is intriguing that ‘access to credit’ and ‘access to markets’, commonly identified as a majorproblems for farmers, have only been mentioned by 1.3% and 0.4%, respectively, of those whostated that they have a problem (all minus ‘none’). Similarly, lack of labour has only been stated by1.1%, although it was frequently mentioned in discussions.
The diversity of problems as faced by poor farmers is large: in some S/R, like Kachin, Bago, Mon,Rakhine, Yangon and Shan (East), and to a lesser degree also in Shan (North and East) and Taninthayi,one can identify a rather diverse structure of comparatively evenly identified major problems. Thishints towards problems rather at the individual farm, instead of structural problems affecting thewhole S/R. On the other hand there are S/R with very clearly identified major problems: in Chin‘vermin/insects infection’ (41% of the total respondents), Sagaing, Magway, Mandalay and Shan(South) and to a lesser degree Kayah ‘drought’ (35%, 61%, 64%, 39% and 15%). Dual peaks occur inAyeyarwady with ‘floods’ (11%) and ‘vermin/insects infection’ (13%), and Kayin with ‘low selling priceof crops’ (15%) and ‘vermin/insects infection’ (14%) (Table A64).
19 A closer look at land ownership versus mechanisation shows however that the reply to the corresponding questions is likely to be veryincomplete: most larger land holdings would not own or co-own a tractor; between 30 acres and 400 acres only one out of 93 households,and between 10 acres and 30 only 24 (out of 1145).

Poverty in Myanmar 27
Table 16: Most significant problem for farmers (poor only)
Kach
in
Kaya
h
Kayi
n
Chin
Saga
ing
Tani
ntha
yi
Bago
(Eas
t)
Bago
(Wes
t)
Mag
way
Man
dala
y
Mon
Rakh
ine
Yang
on
Shan
(Sou
th)
Shan
(Nor
th)
Shan
(Eas
t)
Ayey
arw
ady
Flood/ veryheavy rain 7 0 20 7 54 25 19 17 39 17 6 20 4 9 24 13 86
Drought 14 15 5 15 404 2 9 9 511 626 3 18 2 147 22 5 15Cropdiseases 4 4 2 11 17 4 3 11 13 7 12 5 3 2 1 11 18Quality ofland 5 1 7 15 3 8 7 3 8 4 6 11 0 5 10 21 10Access toland 6 0 8 4 10 0 4 1 0 10 1 3 0 0 0 3 4Access toagriculturalcredit 9 2 5 0 2 0 2 0 3 3 2 5 3 0 0 0 13Lack oflabour 6 0 1 11 3 1 2 2 3 3 1 1 0 1 0 1 4Access tomarket 0 0 3 0 4 0 0 0 2 1 1 1 0 0 0 3 0Prices ofinputs 4 2 0 0 2 1 17 1 3 4 2 0 3 0 2 1 5Low sellingprice ofcrops 1 2 50 0 3 1 9 14 6 2 1 1 0 2 4 1 18High cost ofhired labour 5 0 1 2 5 0 1 0 5 0 2 4 0 0 0 9 4High cost ofrentingequipment 0 1 0 0 0 0 0 0 0 0 0 0 1 0 0 1 2High cost ofrentingdraftanimals 8 0 3 0 5 0 1 0 2 0 1 8 1 2 2 0 1Vermin/insects infection 14 0 46 94 10 25 6 3 44 9 13 16 3 3 54 6 95Low cropyields 8 1 17 9 18 3 12 6 6 8 8 17 5 16 45 20 23Lack ofirrigation 12 0 4 3 16 1 6 1 10 19 1 3 1 0 3 8 4Advancedpayment 0 0 1 0 0 0 2 0 0 1 0 1 1 0 1 0 1Access toequipment/machinery 0 0 3 0 0 0 1 0 0 2 1 1 1 0 0 1 4
Other 12 5 2 0 8 2 2 1 2 6 2 3 2 2 4 0 4
None 276 64 162 61 587 197 216 280 184 254 231 288109 190 460 360 440
Crop losses
Myanmar loses on average annually almost 8% of its harvest due to natural calamities (storm,flood, drought, pests). Considering that agriculture’s net-output in 2010/11 was, according to theCSO, 6,288 billion Kyat (excluding fisheries), an effective protection could in other words increase thevalue by about 532 billion Kyat, or over 60% of the total funds required to lift all Myanmar people outof poverty.

Poverty in Myanmar 28
Floods, droughts and pests – conditions against which modern agriculture can be protectedcomparatively efficiently, are also the worst calamities. S/Rs particularly strongly affected by floodare Ayeyarwady, by drought Sagaing, Magway and Mandalay, and by pests Chin (and also somewhatKayah, Kayin and Ayeyarwady). Overall, the S/R worst affected by calamities are Magway, Mandalay,Ayeyarwady and Sagaing, each losing annually around 10% or more due to calamities.
Storms, floods and stagnant waters are also closely associated with entries into poverty, though highstandard errors urge caution in the interpretation of these comparisons (Table A65).
Table 17: Average annual losses in %
Storm Flood Drought Pests Total
Kachin 0.16 1.49 0.75 0.77 3.17
Kayah 0.12 0.51 2.68 3.60 6.91
Kayin 0.31 1.67 0.50 3.65 6.13
Chin 0.23 0.33 0.91 4.29 5.76
Sagaing 0.02 1.78 5.58 1.71 9.08
Taninthayi 0.17 2.33 0.04 1.09 3.63
Bago (East) 0.07 0.99 0.28 0.73 2.07
Bago (West) 0.22 2.02 0.25 0.50 2.99
Magway 0.18 2.27 10.74 2.83 16.01
Mandalay 0.00 1.17 12.00 2.13 15.31
Mon 0.67 1.08 0.21 1.37 3.34
Rakhine 1.07 1.84 0.91 1.75 5.57
Yangon 0.60 2.58 0.33 1.24 4.74
Shan (South) 0.14 0.51 2.46 0.50 3.61
Shan (North) 0.02 0.35 0.56 1.69 2.61
Shan (East) 0.05 0.41 0.12 0.47 1.05
Ayeyarwady 3.75 4.17 0.10 3.40 11.42
Average 0.52 1.60 3.76 1.91 7.82

Poverty in Myanmar 29
Conclusion: poverty in Myanmar
As there are many reasons for poverty, so does Myanmar have many options to lift people out ofpoverty. As the poor are less productive, and their existing productive capacity is also used to a lowerextent, poverty hampers the current and especially long term productive potential of the country. Itis therefore not only in the humanitarian but also economic interest to reduce poverty.
According to the national poverty line, Myanmar reduced its overall poverty, its food poverty, and itspoverty gap, but the real improvements since 2005 in terms of purchase power were rather small.There are also indications that the uniform national poverty line is grossly misrepresenting thesituation at S/R level: in 12 out of the 17 observed regions, the actual poverty rate might partiallysignificantly be higher.
50,000 Kyat per year are needed to lift one (median) poor out of poverty. This can be achievedthrough reducing the cost of goods and services the poor require or through increasing that person’sincome by that amount. Compared with India’s 100-day programme for the poor, Myanmar wouldonly require in average about 30 paid days per poor.
Assuming perfect allocation and no transaction cost, it would annually cost Myanmar 850 billion Kyatin cash transfers, or 2.3% of GDP, to lift all people out of poverty, and about a tenth of this to avoidfood poverty. The budget allocation for the individual S/R can serve as benchmark for the assessmentof poverty relevant projects.
Notably apart from Chin State, poverty inertia is mostly low. This means that there is usually acomparatively high churn, and a comparatively low chronic poverty. Measures that reduce thechance of people entering into poverty (usually the more cost-effective way) would therefore have ahigher development impact as directly addressing the poor. From cost efficiency perspective, thefocus should therefore be more on the vulnerable than the poor, which would automatically reducethe poverty rate as well.
Myanmar’s poverty is larger, but shallow, with the median income only 25% above the poverty line.Small improvements can thus bring a large number of people out of poverty, but already smallshocks can also bring an even larger number of people into poverty. Because Myanmar is exposed tomany natural –but in principle preventable- calamities, costing annually 8% of agricultural output, itneeds to invest into mitigation and adaptation strategies. And because the country’s economicdevelopment depends strongly on natural resources with volatile prices, it needs to diversify itsproduction and export base.
Myanmar’s inequality is extremely low. GDP increases in countries with low income (or consumption)inequality have high impact on poverty reduction. But GDP growth is also likely to temporarilyincrease Myanmar’s inequality. As Myanmar starts from a low inequality level, its concern should befocused on GDP growth, while trying to keep inequality growth in limits.
The problem of Myanmar’s labour market is neither unemployment, nor underemployment. Rather,the work is not equally distributed and paid for. In fact, as a whole the Myanmar people do workweekly 60 million hours too much, i.e., if the workload would be perfectly distributed, Myanmarcould provide jobs for additional 1.34 million people.

Poverty in Myanmar 30
Most poor are therefore working poor, indicating too low return on their work, i.e., too lowproductivity. To reduce poverty it is therefore dominantly important to increase the productivity ofwork –or the wages, should they be below the marginal productivity- instead of creating more jobs.Retail, community service and similar businesses predictably yield a very low return on investment inrural areas. Their establishment should not be further promoted in these areas.
The median poor household spends about 24% of its total consumption on rice; the average for theUnion is almost 20%. Given the low ratio of median income to poverty line, a price increase ordecrease of rice by only 10% can therefore bring 150,000 people into poverty, or lift them out ofpoverty. Productivity increase in rice production, handling and transport, or reasonably pricedimports, are therefore very relevant.
The median poor consumes daily 365g of rice; the overall average is 445g. As the MOAI estimate is11% higher than this result, it might be that the rice sufficiency is actually higher than usuallyestimated.
With a very high likelihood, a land holding below 3 acre appears to be bring or keep an agriculturalhousehold in poverty. 3 acre need to be seen as the minimal threshold, and about 5 acre as a safelikelihood to provide a chance to escape from poverty. These values do only represent Unionaverages.
Those who request a credit, get it. Poor and non-poor have a similar structure of credit sources andcollaterals, but poor, and especially food poor, take up loans mostly for consumptive purposes, whilenon-poor do so for investive purposes. Over 40% of the households –and almost 50% of the poor- areindebted, with an overall average of 200,000 Kyat, and for a median the poor of almost 50,000 Kyat.Depending upon the interest rate paid -20% per month, quarter or half year- up to the half povertygap of the poor household. In other words, if poor did not need to take up credit, Myanmar’s povertyrate would be halved.
Connection to the public grid does apparently not lead directly to a reduction in energy expenditures,but seems to increase income generation by about 10,000 Kyat per person and year. In other words,full public grid connection could lift 20% of the poor out of poverty, without calculating for multipliereffects. Local transport is a significant expense for the median poor household, at about 70% of thevalue of a poverty gap. Obviously, transport expenses decrease with a higher road density.
For the median poor household, health care and education expenses are only a small expense. Butpoor spend significantly less than non-poor on education, which could cement, in the medium term,their low earning abilities and their poverty status. Education and health care expenses arecomparable across all S/R. But health care expenses show large variations at district level. As healthcare should be free, it might be advisable to look closer at those districts where health care cost aremuch above average.

Poverty in Myanmar 31
Second Part
Development potentials for the selected states and regions

Poverty in Myanmar 32
Development potentials for the selected states and regions
The development strategies for each S/R depend on the starting condition as well as the competitivepotentials. In the following, the starting position of all S/R will be visualised, and then potentialdevelopment strategies for each of the seven selected S/R briefly presented. In principle, thesepresentations are summaries of key points as described in separately drafted proposals for regionaldevelopment strategies,20 combined with the above results.
Technical note
Twelve key criteria have been selected to visualise each S/R from poverty perspective in a radarchart. Usually, the data do refer only to the poor part of the population (versus the total population),and reflect median values. All criteria have been transformed so that the national average takes thevalue five, and the highest values at national level represent more or less the 10, and the lowest thezero (so a relative structure). Higher values represent a better situation.
The indicators are grouped in three pillars: the first pillar describes the state and dynamics of poverty(and inequality) in the S/R and contains six indicators. The second pillar describes the cost structureof a poor household, comprising the three major expenditure categories. The last pillar describes theincome structure and potential of a poor household, and contains as well three categories.
First pillar: State and dynamics of poverty and inequality
Poverty rate
The poverty rate reflects the percentage of people living in poverty. A lower number is thereforebetter. Because the poverty rate and the food poverty rate are highly correlated, it was not requiredto visualise a separate food poverty rate.
Poverty decline
The poverty decline reflects the percentage change in the poverty rate between 2005 and 2010. Itshows how much the S/R succeeds in fighting poverty. More is better.
Poverty gap
The poverty gap shows how far away from the poverty line the median poor is. The lower thepoverty gap, the closer is the median poor to the poverty line, and hence, the more shallow is thepoverty.
PPI
The ‘Passche Price Index’ is here calculated as an average and provides an indicator for the actuallevel of prices in a S/R. The lower the prices, i.e., the higher the index, the more can a given poorafford for the same amount of money (given the same consumption basket).
Poverty inertia
20 See U San Thein, Dolly Kyaw, Khin pwint oo

Poverty in Myanmar 33
The poverty inertia shows the rate at which people enter into and escape from poverty. The higherthe rate, the more likely it is that vulnerable groups fall into poverty, but, from a policy perspective,the easier it is as well to reduce poverty by preventing vulnerable groups to fall into poverty in thefirst place. A higher value shows a lower inertia, and is hence better.
Inequality
The indicator used here for inequality is the ratio of the median normalised adult equivalentexpenditures of the poorest quintile as ration of the richest quintile. A higher value shows moreequality and is hence usually been seen as better.
Second pillar: Expenditures of a poor household
Food share
As food is an important part of the expenditures, a separate indicator has been assigned to themedian share of food expenditures of poor in relation to their total expenditures. A lower share isbetter.
Utilities share
Telephone, transport and energy make up a mentionable share of the expenditures of the poor. Thisindicator describes the median share for a poor household, with less being better. The indicator canserve as a rough measurement in how far governments succeed to improve the infrastructure which,hence reduces the respective cost.
Indebtedness
This indicator visualises the indebtedness of the average poor household. As it includes both,indebted and non-indebted households, and as in average only 40% of the households have a loan, amedian value would have resulted in a zero for various states. A lower level is better.
Third pillar: Income potential of a poor household
Underemployment gap
This is the median of the average household underemployment gap per household member, i.e., theaggregate of the over- and underemployment gaps of all household members belonging to thelabour force, divided by the household labour force, and limited to poor households. Usually, onewould assume that a lower gap, i.e., more actual working hours, is better. But as most poorhouseholds in Myanmar are already actually overemployed, a low gap, i.e., a higheroveremployment, actually reflects a very low return on labour (wages, profits), forcing poorhouseholds to offer more and more labour to make both ends meet. Therefore, the indicator isdesigned to show that underemployment is positive: if a poor households achieves a similar level ofexpenditure with less work time, its return on labour is higher. It further provides the state withbetter chances to create additional income through employment creation.
Land holding
A larger median land holding is better than a smaller one, as it provides chances for scale economiesand mechanisation.

Poverty in Myanmar 34
Losses from calamities
The final indicator shows the exposure of the S/R to calamities. It only reflects the situation of themedian poor. Lower values are better.
Ayeyarwady
21In relation to most other S/R, Ayeyarwady’s radar chart looks rather balanced. It performed well interms of poverty and reduction and inequality, and its larger landholdings provide space for somemechanisation and scale economies. Its major problem, however, are the calamities due to which theState loses on average 11.4% of the harvest. Given the specific geographic location and the presenceof the delta, it will be very costly to protect a substantial part of the agricultural land against floods -the flood prone area increased significantly in recent years. And it is almost impossible to protect thefields against storms. But alone by a sustained fight against pests, Ayeyarwady could reduce its lossesto 8% only. Flood and storm prone agricultural production should therefore slowly shift to thoseareas which are, or can be, protected. An encouragement of farming in the negatively affected areas,well-meant as it is, will only contribute to many bankruptcies and impoverishments of farminghouseholds. Would the State Government provide full crop insurance to affected farmers, thustaking the risk of farming on its own budget?
Ayeyarwady is often referred to as the rice bowl of the country, which again was once the rice bowlof Asia. But Myanmar’s revealed competitive advantage (RC) in rice is not large, and rather delicate.And while Ayeyarwady’s paddy yield per acre belongs to the highest in the country, it is notnecessarily the most productive. According to figures of the Settlement & Land Records Department(2012), Ayeyarwady has no, or rather negative, land available for development. This implies thatimprovements in agricultural output can only occur through productivity increases, and throughfurther land consolidation. Though the State has already achieved national average in terms ofmedian landholding, more could and would have to be done.
21 This chapter’s recommendations draw on the work of Dolly Kyaw
0
2
4
6
8
10Poverty rate
Poverty decline
Poverty gap
PPI
Poverty inertia
Inequality
Food share
Utilities share
Loans
Underemploymentgap
Land holding
Losses fromcalamities

Poverty in Myanmar 35
One of the strongest comparative advantages of the State is its proximity to Yangon and its exportinfrastructure. While other harbours are being constructed, it is the Yangon harbour which is likely tobe predominantly used as gateway between the Union and the rest of the world. It is hence obviousthat Ayeyarwady could exploit this proximity by focusing more on export quality rice. This wouldrequire a shift to high yielding varieties (HYV), and the intensified use of double cropping. Tofacilitate this shift, the Government might consider the establishment of seed farmers –together withthe private sector and the Myanmar Rice Federation- and arrangements with fertiliser and pesticideproviding companies to allow easy and comparatively moderately priced access to these inputs,together with embedded farm extension services. As the HYV are under the given situation both,more risky and less profitable for farmers (because of high credit cost), soft credit and insuranceswould need to be provided, at least in the initial phase.
Smaller farmers might switch to more profitable products such as black gram, soybean andvegetables. Aquaculture, again away from flood prone areas, would be an important additional assetfor the State. To exploit this to the fullest, fish processing and fish freezing plants would have to beestablished, into which the private sector could be attracted if the Government provides the requiredinfrastructure. Again, proximity to Yangon’s harbour is key. Such processing plants would nudge theindustry towards more complex production processes through the acquisition of the adequate skillsand experiences.
A prerequisite for all these developments is the establishment of a more reliable electricity supply,and improvements in infrastructure.
The shift share analysis has shown that Ayeyarwady over-proportionally attracted a number ofindustries, most of which are however rather small: Electricity, gas & water supply; construction;hotel and restaurant; transport, storage & communications; activities of private HH as employer orSMEs; and extra-territorial organizations & bodies. While the latter two are rather an indicator of acritical development path, likely due to Nargis, it is mentionable that with the construction, storageand hotel services, Ayeyarwady gained experiences in some of the areas which it needs for itsadvancement in the agro-industrial sector, and for tourism development.
Ayeyarwady does not have an internationally acknowledged major tourism site, but it provides aconvenient escape for Yangon residents and business traveller, the latter of which make up abouthalf of all Myanmar tourists. The road and tourism infrastructure should hence cater for this targetgroup.
Finally, the State could again use its proximity to Yangon to develop industries and industrial zones insufficient proximity to Myanmar’s economic powerhouse.
As benchmark, the Government of Ayeyarwady could invest about 140 billion Kyat annually toeliminate poverty.

Poverty in Myanmar 36
Bago
Bago
Bago (East)
0
2
4
6
8
10Poverty rate
Poverty decline
Poverty gap
PPI
Poverty inertia
Inequality
Food share
Utilities share
Loans
Underemploymentgap
Land holding
Losses fromcalamities
0
2
4
6
8
10Poverty rate
Poverty decline
Poverty gap
PPI
Poverty inertia
Inequality
Food share
Utilities share
Loans
Underemploymentgap
Land holding
Losses fromcalamities

Poverty in Myanmar 37
Bago (West)
22Bago’s radar chart, especially Bago (East), is very unbalanced. Overall, Bago has been anunderperformer in poverty reduction, though it has been better than average at poverty alleviation.Its comparatively high prices especially indicate inefficiently functioning local markets, onto whichthe Government would have to put emphasis. Given Bago’s proximity to Yangon, such discrepanciesshould not occur.
Better functioning markets require both, improved institutions (including the regulatory environmentand competition laws), and a higher density of businesses of reasonable size. If the governmentmanaged to improve this, it is also likely that employment would be created and poverty decreased:such business environment could exploit the high fluctuation of poverty in Bago, helping to reducethe entry into poverty by vulnerable people, and thus reducing overall poverty. Food and utilities arevery expensive, which is another sign of market imperfections.
The loan burden is surprisingly diverse: while poor households in the West are very little burdened byloans, households in the East appear to be highly indebted, perpetuating poverty. The payment ofunproductive interest rates will not allow the affected households to escape poverty. In social terms,this might lead to conflict. It is necessary to check the reasons for this high indebtedness beyond themeans of this household survey. Note that Microfinance programmes are neither active in the Eastnor in the West, so easier access to credit should not be the reason.
The sad picture for Bago (East) is confirmed by the high over-employment of the people (i.e., a lowranking): as it appears, wages and returns are so low that people need to work over-proportionallyhard to make a living. This means as well, that productivity increases are a must in Bago (East),and/or that local exploitative behaviour through low wages need to be addressed.
The high median landholding sizes and the low losses from calamities speak for some additionalefforts for agricultural development in the East: only 2% of production is lost annually, and the risksand the problems faced by farmers are rather diversified. As each farmer knows best the individual
22 This chapter’s recommendations draw on the work of Nick Maddock, U San Thein, Dolly Kyaw, and Khin pwint oo
0
2
4
6
8
10Poverty rate
Poverty decline
Poverty gap
PPI
Poverty inertia
Inequality
Food share
Utilities share
Loans
Underemploymentgap
Land holding
Losses fromcalamities

Poverty in Myanmar 38
problems, it is important to push for a clear implementation of the freedom to farm any product thefarmer decides on. A push for some mechanisation on the farms, especially in the East, is necessary,as labour might in the future become ever more scarce.
The reason for this scarcity is the construction of Hanthawaddy International Airport, which is likelyto absorb a large number of local labourers, but which will also attract migrants. Most local labourerscan be drawn the comparatively high rate of landless agricultural labourers in Bago.
But Bago (East) is likely to either need to attract many migrants, or to quickly educate numerousskills: currently, Bago has people employed in the construction sector far below national average.This, however, is not only needed for the airport construction but for the construction andmaintenance of all infrastructure associated with it. Parts of this infrastructure could be cool-houses.
Because of the proximity to the airport and the low risk of calamities, more delicate agricultural andaquacultural products such as vegetable and prawns could be produced and directly shipped. SoBago could maintain a leg in agriculture, while increasing its product space through airport relatedindustries and services (including, e.g., logistic and tourism services).
But, again, Bago does not have in any of these a competitive positioning: the shift share analysisshowed some competitiveness only in electricity, gas & water supply, and hotel & restaurants. AsBago is embarking on a serious structural change, the Government must anticipate these skill andresources requirements with the adequate means.
Areas of Bago closer to Yangon are likely to become part of the Yangon conurbation, with theprovision of well equipped industrial space. In this aspect it would be important to target from thefirst moment the creation of agglomeration advantages (clusters). The Industrial Zone in Pyay missedthis chance.
As benchmark, the Government of Bago could invest about 50 billion Kyat annually to eliminatepoverty.

Poverty in Myanmar 39
Chin
23Chin’s radar diagram is certainly the most unbalanced of all. As Chin State is almost in every aspectan outlier, the possibility cannot be excluded that the survey results are not really representative.Yet, an explanation shall be attempted.
Chin’s poverty rate and poverty gap seem to be highest in the country, yet, poverty shall be decliningrather fast. What certainly is an important characteristic is the high degree of chronic poverty asvisible from the high poverty inertia. Chronic poverty, as chronic unemployment and as malnutrition,are very difficult to overcome, as people do not only lose skills and resources, but also hope anddrive. In this sense, Chin needs first a strong social push to sustainably bring people up to a level fromwhere they would be able to move on by themselves.
The high and persistent poverty goes in line with a high indebtedness. A pilot project could be startedto first convert existing informal loans into formalised loans (e.g. through microfinanceorganisations), and then into soft loans. As shown, this might free a very large percentage of thehousehold expenses for other purposes. The goal should be to convert a credit, or rather: debt-driven State into a savings driven State: poor would access their savings at the beginning of theplanting season, and repay at the end. Also for consumption smoothing, access to own savings is themuch better way, given financial education. This requires as well the establishment of convenientsavings possibilities.
The very low median landholding is part of Chin’s poverty problem: no farm of this size can generatesufficient income to sustain a household. The effect of these low landholdings is also a low rate oflandlessness. The result is a State wherein no one can generate sufficient scale and income toprovide employment and to advance the State’s economy.
Many farmers cultivate subsistence crops, mostly rice. Besides the soil, climate and water,mechanisation is important especially for crops like rice. This is often stimulated by an inadequatepolicy of rice self-sufficiency, even in States like Chin where rice yields are very low. Should the
23 This chapter’s recommendations draw on the work of Khin pwint oo
0
2
4
6
8
10Poverty rate
Poverty decline
Poverty gap
PPI
Poverty inertia
Inequality
Food share
Utilities share
Loans
Underemploymentgap
Land holding
Losses fromcalamities

Poverty in Myanmar 40
Government decide to nevertheless pursue this policy, it should encourage the sale or at least leaseof land to generate larger units. This must go in line with employment creation measures. The goal isto create farms that can use scale, as well as small companies that can provide employment.
Otherwise, the productivity of the small farms needs to be exploited to the fullest through thecultivation of higher value crops, and through additional side activities: vegetable cultivation andperennial crops could be introduced, the production of elephant yam, and in some areas potentiallyalso tea. In the large areas that are not arable, livestock could be held, for example, mython. TheState has additionally potential for some aquaculture, bee-keeping, and for (re-)establishing a silkindustry. This latter would however require complementary investments.
But as long as the development path is oriented towards an agricultural based development –forwhich Chin does not have the most feasible climate- it is essential that the Government supportsfarmers in their fight against vermin and insects infections: median poor households lose 4% of theirharvest to pests, which is avoidable in modern agriculture.
The employment based shift share analysis shows Chin has a competitive advantage in agriculture,hunting and forestry, which needs to be seen here with care: Chin created here above averageemployment because of its inefficiencies. Interestingly, the shift share also shows a competitiveadvantage in Mining & Quarying; real estate, renting and business Activities; and manufacturing.
Again, note that the shift share is purely employment based, and can therefore lead to questionableresults: the State will still be a long distance away for starting industrial development. Nevertheless,it should at least attempt to create wherever possible larger business units which could then furtherdevelop their potential. Should India once manage to clarify the situation at its Eastern most border,Chin would suddenly be able to orient itself even stronger, and more efficiently, to this part.
That utilities are expensive and do therefore swallow a larger share of the expenses of a poorhousehold is understandable, given the remote location of the State and its difficult terrain. Thisdifficult terrain will continue to be an obstacle to development for Chin State. But as the examples ofthe Alps in Europe show, however, good governance, planning and development can also copeeffectively with a difficult terrain. But the first and foremost approach will be to decentralisegovernance and utilities wherever possible, and to invest heavily in non-road dependentinfrastructure such as tele-communications and the internet. This reduces transport necessities andhence transport cost.
As benchmark, the Government of Chin could invest about 30 billion Kyat annually to eliminatepoverty.

Poverty in Myanmar 41
Magway
24In the poverty and equality based indicators, Magway shows average results. Interestingly, though,its slightly below average PPI does not seem to justify its far below average share of foodexpenditures. As Magway is more of a trading hub, the apparently high food prices could indicatemarket inefficiencies or monopolisation, or incorrect data. The share is confirmed by the relativelyhigh price for rice as stated by households.
Besides the share of food expenditures, the very high losses from calamities stands out in Magway'sprofile. Magway is the S/R with the highest crop losses due to calamities: over 16% of the annualharvest is lost - 11% alone from droughts. But the devastating effects of drought can be counteractedwith irrigation. Losing annually 16% of production is extremely wasteful - no manufacturing companycould survive.
Interestingly, in those years where there is no drought, Magway is doing very well in terms of riceyield. But as the longer term planning and security counts, it would make sense for the Governmentto incentivate a larger scale switch to especially pulses, which are also more drought resistant.Magway has even internationally a competitive advantage in, e.g., pigeon and chickpea, and blackand green gram, especially since farmers are more and more adopting high yield and droughtresistance varieties. Magway is furthermore competitive in sunflower seeds, chilies and potato,though in the latter, Shan's vast potato harvests will not allow Magway to obtain a dominant marketposition.
Magway's farmers appear to be comparatively fast in taking up new varieties. Not only in pulses, butalso in paddy do they adopt at increasing scale hybrid varieties, though consumers do not necessarilyfollow this trend. For this, the Government should maintain and expand its seemingly good seed farmin Pwintphyu township, and potentially demonstrate its business model to other S/R. But untilconsumers accept new tastes, it appears best to orient hybrid and high yielding varieties mainly tothe export market, and leave traditional varieties for the local market. Once the central and all theregional governments gave up their economically highly sub-optimal insistence on rice self
24 This chapter’s recommendations draw on the work of Dolly Kyaw
0
2
4
6
8
10Poverty rate
Poverty decline
Poverty gap
PPI
Poverty inertia
Inequality
Food share
Utilities share
Loans
Underemploymentgap
Land holding
Losses fromcalamities

Poverty in Myanmar 42
sufficiency, farmers could switch in larger numbers to newer varieties, thus pushing up the price fortraditional varieties with the effect of providing farmers who stick to traditional varieties with adecent return, and simultaneously inducing many consumers to switch to the more efficient ricevarieties. As in many modern areas, maintaining tradition is more expensive.
Given the dry zone characteristics of Magway, livestock production has a comparative advantage.Magway is already now Myanmar's largest producer of cattle, sheep, goat, pig and chicken. Livestockhas the large advantage of being not that climate dependent. Livestock induces not only thedevelopment of slightly more complex slaughtering and freezing houses, but would also give thepotential to develop industries based on the animal's waste products such as skin and bones.Besides, it can supply parts of the country's needs for eggs and dairy products. As outlined before,the market for meat, especially chicken, is likely to grow in line with GDP per capita growth, thusproviding sound expansion potential. Commercialisation of livestock farming would have to expandfurther, and the corresponding infrastructure needs to be established.
But the focus of development should not be on agriculture and livestock alone. Magway has highpotential in the machinery, household goods and jute-based sub-sectors, as the growth rates ofthose businesses demonstrate. It can further act as a trading hub between North and South, and Eastand West, wherein it has to share this role with Mandalay. Providing its businesses with a reallyenabling business environment is a start.
As benchmark, the Government of Magway could invest about 80 billion Kyat annually to eliminatepoverty.

Poverty in Myanmar 43
Mandalay
25Within the poverty and equality pillar, only Mandalay's inequality stands a bit out: it is higher thannational average. But as the reference position is an extremely equal society, and some economisteven argue that some inequality is required for economic development, it should not -yet- be seen asa reason for major concern.
Despite its very central location, Mandalay's workers do not seem to achieve a sufficient return oftheir work. This might be a consequence of inadequate skills or of market imperfections, but morelikely the former. If so, Mandalay's anti-poverty strategy would certainly include not onlyinvestments into skills development, but into the development of the right skills. This does requirethe establishment of a labour market information system, along with an appropriate representationof the private sector as major employer.
As Magway, Mandalay is the S/R that suffers by far most from agricultural losses due to calamities.And as Magway, those calamities are almost exclusively related to drought, which costs the farmersannually 12% of their output. Paddy yield is low, especially in non-irrigated areas. Nevertheless, theGovernment appears to be driving rice self sufficiency for the whole region, although rice could beeasily purchased from more productive S/R in Myanmar, like Mon, Bago and Ayeyarwady. Drivingrice self-sufficiency at S/R level is clearly a very sub-optimal policy, which drives many farmers intopoverty instead of helping them -and the S/R as a whole- to get out of it.
Mandalay's comparative advantages are rather in pulses, some culinary crops such as chilli andonion, fruits, vegetable, and, potentially, maize. Also potato can be grown with sufficiently highyields, but cannot achieve the market share of Shan.
The oil seed processing industry requires structural adjustment but has potential. This adjustmentdoes not only include technological and skill upgrading, but also institutional organisation -none ofthe actors in the edible oil value chain has trade associations-, supporting services such ascertification, and the development of new markets. China appears to be focussing on the import of
25 This chapter’s recommendations draw on the work of U San Thein
0
2
4
6
8
10Poverty rate
Poverty decline
Poverty gap
PPI
Poverty inertia
Inequality
Food share
Utilities share
Loans
Underemploymentgap
Land holding
Losses fromcalamities

Poverty in Myanmar 44
raw materials only to domestically capture the value added of the processing. On the other hand,adequate quality and food safety control measures for imported products would protect Myanmar'sconsumers from Chinese food imports of questionable quality, simultaneously providing its ownproducers a kind of infant industry advantage. And Mandalay's producers need to be able to tap intothe growing market demands for cholesterol free vegetable oil.
Other sectors that do promote rural as well as industrial development are sugarcane and cotton.Though the sugar cane industry is facing a number of problems, SME sugar processing plants aregrowing. Cotton, planted at nearby river pumping sites, could provide the base for a revived andrestructured weaving industry.
Together with Kayah and Yangon, Mandalay has the potential to become the manufacturing powerhouse of Myanmar. The shift share analysis does not show this potential, because, in fact, most ofMandalay's manufacturing businesses were shrinking in the past five years. But despite the problemsthe sector experienced, the skills and the institutional infrastructure are in place, at least to a largerdegree as in most other S/R of Myanmar. Based on its experience with jeep assembly, the Divisioncould, e.g., develop a local motor bike industry for which demand is likely to boom in the years tocome. The accumulation and expansion of these skills and networks form the basis of slowly movingthe economy more and more from the edges of a product space to its centre. It is in theGovernment's hands not to let these resources slip away.
Mandalay is in the centre of regional connectivity and trade demand. Trade has been a growth driverof Mandalay's regional development, and transit trade has large potentials. This requires the furtherdevelopment of logistic services and multi modal transport systems and hubs to ensure physical aswell as institutional connectivity.
The revival or establishment of all these industries requires governmental action: first of all, thetransport infrastructure needs to be improved and expanded, and electricity supply needs to bereliable. Secondly, the Government needs to establish a predictable and facilitating businessenvironment, which allows the private sector to reliably plan for many years ahead and investaccordingly. Third, the government should directly or indirectly foster the required business services.These include basic research on optimal seeds and cropping systems -a typical governmental task-,but also the provision of financial services needed for the complex and costly modernisationprocesses, and market research and information.
The increased productivity and competitiveness gained will allow raising wages, attract further skills,and reduce poverty. As benchmark, the Government of Mandalay could invest about 55 billion Kyatannually to eliminate poverty.

Poverty in Myanmar 45
Mon
26Mon State's radar chart shows a favourable local price index which should, de facto, further reduceits already slightly better than average poverty gap and poverty rate. As with Kayon and Tanintharyi,the favourable index might have to do with the State’s proximity to Thailand. Outstanding loans arebelow national average, providing Mon’s people with some financial leeway for other consumptionand for investment. But it seems that the people need to invest much labour, many hours, to obtainthis slightly better than average poverty gap: they receive a low return of their labour. This might bethe result of a skills level which is below national average, or market imperfections for examplethrough monopolistic structures. The above average median land holding and the lower than averagelosses from calamities (only 3% of the harvest is lost) indicate some scope for agriculturaldevelopment.
Two agricultural products stand out in Mon’s structure: rubber and fishing. The world market fornatural rubber is highly promising, and Mon’s rubber plantations are internationally competitive. Butmore care needs to be taken that these rubber plantations’ competitiveness can be sustained andthat their negative spill over effects do not spoil other development prospects of Mon: the vastexpansion of the rubber plantations risk destroying a delicate ecological balance with potentiallyserious consequences for Mon’s other industries. The Government needs to look at expansion plansfrom a more holistic and long term State perspective. It should then foster the development ofnatural rubber based industries by, e.g., producing tyres for locally made motor bikes, whose marketwill certainly boom in the next years. Alternatively, it could invite rubber based FDIs.
Myanmar as a whole has reached its sustainability limits in catch fish and is, in fact, already beyondthe natural replenishment rate of fish and shrimps. The only way to sustain the industry is to limit theoverall amount that can be caught in agreement with other Divisions bordering the sea. It then needsto develop aquaculture, and set up value added industries. As has been shown, there is a largeregional and world market for frozen fish and fish fillets, which Myanmar so far failed to tab. This
26 This chapter’s recommendations draw on the work of Khin pwint oo
0
2
4
6
8
10Poverty rate
Poverty decline
Poverty gap
PPI
Poverty inertia
Inequality
Food share
Utilities share
Loans
Underemploymentgap
Land holding
Losses fromcalamities

Poverty in Myanmar 46
does, of course, require the establishment of functioning value chains, from hatching to overseasmarketing, as well as a supporting institutional and quality infrastructure.
The development of aquaculture requires additional protection from floods which can be effectivelyfacilitated by mangrove rehabilitation. Such rehabilitation will attract wildlife and could become aspecial tourist attraction for Mon State. Tourism development needs to be seen in a very holisticmanner, from the moment of arrival to potential side activities (such as those mangrove trips) tohealthcare and security.
Finally, Mon might benefit from some trading activities, especially en route between Thailand andYangon, and could also develop some value added activities around its minded gold.
As benchmark, the Government of Chin could invest about 14 billion Kyat annually to eliminatepoverty.
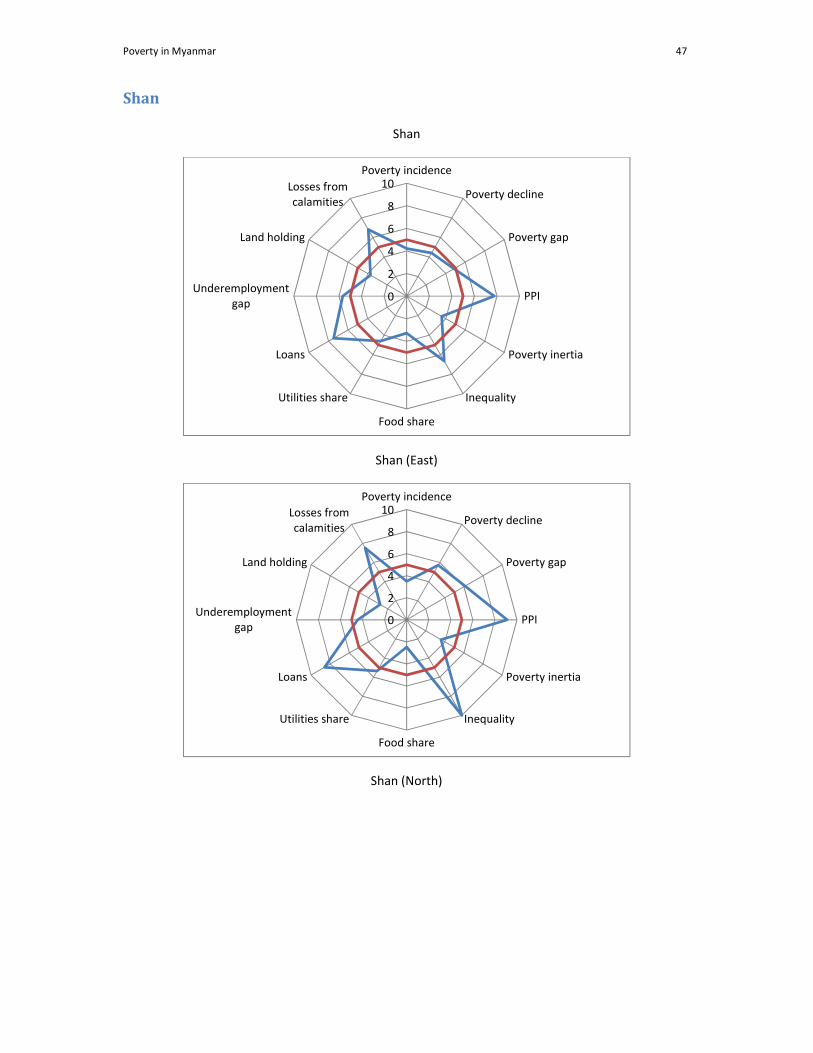
Poverty in Myanmar 47
Shan
Shan
Shan (East)
Shan (North)
0
2
4
6
8
10Poverty incidence
Poverty decline
Poverty gap
PPI
Poverty inertia
Inequality
Food share
Utilities share
Loans
Underemploymentgap
Land holding
Losses fromcalamities
0
2
4
6
8
10Poverty incidence
Poverty decline
Poverty gap
PPI
Poverty inertia
Inequality
Food share
Utilities share
Loans
Underemploymentgap
Land holding
Losses fromcalamities

Poverty in Myanmar 48
Shan (South)
27Shan State is Myanmar’s largest and does therefore also show strong intra-regional disparities.Poverty is above national average in the East and North, but below in the South. It declineeverywhere about average, but the poverty gap is particularly high in the North, and rather low,again, in the South. The purchase power favours the State as a whole, as goods and services,measured at the national consumption basket, are comparatively cheaper. Poverty inertia is all overthe State comparatively high, meaning above average chronic poverty, explicable by the remotenessof most of the State. Finally, within the poverty pillar, inequality is very low in East and South, butabove national average in the North.
The favourable PPI is reflected in the below average share for food expenditures, although Shan Eastsuffers the highest rice price in the Union, and Shan North and South are not far behind. Potentially,rice is partially substituted by potato where Shan has the lowest price. But the expenditure share for
27 This chapter’s recommendations draw on the work of U San Thein
0
2
4
6
8
10Poverty incidence
Poverty decline
Poverty gap
PPI
Poverty inertia
Inequality
Food share
Utilities share
Loans
Underemploymentgap
Land holding
Losses fromcalamities
0
2
4
6
8
10Poverty incidence
Poverty decline
Poverty gap
PPI
Poverty inertia
Inequality
Food share
Utilities share
Loans
Underemploymentgap
Land holding
Losses fromcalamities

Poverty in Myanmar 49
utilities diverts especially between North and South, where it is low in the former and high in thelatter. The low share in the North might however also be explicable by low opportunity.
A serious problem for all parts of the State is the over-indebtedness of the poor. This over-indebtedness might also explain the comparatively high inertia, and will certainly lead to long-termstructural problems of poverty. In terms of poverty alleviation and reduction, the Government shouldsee this as a priority to tackle, through the conversion of existing informal high interest loans intoformal loans with lower interest rate. Notably, South Shan, where UNDP/PACT’s micro financeprogramme is active, has the lowest over-indebtedness of all parts. This might be coincidental andunrelated, but it might also have some causal relation.
The median size of the poor’s landholding is everywhere below average, and in the East stronglybelow. Communal systems have their role to play, but for modern agricultural development suchsmall landholdings are in growth and poverty-reduction inhibitor. Sufficient and sustainable incomecan only be generated if the farmers do either switch to higher, yet also more risky, value products, ifthey increase the effective landholdings through functioning cooperation, or if they let market forcesallocate the land through lease or even transfer systems. But as in the case of Chin, a low medianland size goes hand in hand with Myanmar’s lowest rate of landlessness. From the viewpoint ofcalamities, Shan State is promising, as losses are small.
Being a large State, Shan has diverse potentials for the development of competitive resource basedindustries.
Shan (especially Shan South) has a revealed competitive advantage in soybean production. Itsdevelopment requires varietal improvement, followed by improvement in the agronomic techniques.Soybean based industries can follow immediately: soybean meal, e.g., is much in need in the fishingindustry of Ayeyarwady and other aquaculture based S/R.
Southern Shan also has a revealed competitive advantage in potato production, and is by far thelargest potato producer in Myanmar (58% of the total). But the productivity is not uniform acrossShan: the yield in the Northern and Eastern parts is significantly below national average. And inunfavourable weather conditions, potato crops often suffer from pests: for larger scalecommercialisation, more resistant varieties need to be developed, e.g. by the Yezin AgricultureUniversity, and introduced to the farmers.
Maize is another promising crop, especially for the animal feed industry. Markets are not only inShan itself, but especially in more livestock oriented S/R located in the dry zone. For its introduction,the systems introduced by the Thi CP group could be replicated. The maize cobs -waste products ofmaize- could be turned into biofuel, thus reducing electricity shortages.
Vegetable of the Aungban and Pindaya areas appear to have a large demand in Korea, Japan andother ASEAN countries. Pineapple and associated juice industries could be located in Kyauk area.
Turning to plantation crops, tea is probably the most important. It has been an important product inthe past, but the plantations (especially in Namsan/Kyaunme) require a multi-dimensional approachfor rehabilitation: unproductive tea plants need to be replaced, and planting and managementtechniques need to be improved and possibly organic tea introduced. As it may take 10 years torestore the plantations, this is a very long term project requiring long term soft loans and efforts.Also the payment systems for both, the tea pickers as well as the sale of tea needs to be adjusted to

Poverty in Myanmar 50
the requirements of the markets. Tea picking is a low paid and highly seasonal job, but it couldprovide additional incomes to poor. Further potentials for agricultural and industrial developmentare seen in sugar production, for which the achievement of scale economies is substantial, and in theNorth and the border areas rubber plantations.
Shan State is also well suited for livestock. Land is available, there just appears to be a necessity toreassess the grazing land, whose demarcation dates back to the British colonial government.
Built upon the existing mineral deposit of the State, a cement industry for the expected constructionboom should be fostered, as well as pig iron industry and low grade coal mining.
Further advancing from these comparatively low value added industries, Shan could exploit itslocational positioning at the cross of four important Asian Highway Routes. These routes will notnecessarily convert Shan into a trading hub, but allow its industries to access markets in Thailand,India (Highway AH1/2) and China (Highway AH2/3/14). Its industrial development should thereforebe oriented towards the demands in these nations, and towards input products and the potentialcompetition from them.
As in all other S/R, the Government needs to provide the enabling conditions for the economy todevelop, including hard and soft infrastructure (roads, electricity, institutions, regulations) andsupporting services.

Poverty in Myanmar 51
Final remarks
Nowadays, Myanmar shows low levels of development in all dimensions, even with a reasonablepoverty headcount measured in terms of expenditure or consumption of the households. At thesame time, very low inequality –characteristic of more traditional or agrarian societies- is alsoaccounted in the household surveys. The Gini coefficients, both for 2005 and 2010, are one of thelowest found worldwide.
However, when the regional dimension is included, the level of disparity in all indicators becomeshigh, especially in terms of expenditures.
The development potentials are also very heterogeneous among regions and states, as is explained inthe second part of this document, but none of them seems to have a high level of unviability forreducing poverty and promotion of inclusive growth.
The scope for policy interventions in order to improve the livelihood of the population is wide open,due to the lack of previous actions, but also because one of the most acute problems in the remoteareas is the lack of stable and well remunerated employment. A State action oriented to eitheremploy in the off season, or complement incomes (conditional cash transfers as child allowance orsupport to the elderly), can be very helpful in improving material conditions in the States andRegions.


![arXiv:1310.5953v2 [hep-ph] 18 Mar 2014 · Mark G. Alford, 1,S. Kumar Mallavarapu, yAndreas Schmitt,2, zand Stephan Stetina2, x 1Department of Physics, Washington University St Louis,](https://static.fdocuments.us/doc/165x107/5b54f1e57f8b9add3a8db212/arxiv13105953v2-hep-ph-18-mar-2014-mark-g-alford-1s-kumar-mallavarapu.jpg)