Step 2 – Derived Fields - Online Registration...
61
Step 2 – Derived Fields There is the ability to add Derived Fields onto the report in the say way you are used to with all your Custom Reports
Transcript of Step 2 – Derived Fields - Online Registration...

Step 2 – Derived Fields
There is the ability to add Derived Fields onto the report in the say way you are used to with all your Custom Reports
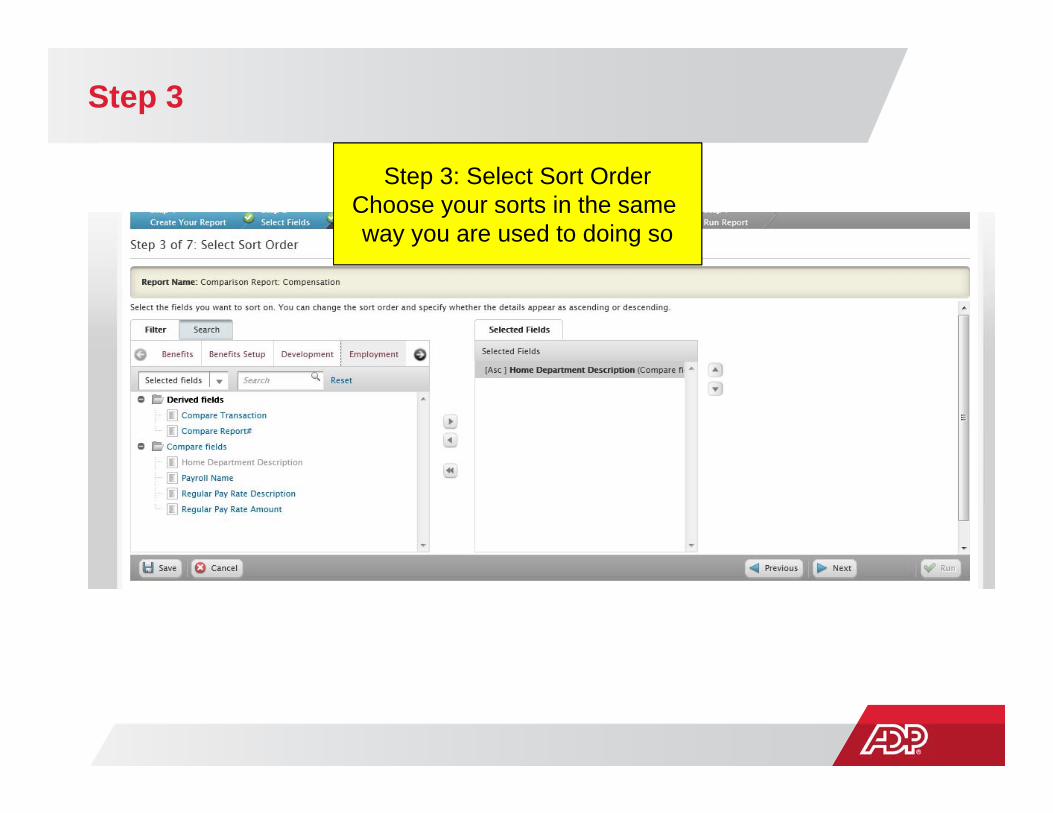
Step 3
Step 3: Select Sort OrderChoose your sorts in the same way you are used to doing so

Step 4
Step 4: Specify TotalSet your totals in the same
way you are used to doing so

Step 5
Step 5: Select FormatFormat your report in the same way you are used to doing so
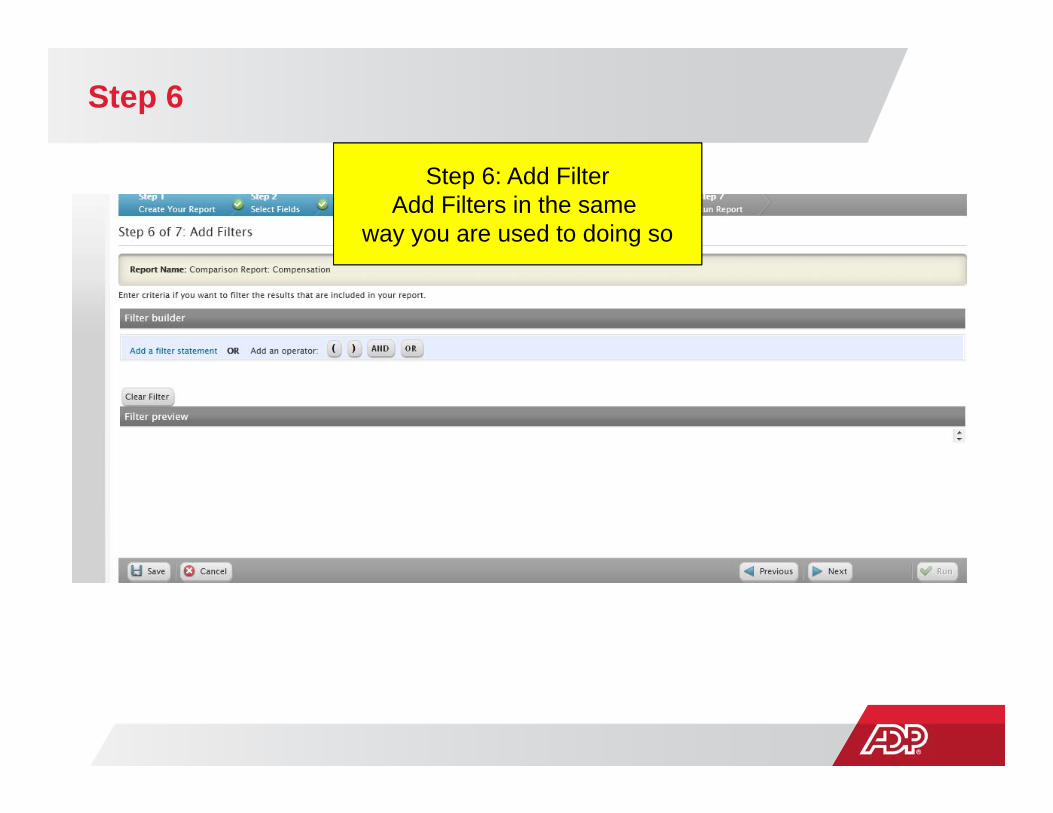
Step 6
Step 6: Add FilterAdd Filters in the same
way you are used to doing so
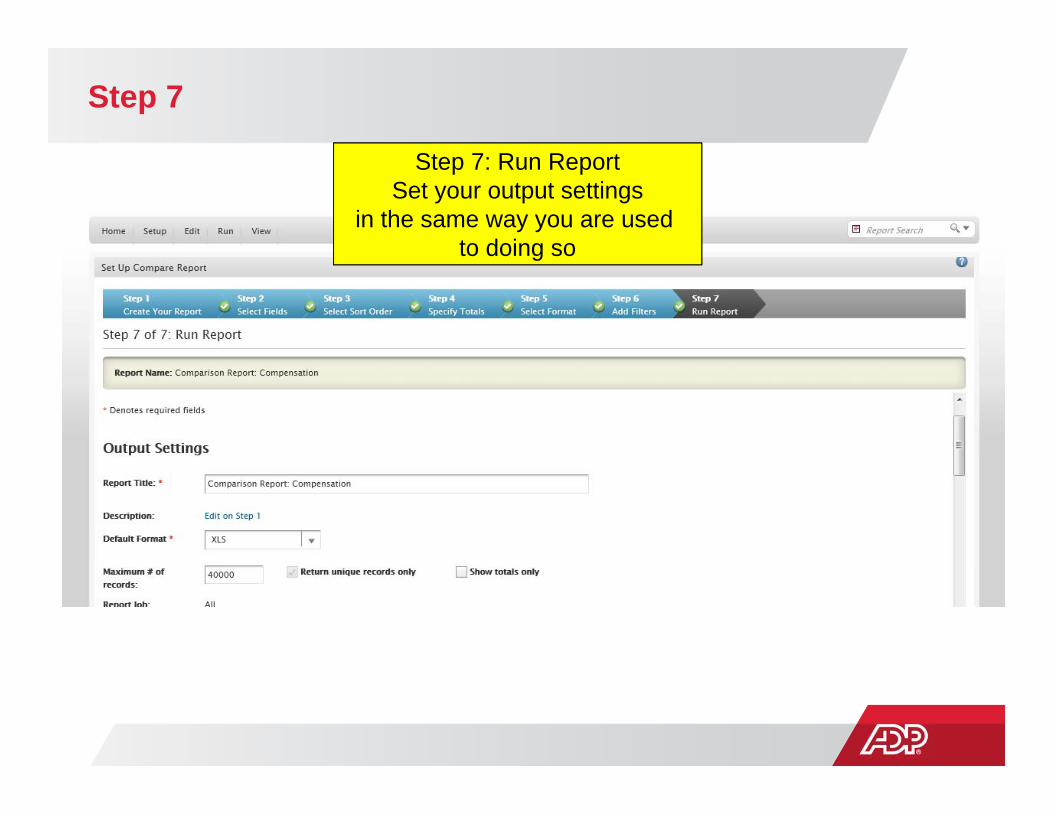
Step 7
Step 7: Run ReportSet your output settings
in the same way you are used to doing so

Step 7 – Runtime Settings
Step 7: Run ReportAlso here is where you choose
the report output you want to compare
Report 1 = “”Report with most current data”
Report 2 = “Report with older data”

Step 7 – Runtime Settings
There are 3 types of report you could compare:•Use existing report•Most recent report•Create new report
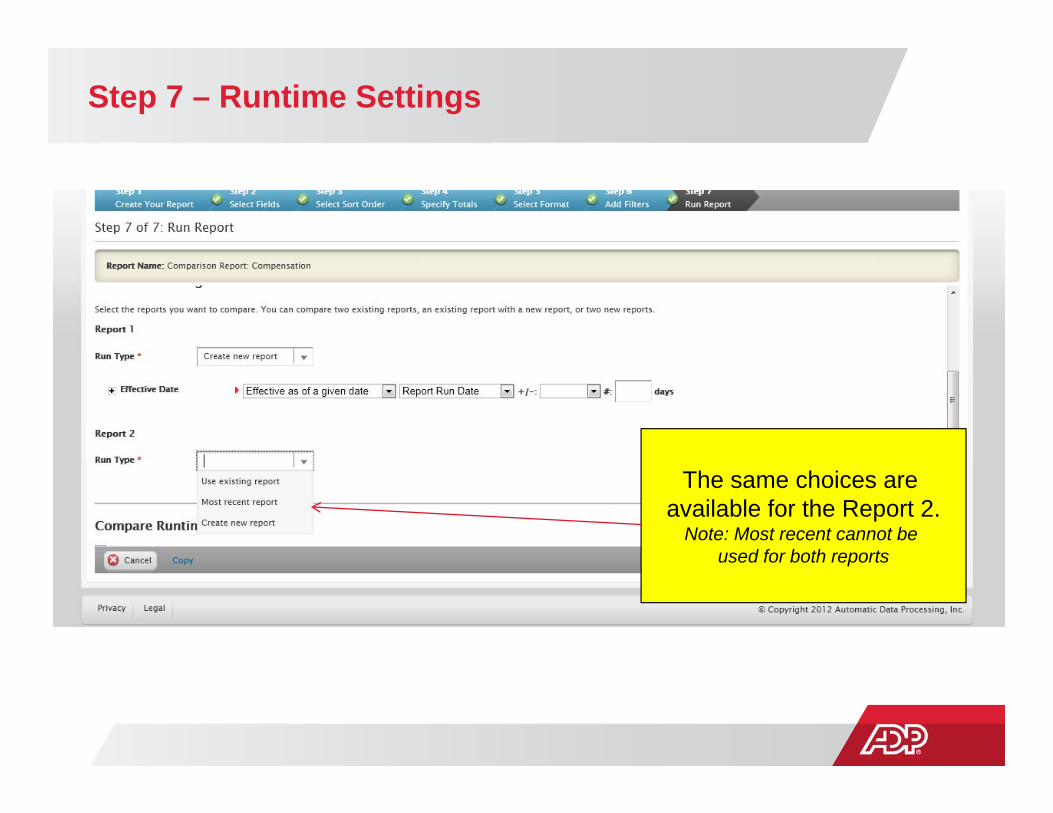
Step 7 – Runtime Settings
The same choices are available for the Report 2.
Note: Most recent cannot be used for both reports

Step 7 – Compare Runtime SettingsAs with the Quick Compare:Select the records you would like to include:
•Changed•Added•Deleted•Unchanged
Note: You could make multiple selections
For this example we will only select “Changed Records”

Step 7
Step 7: Run ReportSetup your Notifications and Schedule
in the same way you are used to doing so
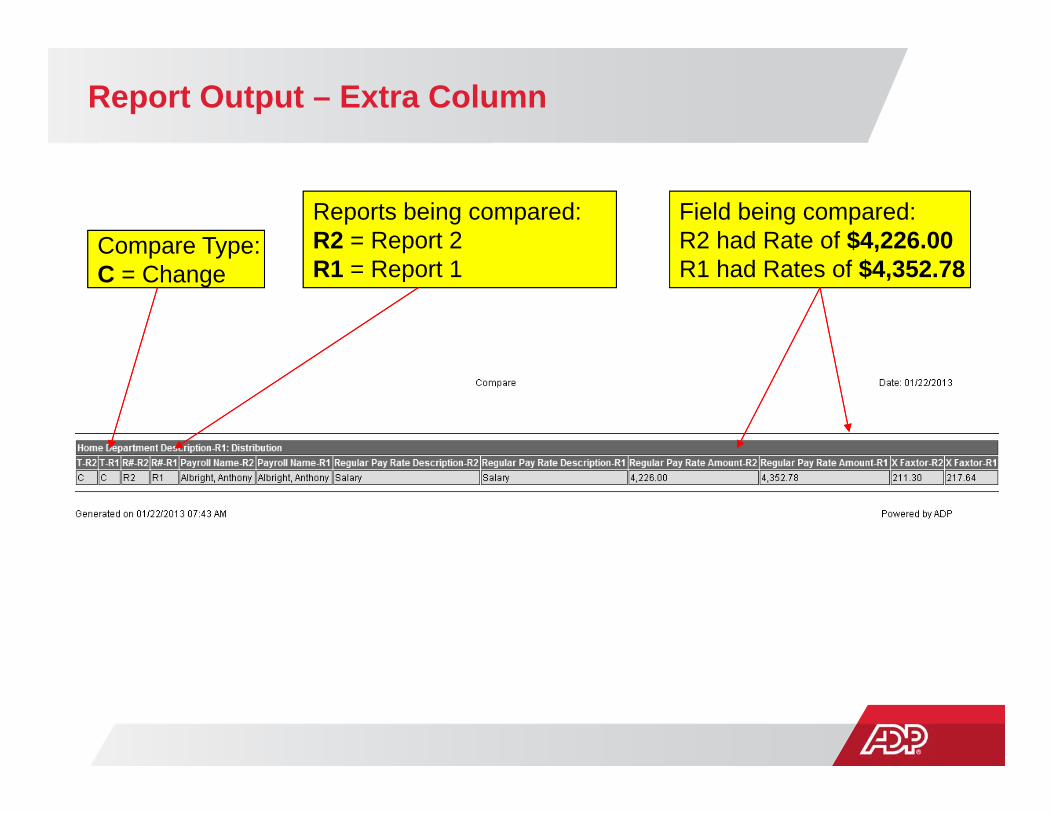
Report Output – Extra Column
Reports being compared:R2 = Report 2R1 = Report 1
Field being compared:R2 had Rate of $4,226.00R1 had Rates of $4,352.78
Compare Type:C = Change

Report Output – Extra Row
Reports being compared:R2 = Report 1R1 = Report 2
Field being compared:R2 had Rate of $4,226.00R1 had Rates of $4,352.78
Compare Type:C = Change

Report Output: Keys “*” – Training Note

Report Output: Changes – Training Note
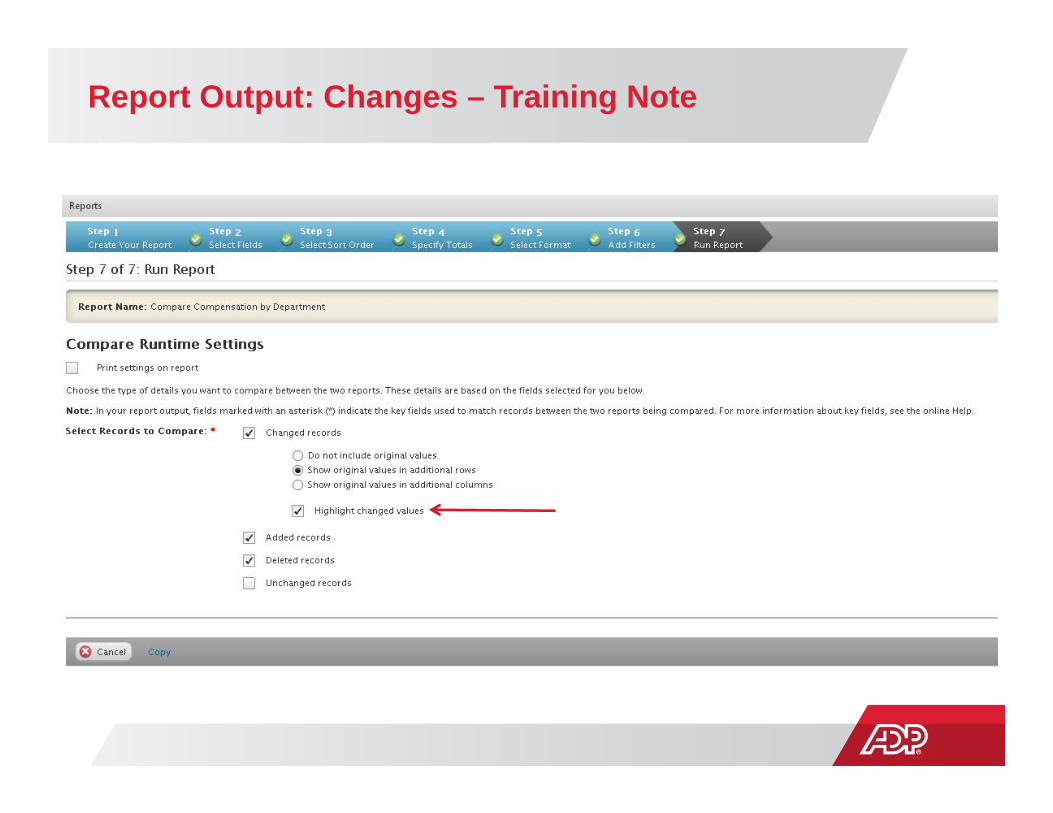
Report Output: Changes – Training Note

Recap: Advantages of using Advanced Compare
• It is a reusable template
• Can be scheduled
• Leverages features of Custom Report setups steps

To build…… or not to build
© Copyright 2012 ADP, Inc. Proprietary and Confidential Information.79

The Bigger Picture of Reporting
80
The 3 Pillars of Reporting
Analytics
Custom
Standard
a.k.a .Ad-Hoc
ADPR

Reports results may already be created for you
Standard ReportsSample ReportsAnalytics (billable)
81

Reporting Menu
82

Standard Reports
© Copyright 2012 ADP, Inc. Proprietary and C fid ti l I f ti
83

Standard Reports
84

Standard Reports
Before you create a custom report for things like…
• Eligibility/Enrollments• Benefit Statements• Time Off Reports• Timecard (absences, punch detail)
Check to see if one already exists
85

Standard Reports:Many benefit, enrollment, eligibility, reporting needs addressed
86

Standard Reports:Many time off reporting needs addressed
87
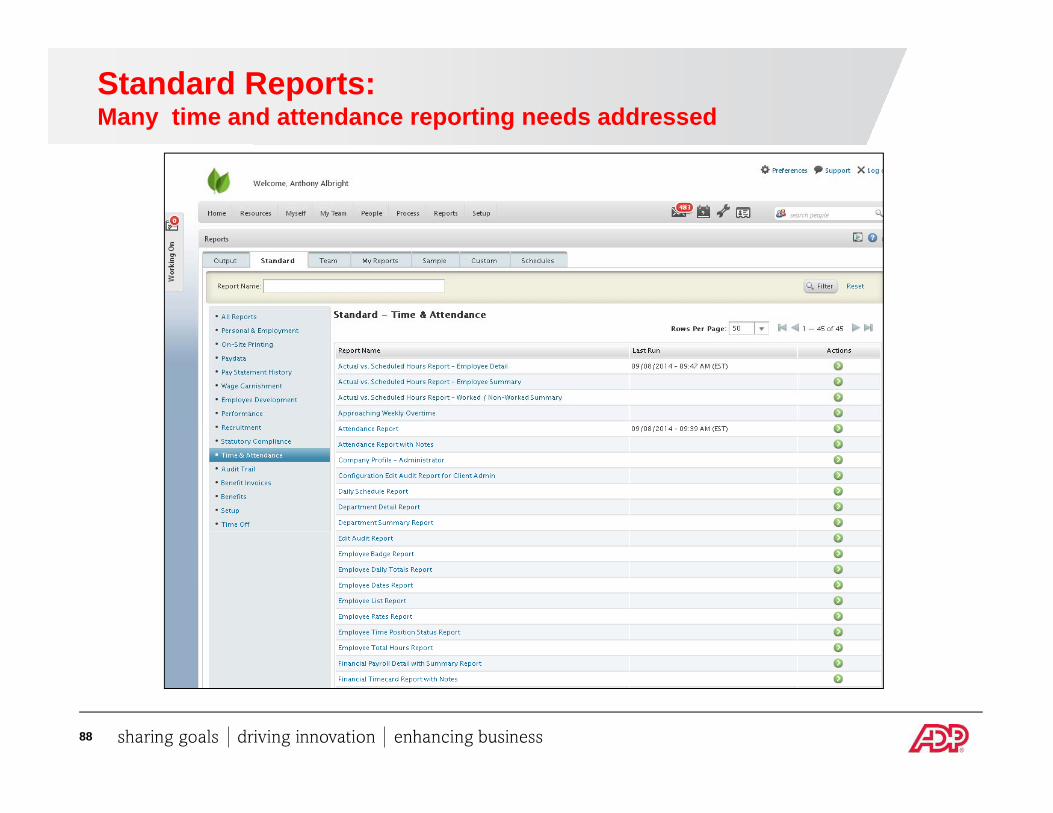
Standard Reports:Many time and attendance reporting needs addressed
88

Sample Reports
© Copyright 2012 ADP, Inc. Proprietary and C fid ti l I f ti
89

Sample Reports
90
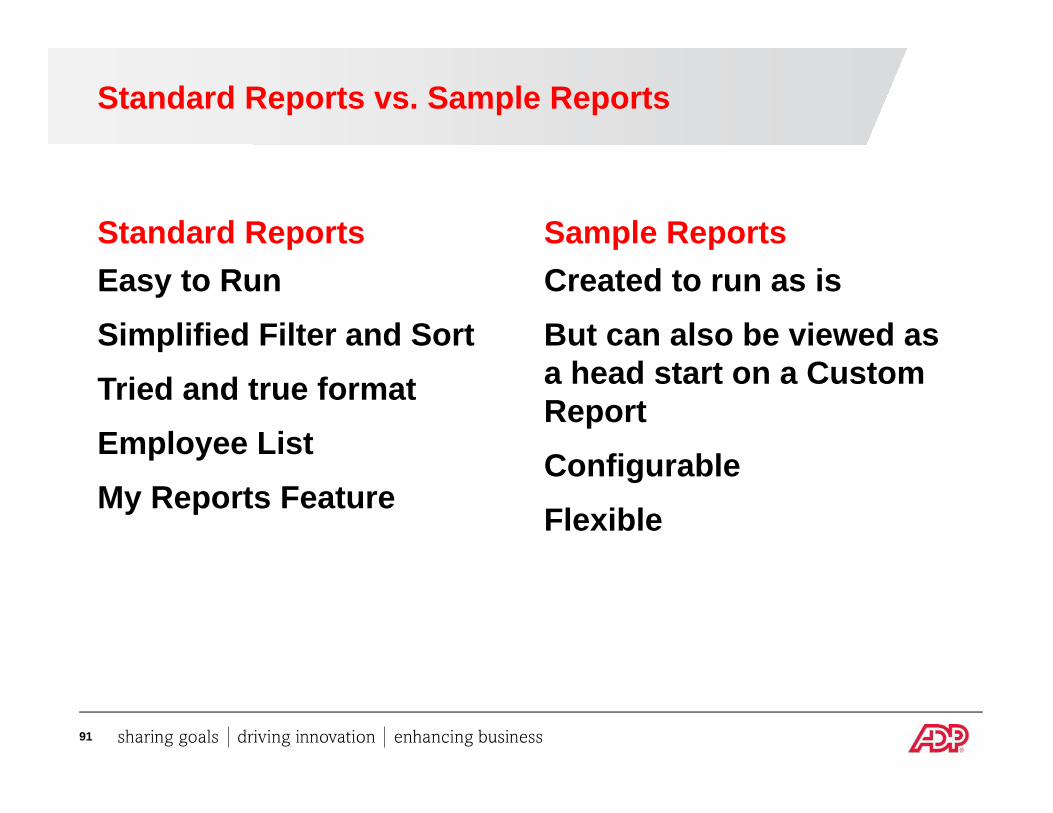
Standard Reports vs. Sample Reports
Standard ReportsEasy to RunSimplified Filter and SortTried and true formatEmployee ListMy Reports Feature
Sample ReportsCreated to run as isBut can also be viewed as a head start on a Custom ReportConfigurable Flexible
91

Analytics
© Copyright 2012 ADP, Inc. Proprietary and C fid ti l I f ti
92

Analytics Overview
93

Analytics Overview
94

Analytics Overview
ADP Provided DashboardsAttrition ReviewHeadcount ReviewTime and LaborTime and CostWorkforce DemographicsWorkforce Planning
95

Analytics Overview
Attrition Review
Terminations
Hires
Retirement Eligibility
Turnover Rate
96

Analytics Overview
Headcount Review
Headcount
Hires
Terminations
Leave Percentage
Earnings
97
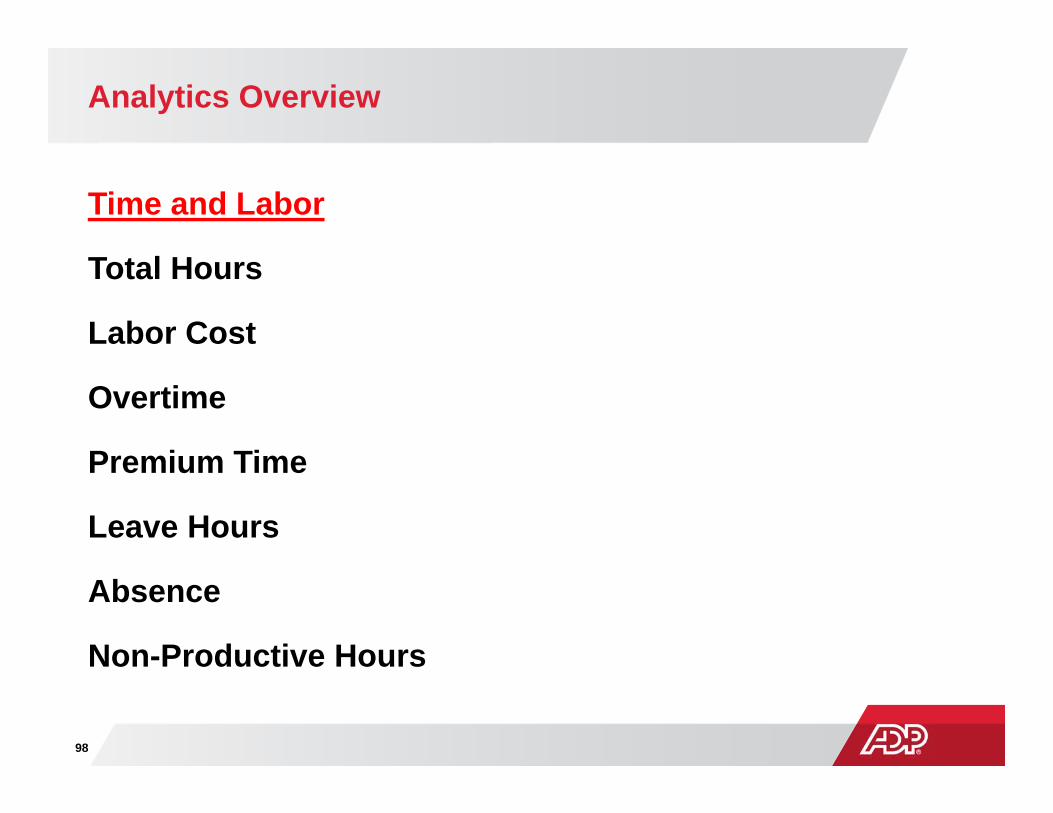
Analytics Overview
Time and Labor
Total Hours
Labor Cost
Overtime
Premium Time
Leave Hours
Absence
Non-Productive Hours
98
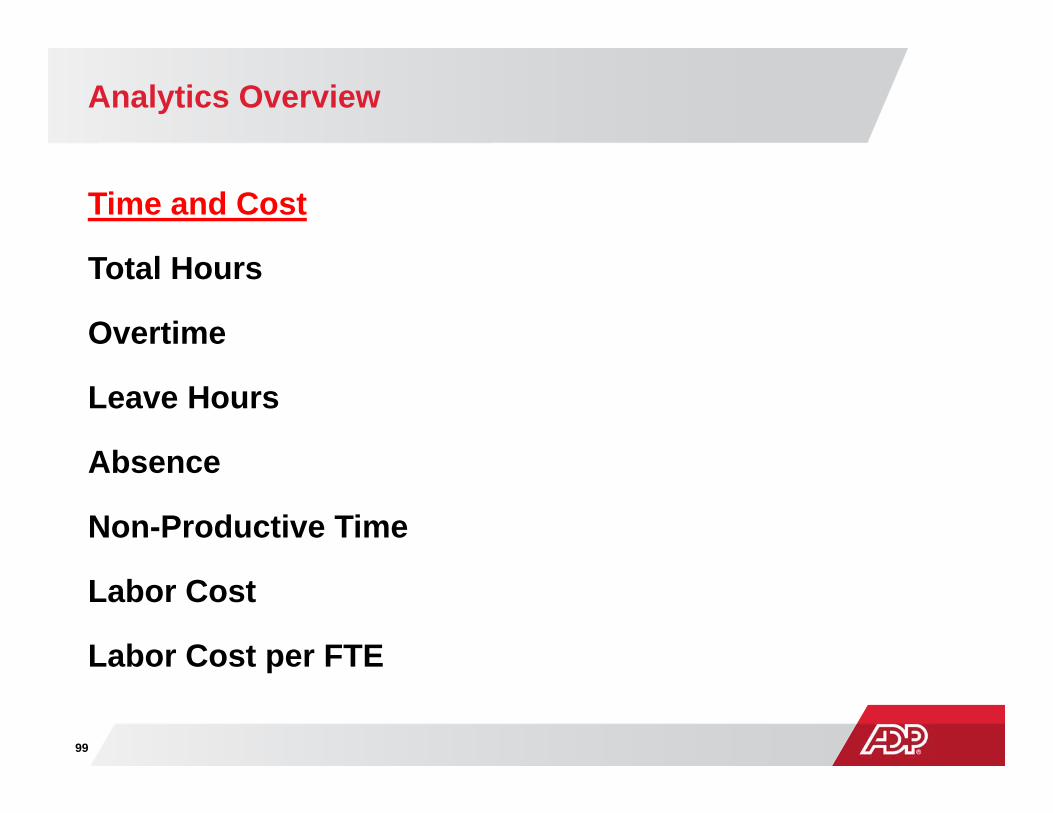
Analytics Overview
Time and Cost
Total Hours
Overtime
Leave Hours
Absence
Non-Productive Time
Labor Cost
Labor Cost per FTE
99

Analytics Overview
Workforce Demographics
Average Age
Female Percentage
Average Tenure
Minority Headcount
Retirement Eligibility
Headcount by Tenure
100

Analytics Overview
Workforce Planning
Headcount
Total Hours
Labor Cost
Absence
Overtime
Hires
Turnover Rate
101

Analytics Overview
102

Analytics Overview
103

Analytics Overview
104

Analytics Overview
105

Filters Metrics
106

“i ” Button
107

ADP Benchmark
108

ADP Benchmark
109

ADP Benchmark
110

View Metric “By”
111

View Metric “By”
112

Click on Chart to Drill into DetailsHover over chart or lines to see numbers
113

Data Table – Number behind the charts
114

“Details” behind the charts
115

Comments
116
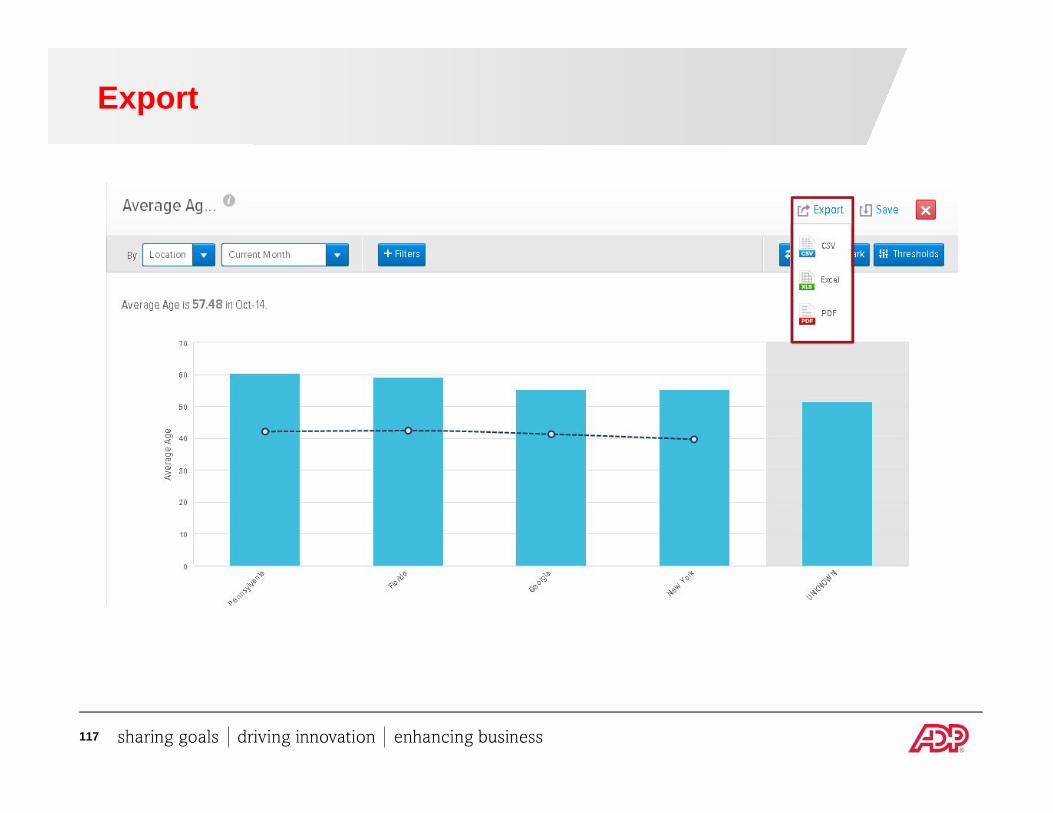
Export
117

What’s Next for ADP Reporting?
118

Areas of Focus for the Future
Integration with Analytics
Enhanced Usability/Ease of Use
119
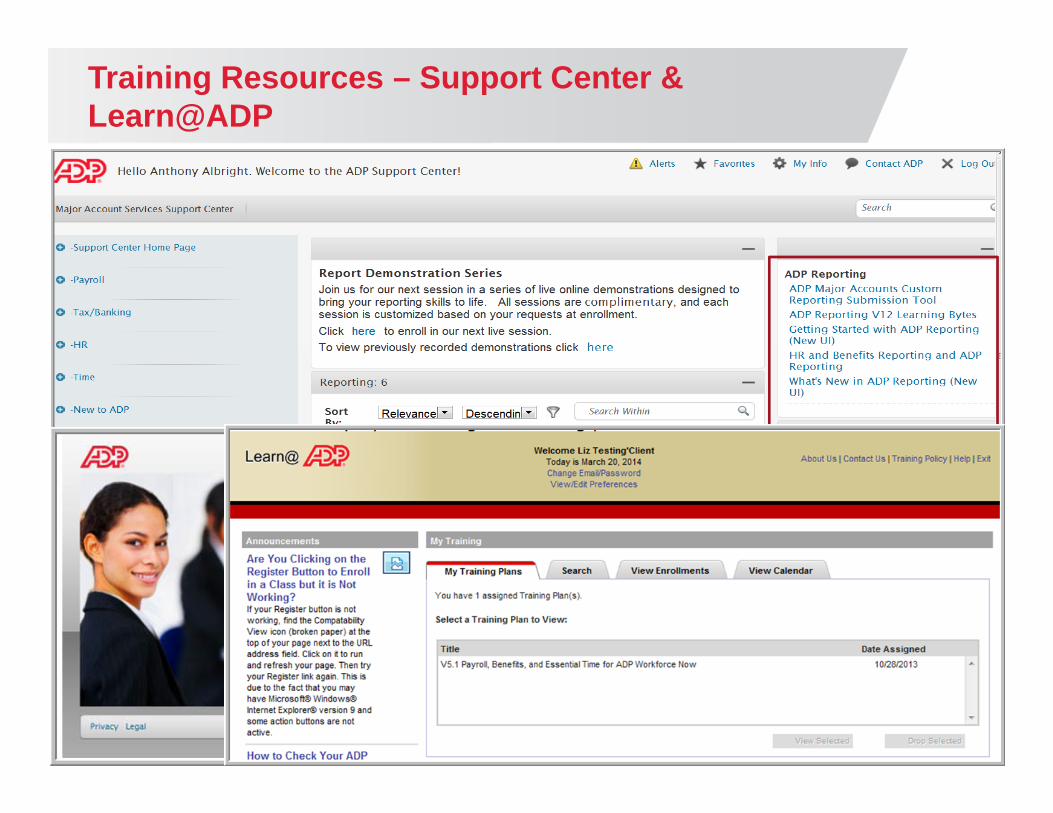
Training Resources – Support Center & Learn@ADP
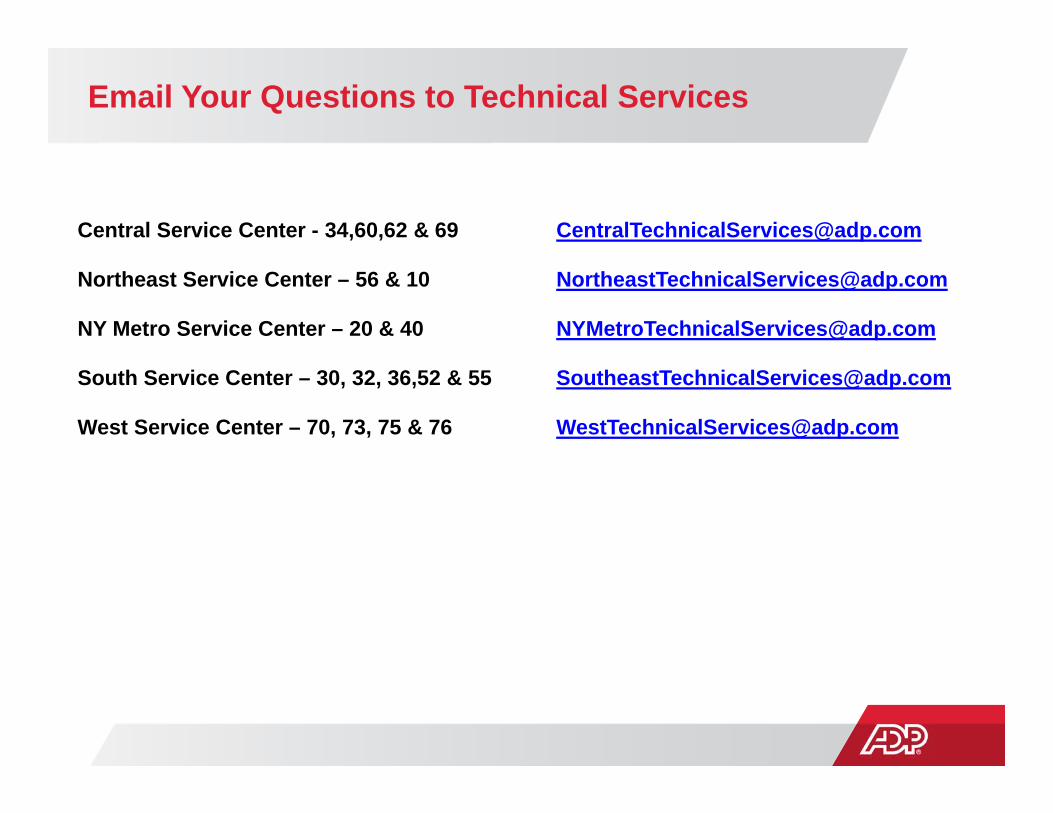
Email Your Questions to Technical Services
Central Service Center - 34,60,62 & 69 [email protected]
Northeast Service Center – 56 & 10 [email protected]
NY Metro Service Center – 20 & 40 [email protected]
South Service Center – 30, 32, 36,52 & 55 [email protected]
West Service Center – 70, 73, 75 & 76 [email protected]