Stem Cell Donor-Matching for Patients of Mixed Race Stem Cell Donor-Matching for Patients of Mixed...
39
Stem Cell Donor- Stem Cell Donor- Matching Matching for Patients of for Patients of Mixed Race Mixed Race Ted Bergstrom, UCSB Rod Garratt, UCSB Damien Sheehan-Connor, Wesleyan University SWET Conference, Cal Poly, Feb 27. 2011
-
date post
20-Dec-2015 -
Category
Documents
-
view
214 -
download
0
Transcript of Stem Cell Donor-Matching for Patients of Mixed Race Stem Cell Donor-Matching for Patients of Mixed...

Stem Cell Donor-Matching Stem Cell Donor-Matching for Patients of Mixed Race for Patients of Mixed Race
Ted Bergstrom, UCSBRod Garratt, UCSBDamien Sheehan-Connor, Wesleyan University
SWET Conference, Cal Poly, Feb 27. 2011
MotivationIf Nick Glasgow were white, he would have a nearly 90 percent chance of finding a matching bone marrow donor who could cure his leukemia. But because the 28-year-old bodybuilder is one-quarter Japanese, his doctor warned him the outlook was grim. Glasgow's background, he said, would make it impossible to find a match, because a match usually comes from a patient's own ethnic group. “The doctor didn't say it was slim-to-none. He didn't say it would be hard. He said `zero chance,’” Glasgow's mother,…, recalled.
-Associated Press, 27 May 2009
Motivation
• Friends and family of Mr. Glasgow organized a web-based campaign to recruit potential donors
• Focus of recruitment was on those of mixed European-Japanese background
• The punch line:
Found two matching potential donors within one
month

Questions Posed
• Mr. Glasgow’s chances of finding a match were obviously not zero. What were they?
• To what extent are individuals more likely to find a match within their “own” ethnic group? How do we define “own”?
• Is there an economic case for aggressive recruitment of new potential donors of mixed race?

Bone Marrow Transplants
• Many diseases of the blood can be potentially cured by a hematopoietic stem cell (bone marrow) transplant
• This involves destruction of the patient’s bone marrow and its replacement with bone marrow from a donor
• The new bone marrow replenishes the blood with non-diseased cells

Matching Patients with Donors
• In order to be successful, patient and donor must be adequately “matched”
• In solid organ transplants:– Match blood type to prevent rejection of graft by
recipient– Rarest blood type is in 7% of population
• In hematopoietic stem cell transplants:– Match HLA type to prevent rejection of recipient
by the graft (GVHD)
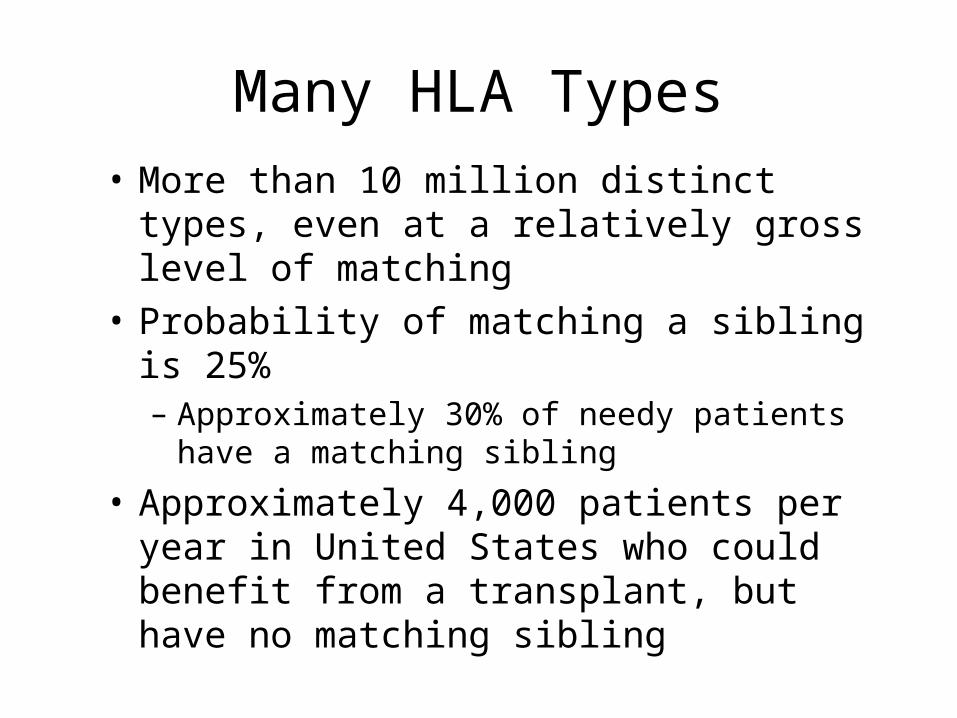
Many HLA Types• More than 10 million distinct types, even at a
relatively gross level of matching• Probability of matching a sibling is 25%
– Approximately 30% of needy patients have a matching sibling
• Approximately 4,000 patients per year in United States who could benefit from a transplant, but have no matching sibling
Matching Probabilities by Race
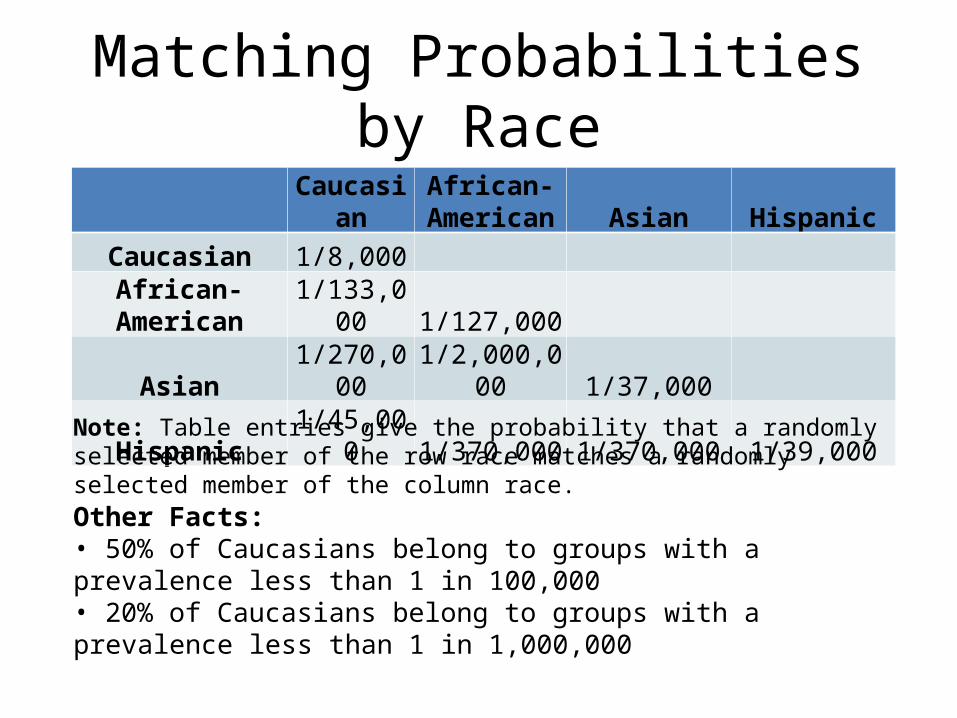
CaucasianAfrican-American Asian Hispanic
Caucasian 1/8,000African-American 1/133,000 1/127,000
Asian 1/270,000 1/2,000,000 1/37,000Hispanic 1/45,000 1/370,000 1/370,000 1/39,000
Note: Table entries give the probability that a randomly selected member of the row race matches a randomly selected member of the column race.Other Facts: • 50% of Caucasians belong to groups with a prevalence less than 1 in 100,000• 20% of Caucasians belong to groups with a prevalence less than 1 in 1,000,000
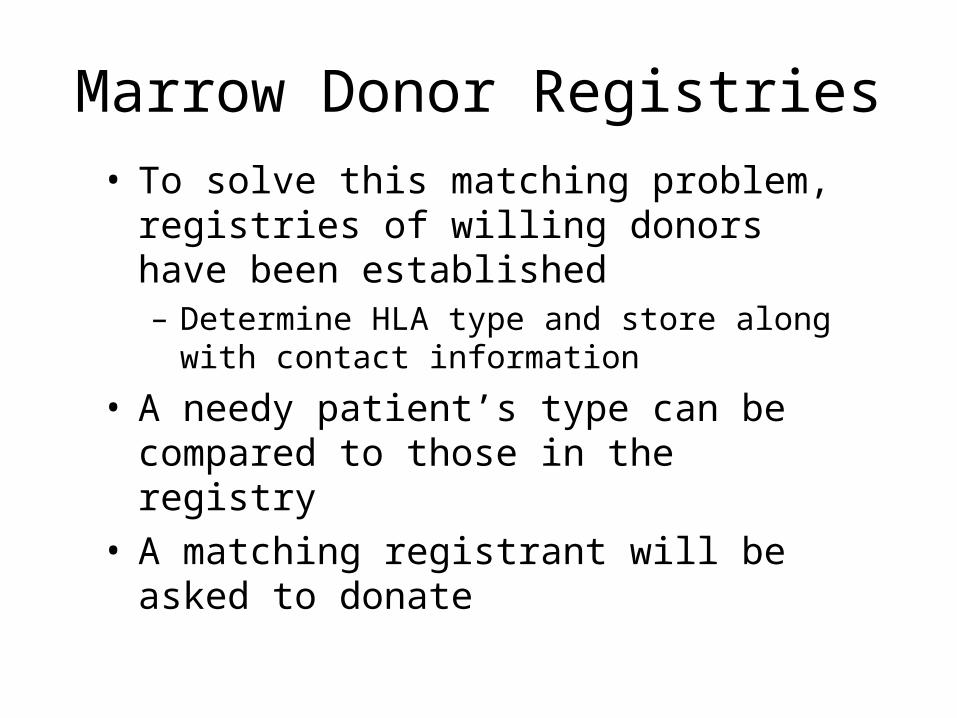
Marrow Donor Registries• To solve this matching problem, registries of
willing donors have been established– Determine HLA type and store along with contact
information
• A needy patient’s type can be compared to those in the registry
• A matching registrant will be asked to donate

NMDP Registry, 2009Race or Ethnicity (Self-Identified) Number in
Registry
American Indian/Alaska Native 90,000Asian 550,000Black or African American 600,000Native Hawaiian or Other Pacific Islander 11,000White 6,000,000Multiple Race 250,000Hispanic or Latino 800,000
Total 8,301,000
Source: 2009 NMDP Facts and Figures, accessed at http://www.marrow.org/NEWS/MEDIA/Facts_and_Figures/2009 Facts and Figures Final 20031210.pdf

NMDP Registry Imputations
• Best available HLA data (from NMDP) divided into the following categories:– Caucasian– African-American– Asian– Hispanic
• Need to impute number of registrants for each of these groups, plus each mixed-race combination

NMDP Registry Imputations• Caucasian:
– White, AI/AN• African-American
– Black or African American• Asian
– Asian, Native Hawaiian or Other Pacific Islander• Hispanic
– Hispanic or Latino

NMDP Registry Imputations• The “multiple race” category was divided
among the six biracial combinations in proportion to their 2000 US Census numbers

Imputed NMDP RegistryRacial Group Imputed Number in
Registry
White 6,090,000
African-American 600,000
Asian-American 561,000
Hispanic 800,000
African-American, White 43,700
Asian-American, White 50,900
Hispanic, White 92,500
African-Amer., Asian-Amer. 8,000
African-American, Hispanic 44,600
Asian-American, Hispanic 10,400

Imputed NMDP RegistryRacial Group
Imputed Number
Probability Available
Effective Number
White 6,090,000 0.57 3,471,300
African-American 600,000 0.27 162,000
Asian-American 561,000 0.35 196,350
Hispanic 800,000 0.34 272,000
African-American, White 43,700 0.42 18,400
Asian-American, White 50,900 0.46 23,400
Hispanic, White 92,500 0.46 42,100
African-Amer., Asian-Amer. 8,000 0.31 2,500
African-American, Hispanic 44,600 0.30 13,600
Asian-American, Hispanic 10,400 0.34 3,600
Total 8,301,000 4,205,250
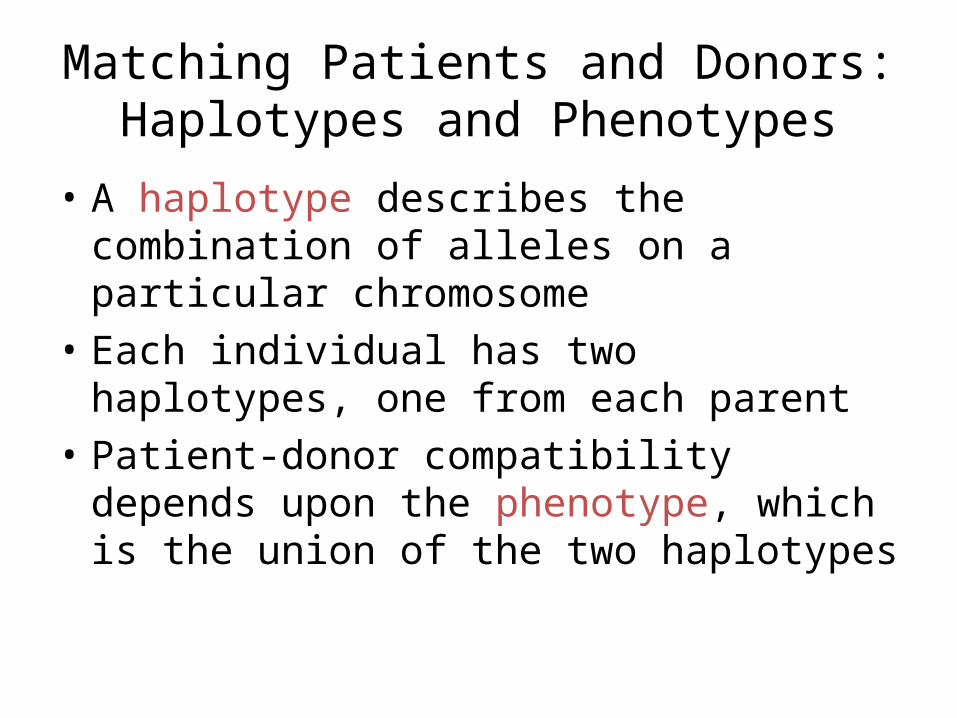
Matching Patients and Donors: Haplotypes and Phenotypes
• A haplotype describes the combination of alleles on a particular chromosome
• Each individual has two haplotypes, one from each parent
• Patient-donor compatibility depends upon the phenotype, which is the union of the two haplotypes

Phenotype Matching
A4B10DR1
A1B3
DR6
A4B3
DR1
A1B10DR6
Phenotype:A1,A4,B3,B10,DR1,DR6
Phenotype:A1,A4,B3,B10,DR1,DR6
These two individuals are of matching phenotype, but do not share the same haplotypes.

Probability of having no match• Let pi
x be fraction of the population of racial group x
that is type i.– We estimate these values using recent data on haplotype
distributions from Kollman, et al. (2007) • Probability that a person of type i has no match in
the registry is
• Probability that a randomly selected person of racial group y has no match in the registry is
x
Rx
ii
xpp 10
0
ii
y
ipp

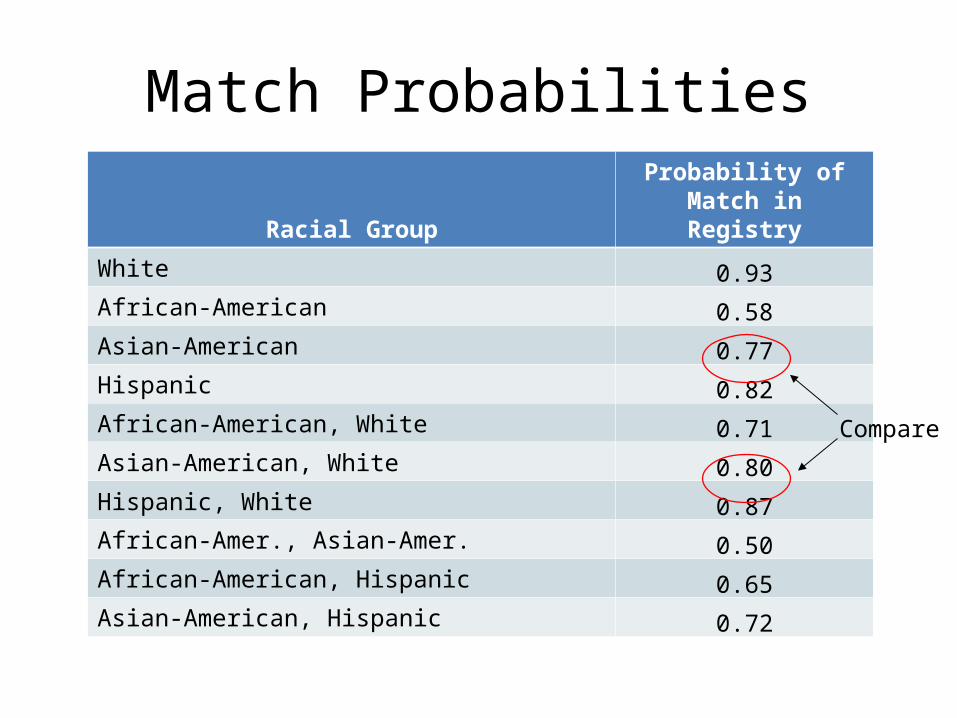
Match Probabilities
Racial GroupProbability of Match
in Registry
White 0.93
African-American 0.58
Asian-American 0.77
Hispanic 0.82
African-American, White 0.71
Asian-American, White 0.80
Hispanic, White 0.87
African-Amer., Asian-Amer. 0.50
African-American, Hispanic 0.65
Asian-American, Hispanic 0.72
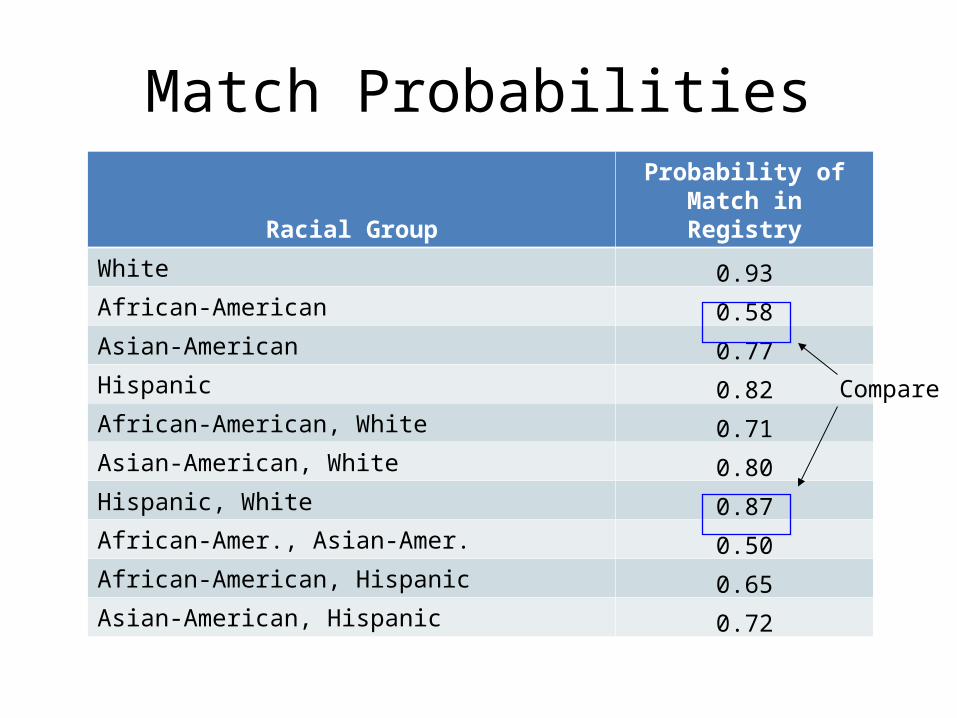
Compare

More Complex Mixed Racial Backgrounds
• Given the distribution of types for biracial individuals, we can calculate type distributions for persons of more complex mixed racial background.
• This calculation is simplified by the fact that the HLA alleles carried by any individual are inherited form just two grandparents.

Mixed Race HLA Genetics
+In the first generation, a
person with two red types has children with a person of two
blue types.
All children in the second generation will have one red type
and one blue type.
orThe children in the third generation have a 50%
chance of having two red types and a 50% chance of
having one red and one blue type.
+Suppose one of these has
children with someone with two red types.
Match probabilities for complex mixed races
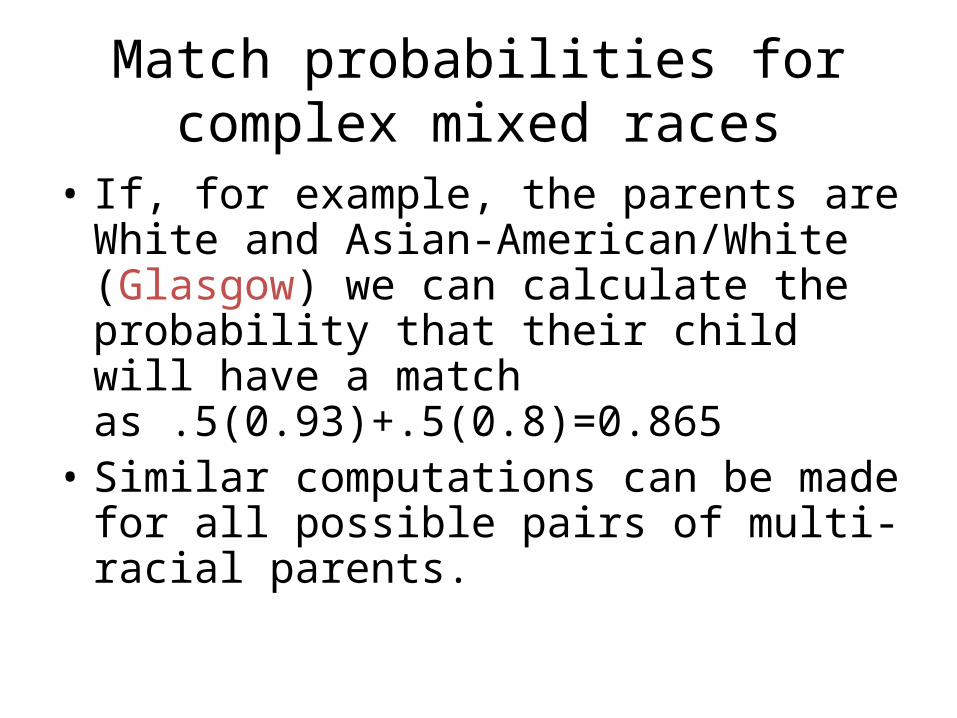
• If, for example, the parents are White and Asian-American/White (Glasgow) we can calculate the probability that their child will have a match as .5(0.93)+.5(0.8)=0.865
• Similar computations can be made for all possible pairs of multi-racial parents.
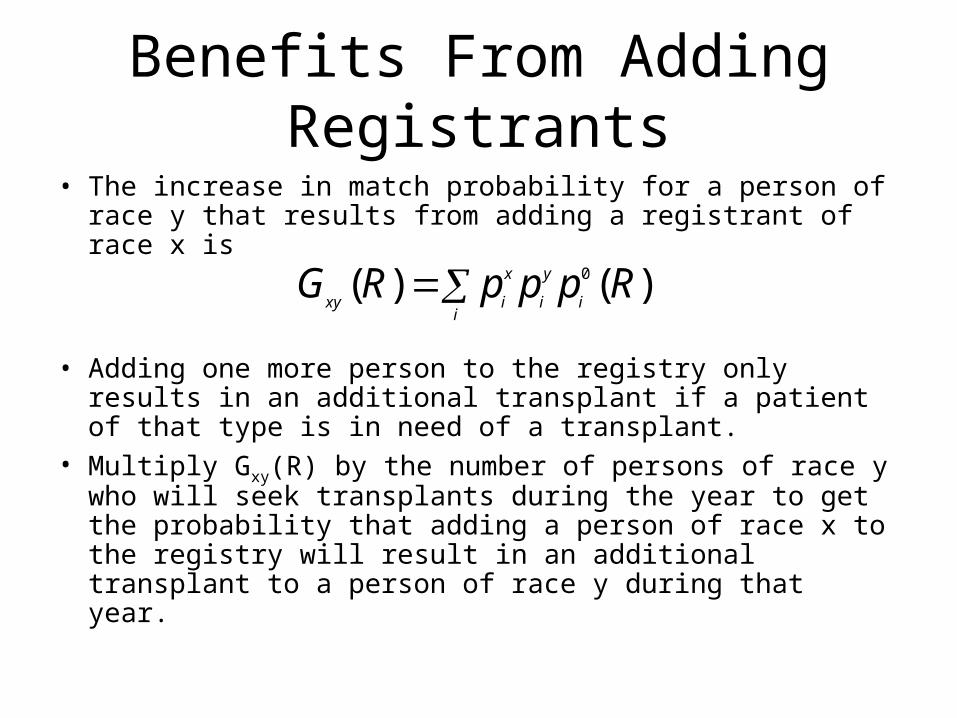
Benefits From Adding Registrants• The increase in match probability for a person of race y that
results from adding a registrant of race x is
• Adding one more person to the registry only results in an additional transplant if a patient of that type is in need of a transplant.
• Multiply Gxy(R) by the number of persons of race y who will seek transplants during the year to get the probability that adding a person of race x to the registry will result in an additional transplant to a person of race y during that year.
)()( 0 RpppRGi
i
y
i
x
ixy

Annual Number of Patients Seeking Transplants by Race
Racial Group Number
White 3,401
African-American 392
Asian-American 205
Hispanic 425
African-American, White 10
Asian-American, White 16
Hispanic, White 22
African-Amer., Asian-Amer. 3
African-American, Hispanic 10
Asian-American, Hispanic 3

Annual Number of Patients Seeking Transplants by Race
Racial Group Number
White 3,401
African-American 392
Asian-American 205
Hispanic 425
African-American, White 10
Asian-American, White 16
Hispanic, White 22
African-Amer., Asian-Amer. 3
African-American, Hispanic 10
Asian-American, Hispanic 3
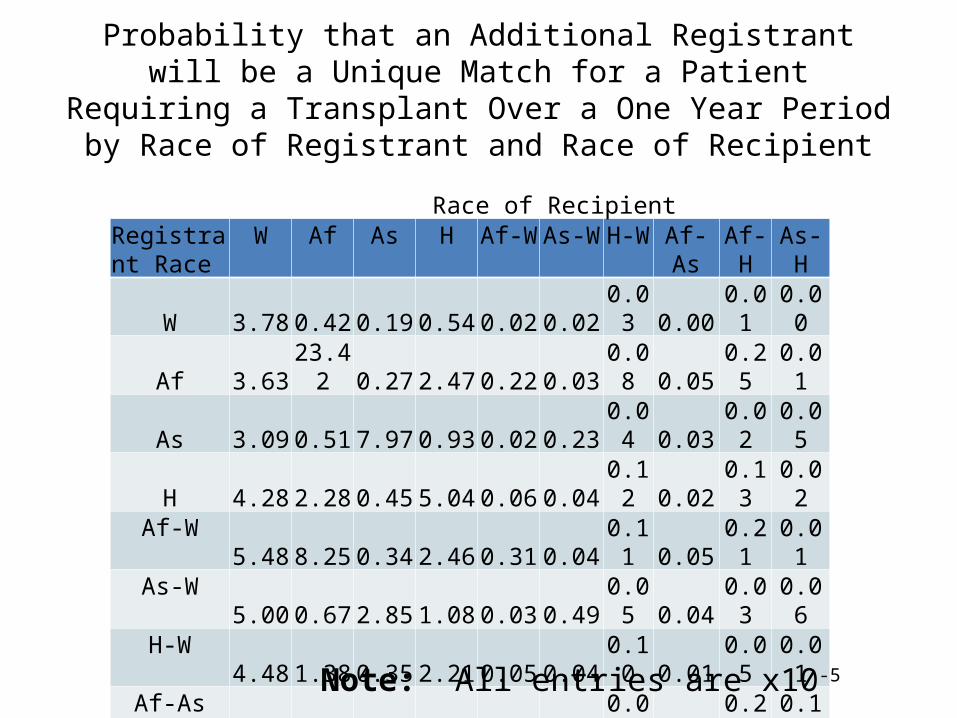
Probability that an Additional Registrant will be a Unique Match for a Patient Requiring a Transplant Over a One Year Period by Race of
Registrant and Race of Recipient
Registrant Race
W Af As H Af-W As-W H-W Af-As Af-H As-H
W 3.78 0.42 0.19 0.54 0.02 0.02 0.03 0.00 0.01 0.00
Af 3.63 23.42 0.27 2.47 0.22 0.03 0.08 0.05 0.25 0.01
As 3.09 0.51 7.97 0.93 0.02 0.23 0.04 0.03 0.02 0.05
H 4.28 2.28 0.45 5.04 0.06 0.04 0.12 0.02 0.13 0.02Af-W 5.48 8.25 0.34 2.46 0.31 0.04 0.11 0.05 0.21 0.01As-W 5.00 0.67 2.85 1.08 0.03 0.49 0.05 0.04 0.03 0.06H-W 4.48 1.38 0.35 2.21 0.05 0.04 0.10 0.01 0.05 0.01Af-As 4.89 7.12 2.41 2.81 0.20 0.24 0.09 0.46 0.22 0.10Af-H 4.84 9.56 0.45 5.47 0.22 0.04 0.12 0.06 0.45 0.02As-H 4.80 1.48 3.48 2.78 0.04 0.34 0.09 0.09 0.07 0.16
Race of Recipient
Note: All entries are x10-5
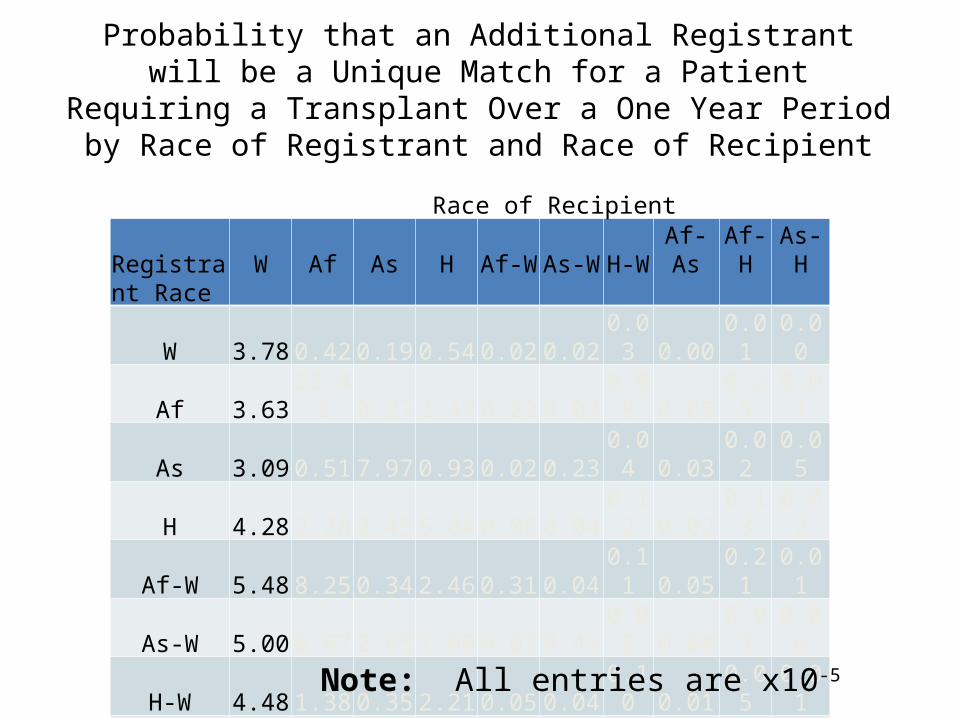
Probability that an Additional Registrant will be a Unique Match for a Patient Requiring a Transplant Over a One Year Period by Race of
Registrant and Race of Recipient
Registrant Race
W Af As H Af-W As-W H-W Af-As Af-H As-H
W 3.78 0.42 0.19 0.54 0.02 0.02 0.03 0.00 0.01 0.00
Af 3.63 23.42 0.27 2.47 0.22 0.03 0.08 0.05 0.25 0.01
As 3.09 0.51 7.97 0.93 0.02 0.23 0.04 0.03 0.02 0.05
H 4.28 2.28 0.45 5.04 0.06 0.04 0.12 0.02 0.13 0.02
Af-W 5.48 8.25 0.34 2.46 0.31 0.04 0.11 0.05 0.21 0.01
As-W 5.00 0.67 2.85 1.08 0.03 0.49 0.05 0.04 0.03 0.06
H-W 4.48 1.38 0.35 2.21 0.05 0.04 0.10 0.01 0.05 0.01
Af-As 4.89 7.12 2.41 2.81 0.20 0.24 0.09 0.46 0.22 0.10
Af-H 4.84 9.56 0.45 5.47 0.22 0.04 0.12 0.06 0.45 0.02As-H 4.80 1.48 3.48 2.78 0.04 0.34 0.09 0.09 0.07 0.16
Race of Recipient
Note: All entries are x10-5

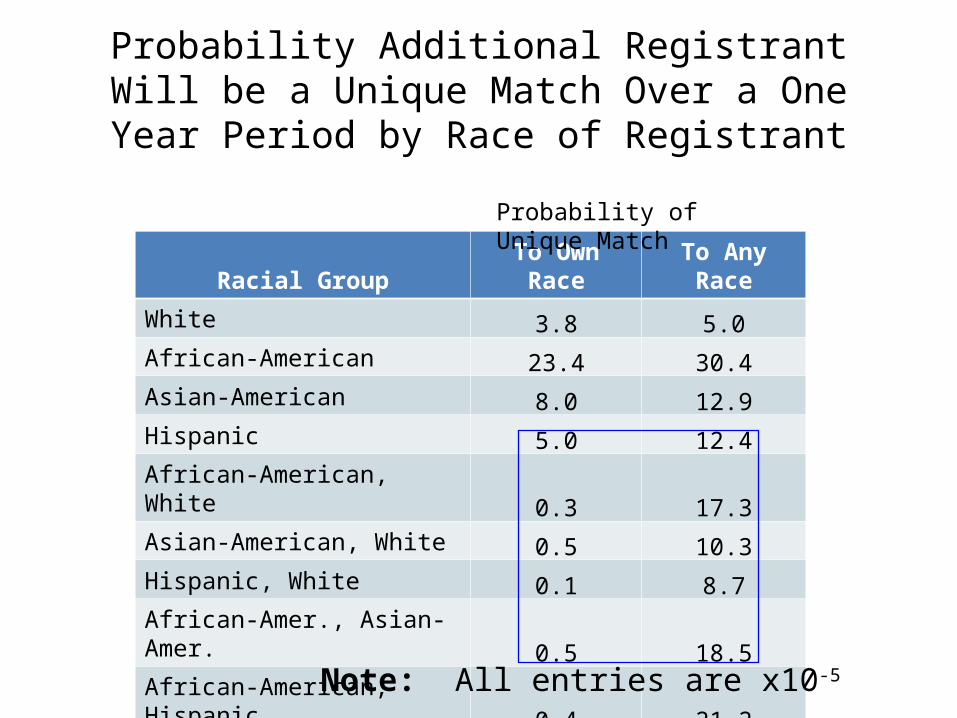
Probability Additional Registrant Will be a Unique Match Over a One Year Period by Race of Registrant
Racial Group To Own Race To Any Race
White 3.8 5.0
African-American 23.4 30.4
Asian-American 8.0 12.9
Hispanic 5.0 12.4
African-American, White 0.3 17.3
Asian-American, White 0.5 10.3
Hispanic, White 0.1 8.7
African-Amer., Asian-Amer. 0.5 18.5
African-American, Hispanic 0.4 21.2
Asian-American, Hispanic 0.2 13.3
Probability of Unique Match
Note: All entries are x10-5

Benefit-Cost of New Registrants• Benefits: Value of lives saved, which depends
upon:– Number of potential transplants– Change in match probability induced by new
registrants– Survival benefit of transplant– Value of statistical life ($6.5 million)
• Costs:– HLA typing of new registrants– Cost of additional transplants performed

Benefit-Cost of New Registrants
Benefit Cost B/C
White $1,300 $297 4.4
African-American $8,100 $800 10.1
Asian-American $3,400 $446 7.6
Hispanic $3,300 $455 7.3
African-American, White $4,600 $549 8.4
Asian-American, White $2,700 $371 7.3
Hispanic, White $2,300 $376 6.2
African-Amer., Asian-Amer. $4,900 $623 7.9
African-American, Hispanic $5,700 $627 9.1
Asian-American, Hispanic $3,600 $450 8.0
SummarySummary• The situation of mixed-race individuals in need of
bone marrow transplants may not be as dire as some have suggested
• There is a strong economic case to be made for expanding the size of the registry among all racial and biracial groups– Benefits to adding mixed race individuals comes
primarily from other races• African-Americans remain the group least likely
to find a match and with the highest benefit-cost ratio for adding more registrants

Thank You