STELLA-JONES REPORTS STRONG 2015 FIRST ...stella-jones.com/pdf/quarterly/STE_Q1 15 Press and...
17
Source: Stella-Jones Inc. Contacts: Éric Vachon, CPA, CA Martin Goulet, CFA Senior Vice-President and Chief Financial Officer MaisonBrison Communications Tel.: (514) 940-3903 Tel.: (514) 731-0000 [email protected] [email protected] STELLA-JONES REPORTS STRONG 2015 FIRST QUARTER RESULTS Annual meeting of shareholders later this morning Sales of $340.7 million, up 32.3% from $257.5 million last year Operating income increased 37.2% to $47.6 million, or 14.0% of sales, up from 13.5% of sales, last year Net income up 33.7% to $30.1 million, compared to $22.5 million last year Montreal, Quebec – April 29, 2015 - Stella-Jones Inc. (TSX: SJ) (“Stella-Jones” or the “Company”) today announced financial results for its first quarter ended March 31, 2015. “We are pleased with these results that show healthy demand in our core markets as well as the strong contribution of our recent acquisition. Furthermore, adjustments in our selling prices in response to higher input costs for untreated railway ties helped us to improve our gross profit margin when compared to recent quarters,” said Brian McManus, President and Chief Executive Officer. Financial highlights (in millions of Canadian dollars, except per share data) Quarters ended March 31, 2015 2014 Sales 340.7 257.5 Operating income 47.6 34.7 Net income for the period 30.1 22.5 Per share - basic ($) 0.44 0.33 Per share - diluted ($) 0.43 0.33 Weighted average shares outstanding (basic, in ‘000s) 68,953 68,737 FIRST QUARTER RESULTS Sales reached $340.7 million, up 32.3% from $257.5 million a year ago. The wood treating facilities acquired from Boatright Railroad Products, Inc. (“Boatright”) on May 22, 2014 generated sales of $21.1 million, while the conversion effect from fluctuations in the value of the Canadian dollar, Stella-Jones’ reporting currency, versus the U.S. dollar, increased the value of U.S. dollar denominated sales by about $29.4 million when compared with last year. Excluding these factors, sales increased approximately $32.7 million, or 12.7%. Railway tie sales amounted to $166.8 million, up 53.5% from $108.6 million last year. Excluding sales from Boatright and the foreign currency conversion effect, railway tie sales rose approximately 21.7%, primarily as a result of adjusted selling prices. Sales of utility poles reached $119.2 million, an increase of 10.9% compared with $107.5 million last year. Factoring out the foreign currency conversion effect, sales increased 1.9%, as a steady rise in sales of distribution poles stemming from regular maintenance projects, was partially offset by slightly lower sales of transmission poles due to the timing of orders for special projects.
Transcript of STELLA-JONES REPORTS STRONG 2015 FIRST ...stella-jones.com/pdf/quarterly/STE_Q1 15 Press and...
Source: Stella-Jones Inc.
Contacts: Éric Vachon, CPA, CA Martin Goulet, CFA
Senior Vice-President and Chief Financial Officer MaisonBrison Communications
Tel.: (514) 940-3903 Tel.: (514) 731-0000
[email protected] [email protected]
STELLA-JONES REPORTS STRONG 2015 FIRST QUARTER RESULTS
Annual meeting of shareholders later this morning
Sales of $340.7 million, up 32.3% from $257.5 million last year
Operating income increased 37.2% to $47.6 million, or 14.0% of sales, up from 13.5%
of sales, last year
Net income up 33.7% to $30.1 million, compared to $22.5 million last year
Montreal, Quebec – April 29, 2015 - Stella-Jones Inc. (TSX: SJ) (“Stella-Jones” or the “Company”) today
announced financial results for its first quarter ended March 31, 2015.
“We are pleased with these results that show healthy demand in our core markets as well as the strong
contribution of our recent acquisition. Furthermore, adjustments in our selling prices in response to higher input
costs for untreated railway ties helped us to improve our gross profit margin when compared to recent quarters,”
said Brian McManus, President and Chief Executive Officer.
Financial highlights
(in millions of Canadian dollars, except per share data)
Quarters ended March 31,
2015 2014
Sales 340.7 257.5
Operating income 47.6 34.7
Net income for the period 30.1 22.5
Per share - basic ($) 0.44 0.33
Per share - diluted ($) 0.43 0.33
Weighted average shares outstanding (basic, in ‘000s) 68,953 68,737
FIRST QUARTER RESULTS
Sales reached $340.7 million, up 32.3% from $257.5 million a year ago. The wood treating facilities acquired
from Boatright Railroad Products, Inc. (“Boatright”) on May 22, 2014 generated sales of $21.1 million, while
the conversion effect from fluctuations in the value of the Canadian dollar, Stella-Jones’ reporting currency,
versus the U.S. dollar, increased the value of U.S. dollar denominated sales by about $29.4 million when
compared with last year. Excluding these factors, sales increased approximately $32.7 million, or 12.7%.
Railway tie sales amounted to $166.8 million, up 53.5% from $108.6 million last year. Excluding sales from
Boatright and the foreign currency conversion effect, railway tie sales rose approximately 21.7%, primarily as a
result of adjusted selling prices.
Sales of utility poles reached $119.2 million, an increase of 10.9% compared with $107.5 million last year.
Factoring out the foreign currency conversion effect, sales increased 1.9%, as a steady rise in sales of
distribution poles stemming from regular maintenance projects, was partially offset by slightly lower sales of
transmission poles due to the timing of orders for special projects.

Sales of residential lumber totalled $28.4 million, up from $17.3 million last year, reflecting higher sales in the
United States due to a strong economy as well as in Western Canada where the Company increased its market
reach in British Columbia. Industrial product sales increased to $19.9 million, compared with $15.8 million a
year ago, mainly due to the contribution of the Boatright assets and the foreign currency conversion effect.
Finally, non-pole-quality log sales were $6.4 million, versus $8.3 million last year, due to the timing of timber
harvesting.
Gross profit reached $66.4 million, or 19.5% of sales, up from $50.3 million, or 19.5% of sales, last year. The
increase in absolute dollars essentially stems from higher business activity, the addition of the Boatright assets
and the effect of currency translation. As a percentage of sales, gross profit was stable year-over-year, as
adjusted pricing for railway has matched the 2014 cost increases of untreated railway ties. As a result of higher
gross profit, operating income increased 37.2% to $47.6 million, or 14.0% of sales, versus $34.7 million, or
13.5% of sales, last year.
Net income for the first quarter of 2015 increased 33.7% to $30.1 million or $0.43 per share, fully diluted,
compared with $22.5 million or $0.33 per share, fully diluted, in the first quarter of 2014.
SOLID FINANCIAL POSITION
As at March 31, 2015, the Company’s long-term debt, including the current portion, stood at $517.2 million
compared with $444.6 million three months earlier. The increase essentially reflects higher working capital
requirements, as per normal seasonal demand patterns, and the effect of local currency translation on U.S. dollar
denominated long-term debt. As at March 31, 2015 Stella-Jones, total debt to total capitalization ratio was
0.40:1, compared with 0.39:1 as at December 31, 2014.
Working capital requirements included the normal seasonal inventory build-up ahead of peak demand in the
second and third quarters. The seasonal inventory build-up was more accentuated in the first quarter of 2015 due
to untreated railway tie availability returning to normal levels, which enabled Stella-Jones to start rebuilding
inventory levels. As a result, the value of inventories stood at $611.5 million as at March 31, 2015, versus
$487.7 million as at December 31, 2014.
LETTER OF INTENT TO ACQUIRE RAM FOREST GROUP INC. AND RAMFOR LUMBER INC.
During the quarter, the Company signed a non-binding letter of intent to purchase the shares of Ram Forest
Group Inc. and Ramfor Lumber Inc. Through its wholly-owned subsidiaries, Ram Forest Products Inc. and Trent
Timber Treating Ltd., Ram Forest Group manufactures and sells pressure treated wood products and accessories
to the retail building materials industry. Ramfor Lumber is a lumber purchasing entity serving Ram Forest
Products and Trent Timber Treating.
Ram Forest Products operates a wood treating facility in Gormley, Ontario and Trent Timber Treating operates a
wood treating facility in Peterborough, Ontario. The wood milling plant operated by Ram Forest Products in
Uxbridge, Ontario is not part of the transaction, and existing Ram Forest Group shareholders will continue to
own this plant. Consolidated sales of the acquired facilities for the fiscal year ended September 30, 2014 reached
approximately $90.2 million.
The transaction, if finalized, is expected to close in October 2015 and is subject to customary conditions,
including satisfactory due diligence, signature of a definitive share purchase agreement and regulatory clearance.
Stella-Jones plans to finance the transaction through its existing revolving credit facility.
“This transaction will expand Stella-Jones’ wood treating capabilities in the residential lumber market and allow
us to build upon Ram Forest Group’s longstanding relationships with key customers. The proposed timetable for
the transaction has been carefully designed to minimize disruption of Ram Forest Group’s operations and ensure
a seamless transition for its customers, suppliers and employees,” added Mr. McManus.

QUARTERLY DIVIDEND OF $0.08 PER SHARE
On April 28, 2015, the Board of Directors declared a quarterly dividend of $0.08 per common share, payable on
June 26, 2015 to shareholders of record at the close of business on June 2, 2015.
OUTLOOK
“As we believe the momentum in the North American economy will continue, demand for our core products
should remain solid in 2015. Stella-Jones remains focussed on enhancing shareholder value by optimizing the
efficiency of its continental network, while seeking selective and accretive opportunities to further expand its
presence in the wood treating industry, as evidenced by the proposed acquisition in Ontario,” concluded Mr.
McManus.
CONFERENCE CALL
Stella-Jones will hold a conference call to discuss these results on April 29, 2015, at 1:30 PM Eastern Time.
Interested parties can join the call by dialing 647-788-4922 (Toronto or overseas) or 1-877-223-4471 (elsewhere
in North America). Parties unable to call in at this time may access a tape recording of the meeting by calling
1-800-585-8367 and entering the passcode 17072554. This tape recording will be available on Wednesday, April
29, 2015 as of 5:30 PM Eastern Time until 11:59 PM Eastern Time on Wednesday, May 6, 2015.
NON-IFRS FINANCIAL MEASURES
Operating income and cash flow from operating activities before changes in non-cash working capital
components and interest and income tax paid are financial measures not prescribed by IFRS and are not likely to
be comparable to similar measures presented by other issuers. Management considers these non-IFRS measures
to be useful information to assist knowledgeable investors regarding the Company’s financial condition and
results of operations as they provide additional measures of its performance.
ABOUT STELLA-JONES
Stella-Jones Inc. (TSX: SJ) is a leading producer and marketer of pressure treated wood products. The Company
supplies North America’s railroad operators with railway ties and timbers, and the continent’s electrical utilities
and telecommunication companies with utility poles. Stella-Jones also provides residential lumber to retailers
and wholesalers for outdoor applications, as well as industrial products for construction and marine applications.
The Company’s common shares are listed on the Toronto Stock Exchange.
Except for historical information provided herein, this press release may contain information and statements of a forward-
looking nature concerning the future performance of the Company. These statements are based on suppositions and
uncertainties as well as on management's best possible evaluation of future events. Such factors may include, without
excluding other considerations, fluctuations in quarterly results, evolution in customer demand for the Company's products
and services, the impact of price pressures exerted by competitors, the ability of the Company to raise the capital required
for acquisitions, and general market trends or economic changes. As a result, readers are advised that actual results may
differ from expected results.
-30-
HEAD OFFICE
3100 de la Côte-Vertu Blvd.
Suite 300
Saint-Laurent, Québec
H4R 2J8
Tel.: (514) 934-8666
Fax: (514) 934-5327
EXCHANGE LISTINGS
The Toronto Stock Exchange
Stock Symbol: SJ
TRANSFER AGENT
AND REGISTRAR
Computershare Investor Services Inc.
INVESTOR RELATIONS
Éric Vachon
Senior Vice-President and
Chief Financial Officer
Tel.: (514) 940-3903
Fax: (514) 934-5327
NOTICE
The condensed interim unaudited consolidated financial statements of Stella-Jones Inc. for the first quarter ended
March 31, 2015 have not been reviewed by the Company’s external auditors.
(Signed)
Éric Vachon Senior Vice-President and Chief Financial Officer
Montréal, Québec April 28, 2015
Stella-Jones Inc.
Condensed Interim Consolidated Financial Statements (Unaudited)
March 31, 2015 and 2014
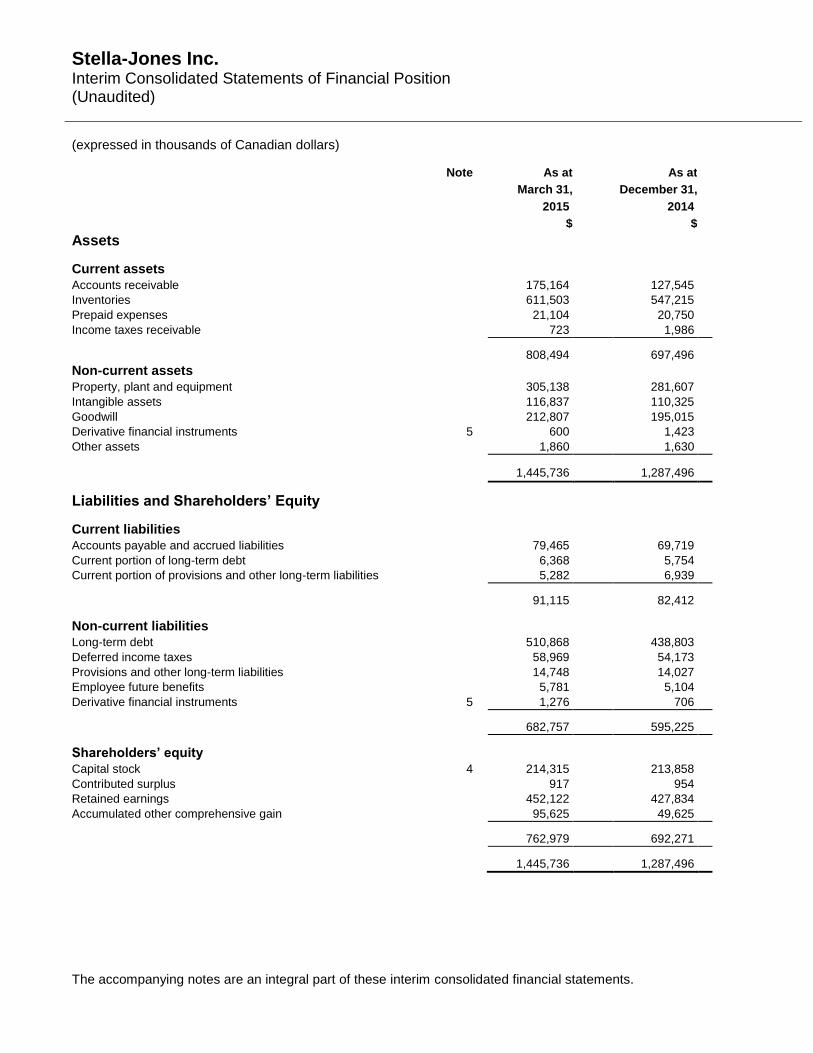
Stella-Jones Inc. Interim Consolidated Statements of Financial Position (Unaudited)
(expressed in thousands of Canadian dollars)
The accompanying notes are an integral part of these interim consolidated financial statements.
Note As at As at
March 31, December 31,
2015 2014
$ $
Assets Current assets
Accounts receivable 175,164 127,545
Inventories 611,503 547,215
Prepaid expenses 21,104 20,750
Income taxes receivable 723 1,986
808,494 697,496
Non-current assets
Property, plant and equipment 305,138 281,607
Intangible assets 116,837 110,325
Goodwill 212,807 195,015
Derivative financial instruments 5 600 1,423
Other assets 1,860 1,630
1,445,736 1,287,496
Liabilities and Shareholders’ Equity Current liabilities
Accounts payable and accrued liabilities 79,465 69,719
Current portion of long-term debt 6,368 5,754
Current portion of provisions and other long-term liabilities 5,282 6,939
91,115 82,412 Non-current liabilities
Long-term debt 510,868 438,803
Deferred income taxes 58,969 54,173
Provisions and other long-term liabilities 14,748 14,027
Employee future benefits 5,781 5,104
Derivative financial instruments 5 1,276 706
682,757 595,225
Shareholders’ equity
Capital stock 4 214,315 213,858
Contributed surplus 917 954
Retained earnings 452,122 427,834
Accumulated other comprehensive gain 95,625 49,625
762,979 692,271
1,445,736 1,287,496
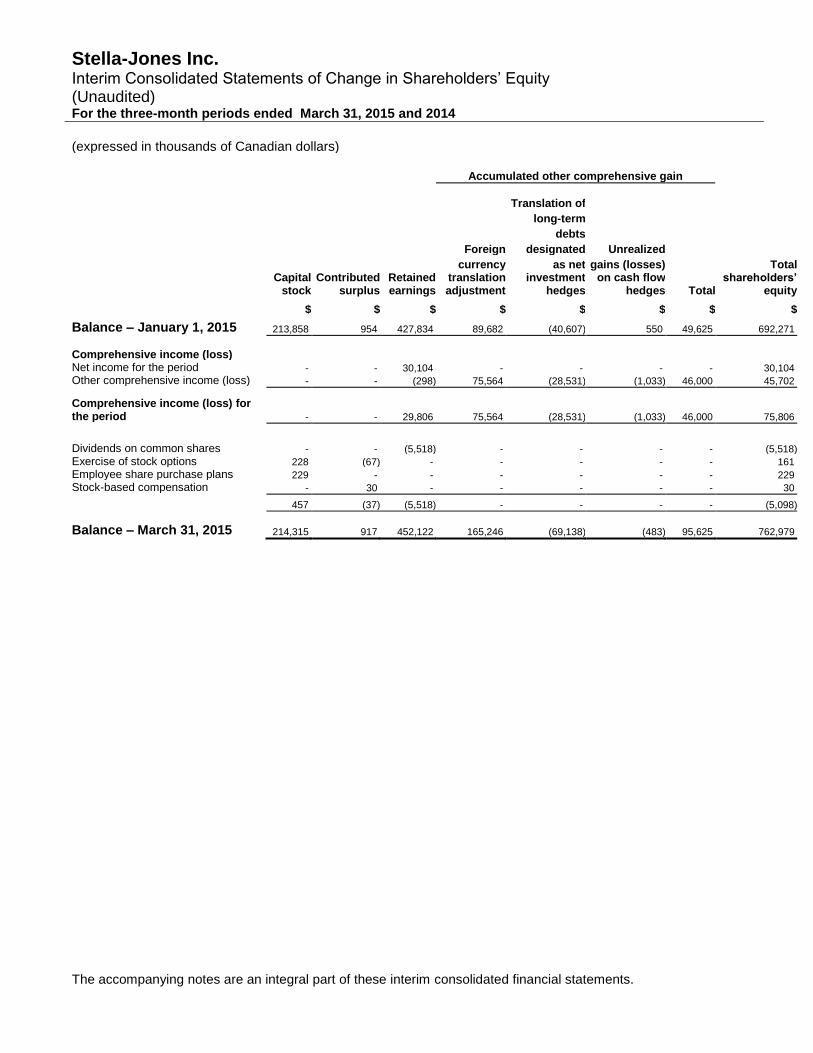
Stella-Jones Inc. Interim Consolidated Statements of Change in Shareholders’ Equity (Unaudited) For the three-month periods ended March 31, 2015 and 2014
(expressed in thousands of Canadian dollars)
The accompanying notes are an integral part of these interim consolidated financial statements.
Accumulated other comprehensive gain
Translation of
long-term
debts
Foreign designated Unrealized
currency as net gains (losses) Total Capital Contributed Retained translation investment on cash flow shareholders’ stock surplus earnings adjustment hedges hedges Total equity
$ $ $ $ $ $ $ $
Balance – January 1, 2015 213,858 954 427,834 89,682 (40,607) 550 49,625 692,271
Comprehensive income (loss)
Net income for the period - - 30,104 - - - - 30,104
Other comprehensive income (loss) - - (298) 75,564 (28,531) (1,033) 46,000 45,702
Comprehensive income (loss) for the period - - 29,806 75,564 (28,531) (1,033) 46,000 75,806
Dividends on common shares - - (5,518) - - - - (5,518)
Exercise of stock options 228 (67) - - - - - 161
Employee share purchase plans 229 - - - - - - 229
Stock-based compensation - 30 - - - - - 30
457 (37) (5,518) - - - - (5,098)
Balance – March 31, 2015 214,315 917 452,122 165,246 (69,138) (483) 95,625 762,979
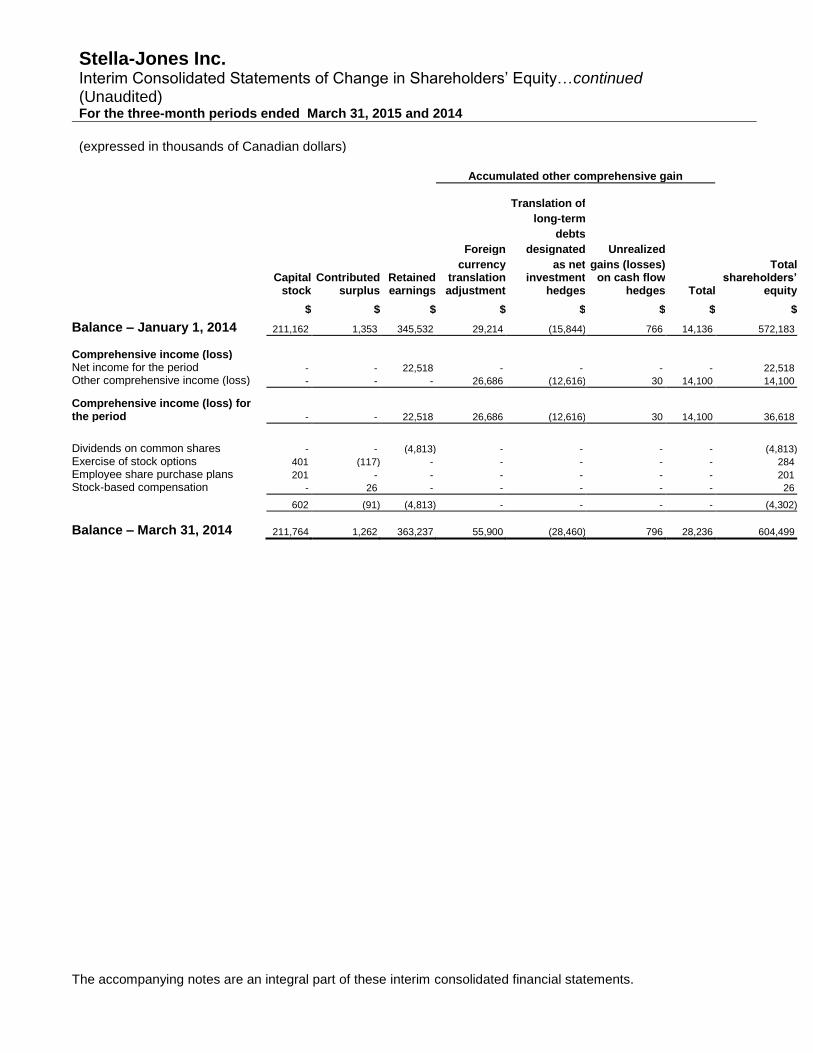
Stella-Jones Inc. Interim Consolidated Statements of Change in Shareholders’ Equity…continued (Unaudited) For the three-month periods ended March 31, 2015 and 2014
(expressed in thousands of Canadian dollars)
The accompanying notes are an integral part of these interim consolidated financial statements.
Accumulated other comprehensive gain
Translation of
long-term
debts
Foreign designated Unrealized
currency as net gains (losses) Total Capital Contributed Retained translation investment on cash flow shareholders’ stock surplus earnings adjustment hedges hedges Total equity
$ $ $ $ $ $ $ $
Balance – January 1, 2014 211,162 1,353 345,532 29,214 (15,844) 766 14,136 572,183
Comprehensive income (loss)
Net income for the period - - 22,518 - - - - 22,518
Other comprehensive income (loss) - - - 26,686 (12,616) 30 14,100 14,100
Comprehensive income (loss) for the period - - 22,518 26,686 (12,616) 30 14,100 36,618
Dividends on common shares - - (4,813) - - - - (4,813)
Exercise of stock options 401 (117) - - - - - 284
Employee share purchase plans 201 - - - - - - 201
Stock-based compensation - 26 - - - - - 26
602 (91) (4,813) - - - - (4,302)
Balance – March 31, 2014 211,764 1,262 363,237 55,900 (28,460) 796 28,236 604,499
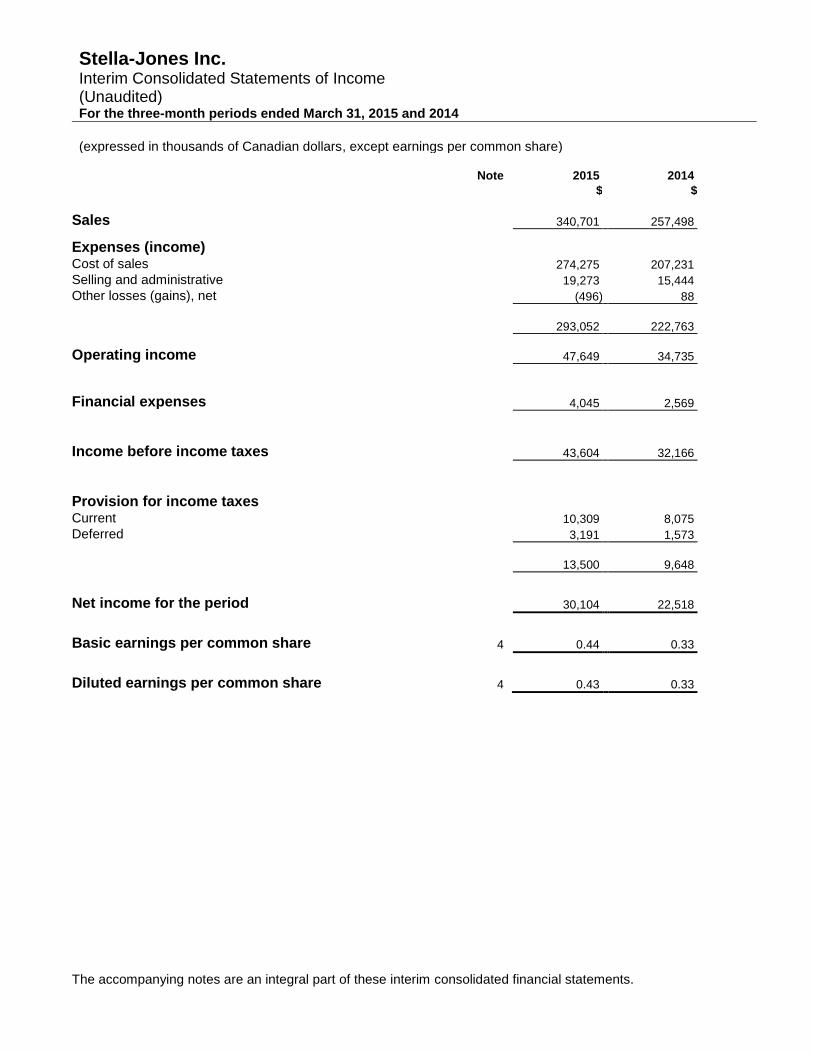
Stella-Jones Inc. Interim Consolidated Statements of Income (Unaudited) For the three-month periods ended March 31, 2015 and 2014
(expressed in thousands of Canadian dollars, except earnings per common share)
The accompanying notes are an integral part of these interim consolidated financial statements.
Note 2015 2014
$ $
Sales 340,701 257,498
Expenses (income)
Cost of sales 274,275 207,231
Selling and administrative 19,273 15,444
Other losses (gains), net (496) 88
293,052 222,763
Operating income 47,649 34,735
Financial expenses 4,045 2,569
Income before income taxes 43,604 32,166
Provision for income taxes
Current 10,309 8,075
Deferred 3,191 1,573
13,500 9,648
Net income for the period 30,104 22,518
Basic earnings per common share 4 0.44 0.33
Diluted earnings per common share 4 0.43 0.33
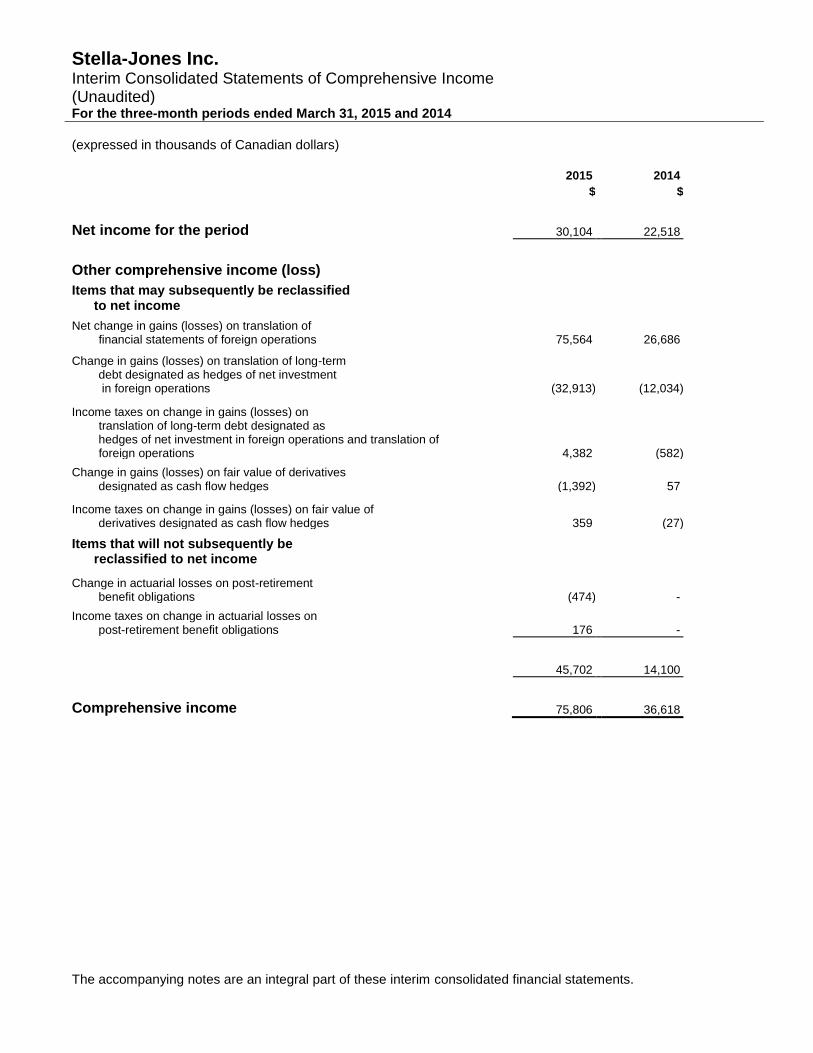
Stella-Jones Inc. Interim Consolidated Statements of Comprehensive Income (Unaudited) For the three-month periods ended March 31, 2015 and 2014
(expressed in thousands of Canadian dollars)
The accompanying notes are an integral part of these interim consolidated financial statements.
2015 2014
$ $
Net income for the period 30,104 22,518
Other comprehensive income (loss)
Items that may subsequently be reclassified to net income
Net change in gains (losses) on translation of financial statements of foreign operations 75,564 26,686
Change in gains (losses) on translation of long-term debt designated as hedges of net investment in foreign operations (32,913) (12,034)
Income taxes on change in gains (losses) on translation of long-term debt designated as hedges of net investment in foreign operations and translation of foreign operations 4,382 (582)
Change in gains (losses) on fair value of derivatives designated as cash flow hedges (1,392) 57
Income taxes on change in gains (losses) on fair value of derivatives designated as cash flow hedges 359 (27)
Items that will not subsequently be
reclassified to net income
Change in actuarial losses on post-retirement benefit obligations (474) -
Income taxes on change in actuarial losses on post-retirement benefit obligations 176 -
45,702 14,100
Comprehensive income 75,806 36,618
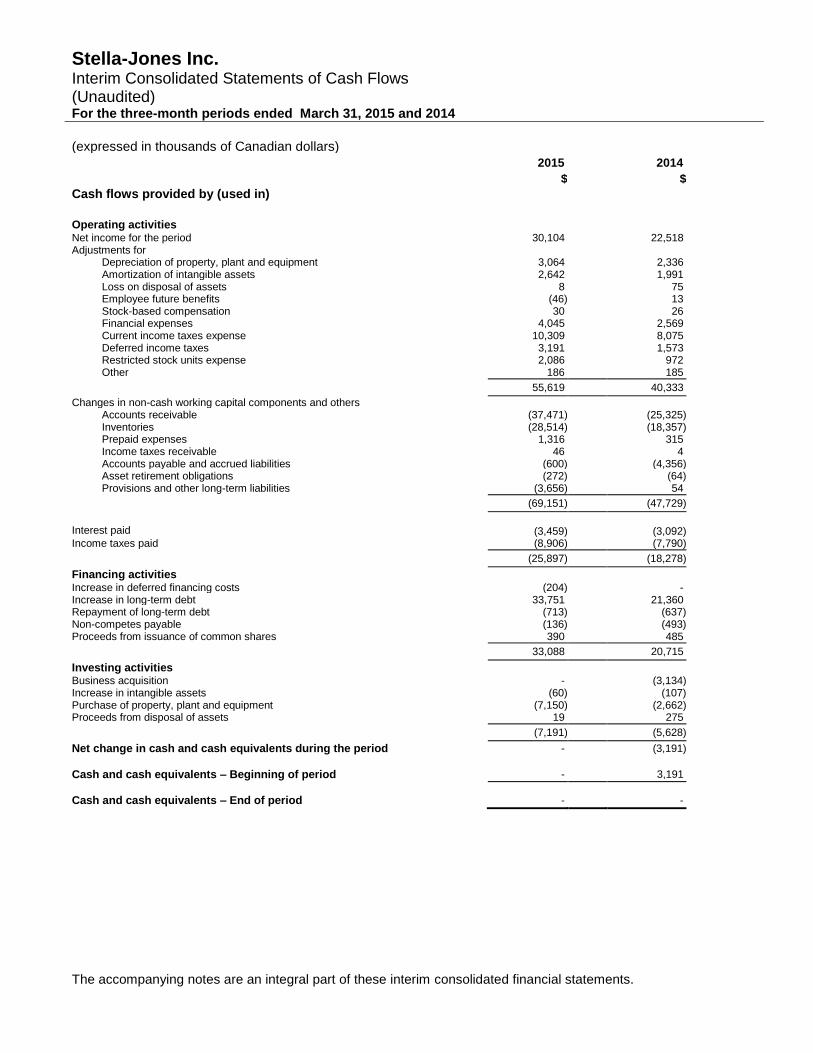
Stella-Jones Inc. Interim Consolidated Statements of Cash Flows (Unaudited) For the three-month periods ended March 31, 2015 and 2014 (expressed in thousands of Canadian dollars)
The accompanying notes are an integral part of these interim consolidated financial statements.
2015 2014
$ $
Cash flows provided by (used in)
Operating activities
Net income for the period 30,104 22,518 Adjustments for
Depreciation of property, plant and equipment 3,064 2,336 Amortization of intangible assets 2,642 1,991 Loss on disposal of assets 8 75 Employee future benefits (46) 13 Stock-based compensation 30 26 Financial expenses 4,045 2,569 Current income taxes expense 10,309 8,075 Deferred income taxes 3,191 1,573 Restricted stock units expense 2,086 972 Other 186 185
55,619 40,333
Changes in non-cash working capital components and others
Accounts receivable (37,471) (25,325) Inventories (28,514) (18,357) Prepaid expenses 1,316 315 Income taxes receivable 46 4 Accounts payable and accrued liabilities (600) (4,356) Asset retirement obligations (272) (64) Provisions and other long-term liabilities (3,656) 54
(69,151) (47,729)
Interest paid (3,459) (3,092) Income taxes paid (8,906) (7,790)
(25,897) (18,278)
Financing activities
Increase in deferred financing costs (204) - Increase in long-term debt 33,751 21,360 Repayment of long-term debt (713) (637) Non-competes payable (136) (493) Proceeds from issuance of common shares 390 485
33,088 20,715
Investing activities
Business acquisition - (3,134) Increase in intangible assets (60) (107) Purchase of property, plant and equipment (7,150) (2,662) Proceeds from disposal of assets 19 275
(7,191) (5,628)
Net change in cash and cash equivalents during the period - (3,191)
Cash and cash equivalents – Beginning of period - 3,191
Cash and cash equivalents – End of period - -
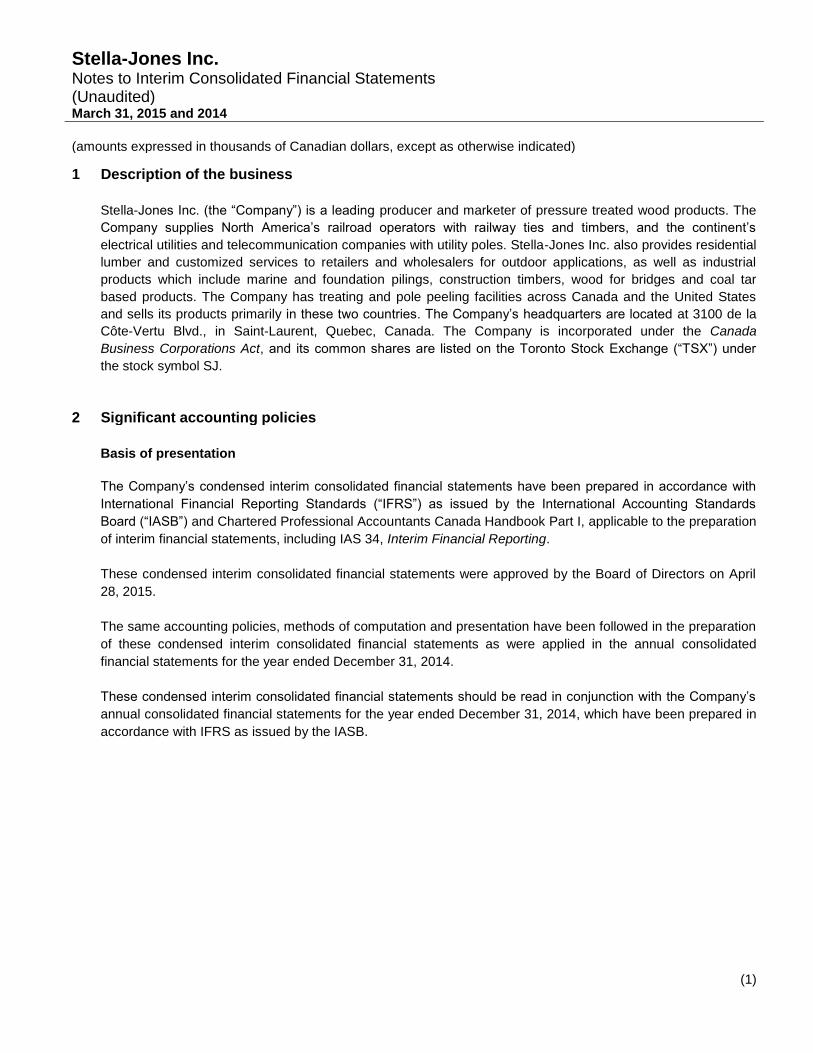
Stella-Jones Inc. Notes to Interim Consolidated Financial Statements (Unaudited) March 31, 2015 and 2014
(amounts expressed in thousands of Canadian dollars, except as otherwise indicated)
(1)
1 Description of the business
Stella-Jones Inc. (the “Company”) is a leading producer and marketer of pressure treated wood products. The
Company supplies North America’s railroad operators with railway ties and timbers, and the continent’s
electrical utilities and telecommunication companies with utility poles. Stella-Jones Inc. also provides residential
lumber and customized services to retailers and wholesalers for outdoor applications, as well as industrial
products which include marine and foundation pilings, construction timbers, wood for bridges and coal tar
based products. The Company has treating and pole peeling facilities across Canada and the United States
and sells its products primarily in these two countries. The Company’s headquarters are located at 3100 de la
Côte-Vertu Blvd., in Saint-Laurent, Quebec, Canada. The Company is incorporated under the Canada
Business Corporations Act, and its common shares are listed on the Toronto Stock Exchange (“TSX”) under
the stock symbol SJ.
2 Significant accounting policies
Basis of presentation
The Company’s condensed interim consolidated financial statements have been prepared in accordance with
International Financial Reporting Standards (“IFRS”) as issued by the International Accounting Standards
Board (“IASB”) and Chartered Professional Accountants Canada Handbook Part I, applicable to the preparation
of interim financial statements, including IAS 34, Interim Financial Reporting.
These condensed interim consolidated financial statements were approved by the Board of Directors on April
28, 2015.
The same accounting policies, methods of computation and presentation have been followed in the preparation
of these condensed interim consolidated financial statements as were applied in the annual consolidated
financial statements for the year ended December 31, 2014.
These condensed interim consolidated financial statements should be read in conjunction with the Company’s
annual consolidated financial statements for the year ended December 31, 2014, which have been prepared in
accordance with IFRS as issued by the IASB.
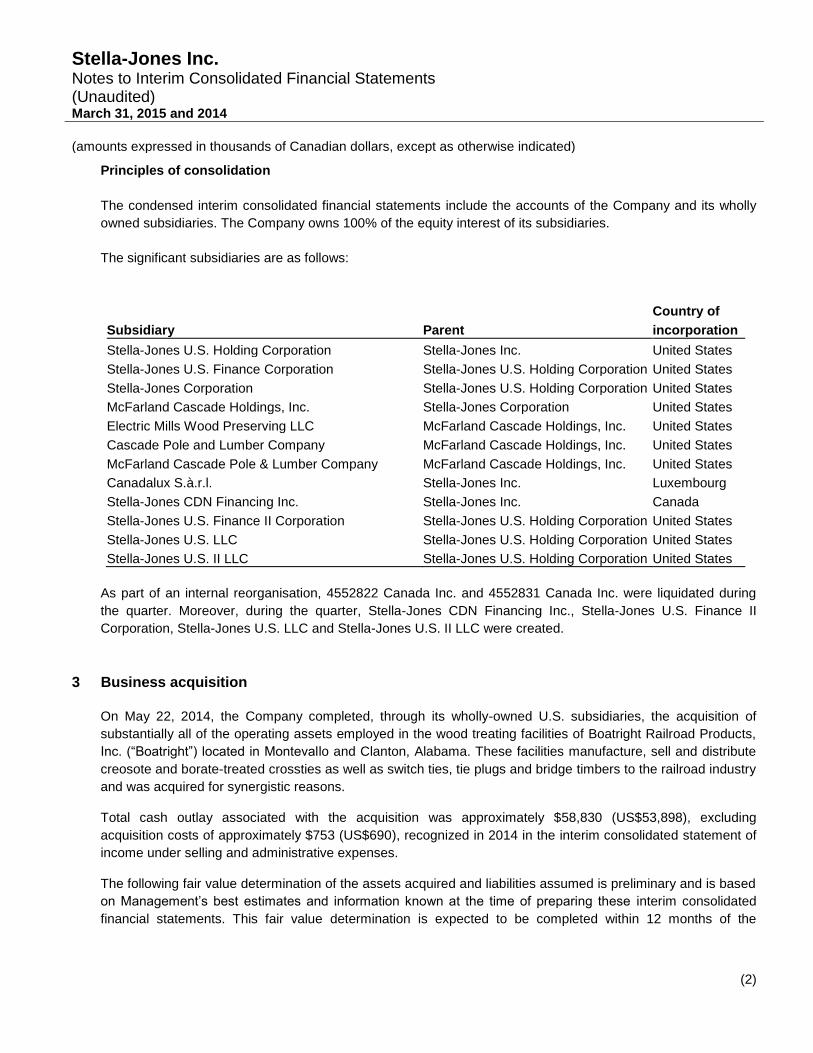
Stella-Jones Inc. Notes to Interim Consolidated Financial Statements (Unaudited) March 31, 2015 and 2014
(amounts expressed in thousands of Canadian dollars, except as otherwise indicated)
(2)
Principles of consolidation
The condensed interim consolidated financial statements include the accounts of the Company and its wholly
owned subsidiaries. The Company owns 100% of the equity interest of its subsidiaries.
The significant subsidiaries are as follows:
Country of
Subsidiary Parent incorporation
Stella-Jones U.S. Holding Corporation Stella-Jones Inc. United States
Stella-Jones U.S. Finance Corporation Stella-Jones U.S. Holding Corporation United States
Stella-Jones Corporation Stella-Jones U.S. Holding Corporation United States
McFarland Cascade Holdings, Inc. Stella-Jones Corporation United States
Electric Mills Wood Preserving LLC McFarland Cascade Holdings, Inc. United States
Cascade Pole and Lumber Company McFarland Cascade Holdings, Inc. United States
McFarland Cascade Pole & Lumber Company McFarland Cascade Holdings, Inc. United States
Canadalux S.à.r.l. Stella-Jones Inc. Luxembourg
Stella-Jones CDN Financing Inc. Stella-Jones Inc. Canada
Stella-Jones U.S. Finance II Corporation Stella-Jones U.S. Holding Corporation United States
Stella-Jones U.S. LLC Stella-Jones U.S. Holding Corporation United States
Stella-Jones U.S. II LLC Stella-Jones U.S. Holding Corporation United States
As part of an internal reorganisation, 4552822 Canada Inc. and 4552831 Canada Inc. were liquidated during
the quarter. Moreover, during the quarter, Stella-Jones CDN Financing Inc., Stella-Jones U.S. Finance II
Corporation, Stella-Jones U.S. LLC and Stella-Jones U.S. II LLC were created.
3 Business acquisition
On May 22, 2014, the Company completed, through its wholly-owned U.S. subsidiaries, the acquisition of
substantially all of the operating assets employed in the wood treating facilities of Boatright Railroad Products,
Inc. (“Boatright”) located in Montevallo and Clanton, Alabama. These facilities manufacture, sell and distribute
creosote and borate-treated crossties as well as switch ties, tie plugs and bridge timbers to the railroad industry
and was acquired for synergistic reasons.
Total cash outlay associated with the acquisition was approximately $58,830 (US$53,898), excluding
acquisition costs of approximately $753 (US$690), recognized in 2014 in the interim consolidated statement of
income under selling and administrative expenses.
The following fair value determination of the assets acquired and liabilities assumed is preliminary and is based
on Management’s best estimates and information known at the time of preparing these interim consolidated
financial statements. This fair value determination is expected to be completed within 12 months of the

Stella-Jones Inc. Notes to Interim Consolidated Financial Statements (Unaudited) March 31, 2015 and 2014
(amounts expressed in thousands of Canadian dollars, except as otherwise indicated)
(3)
acquisition date and consequently, changes could occur mainly with respect to intangible assets, goodwill and
deferred income taxes.
The following is a summary of the assets acquired, the liabilities assumed and the consideration transferred at
fair value as at the acquisition date. The original transaction was made in U.S. dollars and converted into
Canadian dollars as at the acquisition date.
Assets acquired $
Inventories 9,718
Property, plant and equipment 22,527
Customer relationships 17,486
Customer backlog 1,463
Goodwill 23,316
Deferred income tax assets 935
75,445
Liabilities assumed
Accounts payable and accrued liabilities 160
Site remediation provision 3,029
Total net assets acquired and liabilities assumed 72,256
Consideration transferred
Cash 58,830
Unsecured promissory note 13,426
Consideration transferred 72,256
The Company’s valuation of intangible assets has identified customer relationships and customer backlog. The
assigned useful lives are 20 years for customer relationships and 6 months for customer backlog. Significant
assumptions used in the determination of intangible assets, as defined by Management, include year-over-year
sales growth, discount rate and operating income before depreciation and amortization margin. Goodwill is
amortized and deductible for U.S. tax purposes, and represents the future economic value associated with the
increased distribution network, acquired workforce and synergies with the Company’s operations. For
impairment test purposes, goodwill is allocated to cash generating units, which are defined as either plants
specialized in the treatment of utility poles or plants specialized in the treatment of railway ties. In the case of
the Boatright acquisition, goodwill is allocated to plants specialized in the treatment of railway ties.
The Company financed the acquisition through a combination of its existing committed revolving credit facility
and an unsecured promissory note of $15,466 (US$14,169), bearing interest at 1.93% and repayable in 5 equal
instalments over a 5-year period. The unsecured promissory note was fair-valued at $13,426 (US$12,301),
using an interest rate of 7.0%.
Stella-Jones Inc. Notes to Interim Consolidated Financial Statements (Unaudited) March 31, 2015 and 2014
(amounts expressed in thousands of Canadian dollars, except as otherwise indicated)
(4)
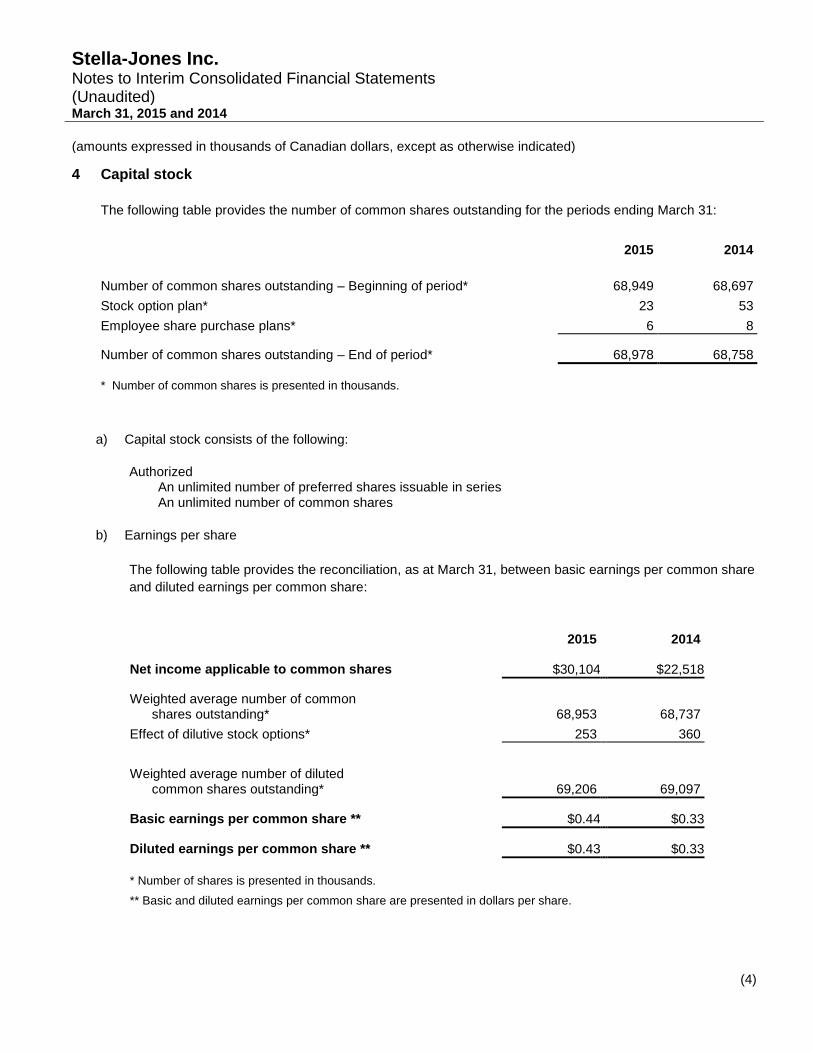
4 Capital stock
The following table provides the number of common shares outstanding for the periods ending March 31:
2015 2014
Number of common shares outstanding – Beginning of period* 68,949 68,697
Stock option plan* 23 53
Employee share purchase plans* 6 8
Number of common shares outstanding – End of period* 68,978 68,758
* Number of common shares is presented in thousands.
a) Capital stock consists of the following:
Authorized An unlimited number of preferred shares issuable in series An unlimited number of common shares
b) Earnings per share
The following table provides the reconciliation, as at March 31, between basic earnings per common share
and diluted earnings per common share:
2015 2014 Net income applicable to common shares $30,104 $22,518
Weighted average number of common shares outstanding* 68,953 68,737
Effect of dilutive stock options* 253 360
Weighted average number of diluted common shares outstanding* 69,206 69,097
Basic earnings per common share ** $0.44 $0.33
Diluted earnings per common share ** $0.43 $0.33
* Number of shares is presented in thousands.
** Basic and diluted earnings per common share are presented in dollars per share.

Stella-Jones Inc. Notes to Interim Consolidated Financial Statements (Unaudited) March 31, 2015 and 2014
(amounts expressed in thousands of Canadian dollars, except as otherwise indicated)
(5)
5 Fair value measurement and financial instruments
The following table provides information about assets and liabilities measured at fair value in the statement of
financial position and categorized by level according to the significance of the inputs used in making the
measurements:
As at March 31, 2015 As at December 31, 2014
Significant other observable inputs
(Level 2)
Significant other observable inputs
(Level 2)
$ $
Recurring fair value measurements Assets
Derivatives - Interest rate swap 600 1,423
600 1,423
Liabilities
Derivatives - Interest rate swap 1,276 706
1,276 706
The fair value of these financial instruments has been estimated using the discounted future cash flow method
and has been classified as Level 2 in the fair value hierarchy as per IFRS 7, Financial Instruments: Disclosures,
as it is based mainly on observable market data, namely government bond yields and interest rates. A
description of each level of the hierarchy is as follows:
Level 1: Quoted prices (unadjusted) in active markets for identical assets or liabilities.
Level 2: Inputs other than quoted prices included within Level 1 that are observable for these assets or liabilities, either directly (i.e. as prices) or indirectly (i.e. derived from prices).
Level 3: Inputs for the assets or liabilities that are not based on observable market data (unobservable inputs).
Financial instruments that are not measured at fair value on the statement of financial position are represented
by cash, restricted cash and cash equivalents, accounts receivable, accounts payable and long-term debt. The
fair values of cash equivalents, accounts receivable and accounts payable approximate their carrying values
due to their short term nature. The long-term debt had a carrying value of $517,236 (December 31, 2014 –
$444,557) and a fair value of $517,222 (December 31, 2014 – $444,575).

Stella-Jones Inc. Notes to Interim Consolidated Financial Statements (Unaudited) March 31, 2015 and 2014
(amounts expressed in thousands of Canadian dollars, except as otherwise indicated)
(6)
6 Seasonality
The Company’s operations follow a seasonal pattern, with utility pole, railway tie and industrial product
shipments strongest in the second and third quarters to provide industrial end-users with product for their
summer maintenance projects. Residential lumber sales follow the same seasonal pattern. Inventory levels of
railway ties and utility poles are typically highest in the first quarter in advance of the summer shipping season.
The first and fourth quarters usually generate similar sales.
7 Segment information
The Company operates within one business segment, which is the production and sale of pressure treated
wood and related services.
8 Subsequent events
a) On April 7, 2015, the Company completed, through its wholly-owned U.S. subsidiary, the acquisition of
certain assets of McCormick Piling and Lumber Co. (“McCormick”), a provider of untreated wood poles.
McCormick operates a wood pole peeling yard located in Warren, Oregon. This acquisition will enhance the
Company’s wood procurement operations. The total consideration for this transaction was $6,538
(US$5,236), including working capital of $2,188 (US$1,752) and excluding estimated acquisition costs of
$226. The Company financed the acquisition through a combination of its existing committed revolving
credit facility and two unsecured promissory notes. The first unsecured promissory note of $1,429
(US$1,144) bears interest at 0.48%, is repayable in a single instalment on April 8, 2016 and was fair valued
at $1,342, using an interest rate of 7.0%. The second unsecured promissory note of $928 (US$743) bears
interest at 0.48%, is repayable in a single instalment on April 8, 2017 and was fair valued at $805, using an
interest rate of 7.0%.
b) On April 28, 2015, the Board of Directors declared a quarterly dividend of $0.08 per common share payable
on June 26, 2015 to shareholders of record at the close of business on June 2, 2015.