Stefan Dercon, University of Oxford John Hoddinott ...
30
The Ethiopian Rural Household Surveys 1989-2009: Introduction Stefan Dercon, University of Oxford John Hoddinott, International Food Policy Research Institute July 20, 2011 Stefan Dercon, Department of Economics, University of Oxford;. [email protected] John Hoddinott, International Food Policy Research Institute, Washington DC; [email protected] . Many staff at IFPRI and CSAE as well as our Ethiopian collaborators have contributed to the creation of the public release version of these data. In particular, we would like to thank Tassew Woldehanna for his excellent work as the 2004 Field Director and Yisehac Yohannes for his sterling work in helping organize the 1999 and 2004 data files.
Transcript of Stefan Dercon, University of Oxford John Hoddinott ...

The Ethiopian Rural Household Surveys 1989-2009: Introduction
Stefan Dercon, University of Oxford
John Hoddinott, International Food Policy Research Institute
July 20, 2011
Stefan Dercon, Department of Economics, University of Oxford;. [email protected] John Hoddinott, International Food Policy Research Institute, Washington DC; [email protected]. Many staff at IFPRI and CSAE as well as our Ethiopian collaborators have contributed to the creation of the public release version of these data. In particular, we would like to thank Tassew Woldehanna for his excellent work as the 2004 Field Director and Yisehac Yohannes for his sterling work in helping organize the 1999 and 2004 data files.

2
1. Introduction The Ethiopia Rural Household Survey (ERHS) is a unique longitudinal household data set covering households in a number of villages in rural Ethiopia. Data collection started in 1989, when a team visited 6 farming villages in Central and Southern Ethiopia. In 1989, IFPRI conducted a survey in seven Peasant Associations located in the regions Amhara, Oromiya and the Southern Ethiopian People’s Association (SNNPR). Civil conflict prevented survey work from being undertaken in Tigray. Under extremely difficult field conditions, household data were collected in order to study the response of households to food crises. The study collected consumption, asset and income data on about 450 households. In 1994, the survey was expanded to cover 15 villages across the country.1 An additional round was conducted in late 1994, with further rounds in 1995, 1997, 1999, 2004 and 2009. In addition, nine new villages were selected giving a sample of 1477 households. The nine additional communities were selected to account for the diversity in the farming systems in the country, including the grain-plough areas of the Northern and Central highlands, the enset-growing areas and the sorghum-hoe areas. Topics addressed in the survey include household characteristics, agriculture and livestock information, food consumption, health, women’s activities, as well as community level data on electricity and water, sewage and toilet facilities, health services, education, NGO activity, migration, wages, and production and marketing. These surveys have been supervised by the Economics Department, Addis Ababa University (Economics/AAU), the Centre for the Study of African Economies (CSAE), University of Oxford and the International Food Policy Research Institute (IFPRI), Washington DC.
This document updates an earlier public release of these data (Dercon and Hoddinott, 2004). It provides an overview of the history behind the collection of these data; an explanation of the sampling strategy; the extent to which these data can be considered representative; information on the timing of the surveys; how the different data files can be linked within and across survey rounds; and describes some idiosyncrasies associated with the individual survey rounds. The data and supporting documentation are found in the following folders:
- Podcasts. This folder contains short videos of Stefan Dercon and Tassew Woldehanna describing the origins of the ERHS and the implementation of the surveys in the field.
- Village materials. This folder contains 15 pdf files with each file corresponding to a qualitative village study (see section 2 for more details). It also includes jpg files with maps of each surveyed village;
- hh_data. This folder contains seven zipped files with each file corresponding to a single survey round;
- Questionnaires. This folder contains seven pdf files with each file corresponding to the survey instrument used in each round;
- and
1 In Ethiopia, the smallest unit of aggregation is the Peasant Association, an administrative unit of one or a small number of villages. In this documentation, we use “Peasant Association” and “village” interchangeably.

3
- Aggregates. This folder contains a series of files containing aggregated information on consumption, household demographics, land and health.
- conversions. This folder contains a series of files with information on converting local units to standard units.
Should you choose to use these data – and we do hope you will find them useful –
we would like you to note the following. First, all papers and documents using these data must contain the following acknowledgement:
These data have been made available by the Economics Department, Addis Ababa University, the Centre for the Study of African Economies, University of Oxford and the International Food Policy Research Institute. Funding for data collection was provided by the Economic and Social Research Council (ESRC), the Swedish International Development Agency (SIDA) and the United States Agency for International Development (USAID); the preparation of the public release version of these data was supported, in part, by the World Bank. AAU, CSAE, IFPRI, ESRC, SIDA, USAID and the World Bank are not responsible for any errors in these data or for their use or interpretation.
Second, ERHS data collection has occurred as part of a capacity-building project. Users are encouraged to conduct their research on the ERHS in collaboration with researchers of the Economics Department of Addis Ababa University. At a minimum, they should send copies of papers produced using these data to the Economics Department, Addis Ababa University. 2. Nine basics all users should know
i) Background information on the survey sites In conjunction with the implementation of the 1994 and 1995 survey rounds, village profiles were constructed for all 15 villages. These are based on qualitative fieldwork, secondary sources, interviews with key informants and community level questionnaires. These profiles locate each village in time and space, include maps showing where these villages are found, describe seasonal activities and events, outline the most important economic and reproductive activities, outline local institutions, organizations, values and beliefs, and relationships with other communities and Ethiopian society. The development of these profiles was overseen by Dr Philippa Bevan, University of Bath and Dr Alula Pankhurst, Addis Ababa University. They are found in the folder “Village Studies.” In addition to being of considerable value in their own right, users should consult these profiles when reviewing their quantitative results if they wish to avoid idiotic mistakes in interpretation. ii) Data comparability across rounds The 1989 survey instrument was based on addressing a narrow set of questions. At the time the 1989 survey was fielded, there was no intention of creating a longitudinal data
4
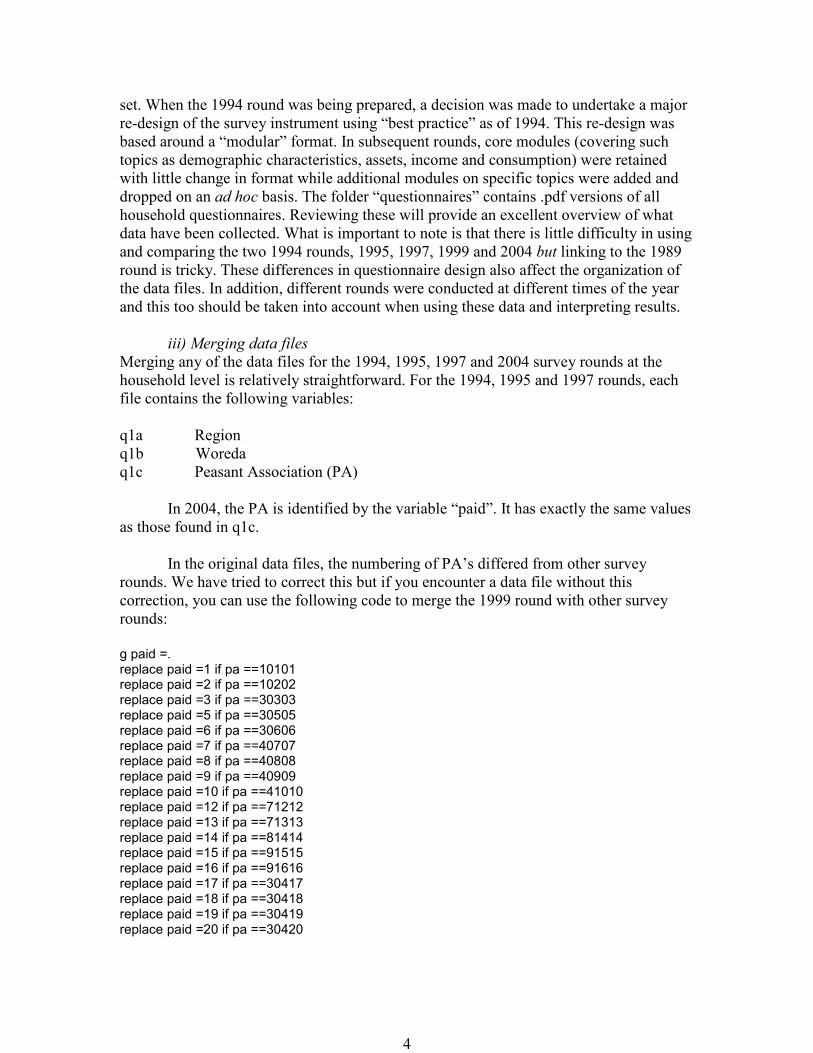
set. When the 1994 round was being prepared, a decision was made to undertake a major re-design of the survey instrument using “best practice” as of 1994. This re-design was based around a “modular” format. In subsequent rounds, core modules (covering such topics as demographic characteristics, assets, income and consumption) were retained with little change in format while additional modules on specific topics were added and dropped on an ad hoc basis. The folder “questionnaires” contains .pdf versions of all household questionnaires. Reviewing these will provide an excellent overview of what data have been collected. What is important to note is that there is little difficulty in using and comparing the two 1994 rounds, 1995, 1997, 1999 and 2004 but linking to the 1989 round is tricky. These differences in questionnaire design also affect the organization of the data files. In addition, different rounds were conducted at different times of the year and this too should be taken into account when using these data and interpreting results. iii) Merging data files Merging any of the data files for the 1994, 1995, 1997 and 2004 survey rounds at the household level is relatively straightforward. For the 1994, 1995 and 1997 rounds, each file contains the following variables: q1a Region q1b Woreda q1c Peasant Association (PA)
In 2004, the PA is identified by the variable “paid”. It has exactly the same values as those found in q1c.
In the original data files, the numbering of PA’s differed from other survey rounds. We have tried to correct this but if you encounter a data file without this correction, you can use the following code to merge the 1999 round with other survey rounds: g paid =. replace paid =1 if pa ==10101 replace paid =2 if pa ==10202 replace paid =3 if pa ==30303 replace paid =5 if pa ==30505 replace paid =6 if pa ==30606 replace paid =7 if pa ==40707 replace paid =8 if pa ==40808 replace paid =9 if pa ==40909 replace paid =10 if pa ==41010 replace paid =12 if pa ==71212 replace paid =13 if pa ==71313 replace paid =14 if pa ==81414 replace paid =15 if pa ==91515 replace paid =16 if pa ==91616 replace paid =17 if pa ==30417 replace paid =18 if pa ==30418 replace paid =19 if pa ==30419 replace paid =20 if pa ==30420

5
drop if paid==.
In addition, each file contains a household identifier. The name of this variable differs a bit from round to round but is always the same for a given survey round. Specifically: Round Variable Name Label 1994, round 1 q5 HH number for this survey 1994, round 2 q2 HH number for this survey 1995 q2 HH number for this survey 1997 q1d HH number for this survey 1999 hhnumber HH number for this survey 2004 hhid HH number for this survey
Note that the household identifiers are unique within each village but are not
unique across villages. Peasant Association identifiers are unique and so unique household identifiers can be constructed by combining the region, PA and household identifier like so:
unique hh identifier = q1a∙100000 + q1c∙1000 + hh number for this round The files in the 1989 survey all contain the variable HHID, which identifies the
household. This variable is also the key to link with 1994a ERHS data and is constructed in the same way as the unique hh identifier described above (ie. HHID = Region ∙ 100000 + PA ∙ 1000 + hh number for this round). Note that there are a few odd cases where the HHID is greater than 999 and you should for the presence of these before constructing the identifier. iv) Data format All data are provided in STATA Version 11 format. Virtually all variables are labeled.
v) Other survey rounds
Data have also been collected in 2009. This data will be made available in the future. vi) Making sense of dates Ethiopia uses the Julian calendar, which is seven years, eight months behind the Gregorian (Western) calendar. In the survey instruments, the documentation and the data files, dates using the Ethiopian calendar are denoted by the suffix EC. There are 13 months in an Ethiopian year. Twelve months consist of 30 days and one, Pagume, consists of five (six in a leap year). The Ethiopian New Year begins on the first day of Meskerem or 11 September (12 September in a leap year). vii) The number of villages (1)

6
Even though a tab of the variable q1c lists 18 Peasant Associations/villages, there really is only data for 15 villages. The largest village, Debre Berhan, is divided into four parts each with its own identifier (17, 18, 19 and 20). viii) The number of villages (2) In 1999, three additional villages - Oda Dawata, Bako Tibe and Somodo were surveyed. The principal focus of the 1999 survey round was agricultural productivity interest and it was felt that adding villages in higher productivity villages would be informative. There was not sufficient funding to re-survey these villages in 2004. ix) Attrition Attrition, at the household level, is low. Just under 8 per cent of the sample was lost between 1994 and 1999, and a further 5.2 percent were lost from 1999 and 2004. The attrition rate between 1994 and 2004 is 13.2 percent or 1.3 percent per year. This is low. Our sense is that attrition results partly from site specific factors (for example, the extension of the Lalibela airport resulted in a loss of agricultural land in the village of Shumsha and, we suspect, the departure of some of our sample households; Doma is a resettlement village and some households may have decided to return to their original villages) and certain household characteristics, such as tiny (<0.25 ha) land holdings, and small (1 or 2 person) households as of 1994. Regressions that incorporate village or household fixed effects controls will purge estimates of the effect of non-random attrition to the extent that this correlated with time invariant characteristics. 3. Overview of the surveys In 1989, IFPRI conducted a survey in seven Peasant Associations located in the regions Amhara, Oromiya and the Southern Ethiopian People’s Association (now called SNNPR), see Webb, von Braun and Yohannes (1992). Civil conflict prevented survey work from being undertaken in Tigray. Under extremely difficult field conditions, household data were collected in order to study the response of households to food crises. The study collected consumption, asset and income data on about 450 households. Households were randomly selected within each Peasant Association, while the Peasant Associations selected were mainly areas that had suffered from the 1984-1985 famine and other droughts that followed between 1987 and 1989. At least four of the areas are considered particularly vulnerable, while two (Debre Berhan and Adele Keke) may be less vulnerable but still suffered from the famine (See also Dercon and Krishnan 1995).
In 1994, CSAE and Economics/AAU started a panel survey incorporating six of the seven villages earlier surveyed in 1989 by IFPRI. (The remaining village in a semi-pastoralist area in Southern Ethiopia could not be revisited again because of violent conflict in the area). In these villages, the tracing rule was based on the definition of a panel household, a household that had still members of the 1989 household living in the village. This meant that a household was kept in the sample even if the head of the household had left or died. About 8 percent of the households had a different head, in most cases the spouse of the earlier head. In these six villages, the attrition rate was less than 7 per cent. The fact that households cannot obtain land when moving to other areas

7
is clearly part of the explanation of the low attrition rate. In these villages, an attempt was made to re-randomize the sample by including an exact proportion of newly formed or arrived households in the sample, as well by replacing the lost households by households which were considered by village elders and officials as broadly similar to in demographic and wealth terms as the households which could not be traced. Households formed out of households interviewed in 1989 were also interviewed, usually sons or daughters who after marriage formed their own household.
In addition, nine new villages were selected giving a sample of 1477 households. The nine additional communities were selected to account for the diversity in the farming systems in the country, including the grain-plough areas of the Northern and Central highlands, the enset-growing areas and the sorghum-hoe areas (see map at the end of this document). The practical constraints of running a panel household survey (some of our villages are more than 1000km apart in a country where top speeds on the best roads rarely exceed 50km/hour) had to be reconciled with the methodological problems related to sampling. Farming systems were considered a much more important stratification basis than administrative boundaries. While in the context of sampling theory, one could argue that the sampling frame to select the villages was strictly stratified in the main agro-ecological zones and sub-zones, and one to three villages per strata was selected, it should be remembered that we have sampled only 15 of the thousands of villages in rural Ethiopia.
The sampling in the villages newly included in 1994 was relatively
straightforward. A list of all households was constructed with the help of the local Peasant Association (PA) officials. (PAs were set up in the aftermath of the 1974 revolution, after which a programme of land reform had been started. The PA was responsible for the implementation of the land reform and held wide ranging powers as a local authority. All land is owned by the government. To obtain land, households have to register with the PA and lists of the households allocated land are kept.) Up to the late 1980s, they were responsible for the programme of continuous land redistribution that was meant to keep land tenure closely linked to household size and needs. Although this continuous land redistribution has, in principle, ceased, registration with the PA remains essential for farm households. In virtually all villages, therefore, there were good lists of the households in the village which could be used as a sampling frame.
Within each village, random sampling was used, stratified by female headed and non-female headed households, including (as explained above) an attempt to re-randomize the 1989 study villages, via extra sampling from new entrants, splits and newly formed households. The information available for ex-ante or ex-post weighing of the sample when pooled is limited. The available population figures for Ethiopia at the time of the survey were based on a questionable census of 1984, while linking farming systems to population figures turned out not to be straightforward. In most villages in which interviews took place in 1989 this procedure also implied an increase of the sample size in those villages. A complete redrawing of administrative boundaries since then meant that linking the provisional census figures from the 1994 census to the farming systems is just as difficult. Sampling size in each village was governed by an attempt to
8
obtain a self-weighting sample, when considered in terms of farming system: each person (approximately) represents the same number of persons from the main farming systems. The advantage is that pooling of the data is simplified, although alternative procedures could easily have been implemented.
It had been suggested that in some areas landlessness is increasing, since with the absence of redistribution and a ban on land sales and rental against fixed payment no legal mechanisms exist for young households to acquire land in land constrained areas. To make sure that these households were properly represented we stratified the sample within each village to ensure a representative number of landless households to be included. In practice, in most areas this resulted only in a very small number of landless households to be included. Similarly, we made sure that an exact proportion of female headed households were included via stratification.
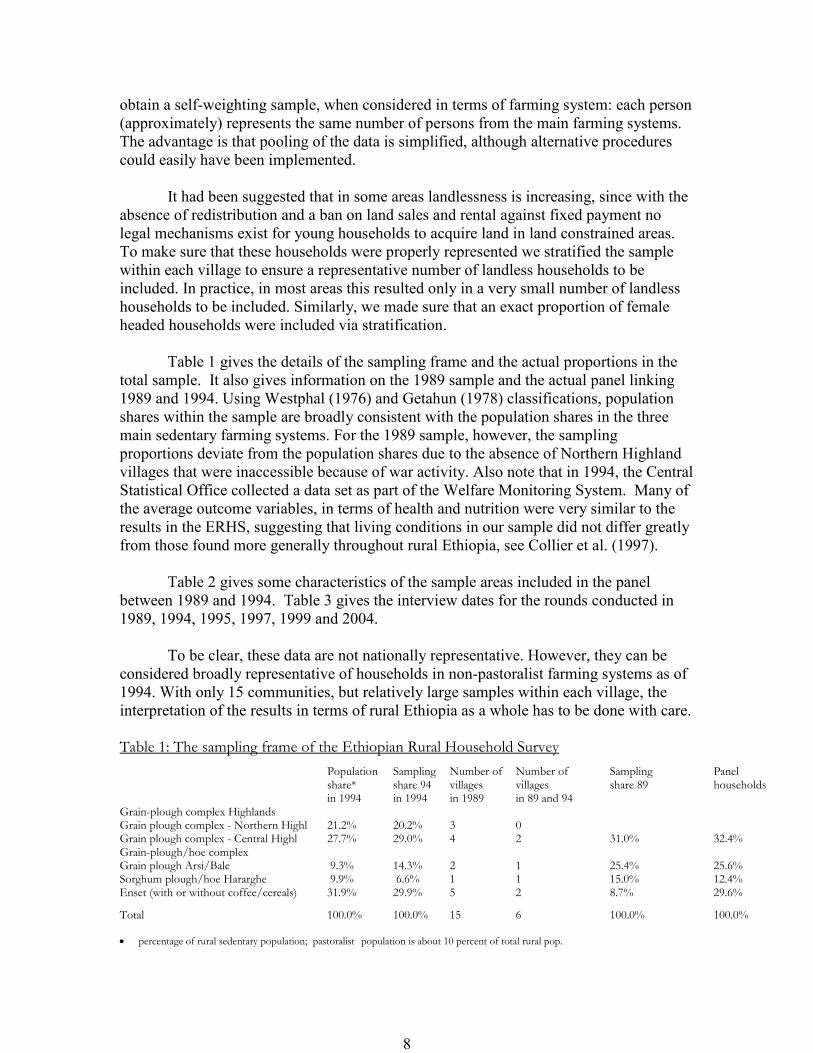
Table 1 gives the details of the sampling frame and the actual proportions in the total sample. It also gives information on the 1989 sample and the actual panel linking 1989 and 1994. Using Westphal (1976) and Getahun (1978) classifications, population shares within the sample are broadly consistent with the population shares in the three main sedentary farming systems. For the 1989 sample, however, the sampling proportions deviate from the population shares due to the absence of Northern Highland villages that were inaccessible because of war activity. Also note that in 1994, the Central Statistical Office collected a data set as part of the Welfare Monitoring System. Many of the average outcome variables, in terms of health and nutrition were very similar to the results in the ERHS, suggesting that living conditions in our sample did not differ greatly from those found more generally throughout rural Ethiopia, see Collier et al. (1997).
Table 2 gives some characteristics of the sample areas included in the panel between 1989 and 1994. Table 3 gives the interview dates for the rounds conducted in 1989, 1994, 1995, 1997, 1999 and 2004.
To be clear, these data are not nationally representative. However, they can be considered broadly representative of households in non-pastoralist farming systems as of 1994. With only 15 communities, but relatively large samples within each village, the interpretation of the results in terms of rural Ethiopia as a whole has to be done with care. Table 1: The sampling frame of the Ethiopian Rural Household Survey Population Sampling Number of Number of Sampling Panel share* share 94 villages villages share 89 households in 1994 in 1994 in 1989 in 89 and 94 Grain-plough complex Highlands Grain plough complex - Northern Highl 21.2% 20.2% 3 0 Grain plough complex - Central Highl 27.7% 29.0% 4 2 31.0% 32.4% Grain-plough/hoe complex Grain plough Arsi/Bale 9.3% 14.3% 2 1 25.4% 25.6% Sorghum plough/hoe Hararghe 9.9% 6.6% 1 1 15.0% 12.4% Enset (with or without coffee/cereals) 31.9% 29.9% 5 2 8.7% 29.6% Total 100.0% 100.0% 15 6 100.0% 100.0% • percentage of rural sedentary population; pastoralist population is about 10 percent of total rural pop.

9
• Sources: CSA Population estimates, own estimated and Westphal, (1977).

10
Table 2: Characteristics of the sample sites Survey site Location Background Main crops Perennial crops?
Mean Rainfall mm Haresaw Tigray Poor and vulnerable area. Cereals no 558 Geblen Tigray Poor and vulnerable area; used to be quite wealthy. Cereals no 504 Dinki N. Shoa Badly affected in famine in 84/85; not easily accessible even though near Debre
Berhan. Millet, teff no 1664
Debre Berhan N.Shoa Highland site. Near town. Teff, barley, beans no 919 Yetmen Gojjam Near Bichena. Ox-plough cereal farming system of highlands. Teff, wheat and beans no 1241 Shumsha S.Wollo Poor area in neighbourhood of airport near Lalibela. Cereals no 654 Sirbana Godeti Shoa Near Debre Zeit. Rich area. Much targeted by agricultural policy. Cereal, ox-plough
system. Teff no 672
Adele Keke Hararghe Highland site. Drought in 85/86 Millet, maize, coffee, chat yes, no food 748 Korodegaga Arssi Poor cropping area in neighbourhood of rich valley. Cereals no 874 Turfe Kechemane S.Shoa Near Shashemene. Ox-plough, rich cereal area. Highlands. Wheat, barley, teff, potatoes yes, some 812 Imdibir Shoa (Gurage) Densely populated enset area. Enset, chat, coffee, maize yes, including food 2205 Aze Deboa Shoa (Kembata) Densely populated. Long tradition of substantial seasonal and temporary migration. Enset, coffee, maize, teff,
sorghum yes, including food 1509
Addado Sidamo (Dilla) Rich coffee producing area; densely populated. Coffee, enset yes, including food 1417 Gara Godo Sidamo (Wolayta) Densely packed enset-farming area. Famine in 83/84. Malaria in mid-88. Barley, enset yes, including food 1245 Doma Gama Gofa Resettlement Area (1985); Semi-arid; droughts in 85, 88,89,90; remote. Enset, maize yes, some 1150
Source: Community survey ERHS, Webb and von Braun (1994), Bevan and Pankhurst (1996).

11
Table 3: Timing of activities and of the surveys Survey site Location Main Harvest
Survey Round
Time of Interview
1989 Round 1 1994
Round 2 1994-95
Round 3 1995
Round 4 1997
Round 5 1999
Round 6 2004
Haresaw Tigray October-November
June-July January March June August April
Geblen Tigray October-November
June-July January March June September May
Dinki N. Shoa December March April March-April November January October, November
August May, June
Debre Berhan N.Shoa November-December
March-April March-April October March June - August July April, May
Yetmen Gojjam November-December
March-April October March September, October
June May, June
Shumsha S.Wollo October-December
June-July December-January
May October, November
September April, May
Sirbana Godeti Shoa November-December
March-April November March June, July June April, May
Adele Keke Hararghe November-December
November-December
May-June October April October, November
June April, May
Koro-degaga Arssi October-November
November-December
May-June November-December
May- June June, July August May
Turfe Kechemane
S.Shoa December March-April September-October
March- April September, October
June May, June
Imdibir Shoa (Gurage) October-December
March-April October March June, July June April, May
Aze Deboa Shoa (Kembata)
October-November
March-April September-October
March September, October
June July
Addado Sidamo (Dilla) December-January
March-April January March June, July September April, May
Gara Godo Sidamo (Wolayta)
August-December
March March-May October March June, July June April, May
Doma Gama Gofa September-December
May-June April-May December-January
May-June November September May, June
Source: Community survey ERHS and Bevan and Pankhurst (1996).

12
4. The 1989 data
The data collection was a complicated process, using different questionnaires - which contained common parts - for the different Peasant Associations. The file “1989 survey instruments by village.doc” describes the survey instruments used in each village and the file “ERHS_hhquestionnaire_1989.pdf” shows what the questionnaire looked like.
The data were entered by Peasant Association and that structure has been retained
here. Because of the complicated structure of the original questionnaire, data were re-organized into 12 themes.
1. Food consumption and expenditure 2. Household income files from all sources 3. Area planted, harvested and values of production by year 4. Household members, age sex, birth, death etc. 5. Number of adults, females, males, etc. at household level 6. Livestock current holdings and recall 7. Livestock mortality and types of food consumed during the worst year 8. Values of farm and non-farm assets sold by year 9. Present values of farm and non-farm assets 10. Assets 11. Harvest use 12. Farm history For some themes, there are pooled files that contain information across all Peasant
Associations and data per Peasant Association. 1. Food consumption and expenditure files: original quantity units, unit codes,
kilograms, calories, food and non-food expenditures, per capita annual incomes Survey site File name Comments Debre Berhan debxcly.dta Dinki dinxcly.dta Arssi arsxcly.dta No expenditure on non-food items Harerghe harxcly.dta Wolayta wolxcly.dta Gamogofa gamxcly.dta No expenditure on non-food items Sidamo sidxcly.dta Pooled files across sites
ethxly.dta In Arssi and Gamogofa total expenditure = food expenditure only

13
2. Household income files from all sources: also include area planted and production series, value of production for 1980 EC (1988) Survey site File name Comments Debre Berhan debinc5.dta Area and production 1978-80 EC Dinki dininc5.dta Area and production 1976-80 EC Arssi arsinc5.dta Area and production 1976-80 EC Harerghe haryrev4.dta Area and production 1976-80 EC Wolayta wolinc5.dta Area and production 1976-80 EC Gamogofa gaminc6.dta Area and production 1976-80 EC Sidamo sidinc5.dta Area and production 1980 EC only Pooled files across sites ethyrev.dta Includes only income variable from all sites
3. Area planted, harvested and values of production by year: Note that these files
differ from income files by values of production for all of the recalled years 1976-80 EC Survey site File name Comments Debre Berhan debprodv.dta Dinki dinprodv.dta Arssi arsprodv.dta Harerghe harprodv.dta Wolayta wolprodv.dta Gamogofa gamprodv.dta Sidamo sidprodv.dta Pooled files across sites ethprodv.dta
4. Household members age, sex, birth, death, etc.
Survey site File name Comments Debre Berhan debdemo4.dta Dinki dindemo4.dta Arssi no file Harerghe hardemo4.dta Wolayta woldemo4.dta Gamogofa no file Sidamo siddemo4.dta
5. Number of adults, females, males, etc. at household level
Survey site File name Comments Debre Berhan debfmly.dta Dinki dinfmly.dta Arssi no file Harerghe harfmly.dta Wolayta wolfmly.dta Gamogofa no file Sidamo sidfmly.dta

14
6. Livestock current holdings and recall
Survey site File name Comments Debre Berhan deblvs5.dta 1979-80 EC Dinki dinlvs5.dta 1977-81 EC Arssi arslvs5.dta 1979-80 EC Harerghe harlvs5.dta 1980 EC Wolayta wollvs5.dta 1980 EC Gamogofa gamlvs5.dta 1979-80 EC Sidamo sidlvs5.dta 1979-80 EC Pooled files across sites
ethlvs2.dta Note the incomplete series for most of the sites: livestock ownership, head count, TLU equivalents, values of deaths, slaughter, sales, purchases, etc.
tlsu80.dta 1980 EC livestock ownership and death, head count and TLU equivalents
7. Livestock mortality and types of food consumed during the worst year: Data are
pooled from site-specific drought experience files File name Comments wyrlvs.dta Livestock mortality and ownership in 1980 etc crisfud.dta Types of food consumed during the worst years
8. Values of farm and non-farm assets sold by year
Survey site File name Comments Debre Berhan solddeb.dta Dinki solddin.dta Arssi soldars.dta Harerghe soldhar.dta Wolayta soldwol.dta Gamogofa soldgam.dta Sidamo soldsid.dta
9. Present values of farm and non-farm assets
Survey site File name Comments Debre Berhan assetdeb.dta Dinki assetdin.dta Arssi assetars.dta Harerghe assethar.dta Wolayta assetwol.dta Gamogofa assetgam.dta Sidamo assetsid.dta

15
10. Assets: Present values of farm and non-farm, and values of personal possessions sold: data pooled across all sites File name Comments ethastes.dta Values of assets by year, assets values for the worst years are also contained
in this file
11. Harvest use: Use of meher and belg harvest, data pooled across sites. File name Comments harvuse.dta Contents are percentages, for actual kg figures refer to original files for each
of the survey sites
12. Farm history: Recall of pre-1974 tenurial and payments/receipts File name Comments pre74.dta Pooled across all sites
5. Data from 1994, 1995, 1997, 1999 and 2004 As explained above, data from these rounds are much more comparable. Each survey followed a similar format and each questionnaire begins with a table of contents listing what is covered in each round and so it is relatively easy to quickly get a sense of what can and cannot be done with these data. Because the survey instruments cover more ground than those used in 1989, we only detail the contents of the 1999 (which contained considerably more information on agricultural related issues than the other surveys) and 2004 round here; see Appendices 1 and 2 for details. This comparability has also meant that it has been possible to devise a common naming convention for files. All files are named as follows: rxpxsx_.dta Where:
rx refers to the round (Round 1 is the first round fielded in 1994, round 2 was fielded in late 1994, round 3 in 1995, round 4 in 1997, round 5 in 1999 and round 6 in 2004);
px refers to the part of the questionnaire. Rounds 1-3 had three parts, round 4 had five parts. Rounds 5 and 6 have four parts. and sx refers to the section within that part. There are a number of cases where a single file covers more than one section. These are written as s8t10, ie. sections 8 to 10 are found within a single file.
16
6. Aggregate files Included with these data are a series of “aggregate files” that hold information on consumption, some demographics, land, livestock and agricultural production. Aggregates: 1989 Aggregated data are available on consumption levels and household demographic characteristics. Note that while the 1994-questionnaire is partially modeled on the 1989 one questionnaire, differences have to be taken into account. Because the 1989 survey used other price information, conversion codes and other principles for the data cleaning that could not be replicated in 1994, most of the variables are not directly comparable between 1989 and 1994a. To solve this problem, a series of variables were recalculated using the initial 1989 raw data and questionnaire. Even for the recalculated information, difficulties remain when comparing the 1989 data with the 1994a ERHS data. First of all the survey was not conducted in exactly the same months in each site, so that comparison has to be done with care. Table 3 (above) gives details of the timing of the survey. Other differences have to be taken into account as well. For the consumption data for example, the list of items prompted for in 1994 was slightly longer, since following piloting it was found that more items were commonly consumed than asked for in 1989. The 1989 survey contains less specific information on this issue. Some of the items you find in the 1994a survey are in principle in the ‘other items’ in the 1989 questionnaire. The fact that the list was shorter ex-post in 1989 than 1994 could simply be due to shortages before the reforms and at the height of the economic crisis of the late 1980s. Although the consumption information from the six villages surveyed in 1994 is available for 363 households, due to the extremely difficult survey conditions, data on both food and non-food consumption were collected in only four villages (i.e. for 213 households), while only food consumption data were collected in the other two villages. Aggregates: 1994-95, 1997, 1999 and 2004 These files include matched panel data over these rounds for consumption, land, livestock and agricultural production.
Note that in round 1 and 2, two non-food level files are needed for full non-food data. In round 3, 3 files were needed. Note also different recall periods in each type of file. In the first round, a one week recall for household consumables was used while in round 2 and 3 this was increased to one month, since it was an error. Food consumption files include some observations like cigarettes and chat. Non-food files also contain these items. This requires careful correcting in aggregating. Also, some non-food items in the file may better not be included in the consumption aggregate, since items are rare, expenditures lumpy and some are arguably non-consumption expenditure (e.g. ceremonial expenditures, iddir and equb contribiutions, etc.). If values were available from within the questionnaire, such as on purchased consumption expenditure, these were also used. If only quantities were available, then they were converted into kilograms or litres and subsequently valued using consumption price data.

17
The file consumptionaggregates_123456.dta includes consumption aggregates, adult equivalent scales and poverty lines. Note that consumption aggregates include all food consumption in the last week, scaled to a month (by 4.28), including purchased, from own stock and gifts. To this purchased meals were added. Non-food consumption items were restricted to direct consumables (matches, soap, linen, clothes) but exclude school and health expenditure, as well as taxes and extraordinary contributions.
The land file shows the level of household land holdings; these data are expressed in hectares using a land conversion file. Livestock_aggreggates_123456 contain nominal values of livestock holdings and tropical livestock units for each round as well as recall data for the year prior to the survey. Information on oxen ownership for selected rounds is found in oxen_13456.dta.
Also included is a zipped file containing information – for the principal crops
grown by these households – on output, area planted and yields. Lastly, the files conv.dta, landconv.dta, prodconv.dta and unitconv.dta contain a
complete set of codes for the 1994-95 rounds. 7. Conversion files The data files are provided in a format that should be sufficient to allow anyone to do effective analysis, while offering clear chooses on valuation and aggregation procedures. However, many quantities are expressed in ‘local’ units and not all quantities (for example, consumption of food from own production) are not expressed in monetary values. Finally, land is still expressed in local units. Standardizing these is non-trivial. Our own fieldwork suggested that each community uses a variety of units and these are often not easily comparable across communities or easily expressed in ‘standard’ units. Land units have proved to be particularly tricky to deal. Some local units (e.g. Zhir) are length not area measures. At the community level, surveys and tests were conducted to provide as many conversions into standard units as possible. Unit conversions The zipped file “basic_conv” contains the following files in both STATA and SPSS format. You need these to convert your data: Prodconv.sav/Prodconv.dta: to ensure that all product codes are unified across sections and rounds of the questionnaire. These files contain all the item (or product) codes for production as well as consumption data used in the various rounds and provides a unified item code called item123. This file is necessary due to a revision of codes that took place after round 1. Unitconv.sav/Unitconv.dta: to ensure that all unit codes are unified across sections and rounds of the questionnaire. These files contain the unit codes used in different rounds

18
and provides a unified list of unit codes called unit123. This file is necessary due a revision of codes that took place after round 1. Conv_rev.sav/conv_rev.dta: to convert all ‘local’ measurement units in metric units. This file contains a conversion factor for each item and unit to convert into kilograms. The codes for item1234 and for unit1234 are the same as the ones for item123 and unit123 in the two files above. The conversion factors are based on surveys on local measurement units that took place during round 3 of the survey. Landconv.sav/Landconv.dta. This file contains the community level conversion codes to convert local land units into hectare. Note that some of these units (e.g. Zhir) pose particular problems due to the fact these local units are effectively length and not area measures. You could now proceed in two ways: carefully merge these files with your data and perform the manipulations required; or use and adjust the spss syntax files to suit your purposes. They will perform the exact procedures needed. Landconversion.sps. Provides an example file of converting land units into hectares.

19
Bibliography Collier, P., S. Dercon and J. Mackinnon (1997), Social Sector Review - Per II, Ministry of Finance, Government of Ethiopia Dercon, S. and P. Krishnan (1996), “A consumption-based measure of poverty in Ethiopia 1989-1994” in: M. Tadesse and B. Kebede, Poverty and Economic Reform in Ethiopia, Proceedings Annual Conference of the Ethiopian Economic Association. Dercon S., and P. Krishnan (1998) “Changes in Poverty in Rural Ethiopia 1989-1995: Measurement, Robustness Tests and Decomposition” , Working Paper Series /98-7, Centre for the Study of African Economies, Oxford. Getahun (1978), Report on Framing Systems in Ethiopia, Ministry of Agriculture, Government of Ethiopia Webb, P., J. Von Braun and Y. Yohannes (1992), “Famine in Ethiopia: Policy Implication of Coping Failure at National and Household Levels”, Research Report no. 92, International Food Policy Research Institute, Washington D.C. Westphal (1976), “Farming Systems in Ethiopia”, FAO

20
Appendix: Ethiopian Rural Household Survey, Round 5 (ERHS5), 1999: List of Survey data files, and file description Data file name
Data file link to Questionnaire part and section
Data file description Comments
Part 1: Household demographics, Household asset s and non-agricultural income P1sec1.dta Part1, section 1 Household roster, members in round 5, and
new members
P1sec2.dta Part1, section 2 Education, marital status and child mortality P1sec3.dta Part1, section 3 Household assets P1sec4.dta Part1, section 4 Credit P1sec5.dta Prat1, section 5 Non food expenditure P1sec6.dta Part1, section 6 Off-farm income and business activities Part 2: Agriculture P2sec1A.dta Part2, section 1A Land use P2sec1B.dta Part2, section 1B Cultivated land and output P2sec2.dta Part2, section 2 Land acquisition, rights and costs P2sec3.dta Part2, section 3 Labor use P2sec4.dta Part2, section 4 Quantity of inputs used P2sec5.dta Part2, section 5 Cultural practices or farming methods P2sec6.dta Part2, section 6 Soil conservation P2sec7.dta Part2, section 7 Crop damage P2sec8.dta Part2, section 8 Tree crops P2sec9.dta Part2, section 9 Sales and output market: Meher and Belg
seasons
P2sec10.dta Part2, section 10 Market for fertilizers, improved seeds and chemicals
P2sec11.dta Part2, section 11 Labor arrangement and costs P2sec12.dta Part2, section 12 Farm animals arrangements and costs P2sec13.dta Part2, section 13 Agricultural input expenditures and credit:
Meher and Belg seasons
P2sec14.dta Part2, section 14 Livestock ownership P2sec15.dta Part2, section 15 Livestock expenditure and income P2sec16.dta Part2, section 16 Innovation-crop adoption P2sec17.dta Part2, section 17 Innovation-improved livestock P2sec18.dta Part2, section 18 Innovation-adopters of modern inputs P2sec19.dta Part2, section 19 Innovation- non adopters and interrupters of
fertilizer and improved seeds
P2sec20.dta Part2, section 20 Extension- Access to extension services Part 3: Health, food consumption and women and children activities P3sec1.dta Part3,section 1 Illness and visits for treatment P3sec2.dta Part3,section 2 Household consumables P3sec3.dta Part3,section 3 Food expenditure and consumption P3sec4.dta Part3,section 4 Female activities P3sec5.dta Part3,section 5 Participation of children and females in
household and farm activities

21
Appendix 1: Ethiopian Rural Household Survey, Round 6 (ERHS6): List of Survey data files, and file description (All of the data files are in STATA) Data File Name
Data file link to questionnaire part and section
File description
Additional information, if any
PART 1. HOUSEHOLD DEMOGRAPHICS, HOUSEHOLD ASSETS AND NON- AGRICULTURAL INCOME R6p1s0.dta Part 1, cover page
Respondent, interview date information for part 1, section 1
R6_roster_card.dta Roster file R6p1s1a.dta Part 1, section 1A Household demographics, continuing
members for households with roster card
R6p1s1b.dta Part 1, section 1B Updating household demographics, continuing members for households with roster card
R6p1s1c.dta Part 1, section 1C Updating household demographics, former members for households with roster card
R6p1s1d.dta Part 1, section 1D Updating household demographics, current members for households with NO roster card
R6p1s1e_leftDied.dta Part 1, section 1E Updating household demographics, former members for households with NO (missing) roster card Number of household members who have left/died since EC1991
R6p1s1e.dta Part 1, section 1E Updating household demographics, former members for households with NO(missing) roster card. Information about each person who left since EC1991, Question 1-11
R6p1s1f_Q1.dta Part 1, section 1F Updating household demographics, child mortality….. Question 1
R6p1s1f.dta Part 1, section 1F Updating household demographics, child mortality, Question 2-5
R6p1s1g.dta Part 1, section 1G Characteristics of the household head Part 1, section 2: Children’s activities and education R6p1s2_Q1to7.dta Part 1, section 2 Children’s activities and education.
Questions 1-7
R6p1s2_Q8to13.dta Part 1, section 2 Children’s activities and education. Questions 8-13
Household level
Part 1, section 3: Assets R6p1s3_Q1to4.dta Part 1, section 3 Assets, Question 1-4 R6p1s3_Q5.dta Part 1, section 3 Assets, Question 5a R6p1s3_Q5bto5c.dta Part 1, section 3 Assets, Question 5b , 5c Columns 5b and 5c
assigned to entries

22
next to question 5a R6p1s3_Q6a.dta Part 1, section 3 Assets, Question 6a R6p1s3_Q6bto6c.dta Part 1, section 3 Assets, Question 6b1-6c2 R6p1s3_Q7.dta Part 1, section 3 Assets, Question 7 R6p1s3_Q8to11.dta Part 1, section 3 Assets, Question 8-11 Part 1, section 4: Credit R6p1s4_Q1to2.dta Part 1, section 4 Credit, Questions 1-2 R6p1s4_Q3to11.dta Part 1, section 4 Credit, Questions 3-11 R6p1s4_Q12to22.dta Part 1, section 4 Credit, Questions 12-22 R6p1s4_Q23.dta Part 1, section 4 Credit, Question 23 R6p1s4_Q24to30.dta Part 1, section 4 Credit, Questions 24-30 R6p1s4_Q31to39.dta Part 1, section 4 Credit, Questions 31-39 R6p1s4_Q40to41.dta Part 1, section 4 Credit, Questions 40-41 Part 1, Section 5: Non-food expenditures R6p1s5.dta Part 1, section 5 Non-food expenditures, Questions 1-3 Part 1, Section 6: Off-farm income and business activities R6p1s6_Q1.dta Part 1, section 6 Questions 1a, 1b R6p1s6_Q2to7.dta Part 1, section 6 Questions 2-7 R6p1s6_Q8.dta Part 1, section 6 Questions 8a, 8b R6p1s6_Q9to12.dta Part 1, section 6 Questions 9-12 R6p1s6_Q13.dta Part 1, section 6 Question 13 R6p1s6_Q14to22.dta Part 1, section 6 Questions 14-22 R6p1s6_Q23to34.dta Part 1, section 6 Questions 23-34 R6p1s6_Q35.dta Part 1, section 6 Question 35 R6p1s6_Q36to43.dta Part 1, section 6 Questions 36-43 R6p1s6_Q44to45.dta Part 1, section 6 Questions 44-55 Part 1, Section 7: Men’s perception of poverty and well-being R6p1s7_Q1to17.dta Part 1, section 7 Questions 1-17 R6p1s7_Q18to22.dta Part 1, section 7 Questions 18-22 R6p1s7.dta Part 1, section 7 Questions 1-22 Merged file PART 2: AGRICULTURE R6p2s0.dta Part 2, cover page Respondent information and interview
dates of agricultural section
Part 2, section 1A: Land and its use - quality of land and crops grown R6p2s1a.dta Part 2, section 1A Questions 1-8 R6p2s1a_remark.dta Part 2, section 1A Remarks to Part2 section 1A Part 2, section 1B: Land and its use - Land acquisition and rights R6p2s1b_Q1to11.dta Part 2, section 1B Questions 1-11 R6p2s1b_Q12to15.dta Part 2, section 1B Questions 12-15 Part 2, section 1C: Land and its use- Plot output and sales R6p2s1c_Q1to6.dta Part 2, section 1C Questions 1-6 R6p2s1c_Q7.dta Part 2, section 1C Question 7 Part 2, section 1D: Land and its use- Trees R6p2s1d_Q1.dta Part 2, section 1D Question 1 R6p2s1d.dta Part 2, section 1D Questions 2-6 Part 2, section 2A: Agricultural inputs-labor sharing R6p2s2a_Q1to2.dta Part 2, section 2A Questions 1-2 R6p2s2a_Q4to15.dta Part 2, section 2A Questions 4-15 R6p2s2a_Q16to24.dta Part 2, section 2A Questions 16-24 R6p2s2a_Q25to32.dta Part 2, section 2A Questions 25-32 R6p2s2a_Q33to38.dta Part 2, section 2A Questions 33-38 R6p2s2a_Q4to38.dta Part 2, section 2A Questions 4-38 Merged file Part 2, section 2B: Agricultural inputs-family and hired labor

23
R6p2s2b_Q1to12.dta Part 2, section 2B Questions 1-12 R6p2s2b_Q13to22.dta Part 2, section 2B Questions 13-22 R6p2s2b_Q23to26.dta Part 2, section 2B Questions 23-26 Part 2, section 2C: Agricultural inputs-Other expenditures R6p2s2c_Q1to6f_fertLineMeher.dta
Part 2, section 2C Questions 1-6 Fertilizer line- Meher season; data still includes non fertilizer items
R6p2s2c_Q1to5c.dta Part 2, section 2C Questions 1-5 Non fertilizer expenditure-Meher season; data still includes fertilizer
R6p2s2c_Q7to11f_fertLineBelg.dta
Part 2, section 2C Questions 7-11 Fertilizer line- Belg season; data may include non fertilizer items
R6p2s2c_Q7to10c.dta Part 2, section 2C Questions 7-10 Non fertilizer expenditure- Belg season; data may still include fertilizer
Part 2, section 3: Agricultural practices and technology R6p2s3.dta Part 2, section 3 Questions 1-13 Part 2, section 4: Livestock ownership R6p2s4_Q1to10.dta Part 2, section 4 Questions 1-10 R6p2s4_Q11.dta Part 2, section 4 Question 11 Part 2, section 5: Livestock expenditure and income R6p2s5_Q1to3.dta Part 2, section 5 Questions 1-3 R6p2s5_Q4to9.dta Part 2, section 5 Question 4-9 R6p2s5_Q10.dta Part 2, section 5 Question 10 Part 2, section 6: Events during the last Kirmt season R6p2s6_Q1to6.dta Part 2, section 6 Questions 1-6 R6p2s6_Q7.dta Part 2, section 6 Question 7 R6p2s6_Q8.dta Part 2, section 6 Question 8 R6p2s6_Q9.dta Part 2, section 6 Question 9 Part 2, section 7: Events during the Belg season R6p2s7.dta Part 2, section 7 Questions 1-3
PART 3. FOOD CONSUMPTION, HEALTH, WOMEN’S ACTIVITIES R6p3s0.dta Part 3, cover page Part 3: Information on respondent, and
interview dates
Part 3, section 1: Health status R6p3s1.dta Part 3, section 1 Questions 1-5 Part 3, section 2: Knowledge, attitude and practices regarding child care, health and hygiene R6p3s2_Q1to11.dta Part 3, section 2 Questions 1-11 R6p3s2_Q12to24.dta Part 3, section 2 Questions 12-24 R6p3s2.dta Part 3, section 2 Questions 1-24 Part 3, section 3: Illness, questions to be asked about all household members on household roster card R6p3s3.dta Part 3, section 3 Questions 1a-8b Part 3, section 4: Household consumables R6p3s4.dta Part 3, section 4 Questions 1-2 Part 3, section 5: Consumption habits R6p3s5_Q1to8.dta Part 3, section 5 Questions 1-8 R6p3s5_Q9.dta Part 3, section 5 Questions 9a, 9b

24
R6p3s5_Q10to11.dta Part 3, section 5 Questions 10, 11 Part 3, section 6: Food expenditures and consumption R6p3s6.dta Part 3, section 6 Food consumption, Questions 1-2 R6p3s6_Q3to11a_PurchSource.dta
Part 3, section 6 Questions 3-11
R6p3s6_Q12to13.dta Part 3, section 6 Questions 12, 13 Part 3, section 7: Women’s activities R6p3s7_Q1.dta Part 3, section 7 Question 1 R6p3s7_Q2to9.dta Part 3, section 7 Questions 2-9 R6p3s7_Q10.dta Part 3, section 7 Questions 10 R6p3s7_Q11to18.dta Part 3, section 7 Questions 11-18 Part 3, section 8: Women’s perception of poverty and well-being R6p3s8_Q1to18.dta Part 3, section 8 Questions 1-18 R6p3s8_Q19.dta Part 3, section 8 Question 19 R6p3s8_Q20to38.dta Part 3, section 8 Questions 20-38 R6p3s8.dta Part 3, section 8 Questions 1-38 Merged file Part 3, section 9: Anthropometrics R6p3s9_DateInterview.dta
Part 3, section 9 Day and month of interview
R6p3s9.dta Part 3, section 9 Questions 1-5 PART 4: SHOCKS, PUBLIC WORKS, DROUGHT, NETWORKS, IDDIR AND TRUST R6p4s0.dta Part 4 cover page Respondent and interview dates
information
Section 1: Shocks and coping mechanisms R6p4s1_Shock101to310.dta
Part4 section 1 Questions 1-4, shock codes 101-310
R6p4s1_Shock401to601.dta
Part4 section 1 Questions 1-4, shock codes 401-601
R6p4s1_Qlast10yrs.dta Part4 section 1 Last question on Shocks, “Thinking about the last ten years……”
Section 2A: Access to Public works R6p4s2a_Q1to2.dta Part4 section 2A Questions 1, 2 R6p4s2a_Q3to9.dta Part4 section 2A Questions 3-9 R6p4s2a_Q10to11.dta Part4 section 2A Questions 10,11 R6p4s2a_Q12.dta Part4 section 2A Questions 12 Section 2B: Experience during drought R6p4s2b_Q1to16.dta Part4 section 2B Questions 1-16 R6p4s2b_Q17to18.dta Part4 section 2B Questions 17-28 R6p4s2b.dta Part4 section 2B Questions 1-28 Merged file Section 3: Networks R6p4s3_Q1to11.dta Part4 section 3 Questions 1-11 R6p4s3_Q12to22.dta Part4 section 3 Questions 12-22 R6p4s3_Q1to22.dta Part4 section 3 Questions 1-22 Merged file R6p4s3_Q23to25.dta Part4 section 3 Questions 23-25 Section 4: IDDIR R6p4s4_Q1to3.dta Part4 section 4 Questions 1-3 R6p4s4_Q4to13.dta Part4 section 4 Questions 4-13 R6p4s4_Q14to22.dta Part4 section 4 Questions 14-22 R6p4s4_Q23to30.dta Part4 section 4 Questions 23-30 R6p4s4_Q1to30.dta Part4 section 4 Questions 1-30 Merged file R6p4s4_Q31to37.dta Part4 section 4 Questions 31-37 Section 5: TRUST, CONTROL AND SOCIAL INTERACTIONS R6p4s5.dta Part4 section 5 Questions 1-17

25
OTHER DATA SETS R6_kgpr_Mkt.dta Price per Kilogram, for food items in
part 3 section 6. These prices were collected from local markets in local units, and were converted to kilogram equivalent prices.
Community data sets Community_2004.dta Community questionnaire,
all sections, except section g Community (Peasant association) level data sets
Community_g_ngo.dta Community questionnaire, section g
Community level, section g on NGOs

26
Ethiopian Rural Household Survey, Round 7 (ERHS7): List of Survey data files, and file description (All of the data files are in STATA) Data File Name
Data file link to questionnaire part and section
File description
Additional information, if any
PART 1. HOUSEHOLD DEMOGRAPHICS, HOUSEHOLD ASSETS AND NON- AGRICULTURAL INCOME R7p1_s0.dta Part 1, cover page
Respondent, interview date information for part 1, section 1
Roster_r7.dta Roster file Roster file R7p1_s1a.dta Part 1, section 1A Household demographics, continuing
members for households with roster card
R7p1_s1a_YYrv2.dta Part 1, section 1A Updated R7p1_s1a.dta Updated the file after accessing data questionnaire
R7p1_s1b.dta Part 1, section 1B Updating household demographics, new members
R7p1_s1b_YYrv2.dta Part 1, section 1B Updated R7p1_s1b.dta Updated the file after accessing data questionnaire
R7p1_s1c.dta Part 1, section 1C Updating household demographics, former members for households with roster card
R7p1_s1c_YYrv.dta Part 1, section 1C Updated R7p1_s1c.dta Updated the file after accessing data questionnaire
R7p1_s1d1.dta Part 1, section 1D Updating household demographics, child mortality
Question1
R7p1_s1d2.dta Part 1, section 1D Updating household demographics, child mortality
Questions 2-5
Part 1, section 2: Children’s activities and education R7p1_s2a.dta Part 1, section 2 Children’s activities and education.
Questions 1-7
R7p1_s2b.dta Part 1, section 2 Children’s activities and education. Questions 8-10
Household level
Part 1, section 3: Assets R7p1_s3a.dta Part 1, section 3 Assets, Question 1-3 R7p1_s3b.dta Part 1, section 3 Assets, Question 4 R7p1_s3c.dta Part 1, section 3 Assets, Question 4a , 4c Columns 4b and 4c
assigned to entries next to question 4a
R7p1_s3d.dta Part 1, section 3 Assets, Question 5a-5c R7p1_s3e.dta Part 1, section 3 Assets, Question 6 R7p1_s3f.dta Part 1, section 3 Assets, Question 7-10 Part 1, section 4: Credit R7p1_s4a.dta Part 1, section 4 Credit, Questions 1-2 R7p1_s4b1.dta Part 1, section 4 Credit, Questions 3-11 R7p1_s4b2.dta Part 1, section 4 Credit, Questions 12-20 R7p1_s4c.dta Part 1, section 4 Credit, Question 21 R7p1_s4d1.dta Part 1, section 4 Credit, Questions 22-28
27
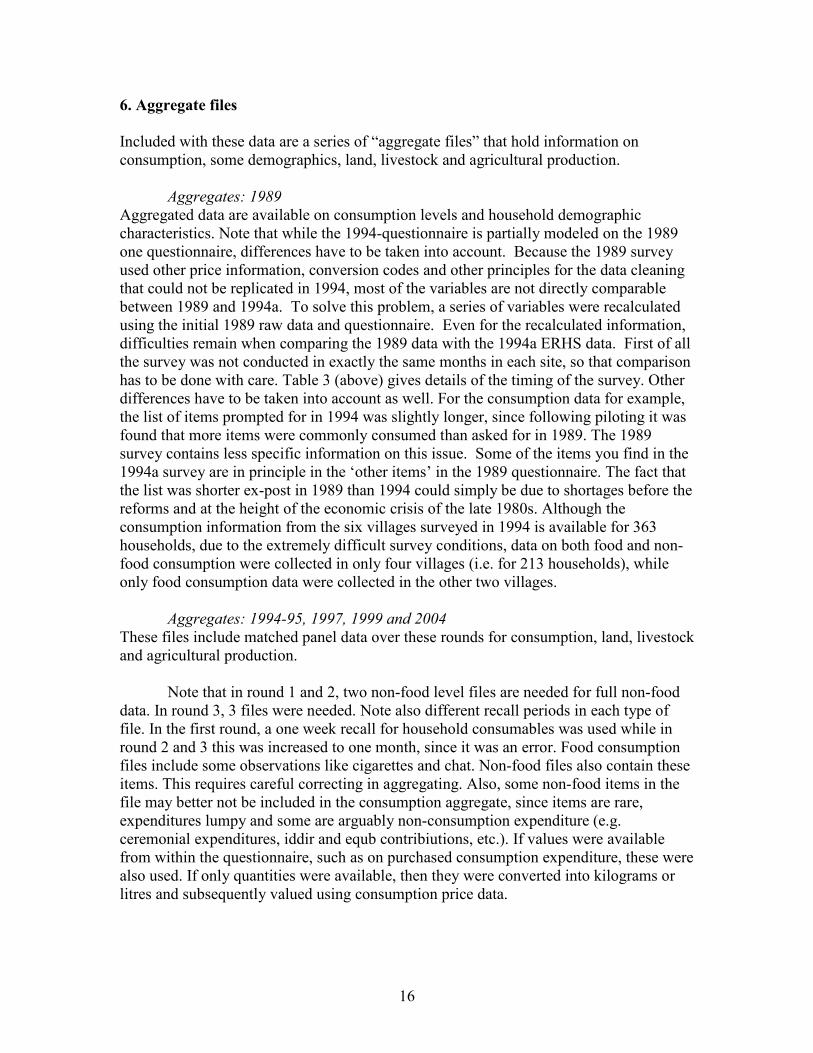
R7p1_s4d2.dta Part 1, section 4 Credit, Questions29-35 R7p1_s4e.dta Part 1, section 4 Credit, Questions 36-37 Part 1, Section 5: Non-food expenditures R7p1_s5.dta Part 1, section 5 Non-food expenditures, Questions 1-3 Part 1, Section 6: Off-farm income and business activities R7p1_s6a.dta Part 1, section 6 Questions 1a, 1b R7p1_s6b.dta Part 1, section 6 Questions 2-7 R7p1_s6c.dta Part 1, section 6 Questions 1 R7p1_s6d.dta Part 1, section 6 Questions 2-13 R7p1_s6e.dta Part 1, section 6 Questions 14a, 14b R7p1_s6f.dta Part 1, section 6 Questions 15-18 R7p1_s6g.dta Part 1, section 6 Questions 19 R7p1_s6h1.dta Part 1, section 6 Question 20-28 R7p1_s6h2.dta Part 1, section 6 Questions 29-38 R7p1_s6i.dta Part 1, section 6 Questions 39 R7p1_s6j1.dta Part 1, section 6 Questions 40-47 R7p1_s6j2.dta Part 1, section 6 Questions 48-57 Part 1, Section 7: Men’s perception of poverty and well-being R7p1_s7a.dta Part 1, section 7 Questions 1-21 R7p1_s7b.dta Part 1, section 7 Questions 22-38 R7p1_s7c.dta Part 1, section 7 Questions 39a-41 PART 2: AGRICULTURE R7p2_resp.dta Part 2, cover page Respondent information and interview
dates of agricultural section
Part 2, section 1A: Land and its use - quality of land and crops grown R7p2_s1a.dta Part 2, section 1A Part 2, section 1B: Land and its use - Land acquisition and rights R7p2_s1b1.dta Part 2, section 1B Questions 1-13 R7p2_s1b2.dta Part 2, section 1B Questions 14-15 Part 2, section 1C:Use of Inputs R7p2_s1c.dta Part 2, section 1C Part 2, section 1D: Land and its use- Plot outputs and sales R7p2_s1d1.dta Part 2, section 1D Question 1-5 R7p2_s1d2.dta Part 2, section 1D Questions 6 Part 2, section 1D: Land and its use- Plot outputs and sales R7P2_s1e1.dta Part2, section 1E Question 1 R7P2_s1e2.dta Part2, section 1E Questions 2-6 Part 2, section 2A: Agricultural inputs-labor sharing R7p2_s2a1.dta Part 2, section 2A Questions 1-2 R7p2_s2a2a.dta Part 2, section 2A Questions 3-14 R7p2_s2a2b.dta Part 2, section 2A Questions 15-25 Part 2, section 2B: Agricultural inputs-family and hired labor R7p2_s2b1.dta Part 2, section 2B Questions 1-22 R7p2_s2b2.dta Part 2, section 2B Questions 23-26 Part 2, section 2C: Agricultural inputs-Other expenditures

28
R7p2_s2c1.dta Part 2, section 2C Questions 1-5 R7p2_s2c2.dta Part 2, section 2C Questions 6-9 Part 2, section 3: Agricultural practices and technology R7p2_s3.dta Part 2, section 3 Questions 1-12 Part 2, section 4: Livestock ownership R7p2_s4a.dta Part 2, section 4 Questions 1-10 R7p2_s4b.dta Part 2, section 4 Question 11 Part 2, section 5: Livestock Expenditure and Income R7p2_s5a.dta Part 2, section 5 Questions 1-3 R7p2_s5b.dta Part 2, section 5 Question 4-9 R7p2_s5c.dta Part 2, section 5 Question 10 Part 2, section 6: Events during the last Kiremt Season R7p2_s6a.dta Part 2, section 6 Questions 1-7 R7p2_s6b.dta Part 2, section 6 Question 8 R7p2_s6c.dta Part 2, section 6 Question 9 Part 2, section 7: Events during the last Belg season R7p2_s7.dta Part 2, section 7 Part 2, section 8: Land Registration R7P2_s8.dta Part2, section 8 Part 2, section 9: Risk and Time Preferences R7p2_s9.dta Part 2, section 9 Part 2, section 10: Willingness to Pay Insurance R7P2_s10a.dta Part2, section 10 Questions 1-8 R7P2_s10b.dta Part2, section 10 Question 10-12; there is no question 9 R7P2_s10c.dta Part2, section 10 Questions 13-30
PART 3. FOOD CONSUMPTION, HEALTH, WOMEN’S ACTIVITIES R7p3_resp.dta Part 3, cover page Part 3: Information on respondent, and
interview dates
Part 3, section 1: Health status R7p3_s1.dta Part 3, section 1 Part 3, section 2: Hygiene and sanitation R7P3_s2.dta Part 3, section2 Part 3, section 3: Illness, questions to be asked about all household members on household roster card R7p3_s3.dta Part 3, section 3 Questions 1a-8b Part 3, section 4: Household consumables R7p3_s4.dta Part 3, section 4 Part 3, section 5: Consumption habits R7p3_s5.dta Part 3, section 5 Part 3, section 6: Food expenditures and consumption R7p3_s6a.dta Part 3, section 6 Food consumption, Questions 1-2 R7p3_s6b.dta Part 3, section 6 Questions 3-11 R7p3_s6c.dta Part 3, section 6 Questions 12, 13 Part 3, section 7: Women’s activities R7p3_s7a.dta Part 3, section 7 Question 1 R7p3_s7b.dta Part 3, section 7 Questions 2-10 R7p3_s7c.dta Part 3, section 7 Questions 11 R7p3_s7d.dta Part 3, section 7 Questions 12-19 Part 3, section 8: Women’s perception of poverty and well-being R7p3_s8a.dta Part 3, section 8 Questions 1-18

29
R7p3_s8b.dta Part 3, section 8 Question 19-36 R7p3_s8c.dta Part 3, section 8 Questions 37-39 Part 3, section 9: Participation in village life and decision making R7P3_s9.dta Part 3, section9 Part 3, section 10: Participation in household decision making R7P3_s10a.dta Part3, section109 Question 1 R7P3_s10b.dta Part3, section 10 Questions 2-4 R7P3_s10c.dta Part3, section 10 Question 5 R7P3_s10d.dta Part3, section 10 Question 6-7 R7P3_s10e.dta Part3, section 10 Question 8-24 Part 3, section 11: Allocation of Assets on Divorce R7P3_s11a.dta Part3, section 11 Questions 1-7 R7P3_s11b.dta Part3, section 11 Questions 8 Part 3, section 12: Knowledge of Land Rights resulting from Land Registration R7P3_s12.dta PART 4: SHOCKS, PUBLIC WORKS, DROUGHT, NETWORKS, IDDIR AND TRUST R7P4_resp.dta Part 4 cover page Respondent and interview dates
information
Section 1: Shocks and Coping Mechanisms R7p4_s1a.dta Part4 section 1: Long term
shocks and coping mechanism Questions 1, shock codes 101-601
R7p4_s1b.dta Part4 section 1: Long term shocks and coping mechanism
Last question on Shocks, “Thinking about the last ten years……”
Part4, section 2: Access to the Productive Safety Nets Program, Public works R7p4_s2a.dta Part4 section 2 Questions 1, 2 R7p4_s2b.dta Part4 section 2 Questions 3 R7p4_s2c.dta Part4 section 2 Questions 4 Part4, section 3: Networks R7p4_s3a.dta Part4 section 3 Questions 1-22 R7p4_s3b.dta Part4 section 3 Questions 23-24 Section 4, section 4: IDDIR R7p4_s4a.dta Part4 section 4 Questions 1-3 R7p4_s4b.dta Part4 section 4 Questions 4-24 R7p4_s4c.dta Part4 section 4 Questions 25-27

30