Steal the Show - Hebrew University of...
39
The Hebrew University Department of Cognitive Science Steal the Show Payoff Effect on Accuracy of Behavior-Prediction in Real High-Stake Dilemmas By: Einav Hart Advisor: Prof. Bornstein - 2010 -
Transcript of Steal the Show - Hebrew University of...

The Hebrew University
Department of Cognitive Science
Steal the Show Payoff Effect on Accuracy of Behavior-Prediction
in Real High-Stake Dilemmas
By: Einav Hart
Advisor: Prof. Bornstein
- 2010 -

1
Abstract:
Our study explores the ability to predict players' behavior in a Prisoner's Dilemma (PD) type
of game. We use "Split or Steal" video clips – a televised game show depicting a (very) high
stake version of PD-esque game. Based on relevant psychological and economic literature,
our main hypothesis is that motivated observers will predict the players' decisions more
accurately than non-motivated observers. In order to examine the effect of incentives on
prediction accuracy, we vary the reward for correct predictions; we conjecture that the bigger
the reward, the more accurate the prediction. In addition, we explore correlations between the
observers' accuracy and the players' decisions. We hypothesize that observers will more
readily believe the players and consider them cooperators than assume that they will defect.
Introduction:
The idea that people can predict others' intentions or decisions from their behavior
is rooted in several decades of research regarding verbal and nonverbal behavior.
Studies have shown that observers are able to distinguish between cooperators and
cheaters in social situations, and in particular in the Prisoner's Dilemma (PD). In our
paper, we utilize video clips taken from a televised PD-type game show involving
very high stakes. It has been shown that highly significant situations produce more
emotions and thus make intentions more predictable. Hence, game shows provide an
excellent study opportunity for the ability to deduce decisions. Specifically, we
explore whether observers' motivation to predict these decisions correctly influences
their accuracy de facto. The rest of the paper shall proceed as following:
In Section 1 we will review the relevant literature. Section 1.1 will consider
evidence regarding differences in behavior between liars and truth-tellers. Section 1.2
and 1.3 will review the body of research examining the ability to detect lies and
cheaters. These studies typically find that people are not able to discern intention or
judge veracity very well or even above-chance. However, this result seems to depend
on the methodology used and the questions asked. In section 1.4, we mention a related
body of research examining the detection of altruists.
We feel the study of social dilemmas, or "games" in the game theoretic sense, can
be beneficial and informative in answering the question of discerning intentions or
decisions from behavior – particularly so the PD game. In Section 1.5 we elaborate on
the PD game, both theoretically and empirically. A significant fraction of players are
conditionally cooperative; they cooperate only to the extent their opponent

2
reciprocates. This, to us, relates the importance of interpreting and predicting behavior
in such settings. We discuss this in light of evolutionary models showing that
cooperation is reasonable only when encounters between players are not random, due
to selection or signaling. Section 1.6 presents studies that examined behavior
prediction in such a setting. We also review studies demonstrating higher recall or
identification rates for cheaters' faces in a PD game compared to other faces when
forming immediate impressions.
Section 1.7 considers the effect that motivation has on behavior and physical
attributes, and on their predictability. The importance or consequences of behavior
affects its presentation, and this is especially evident when the stakes are high.
Players' emotional state and behavioral changes become more apparent the bigger the
stakes they face. The influence of motivation on observers is less clear, and might
depend on situation characteristics.
In light of all the above, we claim that high stake social dilemmas provide an
excellent opportunity to study behavior – and its predictability. We claim further that
game shows are an example of such a high stake situation, allowing us to observe
behavior and predictions that occur in the real world and are of high significance. In
section 1.8 we review statistical analysis of PD-type game show data. There appears
to be a significant correlation between players' decision and their opponents' decision,
implying above-chance distinction between cooperators and cheaters. We also present
a study examining observers' predictions and their updating in such a setting.
In section 2 we shall elaborate our hypotheses, concerning observers' accuracy
rate in predictions, and the effect of incentives on accuracy. Our main hypothesis is
that motivation will lead to more accurate predictions. We hypothesize also that
predictions will be biased towards cooperation. This hypothesis entails that accuracy
rates for predicting defection will be higher than for predicting cooperation, as going
against a cooperation bias requires (we suppose) perceiving distinctive behavioral
attributes of defection.
The experimental design and the results are presented in section 3. We presented
our participants with four video clips of the PD-esque "Split or Steal" game and asked
them to predict the players' decisions. We manipulated the participants' motivation by
promising them a high reward if they correctly predicted one of the two players in
each clip, and a low reward for the other. The high-payoff ("Critical") player was
introduced before the participants watched the clip; participants were asked about the
3
low-payoff ("Non-critical") player only after watching the clip and predicting the
Critical player's decision. This procedure enables testing the influence of incentives or
motivation on accuracy within-subject, as well as influences of the players' decisions.
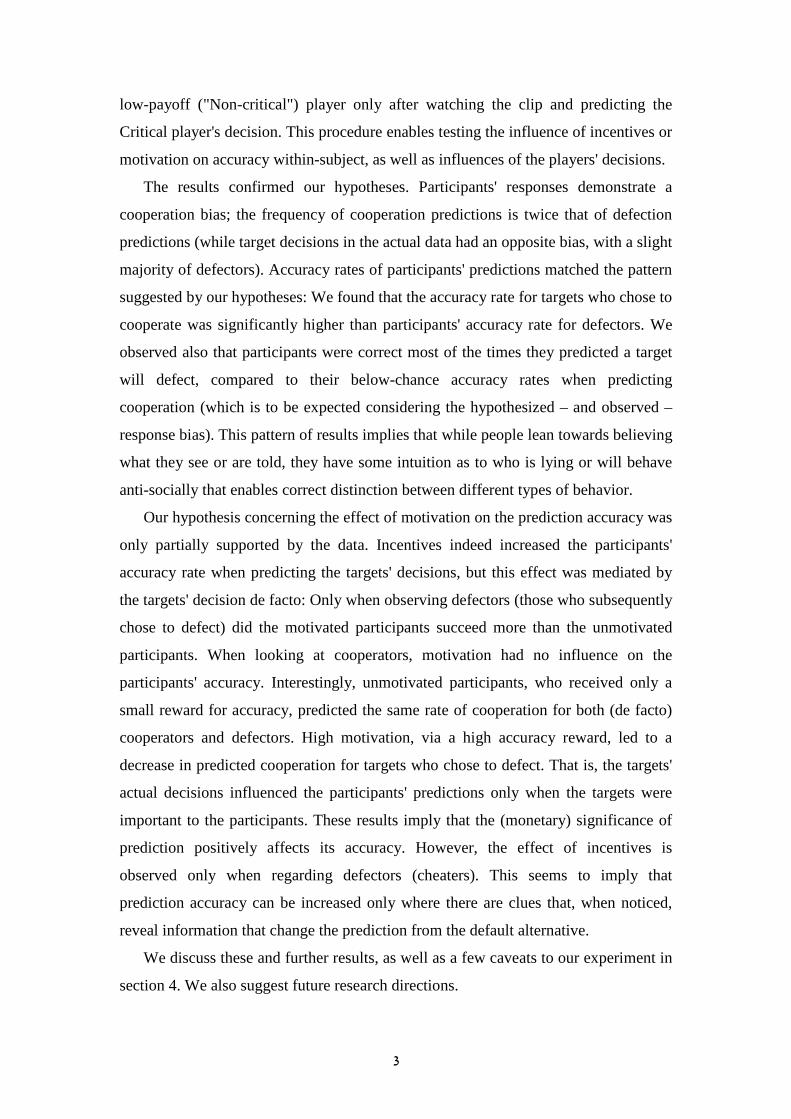
The results confirmed our hypotheses. Participants' responses demonstrate a
cooperation bias; the frequency of cooperation predictions is twice that of defection
predictions (while target decisions in the actual data had an opposite bias, with a slight
majority of defectors). Accuracy rates of participants' predictions matched the pattern
suggested by our hypotheses: We found that the accuracy rate for targets who chose to
cooperate was significantly higher than participants' accuracy rate for defectors. We
observed also that participants were correct most of the times they predicted a target
will defect, compared to their below-chance accuracy rates when predicting
cooperation (which is to be expected considering the hypothesized – and observed –
response bias). This pattern of results implies that while people lean towards believing
what they see or are told, they have some intuition as to who is lying or will behave
anti-socially that enables correct distinction between different types of behavior.
Our hypothesis concerning the effect of motivation on the prediction accuracy was
only partially supported by the data. Incentives indeed increased the participants'
accuracy rate when predicting the targets' decisions, but this effect was mediated by
the targets' decision de facto: Only when observing defectors (those who subsequently
chose to defect) did the motivated participants succeed more than the unmotivated
participants. When looking at cooperators, motivation had no influence on the
participants' accuracy. Interestingly, unmotivated participants, who received only a
small reward for accuracy, predicted the same rate of cooperation for both (de facto)
cooperators and defectors. High motivation, via a high accuracy reward, led to a
decrease in predicted cooperation for targets who chose to defect. That is, the targets'
actual decisions influenced the participants' predictions only when the targets were
important to the participants. These results imply that the (monetary) significance of
prediction positively affects its accuracy. However, the effect of incentives is
observed only when regarding defectors (cheaters). This seems to imply that
prediction accuracy can be increased only where there are clues that, when noticed,
reveal information that change the prediction from the default alternative.
We discuss these and further results, as well as a few caveats to our experiment in
section 4. We also suggest future research directions.

4
Section 1: Related Literature:
1.1 What's in a Lie?
In an ideal world, people do not lie; they always tell the truth, so there is no need
for special skills that enable cheating or lie detection. However, on second thought it
seems that society as we know it would not exist without certain types of lies (e.g.
"white lies", "tact" or "manners"). People lie or fib about numerous subjects, with
varying intentions and distance from the truth. Lies can be about actions, opinions,
feelings or thoughts, objective facts, intentions and so forth. These differ not only in
content, but also in structure, in the emotions they trigger and the amount of mental
effort demanded to produce them, as well as the behavior exhibited – facial
expressions and body movement, and the semantic, syntactic and verbal aspects of the
message. Ekman (1985/2001) proposes two criteria that define a lie. The first is intent
– the speaker consciously intends to deceive his listeners. The second is the listeners
being unaware of deceit; a magician is not a liar as his crowd is aware of his trickery.
Numerous studies examined the markers and clues that enable discerning truth
tellers from liars (e.g. Ekman, 1989; DePaulo & Morris, 2004; Vrij & Mann, 2004;
Vrij, Akehurst, Soukara & Bull, 2004; DePaulo, Lindsay, Malone, Muhlenbruck,
Charlton & Cooper, 2003). There exist some behavioral patterns that discriminate
between lies and truth, which can be observed in most situations – if you know what
to look for. Studies have found different and conflicting behavioral patterns, which
could result from differences between lie types, the amount of cognitive effort they
impose, the risks in getting caught versus the reward of getting away with it, and so
forth (Vrij, 2008). But there are consistent findings across studies: When lying, people
are more tense and nervous – and this manifests in their behavior as well as physical
characteristics, e.g. pupil size, tone of voice, and a stronger tendency to purse lips
compared to truth tellers; Fake emotional facial expressions (e.g. smile, surprise) are
different from their spontaneous counterparts (Ekman, 1989). People will often try to
control their behavior, body language and voice, as they are aware of the leakage of
their true emotions and thoughts (Ekman & Friesen, 1969). However, this control can
also backfire, making liars appear more rehearsed and less natural or spontaneous
(Vrij & Mann, 2004). Liars tend to speak less than truth tellers: Interactions are
shorter, contain less words and detail, and are less logical or plausible. Liars relate
less to themselves while conversing, tend to repeat themselves, and are less eloquent

5
(Ekman, 1989; DePaulo & Morris, 2004). In contrast, Vrij & Mann (2004) claim that
liars explicitly tend to be less repetitive and be more eloquent, which makes them
sound too rehearsed or planned, as normal speech usually contains certain errors and
pauses. Liars, unlike truth-tellers, usually do not admit errors or correct themselves
while talking, or admit to faulty memory (Vrij, Mann & Fisher, 2006; Vrij, 2008).
Interestingly, certain behavior patterns like gaze aversion or fidgeting, that are
considered to be clues for deception, have not been found to discriminate between
liars and truth tellers in research.
Vrij & Mann (2004) coded the behavior of lying and truth telling subjects in video
clips, and found that by using behavioral – verbal and nonverbal – characteristics,
their model could discriminate between truths and lies with a 80% accuracy level.
Similar results have been found by Vrij et al (2004), who conducted their research on
children as well as adults. Vrij et al found that while some behavioral patterns that
distinguish between liars and truth-tellers differ between children and adults, there are
some attributes which consistently predict veracity – with an accuracy level of up to
88% (slightly higher than that of the polygraph; National Research Council, 2003).
1.2 Lie Detection
It seems clear that in daily life, people are not detection machines, nor do they
explicitly attune to cues that may aid in the detection of deception. In fact, even if
they know what cues to attend to, they may not want to detect lies (Vrij, 2008;
Ekman, 1996). Many studies explored the existence of an ability to discriminate lies
and truth (see Bond & DePaulo, 2006, for a comprehensive review). In most of these,
participants view video clips of others telling either lies or truths, and asked to judge
the message veracity. Contrary to intuition and the abundance of cues, it has been
ubiquitously found that most people cannot detect lies above the 50% chance level.
Bond & DePaulo's meta-analysis of 206 studies, with subject pools encompassing
both students and people who are accustomed and supposedly good at this detection
such as law officers and psychologists, found an accuracy rate of 54%. This result did
not depend on familiarity of the speaker, lie type or on the risks or incentives
associated with lying. However, findings concerning participants' profession or their
experience with lie detection differ: Some observed a somewhat positive effect of
training or experience on accuracy (Ekman & O'Sullivan, 1991; Porter, Woodworth &

6
Birt, 2000), yet others have found no effect (Bond & DePaulo, 2006; Hartwig,
Granhag, Stromwall & Vrij, 2004), or even a negative effect (Kassin, 2004).
It appears that people tend not to consider valid behavioral cues, and not only that,
but they do rely on other patterns and behaviors which have no discriminative value
(Ekman, Friesen O'Sullivan & Scherer, 1980; Akehurst, Kohnken, Vrij, and Bull,
1996; Vrij, 2008). Bond & DePaulo (2006) also observed that facial expressions did
not help accurate detection – in accordance with leakage theory, which claims that it
is easier to control the face than other behavioral aspects (Ekman & Friesen, 1969).
Auditory cues slightly increased accuracy compared to when using only nonverbal
information (concurring with Ekman, Friesen, O'Sullivan & Scherer, 1980).
Interestingly, Bond & DePaulo (2006) found that the correct identification rate of
true messages is higher than that of false messages: People tend to classify more true
messages than false messages correctly. This corresponds to Spinoza's (1677) idea
that claims are automatically perceived as real and true, and tend to remember them as
such regardless of their known veracity while coding; Falsifying, or even checking
veracity, is done only when the perceiver has the mental ability and motivation to do
so (Gilbert, Tafarodi & Malone, 1993). Support for this claim comes from a study
done by Ekman, O'Sullivan & Frank (1999), which included professional lie detectors
– policemen, investigators and clinical psychologists. They found that experience did
matter, but even so, accuracy rates did not significantly differ (agreeing with previous
research). The differences between experience groups was found to be due to
differences in accuracy rates in classifying lies, not truths: All groups were similar in
their accuracy rates when viewing true messages, but the experienced groups were
better at discerning lies (a finding that could be due to an increased tendency to report
messages as lies). This data pattern was replicated by Meissner & Kassin (2002) and
Kassin, Meissner & Norwick (2005).
1.3 Different Methods, Different Results
Reviewing detection literature, it appears the success or accuracy rate depends on
the method being used to extract subjects' opinions. Participants in most studies are
asked to provide an explicit and conscious judgement as to the veracity of statements.
Although this methodology seems to be reasonable, not unlike police investigations,
psychological assessment, jury decisions and so forth, the matter is not so simple.
Nonverbal behavior is mostly non-deliberate and unconscious – clues as to thoughts,

7
expectations and emotions are very subtle and quick, difficult to pinpoint explicitly
(Vrij & Mann, 2004; Ambady, Bernieri & Richeson, 2000).
In this line of thought, researchers have examined the ability to judge and
discriminate lies both explicitly and implicitly, comparing the accuracy rates between
these two methods or methodologies (DePaulo, Rosenthal, Green & Rosenkrantz,
1982; DePaulo, Jordan, Irvine & Laser, 1982; Hurd & Noller, 1988; Anderson,
DePaulo & Ansfield, 1999). It has been observed that asking for judgements
regarding mental effort, stress or emotion (ambivalence, empathy) leads to better
discrimination between false and true messages than asking for direct veracity
judgements (DePaulo, Rosenthal et al, 1982; Vrij, Edward & Bull, 2001). DePaulo,
Jordan et al (1982) found that these indirect judgements also allow differentiation
between lies and truth from a younger age.
Hurd & Noller (1988) asked participants to think aloud while viewing true and
false messages, and while accuracy of explicit judgements was no higher than chance,
participants were more likely to consider the message false when it was false de facto.
Anderson et al (1999) similarly found that while participants' accuracy rates in
making explicit judgements were not higher than chance, they indicated using
different behavioral cues when viewing false and true messages. These studies thus
imply that while there is some intuition or implicit detection of lying, it does not come
into play when making explicit decisions.
Albrechtsen, Meissner & Susa (2009) examined the intuitive ability to discern lies
by decreasing participants' mental resources or the amount of time spent on detection.
In one experiment, participants were shown either full or short sliced video clips, with
the sliced clips supposedly causing more intuitive processing (Ambady & Rosenthal,
1992), and asked about message veracity. Participants in the thin slice condition were
found to be more accurate in their judgements than the full video group – and only the
thin slice group performed better than chance. In another experiment, only interrupted
participants, who had less mental resources to dedicate to the lie detection task
(compared to two control groups), performed better than chance. This group was also
more inclined to believe messages and judge them as truthful, much like the
aforementioned observed truth bias (Bond & DePaulo, 2006; Ekman et al, 1999;
Gilbert et al, 1993).

8
1.4 Altruist Detection
The notions of altruism and cooperation are closely related to those of lying or
cheating (while not complementary). A number of studies explored the ability to
identify altruists (Brown, Palameta & Moore, 2003; Oda, Yamagata, Yabiku &
Matsumoto-Oda, 2009). Brown et al (2003) conducted three experiments designed to
explore the ability to recognize and distinguish altruists from others. In their studies,
Brown et al classified people as altruists and non-altruists using a self-report
questionnaire, and taped them while telling a story, introducing themselves or playing
a game with a member of the other group. Participants were asked to judge the taped
individuals on a number of behavioral and personality related variables. There was
above-chance accuracy level in identifying altruists, who were perceived as being
more helpful and expressive than non-altruists. Altruists were also found to produce
more genuine smiles (shorter, more symmetric), as well as more head nods and
concern expressions (a pattern observed also by Mehu, Grammer & Dunbar, 2007;
Schug, Matsumoto, Horita, Yamagishi & Bonnet, 2010). Oda et al (2009) conducted a
study similar to that of Brown et al, and corroborated their results. The above-chance
distinction between altruists and non-altruists seems to derive from differences in
impression; altruists appear to be judged by their propensity to take part in social
interactions and be helpful in them.
Research about impression formation supplies additional evidence to the influence
of facial expressions and appearance on trust or the perception of cooperation
(Todorov, 2008; Oosterhof & Todorov, 2008; Todorov & Duchaine, 2008; Todorov,
Pakrashi & Oosterhof, 2009). Judgements of face trustworthiness can help infer
intentions and consequent behavior even when there are no obvious emotional cues
available, and are correlated with overall valence judgements of the face (Todorov,
2008; Oosterhof & Todorov, 2008). It appears that such trustworthiness recognition is
immediate, and may even happen subliminally: Discrimination between trustworthy-
and untrustworthy-looking faces occurs even after a 33ms exposure; it increases with
exposure time, but does not improve with exposures longer than 167ms (Todorov,
2008; Todorov et al, 2009). Todorov & Duchaine (2008) additionally show that even
prosopagnostic participants, impaired in processing and identifying faces, are able to
judge trustworthiness of faces – agreeing with healthy control participants.
Interestingly, research examining detection of cooperation seems to demonstrate a
significant ability to differentiate or distinguish between different types of behavior.

9
This is encouraging, especially compared to aforementioned studies concerning lie
detection. Nevertheless, it should be noted that both of these abilities – to detect lies
or cooperation – are more critical in social settings, and should be explored in such.
The next section deals with this issue.
1.5 Interaction and Social Situations
Identification of behavior – anti-social or pro-social – is especially important in
social context. In contrast to the settings in most studies described above, lies and
altruism usually occur and are significant in interactions.1
A way to solve this issue arises from social dilemmas, studied extensively in game
theory as well as social psychology and experimental economics (e.g. Dawes, 1980;
Dawes & Messick, 2000; Camerer, 2003). Social dilemmas are situations where each
player has an obvious preferred action ("defection"), yet if this action is to be taken by
all the players, the outcome will be sub-optimal: All players will lose or gain less
compared to when all the players choose the dominated action ("cooperation").
Examples of social dilemmas are salient in daily life as well as in research. A
ubiquitous example is the PD game, which can be represented by the payoff matrix
depicted in table 1.1.
In this game, it is beneficial for each player individually to defect rather than
cooperate; this reasoning naturally leads to the mutual defection outcome, inferior for
both players to the mutual cooperation outcome. The best outcome for each player is
the one where they defect and their partner cooperates. Game theoretic analysis, when
assuming narrow rationality (players are selfish and only care about their own reward)
thus predicts a 100% defection rate.
Table 1.1: PD payoff matrix
Player 2
Cooperate Defect Cooperate B,B (e.g. 3,3) 0,A (e.g. 0,4)
Player 1 Defect A,0 (e.g. 4,0) C,C (e.g. 1,1)
Payoffs are ordered: A>B>C>0
The behavior observed in PD games (in labs or in the field) contradicts the
selfishness or individually-rational assumption (see Dawes, 1980; Camerer, 2003):
Cooperation rates are significantly higher than the predicted null, across populations,
1 A related criticism was noted by Frank (2005): Judging taped communications does not in fact mimic
most natural situations involving lying; lies are told to a specific person in a specific setting – not to anonymous people who are not even present in the situation.

10
experimental conditions and payoffs. It has been observed that a large fraction of
players are conditionally cooperative, that is, choose to cooperate if and only if their
opponent cooperates (Axelrod, 1984; Fischbacher, Gachter & Fehr, 2001).
It seems that this correlation or dependence between players' decision implies that
interpretation of intentions or communication is crucial. This claim is supported by
evolutionary models showing that a cooperative strategy (which benefits players only
if they both choose it) can exist in a population – even thrive – only if encounters
between its members are not random (Eshel & Cavalli-Sforza, 1982; Guth, 1995; Fehr
& Fischbacher, 2005; Janssen, 2008). That is, when individuals have some (active)
selection process which leads them to meet some but not other types of individuals, as
defined by their strategies. Hence, cooperative players will benefit only to the extent
that they can distinguish and select other cooperative players. Eshel & Cavalli-Sforza
(1982) comment also that a correlation between the tendency to cooperate and the
ability to select or identify others is natural, given there is evolutionary feedback.
1.6 Prediction in Interaction
When players can interact with each other, and especially when such interaction is
non-binding ("cheap talk"; see Farrell & Rabin, 1996), it becomes a real and crucial
advantage for the individual to correctly guess or estimate their opponent's intentions.
In light of the aforementioned literature we assume this can be done (at least partially)
through interpretation of physical and behavioral cues.
Research seems to support this claim (Frank, Gilovich & Regan, 1993;
Yamagishi, Kikuchi & Kosugi, 1999; Brosig, 2002). Frank et al (1993) had
participants communicate with each other before playing a PD game. After the "cheap
talk" phase and before play, participants were asked to predict what the two others
would choose, and decide on their own course of action. The predicted cooperation
rate was 81%, quite close to the actual rate of 73%. Thus, the accuracy rate of
cooperation predictions was 81%, while 57% of defection predictions were correct –
both significantly higher than chance. Brosig (2002) replicated these results, finding a
predicted cooperation rate of 74%, with 67% accuracy. Cooperative participants were
also more accurate predictors than individualists (corroborating the expected patterns
discussed in section 1.5). It should be noted that participants who chose to cooperate
were more likely than individualists to predict cooperation (81% vs. 70%). Similarly,

11
Yamagishi et al (1999) found that more trusting people (via self report) are more
accurate – compared to low trusters – in predicting their opponent's decision in a PD.
This effect was independent of whether the decision was to cooperate or defect.
Yamagishi, Tanida, Mashima, Shimoma & Kanazawa (2003) photographed
people playing a PD game, and classified them as cooperators or defectors by their
decisions. Defectors' faces were recognized more than cooperators'. They were also
more likely to be falsely recognized, that is, participants believed that they recognized
them even when they have not seen the faces before. Chiappe, Brown, Dow, Koontz,
Rodrigues & McCulloch (2004) found that defectors were rated as more important to
remember, and were looked at longer than cooperators. A similar result was found by
Vanneste, Verplaetse, van Hiel & Braeckman (2007), in that unfamiliar defectors'
faces attracted more automatic attention (in a dot probe design) than those of
cooperators. This effect was more pronounced when the photographs were taken in a
PD game with monetary gain. Accordingly, Verplaetse, Vanneste & Braeckman
(2007) observed that participants were able to distinguish between cooperators and
defectors only when photographs were taken during decision making in an
incentivized round, and not in a practice round or prior to playing.
It appears that people are able to distinguish between different types of behaviors
– specifically cooperation and defection (cheating) – when these occur in social
settings; this is true when viewing multi-faceted behavior as well as when viewing
still photographs. It may be the case that this distinction is at least partially due to the
significance of these situations to the observer and the players. The next section shall
elaborate on the effects of significance and payoff on the ability to discern intentions.
1.7 Motivation and Incentives
Studies concerning emotional expression have consistently shown that motivation
(or importance of a task or situation to the individual) is critical. The stakes of the
game or situation do not only affect the state of mind, but also the emotional state and
behavior. High stake situations, where the individual has a lot to lose or gain –
monetary or otherwise – induce strong emotions; these can and typically do leak
through the individual's behavior, facial expressions, body movements and various
other attributes (DePaulo et al, 2003; DePaulo, Kirkendol, Tang & O'Brien, 1988;
Ekman & Friesen, 1969).

12
However, most experimental settings are not highly consequential for participants,
and thus it is difficult to infer natural lie (or cooperation) detection abilities from them
(Frank, 2005; Ekman, 1996). Most messages and particularly lies in such experiments
are artificial and told to the request of experimenters. Participants have little to no
motivation to succeed in their deception; they do not much benefit from successful
deception or suffer from failure, if at all. This problem is accentuated by studies such
as those of Vanneste et al (2007) and Verplaetse et al (2007) mentioned above, where
the differentiation of cooperators from defectors was observed only in incentivized
games, implying an impact of stakes on behavior and facial expressions.
Frank & Ekman (1997) argue further that not only are high stake situation
different from small stake ones, but that the ability to identify lies could be
generalized across situations when the stakes are high: While behavioral cues differ
and are situation-specific when the stakes are small, high-stake situations induce
similar responses regardless of specific details. In their study, Frank & Ekman taped
participants in two somewhat-high-stake situations, and asked others to make binary
decisions of message veracity. Accuracy scores were similar across scenarios, and a
significant correlation was found between the scores for the two scenarios, lending
support to the research hypothesis.
In contrast with the well documented influence of motivation on participants
involved in social interactions or dilemmas, evidence as to the effect of incentives on
observers seems to be mixed. Some experiments found that motivation increased
prediction accuracy (Klein & Hodges, 2001; Biesanz & Human, 2010). Klein &
Hodges (2001) examined men and women's empathic accuracy. Participants of both
genders did significantly better when rewarded monetarily for correct guesses.
Interestingly, the influence of incentives also nullified the gender difference. Biesanz
& Human (2010) observed that motivated observers are indeed more accurate in their
judgements of others, and captured more distinctive attributes (rather than normative
ones), than did non-motivated observers. Other studies found an adverse effect of
incentives on performance, when simply rewarding or not rewarding enough led to
poorer accuracy rates (Porter, McCabe, Woodworth & Peace, 2007; Forrest &
Feldman, 2000): Motivating participants significantly decreased their accuracy rate in
a lie detection task akin to those detailed in section 1.2.
Forrest & Feldman (2000) suggest that nonverbal cues rather than verbal ones are
those which are more likely to indicate lies. As nonverbal cues are interpreted

13
unconsciously, motivation may decrease detection accuracy by causing over-thinking
or second-guessing (Ambady et al, 2000; Patterson, 1995; Tracy & Robins, 2008;
Dunning & Stern, 1994). This claim has support in a different line of research,
examining unconscious thought: In certain situations, it seems, people make better
decisions when they are not attuned to the task at hand, or are distracted while asked
to perform it, e.g. think about the possible choice alternatives (Dijksterhuis, 2004;
Lassiter, Lindberg, Gonzalez-Vallejo, Bellezza, & Phillips, 2009; Dijksterhuis, Bos,
van der Leij & van Baaren, 2009; Waroquier, Marchiori, Klein & Cleeremans, 2010).
Gilbert & Krall (1988) claim that these conflicting results may be caused by
processing differences: While verbal processing requires controlled processes,
perception of nonverbal cues is more automatic, perhaps even done unconsciously.
They observed that participants with less cognitive resources tended to rely on
nonverbal cues rather than verbal ones. Hall, Blanch, Horgan, Murphy, Rosip &
Schmid Mast (2009) correspondingly found no effect of motivation (monetary or
otherwise) on participants' emotional sensitivity when asked to interpret nonverbal
cues, concurring with its supposed unconscious nature. In contrast, motivation had a
positive effect when the task required verbal (controlled) processing.
The aforementioned results highlight the interest in studying whether – and how –
motivation (incentives) affects observers' predictions in situations where there are
both verbal and nonverbal attributes. This is especially intriguing when these two
informational channels are very strong and apparent, and contain contradictory
messages – as in cases of "leaking" liars. Hence, we suggest that the ability to detect
deception, as well as a motivational effect, be tested in significant situations; in these
cases, nonverbal information is particularly salient and consistent. That is, prediction
accuracy should be in a setting involving definite and distinct behavioral patterns.
1.8 Games in Game Shows
High stakes can be found in various circumstances, although it can be argued that
most daily life involves small stakes and situations of little importance. High stake
situations can, for example, involve big amounts of money that can be gained, earned
or lost, depending on the individual's behavior – as well as the behavior of those
around them, on interactions that take place and interpretation of behavior. While
participants in some laboratory experiments are paid for their effort, and do indeed

14
take their payoffs seriously, it cannot be regarded as a situation where a lot is at stake.
At least, not in the way game shows are.
We feel that using game show data provides an excellent opportunity to test high
stakes, social interactions and behavior. As well as involving very large amounts of
money (the magnitude of which is enviable by most research institutions), game
shows are less controlled and sterile than lab experiments, and their participant-
population more diverse. In this paper, we shall utilize episodes of the British game
show "Golden Balls", and specifically its final stage "Split or Steal" which is much
akin to a PD game.2 The game consists of two contestants playing on a jackpot
determined by randomly picking balls with monetary amounts written on them. The
jackpot is to be distributed according to the two contestants' decisions in the following
way: If both choose "Split", the jackpot is split equally between them; if both choose
"Steal", both get nothing; if one contestant chooses "Split" and the other "Steal", the
one who chose "Steal" gets the entire jackpot while the other receives nothing. The
payoff matrix is presented in table 1.2 with "x" marking the jackpot amount.
Table 1.2: Split or Steal payoff matrix
Player 2
Split Steal Split x/2, x/2 0, x
Player 1 Steal x, 0 0, 0
This payoff matrix is relevant also to the American and Dutch games, "Friend or Foe" and "Deelt ie ’t of deelt ie ’t niet".
In the original PD game, the non-cooperative alternative is strongly dominant and
guarantees the player a higher payoff than the cooperative alternative, regardless of
the opponent's decision. In contrast, the non-cooperative choice in this PD-esque
game is only weakly dominant: Regardless of the other player's decision, choosing to
steal will guarantee no less (not strictly more) than choosing to split.
The game theoretic analysis of this game is quite similar to that of the original PD
game, as detailed in section 1.5 above. As previously mentioned, behavior in the lab
does not follow the game theoretic rationale for selfish players (i.e. players that care
only about their own monetary incentives). It is especially interesting, then, to review
similar behavioral statistics with regard to game show data. While it may seem trivial
or negligible to discard half of the jackpot in order to be benevolent or cooperative
2 Similar versions to the British "Split or Steal" game have been produced in the US ("Friend or Foe?")
and in the Netherlands ("Deelt ie ’t of deelt ie ’t niet", translating to "Will they share or not?")

15
when the jackpot is small, will people still choose to do so when they have a lot (say,
100,000₤) at stake?
List (2006) looked at 39 episodes of "Friend or Foe" (also represented by table
1.2). In this game, the contestants get to choose their partners, with whom they will
play during the show and participate in the final PD-type stage in order to determine
jackpot distribution. Cooperation rate was 50%, with a higher rate found among
female contestants (56% compared to 48% for males). White contestants cooperated
more than non-whites, and older contestants cooperated more than young ones,
regardless of their partner. Cooperation rate was found to depend also on partner
characteristics: Cooperation rate was higher for teams where both contestants were
old, all-white, or those who were selected by each other. Two-female teams were a
little more likely to reach the mutual cooperation outcome than mixed gender teams.
There was no effect of jackpot size on cooperation, although partners' attributes
influenced both jackpot size and contestants' decisions. Kalay, Kalay & Kalay (2003),
Oberholzer-Gee, Waldfogel & White (2004), and Kalist (2004) analyzed "Friend or
Foe" data and found similar patterns. Parallel results have been found in analyses of
the Dutch "Deelt ie ’t of deelt ie ’t niet" game (Belot, Bhaskar & van de Ven, 2006)
and the British "Split or Steal" game (Coffey, 2010).
Overall, it seems that the gender, age and race of the player play an important role
in guiding the decisions. Evidence regarding the effect of opponents' characteristics
on players' decisions is mixed. Some studies found no correlation between players'
decisions (Belot et al, 2006; List, 2006), yet others found significant dependency
(Oberholzer-Gee et al, 2004; Kalay et al, 2003). Oberholzer-Gee et al (2004) observed
that in the second season of the show, players tend to condition their decision on their
opponent's, using the opponent's characteristics to predict their decision. That is, there
appears to be a tendency to play cooperatively against those who are expected to
cooperate (women, older players, non-white), and to defect when matched with those
more likely to defect. Correspondingly, the rate of coordinated play – mutual
cooperation and mutual defection – increased, and players with cooperative attributes
earned more compared to those who were assumed to be defectors. Kalay et al (2003)
found that of all games, 21% ended in the mutual cooperative outcome, while 37.1%
resulted in mutual defection, and 42% in the asymmetrical Cooperate-Defect
outcome. This pattern implies a dependency between players' decisions, where a
player choosing to defect is more likely to meet another defector (or induce their

16
opponent to play in such a way). This evidence concurs with Oberholzer-Gee et al,
and seems to lend support to models like those presented in section 1.5.
In order to testing the hypothesis that there exist some characteristics, attributes or
behavior that enable discerning intentions of players (distinguishing cooperative from
defective types), Belot, Bhaskar & van de Ven (2008) examined observers'
predictions. They used clips from "Deelt ie ’t of deelt ie ’t niet", with particular
interest in participants' updating of their predictions. Predictions were reported on a
cooperation-probability scale (motivating them to be as accurate as possible) at 3
stages: Prior to viewing the clips, before the communication phase ("interim") and
after it ("final"). Belot et al examined how the participants' predictions change based
on their prior belief and the signals they receive (i.e. the video they watch). Analyses
found a prior belief of 43% cooperation (identical to the actual average of 43%). This
rate increased to 52% when predicting during watching the video. The predictions
were influenced by the players' gender and their contribution to the jackpot, but the
magnitude of these effects was smaller than that found in the actual game data (Belot
et al, 2006). Importantly, the players' actual decision to cooperate had a significant
positive effect on the predicted rate of cooperation. This effect was more pronounced
when players explicitly and voluntarily committed to cooperation. It is interesting to
note that the participants could differentiate between cooperators and defectors –
discern subsequent decisions – when the players' statements were made involuntarily
(when they were explicitly asked by the host), but not when they stated cooperation
voluntarily.3
We believe the question of the ability to perceive and interpret clues to deception
or defection is of high significance. Studying observers' predictions and their updating
conditional on communication, as is done by Belot et al (2008) can and do indeed
seem to support the aforementioned claims as to existence of such an ability (e.g.
Brosig, 2002; Eshel & Cavalli-Sforza, 1982; Vanneste et al, 2007). In our experiment
we thus attempt to examine it further. Our study, while similar to Belot et al (2008) in
its tools and stimuli, differs in a few important aspects. First, we ask our participants
for one prediction only for each player (compared to 2-3 predictions in Belot et al's
study), given after watching the whole relevant segment of the show. We believe that
3 This seems to point to an ability to discern intentions when players were forced to express their
opinion, or forced to lie – further supporting the claim that artificial lies do not have much external validity as to natural differences between lies and truth, liars and truth-tellers (Frank, 2005).

17
this assessment may be closer to participants' first impression; it does not require or
encourage second-thought or over-thinking, that could hinder automatic information
processing and interpretation (Patterson, 1995; Tracy & Robins, 2008; Dunning &
Stern, 1994). Second, the predictions given by our participants are binary choices.
Belot et al asked their participants to report belief on a probability scale, which has
been found to lead to different choices than binary scales, and not necessarily provide
more accurate preferences or beliefs – even when participants are motivated to report
their true opinions (Cronbach, 1946).
A different issue that was not covered by Belot et al is that of the motivation or
incentives given to the observers. As discussed in section 1.7, varying incentives may
affect observers' accuracy when they are asked to judge behavior, and particularly
when regarding verbal behavior (Hall et al, 2009). We feel this potential influence is
crucial to our understanding of the ability to predict decisions in a multi-faceted
environment; we aim to examine it – and its correlation with other variables – in our
study, detailed in the next sections.
Section 2: Hypotheses
Hypothesis 1: The more motivated the observers, the more accurate their predictions.
Cooperators and defectors differ in some behavioral attributes, which become
especially evident in high stake situations causing strong emotional responses
(DePaulo et al, 2003). We assume that the task of predicting players' decisions in the
PD game, as well as in its version we use, is one of lie detection: All the players say
or imply they intend to split (and indeed, they have a strong motive to convince their
opponent of just that). We hypothesize that a higher reward for accuracy will cause
observers to focus on and be more aware of players' behavior. If so, motivated
observers will be better at seeing and interpreting these differences – and use them to
predict players' decisions.
Hypothesis 2: Individuals will be biased towards predicting cooperation.
Literature suggests a truth bias (Gilbert et al, 1993; Bond & DePaulo, 2006), in
that there exist an automatic propensity to believe people and statements. Only when
there is sufficient contradictory evidence, or when suspicion is raised, then individuals
will consider alternate versions. If people are biased towards believing players'
statements, then they will be biased towards assuming cooperation.

18
This hypothesis implies two hypotheses regarding the correlation between players'
decisions and observers' predictions:
Hypothesis 2a: Prediction accuracy for cooperators will be higher than for defectors.
Higher prediction accuracy for cooperators is naturally derived from a cooperation
bias; in the most extreme case, predicting only cooperation, it is clear that prediction
accuracy rate for cooperators will be 100%, and 0% accuracy for defectors.
Hypothesis 2b: Prediction accuracy when predicting defection will be higher than
when predicting cooperation.
In light of relevant literature, we assume that individuals tend not to predict
defection unless they have some reason to do so. Such reasons include verbal and
nonverbal behavioral clues, as stated above. Assuming there is indeed a cooperation
bias, it can be assumed that a prediction of defection is based on strong enough
evidence suggesting the player is lying and not about to cooperate.
Section 3: "Split or Steal" Experiment
Subjects: 48 students participated in the study in 4 sessions. Of the subjects, 23 were
male and 25 female, mean age of 24.3 years (sd=5.38). They registered to the
experiment through the lab webpage, and indicated that they agreed to participate. For
their participation, subjects received a base amount of 10NIS, and an additional
amount that was to be determined by the choices they made throughout the
experiment.
Materials: The experiment was shown on PC computers with a screen resolution of
1024*768 pixels, to which a QWERTY keyboard and a headset were attached.
4 video clips were used, showing the "Split or Steal" part from the UK "Golden
Balls" game show. Each clip showed the host explaining the game, and two
contestants ("targets") engaging in cheap talk prior to making their decision. The
money amounts varied from 17,810 to 100,130GBP. In 3 of the clips, the two targets
were female, and in the other one, there was one male and one female. In 3 clips, the
outcome was "Split"/"Steal", and in the 4th – "Steal"/"Steal". Mean length of the clips
was 2:30 minutes, and they were shown at a screen resolution of 640*480 pixels.
We used a trust questionnaire adapted from Yamagishi & Yamagishi (1994) in
order to evaluate participants' level of trust in others and society.

19
Design: The main dependent variable is the percentage of correct identifications or
guesses subjects made regarding targets' choices. The independent variable is the
motivation or the attention subjects allocated to the target: a target could be "critical"
– subjects would get a large payoff (10NIS) for correctly guessing target's choice – or
"non-critical" – a correct guess provides a small payoff (2NIS) to the subject. It is
important to note that subjects were told they would have to guess for the non-critical
target only after watching the first clip. Each target was critical for half of the
subjects, and non-critical for the other half – which allows us to test for motivation
effect on each target's decision predictability.
Subjects were asked to guess the decisions for all 8 targets. In each clip, one target
was said to be critical and the other non-critical, which means each subject guessed
for 4 critical targets and 4 non-critical targets. This permits testing the independent
variable within-subject, regardless of individual predicting ability, as well as between
subjects on targets' predictability.
Clip order was randomized between subjects. Half of the critical targets for each
subject were on the right of the screen, the other half on the left.
Procedure: Subjects were led into the lab in groups of 12, and asked to sit at
individual computer stations. They were instructed by the experimenter to sit quietly
and not talk among or to themselves during the experiment. Subjects put on their
headsets and began the experiment. The instructions were shown on the screen at an
individually set pace, explaining the "Split or Steal" game and payoff structure. They
were told that for each clip, they would have to guess the decision for one target,
presented to them by his or her position on screen (right or left) – for a correct guess
they would get 10NIS.
The clips were described as "part of episode number X", and the jackpot amount
was presented. After viewing each clip, subjects were asked to indicate the choice
they thought the (critical) target would make – Split or Steal – by pressing the
corresponding key on the keyboard, as well as their confidence level for this
judgement (on a 1-7 scale). After this, they were told they will now be asked to guess
the other (non-critical) target's choice, and will be awarded 2NIS for a correct guess.
Again, subjects marked their guess and confidence level. Between videos there was a
5 second break.
After completing the questions for all 4 clips, subjects were asked to indicate how
much of the dialogs they understood (1-5 scale), how much they relied on different

20
verbal and nonverbal cues (1-7 scale) and completed the Yamagishi & Yamagishi
(1994) trust scale. Subjects were also asked for a few demographic details and
whether they knew the "Split or Steal" clips or the PD game beforehand.
After all subjects in each session finished the experiment, they were debriefed by
the experimenter, and entered another room one by one to receive their payment.
Results:
Three out of 48 participants (three females, in different sessions) indicated they
knew the "Split or Steal" game beforehand, and were excluded from data analysis.
The average reward was 36.4 NIS per participant (including a 10 NIS show-up fee),
with actual payoffs ranging from 22 to 44 NIS for 30 minutes of participation.
Correct identification (accuracy) rates were computed for each target, for each
Criticality condition separately. This data is shown in figure 3.1, and in figure A.1 in
appendix A. Analysis found no significant effect of criticality for any individual target
except D1, who chose to steal (F(1,43)=5.4, p=.025).4
Subject sex did not have any effect on accuracy rates, and neither did the session
the subject participated in, so we collapsed the data across these variables.
Results from the first clip shown to each subject were compared to those from the
3 subsequent clips. This was done to check whether subjects' knowledge of the non-
critical targets' existence is influential. Analysis revealed no significant differences
(F(1,178)=.007, p>.9). This result seems to imply there is no (or little) learning
throughout the experiment (which is to be expected as subjects are given no feedback
regarding their accuracy).
Predictably, accuracy rates differ not only between subjects, but also between
targets – ranging from .26 to .78. This can be explained by looking at target choices:
accuracy rates for targets who chose to split ("Splitters"; m=.704, sd=.268) are higher
than those for targets who chose to steal ("Stealers"; m=.422, sd=.246). It must be
noted, however, that a direct parametric comparison between these is not possible, due
to the asymmetry of the number of targets (3 splitters and 5 stealers).
4 t statistics: : tA1(43)=-.722, p>.4; tA2(43)=1.037, p>.3; tB1(43)=.732, p>.4; tB2(43)=.732, p>.4;
tC1(43)=-.078, p>.9; tC2(43)=-1.056, p>.2; tD1(43)=2.318, p=.025; tD2(43)=.831, p>.4

21
Figure 3.1: Accuracy Rates by Target
Targets A1, A2 played each other in clip A, B1 and B2 in clip B and so forth. Participants saw either targets numbered with1 as critical, or targets numbered with 2.
Targets who chose to split are marked in yellow and those who stole are in grey.
* Criticality effect was significant at .05 level.
Response Bias: Hypothesis 2, assuming a cooperation bias, was supported by the data
– as can be seen in figure 3.2. Participants certainly predicted more split than steal
(225 split versus 135 steal decisions). This trend remained similar when dividing by
target criticality. Conducting a Chi-squared test on choice data revealed a significant
correlation between target- and participant choice (χ2(1)=5.8, p=.016): Participants
tended to predict "Split" rather than "Steal", and this tendency was more pronounced
when the target chose to split. 5
Splitters versus Stealers: Dividing participants' predictions by target decision – Split
or Steal – enables us to test hypotheses 2a and 2b.
In order to verify hypothesis 2a, we examine prediction accuracy rates for splitters
and for stealers separately. The accuracy rate for splitters was 70.37%, versus 42.22%
accuracy for stealers. This result was supported by a within-subject analysis as well.
5 It should be noted that these analyses does not take into account the possible correlation between
predictions made by the same participant.
Figure 3.2: Frequencies of Subject Choices by Criticality and Target Decision
Critical Target Non-critical Target Total Target
Split Steal Total Split Steal Total Split Steal Total Split 47 59 106 48 71 119 95 130 225 Steal 20 54 74 20 41 61 40 95 135
Subject Choice
Total 67 113 180 68 112 180 135 225 360
In total, 190 of 360 choices were correct (Split-Split or Steal-Steal; marked in dark grey).
0
0.1
0.2
0.3
0.4
0.5
0.6
0.7
0.8
0.9
A1 A2 B2 C1 Total
Critical
Non-critical
Total
*
B1 C2 D1 D2

22
We again averaged predictions over targets, and tested the accuracy difference when
predicting for splitters versus stealers within-subject. Due to the different number of
splitters and stealers (3 splitters and 5 stealers, with 3 Split-Steal outcomes and one
Steal-Steal), we looked only at predictions for the 3 Split-Steal clips. Accuracy rates
for splitters were higher than those of stealers (Split: m=.704, sd=.268; Steal: m=.452,
sd=.294; Paired-t(44)=3.799, p<.001). Importantly, accuracy rates for these 3 stealers
did not differ significantly from accuracy rates for the 2 stealers who competed
against each other (m=.378, sd=.387; Paired-t(44)=1.074, p>.2).
Hypothesis 2b requires looking at the data by participant choice. Out of 225
predictions of Split, only 95 (42.22%) were correct. In contrast, 95 (70.37%) out of
the 135 Steal predictions were correct.
These results seem to support our hypotheses: Participants tend to "trust" targets,
in a way, or simply are more conservative or cautious in predicting a target will steal
(supporting hypothesis 2a); nevertheless, when participants do decide to predict Steal,
they are usually right (supporting hypothesis 2b).
The difference between splitters and stealers was not affected by subject sex
(F(1,43)=.650, p>.4) or the counterbalance variable (indicating which targets were
critical) (F(1,43)=.650, p>.4).
Criticality: Our main hypothesis assumes that "money makes the world go round":
The more motivated subjects are to make a correct prediction, the better they will do.
In order to test this, we computed two proportions for each participant: Accuracy rate
for critical targets and accuracy rate for non-critical targets. These are presented as the
last 3 bars in figure 3.1, as well as in the last column of figure A.1 in appendix A.
These variables allow testing the effect of criticality within-subject, across different
targets. Using a within-subject paired t-test, we observe significantly higher accuracy
rates for critical targets than for non-critical (Critical: m=.56, sd=.2; Non-critical:
m=.47, sd=.21; Paired-t(44)=1.735, p=.045). There was no significant effect of sex
(F(1,43)=.061, p>.8) or counterbalance (F(1,43)=.375, p>.5).
The data thus supports our hypothesis: Criticality seems to increase prediction
accuracy. However, since we collapse across targets, this measure ignores the effect
of target decision, which was found to be significant. This interaction between
criticality and target decision shall be the focus of the following section.

23
Choices and Criticality: There was a significant 3-way interaction of criticality
*participant-choice*target-choice (χ2(4)=8.7, p=.069). This can be explained by
separating the data by criticality: There is a significant correlation between target- and
participant choice only for critical targets (χ2(1)=5.7, p=.017), and not for non-critical
targets (χ2(1)=.99, p>.3). That is, target decision influenced predictions only when
participants received a high reward for their accuracy.
Another interesting observation appears when separating the data by target
decision: Criticality increased prediction accuracy only when participants predicted
for stealers (χ2(1)=2.89, p=.089), and not when viewing splitters (χ2(1)=0, p=1). This
can be seen also by looking at figure 3.2: Criticality induces different prediction rates
for Split / Steal, as well as different accuracy rates. Figures 3.3a and 3.3b display
these two correlated results. Figure 3.3b presents average accuracy rates by target
decision and criticality. In figure 3.3a we show Split prediction rate, instead of correct
response rate (Split for splitters, Steal for stealers). We transformed stealers' scores in
order to directly compare participants' responses across target decisions.
Looking at figure 3.3a, it appears that for non-critical targets, participants predict
the same Split rate regardless of target decision (Sign test: Z=1.078, p>.28). The
effect of target decision appears only when it is critical. In this case, Split prediction
rate is significantly lower for stealers than for splitters (Z=2.373, p=.018). Analysis
demonstrated a significant difference of Split rates between critical and non-critical
stealers (Z=1.905, p=.057), and no difference between critical and non-critical
splitters (Z=.567, p>.5). That is, the effect of criticality on predictions appears only
for stealers. Figure 3.3b highlights the issue of prediction accuracy. As mentioned, the
Figure 3.3a and 3.3b: Prediction Rates by Criticality and Target Decision
3.3a: Split Prediction Rates 3.3b: Accuracy Rates
CriticalNon-critical
Split
Steal
0.71110.6889
0.5222
0.6519
0
0.1
0.2
0.3
0.4
0.5
0.6
0.7
0.8
Critical
Non-critical
Split
Steal
0.71110.6889
0.4778
0.3481
0
0.1
0.2
0.3
0.4
0.5
0.6
0.7
0.8

24
effect of criticality on participant choice was significant only for stealers: Looking at
targets who stole, participants were more likely to get it right if these were critical.
Confidence: Participants marked their confidence level in each prediction, on a 1-7
scale. The descriptive statistics can be found in figure A.3 in appendix A. Confidence
level is significantly correlated to prediction accuracy (Pearson's r=.097, p=.066).
Accordingly, we found a significant effect of participants' predictions on their
confidence level (F(1,43)=5.204, p=.023). We found no effect of criticality
(F(1,43)=1.569, p>.2), target decision (F(1,43)=.062, p>.8), or any interaction effects.
In light of the correlation between confidence and accuracy, and the previously
mentioned differences in accuracy between splitters and stealers, we divided the data
by target decision. This revealed interesting effects: Only when predicting stealers,
criticality, prediction and the interaction affect confidence levels (Criticality:
F(1,224)=3.89, p=.05; Prediction: F(1,225)=5.76, p=.017; Interaction: F(1,224)=2.98,
p=.085). These do not affect confidence levels when predicting for splitters.
Other Variables:
Trust: Literature suggests individual differences in trust or altruism may have an
influence on the ability to associate such attributes with the behavior of others (e.g.
Yamagishi et al, 1999). In our study, participants were asked five questions pertaining
to their trust in other people's integrity and fairness (Yamagishi & Yamagishi, 1994;
1-7 scale). We averaged scores across questions for each participant, revealing a mean
score of 3.66 and a median of 3.8 (sd=.59). Subject pool was divided by the median
score in order to check a possible influence of this trust variable on accuracy rates. No
significant effect was found on any accuracy rate variable – for critical targets
(t(43)=.32, p>.7) or non-critical (t(43)=1.62, p>.11); splitters (t(43)=.991, p>.3) or
stealers (t(43)=.644, p>.5).
Dialog: Targets in our clips conversed in English (some with a thick accent),
which is not our participants' first language. After viewing all 4 videos, participants
were asked how much of the dialog they understood, on a 1-5 scale (1=understood all;
5=didn't understand). Most (35 of 45) subjects indicated they understood the entire
dialog, 6 others indicated they understood most of the dialog, 3 others marked the
middle point of the scale, and one indicated they did not understand most of the dialog
(overall mean=1.33, sd=.707). Entering dialog understanding into the analysis did not
produce any significant differences. Dividing our participants by the mean or median
25
result did not show any effect on the accuracy rate for critical (t(43)=0.196, 0>.8) or
non-critical targets (t(43)=0.329, p>.7), for splitters (t(43)=0.491, p>.6) or for stealers
(t(43)=0.032, p>.9).
Target Attributes: Participants were asked which attributes, if any, they took into
account when making their predictions. They were asked to mark their perceived
importance of six attributes (1-7 scale where 1 is the highest score): Appearance,
facial expressions, eye contact between targets, body movement, tone of voice and
verbal content. ANOVA analyses showed no effect of any of the six attributes or their
average on accuracy scores for each target or for any of the average accuracy rates –
for splitters, stealers, critical or non-critical targets, or any other variable.
Reaction Time:
An additional set of results we analyzed is that concerning participants' reaction
time (RT), that is, the time it took them to make their predictions. Since RT has been
found to be significantly influenced by language understanding, we excluded 10
participants who marked less than the maximum on the dialog-understanding scale.
Figure 3.4 presents this data. Exact statistics can be seen in figure A.2 in appendix A.
Criticality: There was a significant effect of criticality on participants' RT for 4
out of 8 targets: B1, C1, D1 and D2 (all but C1 chose to steal).6 A repeated measures
analysis within-subject found a significant difference in RT when subjects were asked
to guess for critical versus non-critical targets, with RT for critical targets being
almost twice that of non-critical targets (F(1,34)=15.182, p<.001). However, it is
important to note these differences do not necessarily reflect the effect of incentives:
Critical targets were always predicted first and non-critical targets second. This order
affects RT (e.g. Corballis, 1967) – and might interact or cancel an incentive effect.
Target Decision: We collapsed RT data above the 3 Split-Steal clips by target
decision (similarly to the analysis described in the "Splitters versus Stealers" section
above). Participants were slower when they were asked about stealers (m=5.79 secs,
sd=3.36) than splitters (m=4.32, sd=2.43), a difference which was found significant in
a repeated measures analysis (F(1,34)=13.26, p=.001). The mean RT for the other two
targets (stealing against each other) was similar to the RT for the 3 stealers above (2
stealers: m=5.6, sd=3.91; Paired-t(34)=0.245, p>.8).
6 t statistics: tA1(34)=1.226, p>.2; tA2(34)=1.326, p>.1; tB1(34)=1.964, p=.065; tB2(34)=0.650, p>.5;
tC1(34)=2.766, p=.011; tC2(34)=0.798, p>.4; tD1(34)=2.518, p=.019; tD2(34)=3.393, p=.003

26
The difference in RT between splitters and stealers was not affected by participant sex
(F(1,33)=0.006, p>.9) or counterbalance (F(1,33)=0.761, p>.3). Dividing the subject
pool by the median trust score did not have a significant effect on any RT variable,
including the difference between splitters and stealers (t(33)=0.178, p>.8).
Choices and Criticality: A within-subject mixed model analysis on RT found main
effects of criticality (F(1,34)=12.359, p=.001) and target decision (F(1,34)=3.812,
p=.052), and significant interaction effects between criticality and target decision
(F(1,34)=2.995, p=.085), and between participant choice and criticality (F(1,34)=4.91,
p=.028). Participant choice did not significantly affect RT (F(1,34)=0.01, p>.9), and
neither did its interaction with target decision (F(1,34)=0.147, p>.7). It seems that
criticality (or order) had the most influence on RT, but this effect was also mediated
by target decision. RT statistics by these variables are presented in table 3.5.
Dialog: While we observed a significant RT difference between participants who
understood the entire dialog and those who didn't (t(43)=2.111, p=.041), analyzing the
data for the entire subject pool did not significantly change the result pattern.
Figure 3.4: RT by Target and Criticality
Targets who chose to steal are marked in grey squares.
* Criticality effect on RT is significant at .05 level.
Figure 3.5: RT (sec) by Subject Choice, Criticality and Target Decision
Critical Target Non-critical Target Total Subject Choice Split Steal Total Split Steal Total Split Steal Total
Split 5.64
(4.17) 8.09
(8.24) 6.99 (6.8)
2.68 (2.66)
3.33 (4.15)
3.06 (3.62)
4.16 (3.78)
5.5 (6.76)
4.93 (5.71)
Steal 4.49
(2.49) 6.81
(5.42) 6.52
(6.92) 4.95
(7.61) 4.62
(4.66) 4.72
(5.66) 4.72
(5.57) 5.84
(5.18) 5.52
(5.29)
Total 5.32 (3.79)
7.49 (7.05)
6.68 (6.12)
3.31 (4.63)
3.8 (4.49)
3.61 (4.45)
4.31 (4.33)
5.65 (6.14)
5.15 (5.56)
0
1000
2000
3000
4000
5000
6000
7000
8000
9000
A1 B1 B2 C1 Total
CriticalNon-criticalTotal
* ***
A2 C2 D1 D2

27
Section 4: Summary and Discussion
Our experiment was conducted using real game show data from the British
"Golden Balls" series. Contestants play a version of the Prisoner's Dilemma game and
so have a strong incentive to lie and hide their intentions, as well as to discern others'
intentions. In light of literature concerning lie detection and statistical analyses of
game show data (see sections 1.5, 1.6 and 1.8 above) we tested whether observers,
and not only the players themselves, are able to discriminate between cooperators and
defectors.
The main research question regarded the effect of motivation on accuracy.
Specifically, we hypothesized that the higher the incentive given to participants to
predict correctly, the better they will do. We manipulated this using two pay levels for
accuracy, 10 and 2 NIS. The "criticality" variable was found to have a significant
effect on accuracy, in the presumed direction: Participants were more accurate in their
predictions when they were to receive more money if these predictions were correct.
Our second hypothesis was that participants will be biased towards believing
players will cooperate. This hypothesis is related to the truth or belief bias found in
many studies (Bond & DePaulo, 2006; Ekman et al, 1999; Meissner & Kassin, 2002;
Gilbert et al 1993), in that the propensity to trust or believe is automatic and only
occasionally people dedicate time and effort to try and disprove the content. This bias
implies that prediction accuracy rate for cooperators will be higher than that of
defectors (hypothesis 2a). Also, it suggests that prediction of defection will be more
accurate than that of cooperation (hypothesis 2b): If biased towards predicting
cooperation, people will tend to shift only when there is strong evidence to the
contrary. We found such tendencies in our study: Predicted Split rate was almost
twice the predicted Steal rate; correspondingly, accuracy rate for splitters was
significantly higher than accuracy rates for stealers, as suggested by hypothesis 2a.
Testing hypothesis 2b, we found that when predicting Split, participants were far less
accurate compared to when predicting Steal.
Interestingly, we found that the effect of criticality exists only when predicting
decisions of targets who chose to defect ("Steal"); when predicting cooperators'
behavior, participants had the same accuracy rate regardless of promised payoff. We
did not anticipate this result. This result, pending replication in future studies, may
shed light on the differences between lies and truth, and lend support to both of our

28
hypotheses – perhaps also implying their conjunction. We assumed that motivational
differences will lead to higher accuracy rate in predictions, as motivated observers are
more likely to be attentive to the targets and their behavior. However, this attentional
difference is likely to increase accuracy only to the extent that there exist (behavioral)
clues for targets' decision and that they are noticed and interpreted correctly. In light
of lie detection literature, we assume that targets exhibit specific behavioral pattern
when they lie (and intend to defect) than when they tell the truth (and intend to
cooperate) (Ekman, 1989; DePaulo & Morris, 2004; Vrij & Mann, 2004). Thus,
motivation – via attention – will increase accuracy when there is indeed something to
pay attention to; only for liars there exist telling behavior, and for them it may be
possible to elevate prediction accuracy.
Our data points to a difference between the two accuracy rewards. However, it
could be said that our 2 or 10 NIS incentives did not much differ from one another,
and that the observed pattern is a result of the order of questions: The 10 NIS target
was always presented first, before the video rather than after it (as was the 2 NIS
target). Our participants seemed very engaged during the entire experiment, both
before and after viewing each clip, and were happy about their payment. In addition,
after viewing the first video clip, predicting the critical target and perhaps surprised
by having to predict the non-critical target, it is very likely participants were aware
that they would be asked to predict both decisions. In this case, had the incentives not
been different from one another, we would not find the observed differences in
accuracy for the last 3 videos. That said we recognize the need to further examine the
effect of primacy or recency of a target on prediction accuracy rates, regardless of
payoff. Further research should manipulate the presentation order of targets and
payments, as well as their temporal position relative to participants' viewing of the
video clip.
It is important to note that there are certain caveats to using game show data.
Since the shows are taped in front of an audience and aired, players know that they are
observed and expected to make certain decisions. Frank (2005) made this criticism
regarding lie detection studies conducted in labs, and we feel it is fitting here as well.
A similar claim was made by List (2006), in that the game show setting transforms the
one-shot PD-esque game into a repeated interaction game, as it is also played with the
audience, in a sense – players' choices are scrutinized by audience members, and
might affect his future outcomes. Additionally, it can be argued that players are not

29
representative of the general population; they might be better actors (liars?), more or
less extroverted and so forth. We do not attempt to extrapolate from our results and
claim they apply to all situations. Nevertheless, we believe that our findings can shed
some light on the ability to interpret behavior in various situations, and not only in
this very specific and limited setting – a claim reinforced by Frank & Ekman (1997).
There are two other important caveats regarding our stimuli and experimental
design.. First, in our stimuli material, the female/male target ratio was very
unbalanced, with only one target being male. Thus, our results probably cannot be
generalized above target gender – the observed accuracy rates and differences found
are possibly characteristic only for females. This matches findings by DePaulo, Stone
& Lassiter (1985b) suggesting that females might be more motivated to appear as
though telling the truth, therefore being more inadvertently obvious about their lies (in
accordance with DePaulo et al, 2003; DePaulo, Kirkendol, Tang & O'Brien, 1988;
Ekman & Friesen, 1969). However, data pattern for the male target did not
significantly differ from the overall pattern, and there was no interaction between
target- and participant gender. Nevertheless, we feel target gender should be examined
thoroughly in a more balanced design; further research should also regard what effect,
if any, does an interaction of target gender and decision have on observers' predictions
(a related effect has been observed in Belot et al, 2008).
Second, target decision, and especially its interaction with the criticality variable,
was unbalanced as well, as our clips included 3 "Split" choosers and 5 "Steal"
choosers. Moreover, it should be noted that 3 out of the 4 videos ended in the
asymmetric Split-Steal result, and the remaining video ended in mutual-Steal. This
made some statistical tests impossible or difficult, as discussed in the results section
above. We coped with this issue first by using non-parametric tests, averaging across
participants rather than testing within-subject. We also examined the predictions and
accuracy rates separately for each outcome, and found no differences between the 3
Split-Steal clips and the one clip depicting the mutual-Steal outcome. We thus think
that these methodological problems did not influence the observed patterns to a large
extent. However, we encourage future research to use stimuli with various outcomes
and more equal Split/Steal ratios to test this claim.
In the scope of this paper, we could not possibly aim to answer all the intriguing
questions accompanying such a broad topic. Such questions, in our opinion, include
observers' reliance on different aspects of behavior: Research has shown differences

30
in both processing and interpreting verbal compared to nonverbal behavior (Hall et al,
2009). We asked our participants which aspects they used while making their
predictions, but it would be interesting to examine this in a setting where it is not
possible to rely on certain aspects. These may include muted video clips, sound clips
without visual data, or videos where targets are conversing in a language entirely alien
to the observers (Ekman, 1989).
One should note that there might be cultural differences in the attributes that
signal lying or cheating, or conversely, pro-social behavior (Bond, Omar, Mahmoud
& Bonser, 1990); it could be said that one should look only at lie detection within a
specific culture and not – as we did – take video clips depicting people from a
different culture. Nevertheless, while there is an in-group accuracy advantage
(Elfenbein & Ambady, 2002), it seems that stress signals are quite universal, and
many behavioral clues to deception are consistent across cultures (Elfenbein &
Ambady, 2002; Bond & Atoum, 2000; Cheng & Broadhurst, 2005).
Another issue which we think to be worth examination is the predictors' role in the
game – whether they are objective observers, or whether their payoff is dependent on
players' actions. In our study, participants' reward depended on the players' decision
only to the extent that participants predicted correctly; one could devise a similar
setting where participants decide on their own course of action against one of the
players, as well as predict players' decisions – thus participants' payoff would be a
conjunction of his own decision and the predicted player's decision. It may be argued
that participants in this alternative setting would be more motivated to correctly
discern the player's intent, as they are interested in the final outcome and not only
their accuracy (i.e. their accuracy affects their own actions).
In conclusion, our study attempted to incorporate social dilemmas – particularly
those occurring outside psychology and economics laboratories – and lie detection
research (which has used almost exclusively stimuli acted and taped in labs). We
believe it is worthwhile to use game show data as an example of a real-life high-stake
cheater detection task, and think our study, while preliminary, provides an important
opening for future studies.
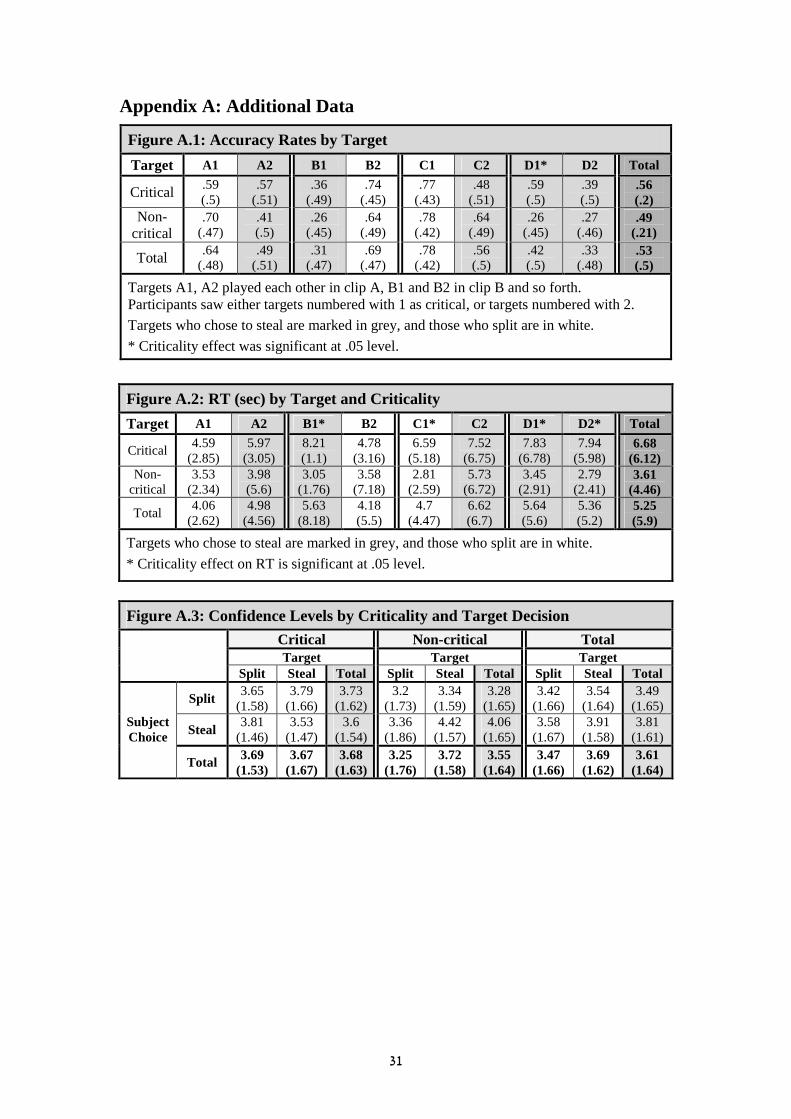
31
Appendix A: Additional Data
Figure A.1: Accuracy Rates by Target
Target A1 A2 B1 B2 C1 C2 D1* D2 Total
Critical .59 (.5)
.57 (.51)
.36 (.49)
.74 (.45)
.77 (.43)
.48 (.51)
.59 (.5)
.39 (.5)
.56 (.2)
Non-critical
.70 (.47)
.41 (.5)
.26 (.45)
.64 (.49)
.78 (.42)
.64 (.49)
.26 (.45)
.27 (.46)
.49 (.21)
Total .64 (.48)
.49 (.51)
.31 (.47)
.69 (.47)
.78 (.42)
.56 (.5)
.42 (.5)
.33 (.48)
.53 (.5)
Targets A1, A2 played each other in clip A, B1 and B2 in clip B and so forth. Participants saw either targets numbered with 1 as critical, or targets numbered with 2.
Targets who chose to steal are marked in grey, and those who split are in white.
* Criticality effect was significant at .05 level.
Figure A.2: RT (sec) by Target and Criticality
Target A1 A2 B1* B2 C1* C2 D1* D2* Total
Critical 4.59
(2.85) 5.97
(3.05) 8.21 (1.1)
4.78 (3.16)
6.59 (5.18)
7.52 (6.75)
7.83 (6.78)
7.94 (5.98)
6.68 (6.12)
Non-critical
3.53 (2.34)
3.98 (5.6)
3.05 (1.76)
3.58 (7.18)
2.81 (2.59)
5.73 (6.72)
3.45 (2.91)
2.79 (2.41)
3.61 (4.46)
Total 4.06
(2.62) 4.98
(4.56) 5.63
(8.18) 4.18 (5.5)
4.7 (4.47)
6.62 (6.7)
5.64 (5.6)
5.36 (5.2)
5.25 (5.9)
Targets who chose to steal are marked in grey, and those who split are in white.
* Criticality effect on RT is significant at .05 level.
Figure A.3: Confidence Levels by Criticality and Target Decision
Critical Non-critical Total Target Target Target
Split Steal Total Split Steal Total Split Steal Total
Split 3.65
(1.58) 3.79
(1.66) 3.73
(1.62) 3.2
(1.73) 3.34
(1.59) 3.28
(1.65) 3.42
(1.66) 3.54
(1.64) 3.49
(1.65)
Steal 3.81
(1.46) 3.53
(1.47) 3.6
(1.54) 3.36
(1.86) 4.42
(1.57) 4.06
(1.65) 3.58
(1.67) 3.91
(1.58) 3.81
(1.61) Subject Choice
Total 3.69 (1.53)
3.67 (1.67)
3.68 (1.63)
3.25 (1.76)
3.72 (1.58)
3.55 (1.64)
3.47 (1.66)
3.69 (1.62)
3.61 (1.64)

32
Appendix B: Experiment Design "!לחלוק או לגנוב"ברוכים הבאים לניסוי
. ברוכים הבאים לניסוי בקבלת החלטות
.אתם מתבקשים לשמור על השקט לאורך כל הניסוי .ואחד הנסיינים ייגש אליכם, אנא הרימו את ידכם, אם יש לכם שאלות
.כל עוד לא כתוב אחרת, תעביר אתכם למסך הבא" רווח"לחיצה על מקש
. בניסוי זה תתבקשו לצפות במספר קטעי וידיאו ולענות על מספר שאלותאופן החישוב יוסבר (ותשלום נוסף שייקבע על פי תשובותיכם לשאלות ₪ 10תמורת ההשתתפות בניסוי תקבלו תשלום בסיס בסך
). בהמשך .באופן אנונימי, ם לכם מיד בסיום הניסוי במזומןהכסף שתרוויחו בניסוי ישול
".Golden Balls"קטעי הוידיאו שאתם עומדים לראות לקוחים מתוך שעשועון אנגלי הנקרא
וכעת עליהם להחליט על אופן חלוקת , בכל קטע מופיעים שני משתתפים אשר השיגו סכום כסף במהלך המשחק בהתמודדות זה מול זה :הכסף ביניהם
"Split or Steal", "וק או לגנובלחל"
"). steal" ("לגנוב"ובתוך האחר , ")split" ("לחלוק"שבתוך אחד רשומה המילה , לכל משתתף שני כדורים זהובים
:הכסף מחולק בהתאם לכללים הבאים. כל משתתף צריך לבחור כדור אחד מבלי לדעת איזה כדור בחר המשתתף השני .כל אחד מקבל מחצית מסכום הכסף, "לוקלח"אם שני המשתתפים בוחרים – .זה שבחר לגנוב לוקח את כל הכסף, "לגנוב"והאחר " לחלוק"אם משתתף אחד בוחר – .שניהם יוצאים מהמשחק בידיים ריקות, "לגנוב"אם שני המשתתפים בוחרים –
אשר בכל אחד מהם , יכם מספר קטעיםכעת יוצגו בפנ. לפני ההחלטה המשתתפים מקבלים מספר דקות שבהן הם יכולים לדבר זה עם זה
. מוצגת השיחה בין השחקנים בפרק אחר בתכנית .אשר זהותו תיקבע בהמשך, תתבקשו לנחש איזו החלטה קיבל אחד מן שחקנים, לאחר הצגת כל שיחה–אנא התבוננו בקטעים בעיון
. בתכנית7הקטע שאתם עומדים לראות הינו מתוך שלב הסיום של פרק .ט" ליש61,060ות משחקות זו מול זו על סכום של המשתתפ
.עליכם לנחש את ההחלטה של המשתתפת מימין
.בנוסף לסכום שצברתם ₪ 10תקבלו , אם תנחשו נכון • .לא תקבלו סכום נוסף, אם תנחשו לא נכון •
--וידיאו קטע --
? מה הניחוש שלכם לגבי ההחלטה של המשתתפת מימין Steal -לגנוב • Split -לחלוק •
?לגבי ההחלטה של המשתתפת מימין כמה אתם בטוחים בתשובתכם
7 6 5 4 3 2 1
בטוח לגמרי לא בטוח כלל
).משמאל(כעת תתבקשו לנחש גם את ההחלטה של המשתתפת האחרת .נוספים ₪ 2תקבלו ,אם תנחשו נכון את ההחלטה של משתתפת זו
? תפת משמאלמה הניחוש שלכם לגבי ההחלטה של המשת
Steal -לגנוב • Split –לחלוק •
?שמאללגבי ההחלטה של המשתתפת מ כמה אתם בטוחים בתשובתכם
7 6 5 4 3 2 1
בטוח לגמרי לא בטוח כלל
. קטעים נוספים3לגבי מופיעים לעיל שאלות צגת הקטע והה -- -- )שמאל /ימין( הקריטי השחקןשל רנדומיזציה יש ו, קטעים אקראיהסדר
?בין המשתתפים עד כמה הבנתם את הדיאלוגים5 4 3 2 1
הבנתי הכל בכלל לא

33
.אנא ציינו כמה השתמשתם או התחשבתם במאפיינים שונים בעת ניחוש החלטות השחקנים בהם צפיתם, בשאלות הבאות
מראה הפנים7 6 5 4 3 2 1
התחשבתי מאוד כלל לא התחשבתי הבעות הפנים
7 6 5 4 3 2 1 התחשבתי מאוד כלל לא התחשבתי
קשר עין בין השחקנים
7 6 5 4 3 2 1 התחשבתי מאוד כלל לא התחשבתי
תנועות גוף
7 6 5 4 3 2 1 התחשבתי מאוד כלל לא התחשבתי
טון דיבור
7 6 5 4 3 2 1 התחשבתי מאוד כלל לא התחשבתי
תוכן הדברים
7 6 5 4 3 2 1 התחשבתי מאוד ל לא התחשבתיכל
: תוך שימוש באפשרויות התשובה הבאות, אנא ציינו את המידה בה אתם מסכימים או מתנגדים לכל אחת מהאמרות הבאות
5 4 3 2 1
במידה מסכים מסכים בהחלט מועטה
ומתנגד מסכים במידה שווה
במידה מתנגד מתנגד בהחלט מועטה
שויים להרוויח מכךרוב האנשים ישקרו אם הם ע
5 4 3 2 1
ומתנגד מסכים במידה מועטה מסכים מסכים בהחלט מתנגד בהחלט במידה מועטה מתנגד במידה שווה
אנשים נדיבים לעיתים קרובות מנוצלים על ידי אחרים
5 4 3 2 1
במידה מסכים מסכים בהחלט מועטה
ומתנגד מסכים במידה שווה
במידה מתנגד טמתנגד בהחל מועטה
השגה של מטרות חברתיות לעיתים קרובות נכשלת בגלל העדר שיתוף פעולה מצד אנשים אנוכיים
5 4 3 2 1
במידה מסכים מסכים בהחלט מועטה
ומתנגד מסכים במידה שווה
במידה מתנגד מועטה
מתנגד בהחלט
רוב האנשים הם הוגנים באופן בסיסי
5 4 3 2 1
במידה מסכים מסכים בהחלט טהמוע
ומתנגד מסכים במידה שווה
במידה מתנגד מועטה
מתנגד בהחלט
בחרו שלא לעבוד ייותר אנשים, אם הביטוח הלאומי ירחיב את הקריטריונים לתמיכה כספית בקבוצות שאינן עובדות
5 4 3 2 1
במידה מסכים מסכים בהחלט מועטה
ומתנגד מסכים במידה שווה
במידה מתנגד מתנגד בהחלט מועטה
:אנא מלאו מספר פרטים דמוגרפיים, לסיום
נ / ז :מין :גיל
ל / כ ?לפני הניסוי היה מוכר לך" Split or Steal"האם המשחק ל / כ ?מוכר לך" דילמת האסיר"האם המושג
!תודה

34
References: Akehurst L, Kohnken G, Vrij A, and Bull R (1996) / Lay Persons' and Police Officers' Beliefs
Regarding Deceptive Behaviour. Applied Cognitive Psychology, 10(6), 461-472.
Albrechtsen JS, Meissner CA & Susa KJ (2009) / Can intuition improve deception detection performance? Journal of Experimental Social Psychology, 45(4), 1052–1055.
Ambady N & Rosenthal R (1992) / Thin slices of expressive behavior as predictors of interpersonal consequences: A meta-analysis. Psychological Bulletin, 111, 256-274.
Ambady N, Bernieri FJ & Richeson JA (2000) / Toward a histology of social behavior: Judgmental accuracy from thin slices of the behavioral stream. Advances in Experimental Social Psychology, 32, 201–271.
Anderson DE, DePaulo BM & Ansfield ME (1999) / Beliefs about cues to deception: Mindless stereotypes or untapped wisdom? Journal of Nonverbal Behavior, 23(1), 67–89.
Axelrod R (1984) / The Evolution of Cooperation. Basic Books, New York.
Belot M, Bhaskar V & van de Ven J (2006) / A Public Dilemma: Cooperation with Large Stakes and a Large Audience, Working Paper 221, ELSE, University College London.
Belot M, Bhaskar V & van de Ven J (2008) / Predicting Trustworthiness, Detecting Deceit: Are Human Observers any Good? mimeo.
Biesanz JC & Human LJ (in press) / The Cost of Forming More Accurate Impressions: Accuracy-Motivated Perceivers See the Personality of Others More Distinctively but Less Normatively than Perceivers without an Explicit Goal. Psychological Science.
Bond CF & Atoum AO (2000) / International Deception. Personality and Social Psychology Bulletin, 26(3), 385-395.
Bond CF & DePaulo BM (2006) / Accuracy of deception judgements. Personality & Social Psychology Review, 10, 214–234.
Bond CF, Omar A, Mahmoud A & Bonser RN (1990) / Lie detection across cultures. Journal of Nonverbal Behavior, 14, 189-204.
Brosig J (2002) / Identifying cooperative behavior: some experimental results in a prisoner’s dilemma game. Journal of Economic Behavior & Organization, 47(3), 275-290.
Brown WM, Palameta B & Moore C (2003) / Are there nonverbal cues to commitment? An exploratory study using the zero-acquaintance video presentation paradigm. Evolutionary Psychology, 1, 42-69.
Camerer CF (2003) / Behavioral Game Theory. Princeton University Press, Princeton.
Cheng KHW & Broadhurst R (2005) / The detection of deception: The effect of first and second language on lie detection ability. Psychiatry, Psychology, and Law, 12(1), 107-118.
Chiappe D, Brown A, Dow B, Koontz J, Rodriguez M & McCulloch K (2004) / Cheaters are looked at longer and remembered better than cooperators in social exchange situations. Evolutionary Psychology, 2, 108–120.
Corballis MC (1967) / Serial order in recognition and recall. Journal of Experimental Psychology, 74, 99-105.
Cronbach LJ (1946) / Response sets and test design. Educational and Psychological Measurement, 6, 475-94.
Dawes RM (1980) / Social Dilemmas. Annual Review of Psychology, 31, 169-193.

35
Dawes RM & Messick DM (2000) / Social Dilemmas. International Journal of Psychology, 35(2), 111-116.
DePaulo BM, Jordan A, Irvine A & Laser PS (1982) / Age changes in the detection of deception. Child Development, 53, 701-709.
DePaulo BM, Kirkendol SE, Tang J & O'Brien TP (1988) / The motivational impairment effect in the communication of deception: Replications and extensions. Journal of Nonverbal Behavior, 12, 177-202
DePaulo BM, Lindsay JL, Malone BE, Muhlenbruck L, Charlton K & Cooper H (2003) / Cues to deception. Psychological Bulletin, 129, 74-118, 438-445.
DePaulo BM & Morris WL (2004) / Discerning lies from truths: Behavioural cues to deception and the indirect pathway of intuition. In: Par-Anders Granhag & Leif (Eds.), The detection of deception in forensic contexts (pp. 15–40). New York: Cambridge University Press.
DePaulo BM, Rosenthal R, Green CR & Rosenkrantz J (1982) / Diagnosing deceptive and mixed messages from verbal and nonverbal cues. Journal of Experimental Social Psychology, 18, 433-446.
DePaulo BM, Stone JI & Lassiter GD (1985b) / Telling ingratiating lies: Effects of target sex and target attractiveness on verbal and nonverbal deceptive success. Journal of Personality & Social Psychology, 48, 1191-1203.
Dijksterhuis A (2004) / Think different: the merits of unconscious thought in preference development and decision making. Journal of Personality and Social Psychology, 87(5), 586-598.
Dijksterhuis A, Bos MW, van der Leij A & van Baaren RB (2009) / Predicting soccer matches after unconscious and conscious thought as a function of expertise. Psychological science, 20, 1381–1387.
Dunning D & Stern LB (1994) / Distinguishing Accurate From Inaccurate Eyewitness Identifications via Inquiries about Decision Processes. Journal of Personality and Social Psychology, 67(5), 818-835.
Ekman P (1989) / Why lies fail and what behaviors betray a lie. In: JC Yuille (Ed.), Credibility assessment (71–82). Dordrecht, the Netherlands: Kluwer.
Ekman P (1996) / Why Don't We Catch Liars? Social Research, 63(3), 801-818.
Ekman P (2001) / Telling lies: Clues to deceit in the marketplace, politics, and marriage (3rd ed.). New York: Norton.
Ekman P & Friesen WV (1969) / Nonverbal leakage and clues to deception. Psychiatry, 32, 88-106.
Ekman P, Friesen WV, O'Sullivan M & Scherer K (1980) / Relative Importance Of Face- Body- And Speech In Judgment of personality and affect. Journal of Personality and Social Psychology, 38, 270-277.
Ekman P & O’Sullivan M (1991) / Who can catch a liar. American Psychologist, 46, 913-120.
Ekman P, O'Sullivan M & Frank MG (1999) / A few can catch a liar. Psychological Science, 10(3), 263–266.
Elfenbein HA & Ambady N (2002) / On the Universality and Cultural Specificity of Emotion Recognition: A Meta-Analysis. Psychological Bulletin, 128(2), 203-235.
Eshel I & Cavalli-Sforza LL (1982) / Assortment of encounters and evolution of cooperativeness. PNAS, 79(4), 1331-1335.
36
Farrel J & Rabin M (1996) / Cheap Talk. The Journal of Economic Perspectives, 10(3), 103-118.
Fehr E & Fischbacher U (2005) / Altruists with Green Beards. Analyse & Kritik, 27, 73-84.
Fischbacher U, Gachter S & Fehr E (2001) / Are people conditionally cooperative? Evidence from a public goods experiment. Economics Letters, 71 (3), 397-404.
Forrest JA & Feldman RS (2000) / Detecting Deception and Judge's Involvement: Lower Task Involvement Leads to Better Lie Detection. Personality and Social Psychology Bulletin, 26(1), 118-125.
Frank M (2005) / Research methods in detecting deception research. In: J Harrigan, R Rosenthal & K Scherer (Eds.), The new handbook of methods in nonverbal behavior research (pp. 341–368). Oxford: Oxford University Press.
Frank MG & Ekman P (1997) / The Ability to Detect Deceit Generalizes Across Different Types of High-Stake Lies. Journal of Personality and Social Psychology, 72(6), 1429-1439.
Frank R, Gilovich T & Regan DT (1993) / The Revolution of One-Shot Cooperation. Ethology and Sociobiology, 14, 247-56.
Gilbert DT & Krull DS (1988) / Seeing Less and Knowing More: The Benefits of Perceptual Ignorance. Journal of Personality and Social Psychology, 54(2), 193-202.
Gilbert DT, Tafarodi RW & Malone PS (1993) / You can’t not believe everything you read. Journal of Personality and Social Psychology, 65(2), 221-233.
Güth W (1995) / An evolutionary approach to explaining cooperative behavior by reciprocal incentives. International Journal of Game Theory, 24, 323-344.
Hall JA, Blanch DC, Horgan TG, Murphy NA, Rosip JC & Schmid Mast M (2009) / Motivation and interpersonal sensitivity: Does it matter how hard you try? Motivation and Emotion, 33, 291–302.
Hartwig M, Granhag PA, Strömwall LA & Vrij A (2004) / Police officers' lie detection accuracy: Interrogating freely vs. observing video. Police Quarterly, 7, 429–456.
Hurd K & Noller P (1988) / Decoding Deception: A look at the process. Journal of Nonverbal Behavior, 12, 217–233.
Janssen MA (2008) / Evolution of cooperation in a one-shot Prisoner's Dilemma based on recognition of trustworthy and untrustworthy agents. Journal of Economic Behavior and Organization, 65, 458-471.
Kalay A, Kalay A & Kalay A (2003) / Friends or Foes? Empirical Test of a Simple One-Period Division Game Having a Unique Nash Equilibrium. mimeo.
Kalist D (2004) / Data from the Television Game Show Friend or Foe? Journal of Education Statistics, 12(3).
Kassin SM (2004) / True or false: "I'd know a false confession if I saw one." In: PA Granhag, & LA Strömwall (Eds.), The detection of deception in forensic contexts (172–194). Cambridge: Cambridge University Press.
Kassin SM, Meissner CA & Norwick RJ (2005) / "I'd Know a False Confession if I Saw One": A Comparative Study of College Students and Police Investigators. Law and Human Behavior, 29(2), 211-227.
Lassiter GD, Lindberg MJ, Gonzalez-Vallejo C, Bellezza FS & Phillips ND (2009) / The deliberation-without-attention effect: Evidence for an artifactual interpretation. Psychological Science, 20, 671–675.

37
List J (2006) / Friend or Foe? A Natural Experiment of the Prisoner’s Dilemma, NBER Working Paper 12097.
Mehu M, Grammer K & Dunbar RIM (2007) / Smiles when sharing. Evolution and Human Behavior, 28(6), 415-422.
Meissner CA & Kassin SM (2002) / "He's guilty!": Investigator bias in judgments of truth and deception. Law and Human Behavior, 26, 469-480.
National Research Council (2003) / The polygraph and lie detection. Committee to Review the Scientific Evidence on the Polygraph. Washington, DC: The National Academies Press.
Oberholzer-Gee F, Waldfogel J & White MW (2004) / Friend or Foe? Coordination, Cooperation, and Learning in High-Stakes Games, mimeo, Harvard Business School.
Oda R, Yamagata N, Yabiku Y & Matsumoto-Oda A (2009) / Altruism Can Be Assessed Correctly Based on Impression. Human Nature, 20(3), 331-341.
Oosterhof NN & Todorov A (2008) / The Functional Basis of Face Evaluation. Proceedings of the National Academy of Sciences of the USA, 105, 11087-11092.
Patterson ML (1995) / A Parallel Process Model of Nonverbal Communication. Journal of Nonverbal Behavior, 19(1), 3-29.
Porter S, Woodworth M & Birt AR (2000) / Truth, Lies, and Videotape: An Investigation of the Ability of Federal Parole Officers to Detect Deception. Law and Human Behavior, 24(6), 643-658.
Porter S, Woodworth M, McCabe S & Peace KA (2007) / "Genius is 1% and 99% perspiration"…or is it? An investigation of the impact of motivation and feedback on deception detection. Legal and Criminological Psychology, 12, 297-309.
Schug J, Matsumoto D, Horita Y, Yamagishi T & Bonnet K (2010) / Emotional expressivity as a signal of cooperation. Evolution and Human Behavior, 31(2), 87-94.
Spinoza B (1982) / The Ethics and selected letters (Feldman S, Ed., & Shirley S, Trans.). Indianapolis, IN: Hackett. (Original work published 1677)
Todorov A & Duchaine B (2008) / Reading trustworthiness in faces without recognizing faces. Cognitive Neuropsychology, 25, 395–410.
Todorov A (2008) / Evaluating faces on trustworthiness: An extension of systems for recognition of emotions signaling approach/avoidance behaviors. In: Kingstone A & Miller M (Eds.), The Year in Cognitive Neuroscience 2008, Annals of the New York Academy of Sciences, 1124, 208–224.
Todorov A, Pakrashi M & Oosterhof NN (2009) / Evaluating Faces on Trustworthiness After Minimal Time Exposure. Social Cognition, 27(6), 813–833.
Tracy JL & Robins RW (2008) / The Automaticity of Emotion Recognition. Emotion, 8(1), 81-95.
Vanneste S, Verplaetse J, van Hiel A & Braeckman J (2007) / Attention bias toward non-cooperative people. A dot probe classification study in cheating detection. Evolution and Human Behavior, 28, 272-276.
Verplaetse J, Vanneste S & Braeckman J (2007) / You can judge a book by its cover: the sequel. A kernel of truth in predictive cheating detection. Evolution and Human Behavior, 28, 260–271.
Vrij A & Mann S (2004) / Detecting deception: The benefit of looking at a combination of behavioral, auditory and speech content related cues in a systematic manner. Group Decision and Negotiation, 13, 61–79.

38
Vrij A (2008) / Detecting lies and deceit: Pitfalls and opportunities (2nd ed.). Chichester: John Wiley and Sons.
Vrij A, Akehurst L, Soukara S, Bull R (2004) / Detecting Deceit Via Analyses of Verbal and Nonverbal Behavior in Children and Adults. Human Communication Research, 30(1), 8-41.
Vrij A, Edward K & Bull R (2001b) / Police Officers’ Ability to Detect Deceit: The Benefit of Indirect Deception Measures. Legal and Criminological Psychology, 6, 185–196.
Vrij A, Mann S & Fisher RP (2006) / An Empirical Test of the Behaviour Analysis Interview. Law and Human Behavior, 30(3), 329-345.
Waroquier L, Marchiori D, Klein O & Cleeremans A (2010) / Is it better to think unconsciously or to trust your first impression? Social Psychological and Personality Science, in press.
Yamagishi T, Kikuchi M & Kosugi M (1999) Trust, Gullibility, and Social Intelligence. Asian Journal of Social Psychology, 2(1), 145-161.
Yamagishi T, Tanida S, Mashima R, Shimoma E & Kanazawa S (2003) / You Can Judge a Book by Its Cover: Evidence that Cheaters May Look Different from Cooperators. Evolution and Human Behavior, 24, 290-301.
Yamagishi T & Yamagishi M (1994) / Trust and commitment in the United States and Japan. Motivation and Emotion, 18(2), 129-166.