Status Report: caBIG Accomplishments · PDF file10/08/2009 · Status Report:...
70
1 National Cancer Advisory Board Meeting September 8, 2010 Ken Buetow, Ph.D. Director, Center for Bioinformatics and Information Technology Status Report: caBIG ® Accomplishments
Transcript of Status Report: caBIG Accomplishments · PDF file10/08/2009 · Status Report:...

1
National Cancer Advisory Board MeetingSeptember 8, 2010
Ken Buetow, Ph.D.Director, Center for Bioinformatics and Information Technology
Status Report: caBIG® Accomplishments

caBIG® at a glance
Community• 2,300+ participants from more than 700 institutions
• 56 NCI-designated Centers• 30 Community Centers
• 1000+ registrants for the 2010 caBIG® Annual Meeting• 19 licensed Support Service Providers to sustain the biomedical community as they
deploy caBIG® tools and technology (20% increase)• 15 countries using caBIG® tools and technology to facilitate Connectivity • 78 applications supporting full continuum of biomedical research (10% increase)• 149 “nodes” connected to National Grid via caGrid (25% increase)Content• 2.17 million biospecimens available through caGrid (82% increase)• 4.76 million images stored in the National Biomedical Imaging Archive (28% increase)• 39,952 microarray experiments available for research use on caGrid (60% increase)

Background

caBIG® Origins
• circa 2002: NCAB charges NCI with developing a strategy to assist the Cancer Community with the increasingly unmanageable informatics challenges associated with clinical research, biospecimen management, and molecular analysis
• Late 2003 through 2004: NCI visits NCI-designated Cancer Centers to assess needs, capabilities, requirements, and resources
• 2004: NCI launches caBIG® pilot program in NCI-designated Cancer Centers
• 2007: NCI expands/adopts caBIG® as enterprise framework

Partial List of NCI Programs Added since caBIG® Launch
• Mouse Models in Human Cancer (MMHCC)• Integrated Cancer Biology Program (ICBP)• Interagency Oncology Taskforce• Clinical Proteomic Technologies for Cancer Initiative• Nanotechology Alliance• Specialized Programs Of Research Excellence (SPOREs)• Strategic Partnering to Evaluate Cancer Signatures (SPECS)• Cancer Genetic Markers of Susceptibility (CGEMS)• Glioblastoma Multiform Diagnostic Initiative (REMBRANDT)• Clinical Trials Working Group• Translational Research Working Group• The Cancer Genome Atlas (TCGA)• Therapeutically Applicable Research to Generate Effective Treatments
(TARGET) Initiative• Office of Biorepositories and Biospecimen Research (caHuB)• NCI Community Cancer Centers Program• (others)

The Cancer Community Sought To*…
• Manage/leverage local and publicly-accessible biomedical data for research
• Connect/streamline workflows• Increase accuracy of processes• Standardize/Streamline data
collection • Perform complex analysis across
data sets• Identify best practices • Share data
* Based on 2004 Cancer Centers survey

Cancer Center Needs

Cancer Community Landscape (circa 2003)
• Integrated Systems− Homegrown/
Commercial− Smooth navigation
between applications
− Difficult to expand/extend
− Large IT staff− $10M’s invested
• Heterogeneous Systems− Complex mix of
commercial and homegrown components (may be composed of dozens of components)
− No common interfaces− Medium size IT staff− $1M’s invested
• Informal/No Systems− Use of
productivity applications (e.g. Excel, Access)
− Complex manual processes
− Small or no IT staff
− $100K’s invested

caBIG® Strategy at Launch• Community
• Establish an open community of participants from the spectrum of disciplines, geographies, types of institutions, etc.
• Facilitate the work of others who are building capabilities• Adopt a “federated” model to allow local control of sharing and
partnerships and to support individual labs and institutions• Content
• Facilitate access to rich primary data• Leverage existing academic and commercial software, wherever
possible, to avoid unnecessary time and expense• Invest primarily in open source tools that the community does not have
• Connectivity• Recognize legacy IT systems to avoid “rip and replace” costs• Wherever feasible, make disparate applications compatible for “plug-
and-play” compatibility and data-sharing through standards-based interoperable infrastructure

Community

caBIG® Operational Approach
Strategic Planning
Workspace (SP)
caBIG® Vocabularies and Common Data Elements Workspace (VCDE)
ClinicalTrials
ManagementSystems
Workspace(CTMS)
Domain-level Strategic-level
Cross-cutting
Integrative Cancer
Research Workspace
(ICR)
In VivoImaging
Workspace (IMAG)
Tissue Banks &
Pathology Tools
Workspace (TBPT)
Training Workspace
(D&T)
Data Sharing & Intellectual
Capital Workspace
(DSIC)
caBIG® Architecture Workspace (ARCH)

caBIG® and the Cancer Research Community
0
10
20
30
40
50
60
70
CTMS ICR IMAG TBPT ARCH VCDE DSIC D&T
Workspace
Parti
cipa
nts
per c
all
20042009
Representative Attendance caBIG® Workspace Weekly Teleconferences 2004-2009

25.2%17.2%
12.9%
3.3%
2.4%9.5%
29.3%
caBIG® Annual Meeting Attendance
1050 people attended the 2009 caBIG® Annual Meeting, representing 425 organizations. 63% of those attendees, and 60% of their organizations were new in 2009 vs. 2008.
1050
169
Year
Atte
ndee
s
2004 2009
Academic/Cancer Center
All OthersPatient Advocate
Commercial IT
Program Contractors
ConsultingGovernment-NCI/NIH/Other

Supporting the Community
• Knowledge Centers (KC)• Domain expertise, technical and end-user documentation• Comprehensive, up-to-date installation packages for caBIG® tools• Administration of open source development of caBIG® tools• Collection and monitoring of defect reports, feature requests, and
end-user requirements• Training materials for caBIG®
• 6 Domain-focused Knowledge Centers: caGrid, Vocabulary, Clinical Trials Management Systems, Molecular Analysis Tools, Tissue Banks, Data Sharing and Intellectual Capital
• Support Service Providers (SSP)• Software application and technical support to end-users and IT
professionals• 19 licensed SSPs to-date, quarterly solicitations

caBIG® Support Service Providers
• 5AM Solutions, Inc.• Akaza Research• Asclepius Solutions• CTIS, Inc.• E-SAC, Inc.• Ekagra Software
Technologies• HealthCare IT, Inc. (HCIT)• IMS, Inc.• INFOTECH Soft, Inc.• LabAnswer• Moxie Informatics• Persistent Systems• Recombinant Data• SAIC• ScenPro, Inc.• SemanticBits• SRA Corporation• TerpSys• University of Utah

Connectivity and Content

ResearchUnit
Supporting Individual and Institutional Needs
Clinical Trials
Molecular Analysis
Biospecimens
Analytical Tools

ResearchUnit
Supporting Individual and Institutional Needs
Clinical Trials
Molecular Analysis
Biospecimens
Analytical Tools

ResearchUnit
Supporting Individual and Institutional Needs
Clinical Trials
Molecular Analysis
Biospecimens
Analytical Tools

ResearchUnit
Supporting Individual and Institutional Needs
Clinical Trials
Molecular Analysis
Biospecimens
Analytical Tools
Clinical Trials
Molecular Analysis
Biospecimens
Analytical Tools
Vocabularies &Ontologies
InformationModels
Common Data Elements

Clinical Trials Management Systems WorkspacePatterns of Usage:• Complete end-to-end clinical trials management capability• Specific capability to fill a gap in existing capabilities• Linkage tools (caGrid, data standards) to connect existing in-house
or commercial applications• Specifications to build or modify in-house developed applications
for interoperabilitycaBIG® Capabilities:• Collect clinical trials data - C3D (Oracle Clinical) • Enroll, register, and track clinical trial participants across multiple sites - C3PR• Create and manage clinical trial participant schedules and activities - PSC• Create new protocols and track throughout the lifecycle of a study - PLT• Store, browse,clinical laboratory data; share with other systems - Lab Viewer• Collect and report adverse events - caAERS• Connect systems and support clinical trials workflow integration; provide
interoperability associated with SOA - Integration Hub • Interoperate / Share data with 3rd party CDMS systems - Clinical Connector• Exchange of clinical trials data across multiple systems - CTODS• Help investigators comply with Federal registration requirements - FIREBIRD• Recruit patients for clinical trials - caMATCH• Provide common data elements and case report forms for standardization and
reusability - CRF Project
Presenter
Presentation Notes
Show trajectory of growth, (strategy) usage patterns, how using specific components Success = 1 component Using services or specs are sufficient = use Mamaprint paper Check clinical trials.gov – John? UAMS – what clinical trials are they running? Check with Hutchins or Umit

Production Preproduction Pilot Installation Total
31 3 3 16 53
Clinical Trials Management Systems Statistics
Institutions using caBIG® Clinical Trials Applications - by Stage:
Additional CTMS Tools used by Cancer Centers and other Organizations
Tool TotalBusiness Analysis Model (BAM) 8
Access defined semantics for protocol-driven research -Biomedical Research Integrated Domain Group model (BRIDG)
9*
Report clinical trials results to the NCI – Clinical Trials Reporting Program (CTRP)
37
*Users include HL7 & CDISC, therefore reaching a large group

caBIG® Electronic Data Capture (EDC)
EDC Usage Statistics:• 194 sites are using C3D
• 23 primary sites• 171 satellite sites
• 1000+ active C3D users across those sites• 1+ million Case Report Forms (CRFs) have been entered
• Over 600,000+ were populated automatically from other clinical systems
• 150+ million individual data points have been collected• All CRFs are attached to CDEs in caDSR
• 342 trials use C3D• 59 scientific publications have resulted from these trials to date

C3D Usage
Presenter
Presentation Notes
C3D usage – Mary Jackson (U of CO – SPORES)

Sample Use: University of Arkansas:Managing Institutional Clinical Research
caXchange(Hub)
(CTODS)
Clinical Trial Object Database
System
Cancer Central ClinicalParticipant Registry (C3PR)
Eligibility is verifiedand patient is registered to a study
Patient Study Calendar (PSC)
Tracks the patient schedule throughout the study
Lab Viewer
Identifies labs, loadsthem into the CDMSand AE system
Cancer Adverse EventReporting System (caAERS)
Identifies and tracks adverseevents and any associatedschedule changes
Clinical data is captured
Vendor Clinical DataManagement System
caBIG®
vendor

Sample Use: AlphaVax Trial at Duke
• Morse MA, Hobeika AC, Osada T, et. al. An alphavirus vector overcomes the presence of neutralizing antibodies and elevated numbers of Tregs to induce immune responses in humans with advanced cancer. J Clin Invest. 2010
• “We report here that an alphavirus vector, packaged in virus-like replicon particles (VRP) and capable of efficiently infecting DCs, could be repeatedly administered to patients with metastatic cancer expressing the tumor antigen carcinoembryonic antigen (CEA) and that it overcame high titers of neutralizing antibodies and elevated Treg levels to induce clinically relevant CEA-specific T cell and antibody responses.”
• caBIG® Capability: • caIntegration Hub (caXchange): Collect and transmit clinical data
between the participating trial sites• C3D: Collect participant clinical data

Integrative Cancer Research Workspace
Patterns of Usage:• Individual applications to address specific analysis
needs• Access to NCI-hosted instances of applications
online to manage data• “Software-as-a-service” from 3rd party hosting
partners• Multiple applications independent to provide
comprehensive analytical capabilities • Linked applications to create custom analysis
pipelines• “Mix-and-match” analysis capabilities from the
growing NCI Enterprise Services portfolio• Functional specifications to develop or modify, or
connect in-house applications

Integrative Cancer Research Workspace
caBIG® Capabilities:• Perform genomic data with powerful workflows - GenePattern• Perform integrated research across genomic data – geWorkbench• Conduct high throughput genome analysis - Bioconductor• Manage and annotate microarray gene expression data - caArray• Develop custom, caBIG-compatible web portals to conduct integrative
research - caIntegrator• Integrated Cancer Genomics Viewer: Cancer Genome Workbench
(CGWB)• Query caGrid for analytical and data services - caBench-to-Bedside
(caB2B )• Electronically manage laboratory data - caELMIR• Obtain biomedical annotations from curated data sources - Cancer
Bioinformatics Infrastructure Objects (caBIO)• Analyze proteomics data - LabKey/CPAS• Query a database of genomic and proteomic annotations - Protein
Information Resource (gridPIR)• Manage proteomics laboratory information - Proteomics LIMS• Capture proteomics experimental annotations - protExpress• Classify complex fragment mixtures in mass spectroscopy - Q5• Analyze microarray data in the context of pathways - Quantitative
Pathway Analysis in Cancer (QPACA)• Search a database of core pathways in human cancer - Reactome• Analyze mass spectrometry proteomics data - RProteomics• Make and share genomic annotations - SEED

Integrative Cancer Research Workspace
caBIG® Capabilities (continued):• Analyze significant associations between genetic variations and
disease - Cancer Genome-Wide Association Scan (caGWAS)• Search a database of animal models for human cancer - Cancer
Models Database (caMOD)• Automatically annotate cancer related proteins - Cancer Molecular
Pages• Facilitate data sharing of nanoparticle information in cancer research
- cancer Nanotechnology Laboratory (caNanoLab)• Query across caBIG data services for clinical data - caTRIP• Improve the quality of collected microarray data - chip artifact
Correction (caCorrect)• Perform statistical corrections to reduce systematic biases in
microarray data - Distance Weighted Discrimination (DWD)• Analyze of microarray data using gene annotation data - Function
Express (caFE)• Map gene connections between different approved genomic
identifiers- GeneConnect• Leverage the Gene Ontology (GO) to identify the biological processes
- GOMiner™• Identify differentially expressed biomarkers - omniBiomarker• open source pathway database - Pathways Tools• Screen and analyze RNA transcripts - TrAPSS• Perform cluster modeling, visualization, and discovery - VIsual
Statistical Data Analyzer (VISDA)

Different Capabilities Supporting Molecular Analysis
• GenePattern• Web-based genomic analysis platform provides more than 125 tools for
gene expression analysis, proteomics, SNP analysis and common data processing tasks, including the creation of multi-step analysis pipelines (estimated13,000+ users at over 2,200 institutions)
• geWorkbench• Open-source software platform for genomic data integration, with more
than 40 analysis and visualization tools for gene expression, sequences, protein structures, pathways, and other biomedical data. (estimated between 400-500 users)
• Bioconductor• Open-source, open-development platform for the analysis and
comprehension of high-throughput genomic data. Bioconductor uses the R statistical programming language, with more than 380 analytical modules available

Sample Use: Molecular Dissection of Colon Cancer
• Sheffer M, Bacolod MD, et. al. Association of survival and disease progression with chromosomal instability: a genomic exploration of colorectal cancer Proc Natl Acad Sci U S A. 2009;106(17):7131-6.
• “To identify and characterize chromosomal abnormalities in colorectal cancer, we performed a statistical analysis of 299 expression and 130 SNP arrays profiled at different stages of the disease, including normal tissue, adenoma, stages 1-4 adenocarcinoma, and metastasis.”
• caBIG® Capability:• caArray: Share the large dataset with the community, associated with
detailed sample annotations • caIntegrator: Provide community the capability to further analyze this
unique data set• caDSR: Provide registration of clinical data elements

Tissue Banks & Pathology Tools Workspace
Patterns of Usage:• One central biorepository to manage multiple
biospecimen collections• Separate local instances of biorepository for each
collection• Biorepository to securely share samples among
multiple collaborating organizations• caBIG® biorepository as a back end to existing
commercial or legacy biospecimen management systems in-house
caBIG® Capabilities:• Collect, store, annotate, aliquot, search, and track
distribution of many types of biospecimens --caTissue Suite

Sample Use: Washington University at St. Louis
• Washington University at St Louis manages more than 558,000 biospecimens in multiple core facilities across the university. Facilities managers see benefits in locating specimens, collecting detailed annotations, and managing multiple levels of consent tied to specific specimens.• “caTissue allows us to collect much more detailed information
about each sample, making it easier and more accurate to find exactly the samples requested by a researcher.” Lisa Taylor-Reinwald, Neuropathology Core Lab Manager, Washington University in St Louis
• “caTissue is much faster and more simpler to use than our home-grown system. We can locate and provide the samples to researchers with much more confidence that we had in the past.”Gary Skolnik, Study Coordinator for Nutritional and Obesity Research, Washington University in St Louis

In Vivo Imaging Workspace
Patterns of Usage:• Local management of digital images• NCI-hosted instance storing for private or public use• Novel imaging applications using XIP framework• Structured annotation of images with AIM• Virtual PACS to connect commercial PACS systems with other
image databases to share collections of imagescaBIG® Capabilities:• Store, annotate and share DICOM format medical images --
National Biomedical Image Archive (NBIA)• Capture radiologist’s notes and share with colleagues using
standards-based annotations -- Annotation and Image Markup (AIM)
• Capture digital images of pathology slides -- caMicroscope• Develop and rapidly test novel image analysis algorithms --
eXtensable Imaging Platform – XIP• Connect commercial PACS systems with other 3rd party image
databases -- Imaging Middleware/Virtual PACS

Sample Use: Ohio State University
• Connecting diverse sets of clinical and research data across the university and between OSU and external collaborators
• caBIG® Capability:• caGrid – Grid technology is being applied to solve multiple data access
problems including:• Creating the Translational Informatics and Data Management Grid (TRIAD) to
allow researchers inside OSU to access basic and clinical research data across the university
• Creating a federated National Clinical Trials metadata repository for all Clinical and Translational Science Aware (CTSA)-funded centers
• Creating a federated data warehouse to connect OSU Hospital with Nationwide Children’s Hospital in Columbus Ohio as part of the Ohio Perinatal Research Network
Presenter
Presentation Notes
“We really want to find a way to link this very robust middleware developed by the NCI with a lot of interesting clinical and translational research use cases, at the community level, at the national level, and locally within our institution.” Philip Payne, Ph.D., director of the Biomedical Informatics Program at the OSU Center for Clinical and Translational Science (CCTS)

Department of Biomedical Informatics
TRITON
Clinical Trials Management
Bio-specimenManagement
Basic ScienceData Capture
Slide courtesy of Philip R.O. Payne, PhD, Director -Biomedical Informatics Program, The Ohio State University, Center for Clinical and Translational Science
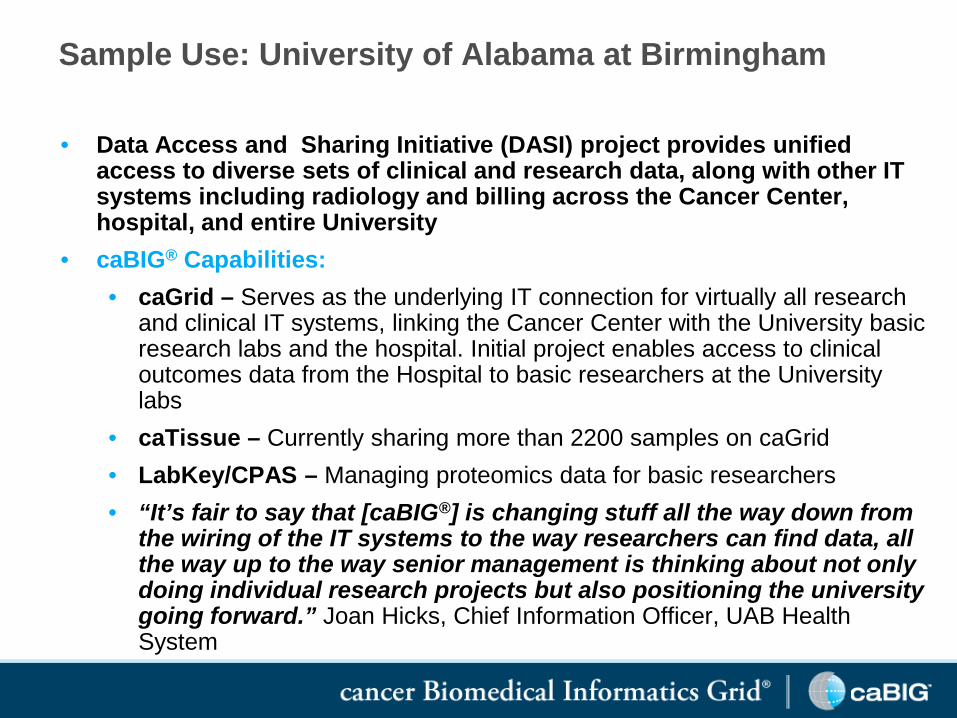
Sample Use: University of Alabama at Birmingham
• Data Access and Sharing Initiative (DASI) project provides unified access to diverse sets of clinical and research data, along with other IT systems including radiology and billing across the Cancer Center, hospital, and entire University
• caBIG® Capabilities:• caGrid – Serves as the underlying IT connection for virtually all research
and clinical IT systems, linking the Cancer Center with the University basic research labs and the hospital. Initial project enables access to clinical outcomes data from the Hospital to basic researchers at the University labs
• caTissue – Currently sharing more than 2200 samples on caGrid• LabKey/CPAS – Managing proteomics data for basic researchers • “It’s fair to say that [caBIG®] is changing stuff all the way down from
the wiring of the IT systems to the way researchers can find data, all the way up to the way senior management is thinking about not only doing individual research projects but also positioning the university going forward.” Joan Hicks, Chief Information Officer, UAB Health System

Sample Use: Washington University at St Louis
• Providing access to current and legacy in- and out-patient clinical data from more than 5 million patients seen at 13 hospitals and clinics across BJC Healthcare and linking multiple diverse in-house collections of biospecimens
• caBIG® Capabilities:• LexEVS –80,000 terms harmonized to make clinical data interoperable in
Clinical Investigation Data Exploration Repository (CIDER)
• caTissue – 558,000 biospecimens across multiple core facilities managed by a central installation of caTissue
• caGrid –CIDER database connected to caTissue and caArray
• caArray –Data from almost 200 samples made available on caGrid
• caB2B – Web-based queries to locate data in any connected repository

ResearchUnit
Clinical Trials
Microarray Data
Biospecimens
Analytical Tools
ResearchCenter
Security Advertisement/ Discovery
FederatedQueryWorkflow
MetadataManagement
Dorian GTS IndexService
FederatedQuery
Service
WorkflowManagement
Service
Vocabularies &Ontologies
GME Schema Management
Common Data Elements
MedicalCenter
ResearchCenter
ResearchCenter
Medical Center
MedicalCenter
MedicalUnit
ResearchCenter
ResearchCenter
Security Advertisement/ Discovery
FederatedQueryWorkflow
MetadataManagement
Dorian GTS IndexService
FederatedQuery
Service
WorkflowManagement
Service
Vocabularies &Ontologies
GME Schema Management
Common Data Elements
ResearchUnit
ResearchCenter
MedicalCenter
ResearchCenter
ResearchCenter
MedicalCenter
MedicalCenter
Medical Unit
ResearchCenter
ResearchCenter
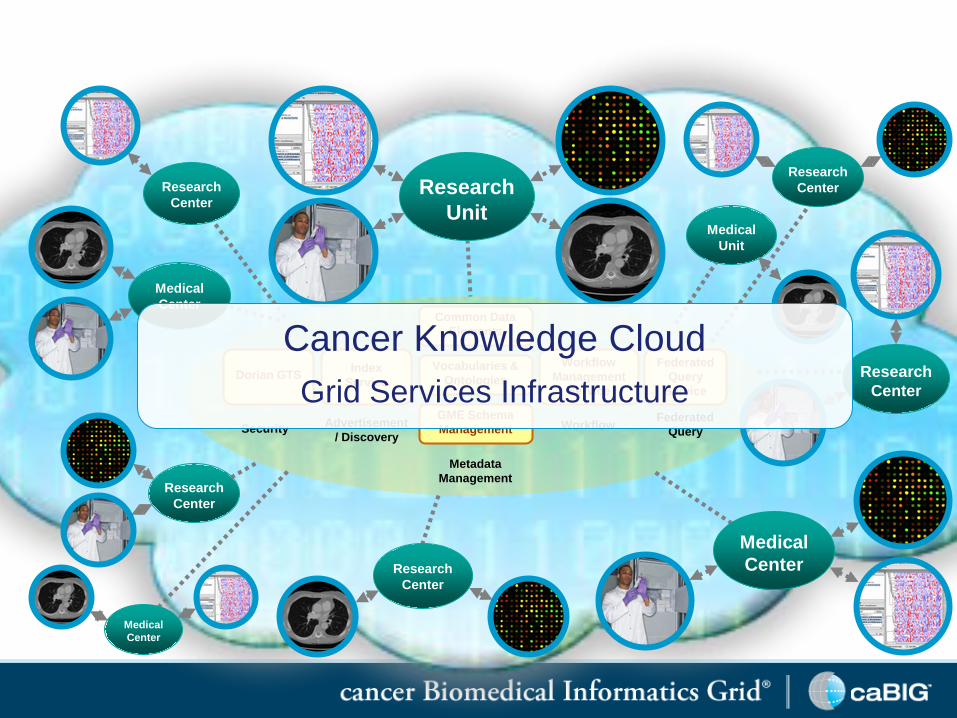
Cancer Knowledge CloudGrid Services Infrastructure

Security Advertisement/ Discovery
FederatedQueryWorkflow
MetadataManagement
Dorian GTS IndexService
FederatedQuery
Service
WorkflowManagement
Service
Vocabularies &Ontologies
GME Schema Management
Common Data Elements
ResearchUnit
ResearchCenter
MedicalCenter
ResearchCenter
ResearchCenter
MedicalCenter
MedicalCenter
MedicalUnit
ResearchCenter
ResearchCenter
Cancer Knowledge CloudGrid Services Infrastructure
Cancer Knowledge CloudGrid Services Infrastructure

6/21/2006
The Glioma Molecular Diagnostic Initiative
Objectives:Produce a biologically significant pathological classification of gliomas, with strong correlation to outcome of disease, that would allow for better prognostication and more informed therapeutic decision making.
Through the informatic mining of extensive molecular/genetic data to be able to find new molecular targets for therapy that would be relevant both to the disease type and patient status.
Produce a publicly accessible database containing all the aforementioned data, that will contain the analysis tools necessary for all ends of the research spectrum (clinicians, chemists, geneticist, bioinformaticians, etc) to profit from the wealth of information stored, produce new models of disease, and envision new targeted therapies.
A national study through 2 NCI-funded brain tumor consortia More than 1000 patients with gliomas to be accruedExtensive prospective clinical data to be correlated with molecular data
Slide courtesy of Dr. Howard Fine, NeuroOncology Branch, CCR

6/21/2006
Data Integration via Rembrandt
Slide courtesy of Dr. Howard Fine, NeuroOncology Branch, CCR

Sample use: Access to REMBRANDT Data
• caBIG® provides a bioinformatics framework and web portal for researchers to integrate clinical and functional genomics data from the REMBRANDT project (http://caintegrator-info.nci.nih.gov/rembrandt).
0
200
400
600
800
1000
1200
1400
Mar-05
Jul-0
5
Nov-05
Mar-06
Jul-0
6
Nov-06
Mar-07
Jul-0
7
Nov-07
Mar-08
Jul-0
8
Nov-08
Mar-09
Jul-0
9
Nov-09
Mar-10
Jul-1
0
Cum
ulat
ive
Regi
stra
tions
Rembrandt Registrations
Presenter
Presentation Notes
Beckner ME, Fellows-Mayle W, Zhang Z, Agostino NR, Kant JA, Day BW, Pollack IF. Identification of ATP citrate lyase as a positive regulator of glycolytic function in glioblastomas. Int J Cancer. 2010 May 15;126(10):2282-95 Madhavan S, Zenklusen JC, Kotliarov Y, Sahni H, Fine HA, Buetow K. Rembrandt: helping personalized medicine become a reality through integrative translational research. Mol Cancer Res. 2009 Feb;7(2):157-67. Epub 2009 Feb 10 Karopka T, Scheel T, Bansemer S, Glass A. Automatic construction of gene relation networks using text mining and gene expression data. Med Inform Internet Med. 2004 Jun;29(2):169-83.

Sample Use: : PANVAC Trial at Duke
• PANVAC - VF Vaccine for the Treatment of Metastatic Pancreatic Cancer• By injecting immunity-producing drugs directly into the tumor, the body
develops an increased ability to recognize the tumor, and subsequent metastases, as foreign and attack them directly.
• This study is designed to study the safety and efficacy of PANVAC-VF in combination with Granulocyte-macrophage colony-stimulating factor (GM-CSF) versus best supportive care or palliative chemotherapy
• caBIG® Capability:• caIntegration Hub (caXchange): enables the collection and
transmission of clinical data between the participating trial sites

Duke Multi-Center Vaccine Study
• PANVAC Trial– Grid-enabled– Secure– Accessible
Dorian
GTS
CDS
webSSO
caXchange Key
IdP
Study ServiceRegistration
Service
additional Cancer Center
Slide courtesy of Robert P. Annechiarico, Director of Cancer Center Information Systems, Duke Comprehensive Cancer Center

Sample Use: Director’s Challenge Lung Study
• Director's Challenge Consortium for the Molecular Classification of Lung Adenocarcinoma. Shedden K, Taylor JM, Enkemann SA, et al. Gene expression-based survival prediction in lung adenocarcinoma: a multi-site, blinded validation study. Nat Med. 2008 Aug;14(8):822-7. Epub 2008 Jul 20.
• “Here we report a large, training-testing, multi-site, blinded validation study to characterize the performance of several prognostic models based on gene expression for 442 lung adenocarcinomas. The hypotheses proposed examined whether microarray measurements of gene expression either alone or combined with basic clinical covariates (stage, age, sex) could be used to predict overall survival in lung cancer subjects…This study also provides the largest available set of microarray data with extensive pathological and clinical annotation for lung adenocarcinomas. ”
• caBIG® Capability: • caArray: Share the large dataset with the community, associated with
detailed sample annotations • caIntegrator: Provide the community the capability to further analyze
this unique data set• caDSR: Provide registration of clinical data elements

Sample Use: Reuse of Cancer Genetic Markers of Susceptibility (CGEMS) Data
Through caIntegrator, caBIG® enables researchers to access data from the CGEMS project. More than 25 publications have arisen from mining CGEMS data.
• Saetrom P, Biesinger J, Li SM, et. al. A risk variant in an miR-125b binding site in BMPR1B is associated with breast cancer pathogenesis. Cancer Res. 2009 Sep 15;69(18):7459-65.
0
20
40
60
80
100
120
140
160
180
200
Oct-06
Jan-0
7Apr-
07Ju
l-07
Oct-07
Jan-0
8Apr-
08Ju
l-08
Oct-08
Jan-0
9Apr-
09Ju
l-09
Oct-09
Jan-1
0Apr-
10Ju
l-10
Cum
ulati
ve R
egist
ratio
ns
Cumulative CGEMS Registrations
Presenter
Presentation Notes
Enciso-Mora V, Hosking FJ, Houlston RS.Risk of breast and prostate cancer is not associated with increased homozygosity in outbred populations. Eur J Hum Genet. 2010 Aug;18(8):909-14. Epub 2010 Apr 21 Xu J, Zheng SL, Isaacs SD, et. al .Inherited genetic variant predisposes to aggressive but not indolent prostate cancer. Proc Natl Acad Sci U S A. 2010 Feb 2;107(5):2136-40. Epub 2010 Jan 11. Yeager M, Chatterjee N, Ciampa J, et.al. Identification of a new prostate cancer susceptibility locus on chromosome 8q24. Nat Genet. 2009 Oct;41(10):1055-7. Epub 2009 Sep 20

Sample Use: Managing Medical Images• caBIG® Usage: National Biomedical Image Archive (NBIA)
• 4.76+ million images publicly available through NCI instance of NBIA• RIDER/LIDC/IDRI – 1,766,820• CT Colonography – 941,774 • Virtual Colonoscopy – 686,257 • Rembrandt VASARI – 593,260 • FDA Phantoms – 420,938 • TCGA – 113,953 • RTOG 0522 Trial – 206,665• PET Lymphoma Study – 28,462
• Head and Neck radiation collaboration with NCI Radiation Research and American College of Radiology
• Organizations may choose to install their own instance of NBIA and store their research images locally
• Washington University at St Louis – 12 million images• Fox Chase Cancer Center – 10,000 images• Pediatric Brain Tumor Consortium – 5,500• NCRI – 985• University of Colorado • NIAMS OsteoArthritis Initiative – 14.4+ million images
Sample Use: RIDER and LIDC
• van Ginneken B, Armato SG 3rd, de Hoop B, et. al. Comparing and combining algorithms for computer-aided detection of pulmonary nodules in computed tomography scans: The ANODE09 study. Med Image Anal. 2010 Dec;14(6):707-22. Epub 2010 Jun 4.
• “Results show a substantial performance difference between algorithms, and demonstrate that combining the output of algorithms leads to marked performance improvements.”
• 22 additional secondary publications based on Reference Image Database to Evaluate Therapy Response (RIDER) and Lung Image Database Consortium (LIDC) data
• National Biomedical Image Archive (NBIA) serves as database to make available a high-quality annotated set of chest images to researchers, for algorithm validation and training
• “NBIA was absolutely essential to provide access to large set of highly curatedimages to researchers in diverse locations. These reference images leads to creation of more accurate tools, which can measure changes in tumors more accurately, and at an earlier stage of treatment, allowing us to get patients off treatment faster or change the treatment sooner if it’s not effective.”Charles Meyer, Ph.D., Lab Director, Digital Image Processing Laboratory, Department of Radiology, University of Michigan
Presenter
Presentation Notes
LIDC Secondary Papers: van Ginneken B, Armato SG 3rd, de Hoop B, van Amelsvoort-van de Vorst S, Duindam T, Niemeijer M, Murphy K, Schilham A, Retico A, Fantacci ME, Camarlinghi N, Bagagli F, Gori I, Hara T, Fujita H, Gargano G, Bellotti R, Tangaro S, Bolaños L, De Carlo F, Cerello P, Cristian Cheran S, Lopez Torres E, Prokop M. Comparing and combining algorithms for computer-aided detection of pulmonary nodules in computed tomography scans: The ANODE09 study. Med Image Anal. 2010 Dec;14(6):707-22. Epub 2010 Jun 4. PubMed PMID: 20573538. Sensakovic WF, Starkey A, Roberts R, Straus C, Caligiuri P, Kocherginsky M,Armato SG 3rd. The influence of initial outlines on manual segmentation. Med Phys. 2010 May;37(5):2153-8. PubMed PMID: 20527549; PubMed Central PMCID:PMC2874038. Armato SG 3rd, Sensakovic WF, Passen SJ, Engelmann R, MacMahon H. Temporal subtraction in chest radiography: mutual information as a measure of image quality. Med Phys. 2009 Dec;36(12):5675-82. PubMed PMID: 20095280. Kinahan PE, Doot RK, Wanner-Roybal M, Bidaut LM, Armato SG, Meyer CR, McLennan. G. PET/CT Assessment of Response to Therapy: Tumor Change Measurement, Truth Data, and Error. Transl Oncol. 2009 Dec;2(4):223-30. PubMed PMID: 19956382; McNitt-Gray MF, Bidaut LM, Armato SG, Meyer CR, Gavrielides MA, Fenimore C, McLennan G, Petrick N, Zhao B, Reeves AP, Beichel R, Kim HJ, Kinnard L. Computed tomography assessment of response to therapy: tumor volume change measurement, truth data, and error. Transl Oncol. 2009 Dec;2(4):216-22. PubMed PMID: 19956381; Meyer CR, Armato SG, Fenimore CP, McLennan G, Bidaut LM, Barboriak DP, Gavrielides MA, Jackson EF, McNitt-Gray MF, Kinahan PE, Petrick N, Zhao B. Quantitative imaging to assess tumor response to therapy: common themes of measurement, truth data, and error sources. Transl Oncol. 2009 Dec;2(4):198-210. PubMed PMID: 19956379 Faoro L, Hutto JY, Salgia R, El-Zayaty SA, Ferguson MK, Cheney RT, Reid ME, Armato SG 3rd, Krausz T, Husain AN. Lymphatic vessel density is not associated with lymph node metastasis in non-small cell lung carcinoma. Arch Pathol Lab Med. 2008 Dec;132(12):1882-8. PubMed PMID: 19061284. Sensakovic WF, Starkey A, Roberts RY, Armato SG 3rd. Discrete-space versus continuous-space lesion boundary and area definitions. Med Phys. 2008 Sep;35(9):4070-8. PubMed PMID: 18841859 Suzuki K, Yoshida H, Näppi J, Armato SG 3rd, Dachman AH. Mixture of expert 3D massive-training ANNs for reduction of multiple types of false positives in CAD for detection of polyps in CT colonography. Med Phys. 2008 Feb;35(2):694-703. Choudhury KR, Paik DS, Yi CA, Napel S, Roos J, Rubin GD. Assessing operating characteristics of CAD algorithms in the absence of a gold standard. Med Phys. 2010 Apr;37(4):1788-95. Ozekes S, Osman O. Computerized lung nodule detection using 3D feature extraction and learning based algorithms. J Med Syst. 2010 Apr;34(2):185-94 Opulencia P, Channin DS, Raicu DS, Furst JD. Mapping LIDC, RadLex, and Lung Nodule Image Features. J Digit Imaging. 2010 Mar 23. [Epub ahead of print] Messay T, Hardie RC, Rogers SK. A new computationally efficient CAD system for pulmonary nodule detection in CT imagery. Med Image Anal. 2010 Jun;14(3):390-406. Epub 2010 Feb 19 Diciotti S, Lombardo S, Coppini G, Grassi L, Falchini M, Mascalchi M. The LoG characteristic scale: a consistent measurement of lung nodule size in CT imaging. IEEE Trans Med Imaging. 2010 Feb;29(2):397-409. De Nunzio G, Tommasi E, Agrusti A, Cataldo R, De Mitri I, Favetta M, Maglio S, Massafra A, Quarta M, Torsello M, Zecca I, Bellotti R, Tangaro S, Calvini P, Camarlinghi N, Falaschi F, Cerello P, Oliva P. Automatic Lung Segmentation in CT Images with Accurate Handling of the Hilar Region. J Digit Imaging. 2009 Oct 14. [Epub ahead of print] Golosio B, Masala GL, Piccioli A, Oliva P, Carpinelli M, Cataldo R, Cerello P, De Carlo F, Falaschi F, Fantacci ME, Gargano G, Kasae P, Torsello M. A novel multithreshold method for nodule detection in lung CT. Med Phys. 2009 Aug;36(8):3607-18. Diciotti S, Picozzi G, Falchini M, Mascalchi M, Villari N, Valli G. 3-D segmentation algorithm of small lung nodules in spiral CT images. IEEE Trans Inf Technol Biomed. 2008 Jan;12(1):7-19. Ozekes S, Osman O, Ucan ON. Nodule detection in a lung region that's segmented with using genetic cellular neural networks and 3D template matching with fuzzy rule based thresholding. Korean J Radiol. 2008 Jan-Feb;9(1):1-9. Wang J, Engelmann R, Li Q. Segmentation of pulmonary nodules in three-dimensional CT images by use of a spiral-scanning technique. Med Phys. 2007 Dec;34(12):4678-89 Korfiatis P, Skiadopoulos S, Sakellaropoulos P, Kalogeropoulou C, Costaridou L. Combining 2D wavelet edge highlighting and 3D thresholding for lung segmentation in thin-slice CT. Br J Radiol. 2007 Dec;80(960):996-1004. Lam MO, Disney T, Raicu DS, Furst J, Channin DS. BRISC-an open source pulmonary nodule image retrieval framework. J Digit Imaging. 2007 Nov;20 Suppl 1:63-71. Epub 2007 Aug 14. Ochs RA, Goldin JG, Abtin F, Kim HJ, Brown K, Batra P, Roback D, McNitt-Gray MF, Brown MS. Automated classification of lung bronchovascular anatomy in CT using AdaBoost. . Med Image Anal. 2007 Jun;11(3):315-24. Epub 2007 Mar 30. Way TW, Hadjiiski LM, Sahiner B, Chan HP, Cascade PN, Kazerooni EA, Bogot N, Zhou C. Computer-aided diagnosis of pulmonary nodules on CT scans: segmentation and classification using 3D active contours. Med Phys. 2006 Jul;33(7):2323-37. Quotes: “The RIDER study has be very valuable in training radiologists with a widely available set of reference images through NBIA.” Michael McNitt-Gray, Ph.D., Associate Professor of Radiology, UCLA.

Sample Use: Biospecimens
• Usage: 2.17+ million biospecimens available through caTissue, at least 1.46 million biospecimens are available for sharing via caGrid
• 34 organizations in production usage, including:
Cooperative Banking Committee for the Melanoma GridDing L, Ellis MJ, Li S, Larson DE, (Watson M) et. al. Genome remodelling in a basal-like
breast cancer metastasis and xenograft. Nature. 2010 Apr 15;464(7291):999-1005.
Washington University St. Louis 558494 Loma Linda University 8204Fox Chase Cancer Center 288803 Ohio State University Medical Center 7273University of California San Francisco 281338 Christiana Care 5013Thomas Jefferson University - Kimmel Cancer Center 236458 University of Arkansas 4472University of Michigan 215653 University of Alabama Birmingham 2200Indiana University - Regenstrief 189105 Vanderbilt-Ingram Cancer Center 1813Dana Farber Cancer Center 128798 Georgetown University - Lombardi Cancer Center 1405Johns Hopkins University 67644 University of Arizona 1000University of Pittsburgh 50444 Baylor - Duncan Cancer Center 469Emory University 39973 M.D. Anderson Cancer Center 164Louisiana Cancer Consortium 29276 University of Iowa - Holden Cancer Center 150University of Pennsylvania 14616Edinburgh Experimental Cancer Medicine Center 14000University of Nebraska - Eppley Cancer Center 10198Yale 8570
Green = samples on the grid
Presenter
Presentation Notes
Mark Watson publications Ding L, Ellis MJ, Li S, Larson DE, (Watson M) et. al. Genome remodelling in a basal-like breast cancer metastasis and xenograft. Nature. 2010 Apr 15;464(7291):999-1005. Aft R, Naughton M, Trinkaus K, Watson M, et. al. Effect of zoledronic acid on disseminated tumour cells in women with locally advanced breast cancer: an open label, randomised, phase 2 trial. Lancet Oncol. 2010 May;11(5):421-8. Epub 2010 Mar 31. Warren WC, Clayton DF, Ellegren H, (Watson M), et. al. The genome of a songbird. Nature. 2010 Apr 1;464(7289):757-62. Lin Y, Lin S, Watson M, et. al. A gene expression signature that predicts the therapeutic response of the basal-like breast cancer to neoadjuvant chemotherapy. Breast Cancer Res Treat. 2009 Dec 6. [Epub ahead of print] Ellis MJ, Lin L, Crowder R, (Watson M), et. al. Phosphatidyl-inositol-3-kinase alpha catalytic subunit mutation and response to neoadjuvant endocrine therapy for estrogen receptor positive breast cancer. Breast Cancer Res Treat. 2010 Jan;119(2):379-90. Ley TJ, Mardis ER, Ding L, (Watson M) et. al. DNA sequencing of a cytogenetically normal acute myeloid leukaemia genome. Nature. 2008 Nov 6;456(7218):66-72. Tomasson MH, Xiang Z, Walgren R, (Watson M), et. al. Somatic mutations and germline sequence variants in the expressed tyrosine kinase genes of patients with de novo acute myeloid leukemia. Blood. 2008 May 1;111(9):4797-808. Epub 2008 Feb 12 Xiang Z, Zhao Y, Mitaksov V, (Watson M) et.a. Identification of somatic JAK1 mutations in patients with acute myeloid leukemia. Blood. 2008 May 1;111(9):4809-12. Epub 2007 Dec 26. Link DC, Kunter G, Kasai Y, (Watson M), et. al. Distinct patterns of mutations occurring in de novo AML versus AML arising in the setting of severe congenital neutropenia. Blood. 2007 Sep 1;110(5):1648-55. Epub 2007 May 9 Lu Y, Lemon W, Liu PY, (Watson M), et. al. A gene expression signature predicts survival of patients with stage I non-small cell lung cancer. PLoS Med. 2006 Dec;3(12):e467. Grigsby PW, Watson M, Powell MA, et. al. Gene expression patterns in advanced human cervical cancer Int J Gynecol Cancer. 2006 Mar-Apr;16(2):562-7. Fagan AM, Christopher E, Taylor JW, (Watson M), et. al. ApoAI deficiency results in marked reductions in plasma cholesterol but no alterations in amyloid-beta pathology in a mouse model of Alzheimer's disease-like cerebral amyloidosis. Am J Pathol. 2004 Oct;165(4):1413-22. Ley TJ, Minx PJ, Walter MJ, (Watson M), et. al. A pilot study of high-throughput, sequence-based mutational profiling of primary human acute myeloid leukemia cell genomes Proc Natl Acad Sci U S A. 2003 Nov 25;100(24):14275-80. Epub 2003 Nov 12. Fagan AM, Watson M, Parsadanian M, et.al. Human and murine ApoE markedly alters A beta metabolism before and after plaque formation in a mouse model of Alzheimer's disease. Neurobiol Dis. 2002 Apr;9(3):305-18. Nagarajan R, Svaren J, Le N, Araki T, Watson M, Milbrandt J. EGR2 mutations in inherited neuropathies dominant-negatively inhibit myelin gene expression. Neuron. 2001 May;30(2):355-68. Helzlsouer KJ, Selmin O, Huang HY, (Watson M),et. al. Association between glutathione S-transferase M1, P1, and T1 genetic polymorphisms and development of breast cancer. J Natl Cancer Inst. 1998 Apr 1;90(7):512-8.

Sample use: Skin SPORE
• Halaban R, Zhang W, Bacchiocchi A, et. al. PLX4032, a selective BRAF(V600E) kinase inhibitor, activates the ERK pathway and enhances cell migration and proliferation of BRAF melanoma cells. Pigment Cell Melanoma Res. 2010 Apr;23(2):190-200. Epub 2010 Feb 10.
• “The persistently active ERK1/2 triggered downstream effectors in BRAF(WT) melanoma cells and induced changes in the expression of a wide-spectrum of genes associated with cell cycle control.”
• Rubinstein JC, Tran N, Ma S, Halaban R, Krauthammer M. Genome-wide methylation and expression profiling identifies promoter characteristics affecting demethylation-induced gene up-regulation in melanoma. BMC Med Genomics. 2010 Feb 9;3:4.
• “We show that the combination of promoter CpG content and methylation level informs the ability of decitabine treatment to up-regulate gene expression.”
• caBIG® Capabilities: • caTissue: Manage biospecimens and associated annotations• caArray: Collect, manage and annotate gene expression data from microarrays• caIntegrator: Makes integrated data available to researchers across the SPORE

Sample Use: Cooperative Groups Breast Cancer Data Mart
• Yuan, X and Anderson, S. Meta-analysis methodology for combiningtreatment effects from Cox proportional hazard models with different covariate adjustments. Biometrical Journal 52 (2010) 4, 1–19(2 more in preparation)• Data from 54 studies about women with breast cancer, from 6 co-
operative groups.
• Collection of 65,191 patient records in the database provides unprecedented collection of structured data for collaborative research
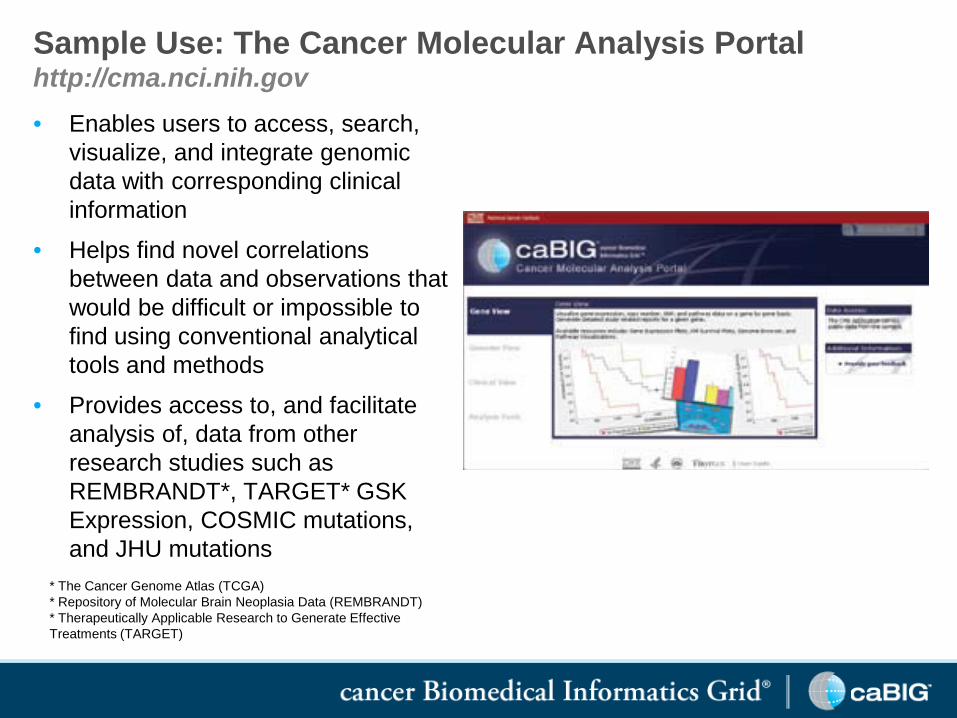
Sample Use: The Cancer Molecular Analysis Portalhttp://cma.nci.nih.gov• Enables users to access, search,
visualize, and integrate genomic data with corresponding clinical information
• Helps find novel correlations between data and observations that would be difficult or impossible to find using conventional analytical tools and methods
• Provides access to, and facilitate analysis of, data from other research studies such as REMBRANDT*, TARGET* GSK Expression, COSMIC mutations, and JHU mutations
* The Cancer Genome Atlas (TCGA)* Repository of Molecular Brain Neoplasia Data (REMBRANDT)* Therapeutically Applicable Research to Generate Effective Treatments (TARGET)

Cancer Genome Workbench for Integrated Cancer Data @ http://cgwb.nci.nih.gov
Viewers for individual & integrated genomic Data
Trace
Genome
3D Structure ViewerProtein
Landscape Heatmap Correlation Plot
Project DiseaseGenomic Data
Copy Number Gene Expression Methylation Clinical Mutation
TCGA GBM, Ovarian + + + + +
TSP lung + + +
TARGET ALL, NB + + + +
JHU GBM, Pan +
Rembrandt GBM +
GSK cell line >30 tissues + +
COSMIC >30 tissues +

Exon-array expression
under overmedium
Somatic mutation
Validated Unvalidated
Copy Number (Tumor –Normal value)-0.2—0.2-0.5-1.0-1.5-2.0 0.5 1 2 4
Methylation0.25 0.75
Comprehensive Genomic Summary

Normal
Tumor
Putative Somatic Mutations can be Manually Reviewed Eg: Frameshift Mutation in EGFR in Paired Tumor/Normal

Next-gen sequencing p53 analysis
Sample coverage maximized to 40x, height represents coverageRed line=coverage for a tumor sampleBlue line=coverage for its matching normal

Access proteins with alternative splicing
Click to get 3D viewer
Protein structure view of EGFR mutations

Big, highlighted atoms refer to the mutated amino acids (show in red in the bottom panel). You can also click on the mutated amino acid (shown in red) to turn on or off a specific mutation
3D Structure Viewer

Gene expression analyses related to clinical outcome

caBIG® In the Future

Expanding Across Sectors and Internationally
• United Kingdom: NCI collaboration with National Cancer Research Initiative (NCRI) focused on the use of caGrid technology to connect researchers and enable exchange of research data.
• Latin America: Latin American Cancer Pilot Program began patient enrollment for two clinical trials on molecularly characterized stage II and III breast cancer patients, using a broad suite of caBIG® tools to ensure that researchers can compare data across partner sites.
• China: Duke University Comprehensive Cancer Center and Beijing University Cancer Hospital launched a collaboration using caBIG®
capabilities to conduct first clinical trials in China where all patients are registered electronically.
• India: NCI engaged with the All India Institute of Medical Sciences, the Center for Development of Advanced Computing, and the Tata Memorial Hospital of Mumbai over the use of grid computing for managing clinical trials data.
15 countries engaged with and/or using caBIG® tools and technologies, including:
• United Kingdom• Latin America• India• China• Mexico, Brazil, Uruguay, Argentina, Chile• Czech Republic• The Netherlands• Germany• Finland• Jordan• Pakistan• Australia• New Zealand

Next Generation: caBIG® 2.0
caBIG® capabilities are evolving to support the rapidly changing needs of Cancer Centers as they move to EHRs and genomically-guided medicine:
• Collaborate with ASCO on caEHRs• Capitalize on tech advances: cloud computing,
Service-Oriented Architecture, mobile devices• Lower barriers: make it easier and easier for all
stakeholders to use caBIG® research capabilities• Leverage increasingly mature collection of publicly-
available open source infrastructure

The I-SPY TRIAL (Investigation of Serial studies to Predict Your Therapeutic Response with
Imaging And moLecular analysis):
A national study to leverage biomarkers in predicting response to combinatorial therapy for
women with Stage 3 breast cancer.
(PI Laura Esserman, UCSF )

Projected I-SPY 2 study sites
66

I-SPY Adaptive Trial Outline
Accrual: Anticipate 800 patients over 3–4 years
Enroll ~20 patients per month
Participating Sites: 15–20 across US and Canada
On Study
MRI MRIBiopsyBlood
MRIBlood
Surgery
BiopsyBlood
MRI Blood
Tissue
Taxol +/–New Drug(12 weekly cycles)
AC (4 cycles)

Taxol + Trastuzumab* + New Agent A
Taxol + New Agent C
Taxol + Trastuzumab*
Taxol + Trastuzumab* + New Agent B
Taxol
AC
ACHER 2 (+)
HER 2(–)
Randomize
Randomize
SurgeryTaxol + New Agent D
I-SPY Adaptive Trial: Introduce several new agents for a given profile
*Or Equivalent
On Study Surgery
Taxol + Trastuzumab* + New Agent C
Surgery
Learn, Adapt from each patient

Taxol + Trastuzumab* + New Agent A
Taxol + New Agent C
Taxol + Trastuzumab*
Taxol + Trastuzumab* + New Agent B
Taxol
AC
ACHER 2 (+)
HER 2(–)
Randomize
Randomize
Surgery
Taxol + New Agent F
Taxol + New Agent D
Taxol +New Agent G*Or Equivalent
Learn, Adapt from each patient
On Study Surgery
Taxol + Trastuzumab* + New Agent C
Taxol + Trastuzumab* + New Agent F
Surgery
I-SPY Adaptive Trial: Introduce several new agents for a given profile
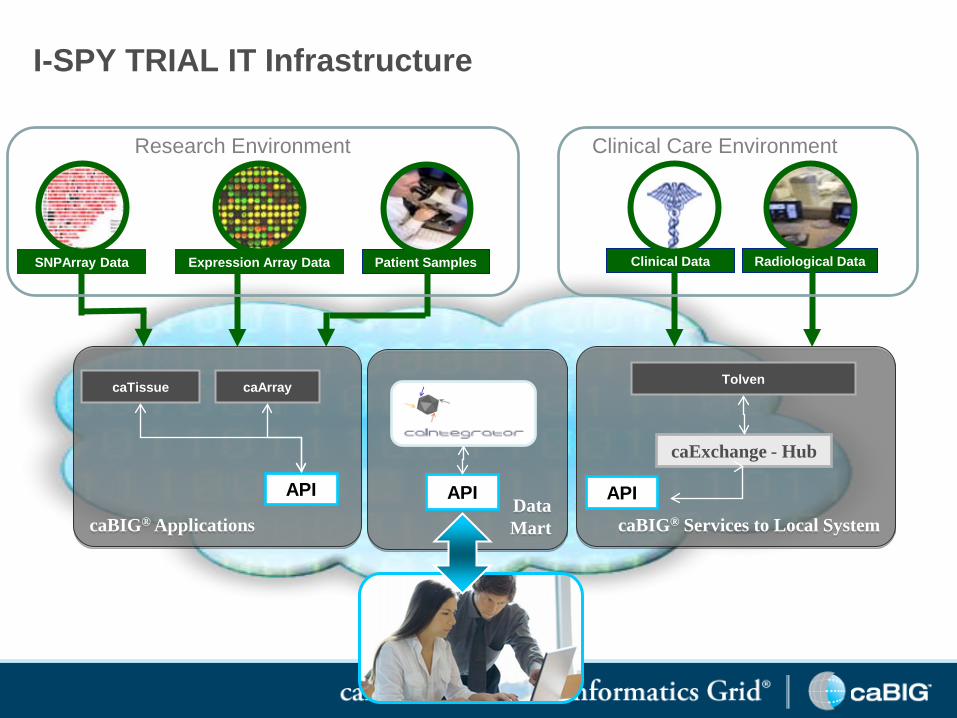
I-SPY TRIAL IT Infrastructure
Expression Array DataSNPArray Data Radiological DataClinical DataPatient Samples
DataMart
APIcaBIG® Services to Local System
caExchange - Hub
Tolven
APIcaBIG® Applications
caTissue caArray
API
Clinical Care EnvironmentResearch Environment