Status of seagrass biomass and productivity studies in Africa
38
In press with Botanica Marina, 2016 1 Biomass and productivity of seagrasses in Africa 1 Michael N. Githaiga 1, 2* , Linda Gilpin 2 , James. G. Kairo 1 ,and Mark Huxham 2 2 1 Kenya Marine and Fisheries Research Institute, Mombasa, Kenya 3 2 Edinburgh Napier University, EH11 4BN, Edinburgh, UK 4 Corresponding author: [email protected] 5 Co-authors: [email protected], [email protected], [email protected] 6 7 Abstract 8 There is growing interest in carbon stocks and flows in seagrass ecosystems, but recent 9 global reviews suggest a paucity of studies from Africa. This paper reviews work on 10 seagrass productivity, biomass and sediment carbon in Africa. Most work was 11 conducted in East Africa with a major geographical gap in West Africa. The mean 12 above-ground, below-ground and total biomasses from all studies were 174.4, 474.6 and 13 514 g DW m -2 , respectively with a global range of 461-738 g DW m -2 . Mean annual 14 production rate was 913 g DW m -2 yr -1 (global range 816 - 1012 g DW m -2 yr -1 ). No 15 studies were found giving sediment organic carbon, demonstrating a major gap in 16 seagrass blue carbon work. Given the small numbers of relevant papers and the large 17 geographical areas left undescribed in Africa, any conclusions remain tentative and 18 much remains to be done on seagrass studies in Africa. 19 Key words: Africa, blue carbon, productivity, seagrasses 20 *Corresponding author: [email protected] 21 22
Transcript of Status of seagrass biomass and productivity studies in Africa

In press with Botanica Marina, 2016
1
Biomass and productivity of seagrasses in Africa 1
Michael N. Githaiga1, 2*, Linda Gilpin2, James. G. Kairo1,and Mark Huxham2 2
1Kenya Marine and Fisheries Research Institute, Mombasa, Kenya 3
2Edinburgh Napier University, EH11 4BN, Edinburgh, UK 4
Corresponding author: [email protected] 5
Co-authors: [email protected], [email protected], [email protected] 6
7
Abstract 8
There is growing interest in carbon stocks and flows in seagrass ecosystems, but recent 9
global reviews suggest a paucity of studies from Africa. This paper reviews work on 10
seagrass productivity, biomass and sediment carbon in Africa. Most work was 11
conducted in East Africa with a major geographical gap in West Africa. The mean 12
above-ground, below-ground and total biomasses from all studies were 174.4, 474.6 and 13
514 g DW m-2, respectively with a global range of 461-738 g DW m-2. Mean annual 14
production rate was 913 g DW m-2 yr-1 (global range 816 - 1012 g DW m-2 yr-1). No 15
studies were found giving sediment organic carbon, demonstrating a major gap in 16
seagrass blue carbon work. Given the small numbers of relevant papers and the large 17
geographical areas left undescribed in Africa, any conclusions remain tentative and 18
much remains to be done on seagrass studies in Africa. 19
Key words: Africa, blue carbon, productivity, seagrasses 20
*Corresponding author: [email protected] 21
22

In press with Botanica Marina, 2016
2
Introduction 23
Understanding the role of vegetated coastal ecosystems in global carbon dynamics is a 24
field of growing interest since knowledge of natural carbon sinks and flows can 25
contribute to effective management of human impacts on the climate. Currently, our 26
understanding of the roles of different ecosystems in the global carbon budget is limited 27
by uncertainty about, and ignorance of, both individual ecosystems and their ecological 28
connectivity. Vegetated coastal ecosystems that, in the past, have been relatively 29
neglected have more recently received considerable attention following the ‘blue 30
carbon’ initiative, which established a clear distinction between the aquatic and 31
terrestrial organic carbon sinks and helped to highlight the high relative efficiency of 32
vegetated coastal sinks (Nellemann et al. 2009, http://the blue carbon initiative.org). Of 33
the three key ‘blue carbon’ habitats – salt marsh, mangrove and seagrass meadows – 34
seagrasses are the most extensive but least studied. Available reviews of seagrass 35
biomass and carbon flows globally (Duarte and Chiscano 1999, Fourqurean et al. 2012) 36
reveal that the majority of studies have been done in Western Europe, the 37
Mediterranean, the Caribbean, Australia and the American coasts. This is an indication 38
of the relative paucity of information about seagrasses in African waters. Globally, 39
seagrass ecosystems are estimated to store as much as 19.9 Pg of organic carbon and the 40
oceans may bury an estimated 27.4 Tg C yr-1 in seagrass meadows (Fourqurean et al. 41
2012). The average standing stock of seagrass is estimated at 460 g DW m-2 while the 42
average production is 5.0 g DW m-2 d-1 (Duarte and Chiscano 1999). Since these figures 43
have been derived without much contribution from seagrass studies in Africa, estimates 44
of the global seagrass carbon budget may change substantially if sequestration and 45
storage rates in African systems are distinctive. Bearing in mind that seagrasses host a 46
high species diversity globally (Short et al. 2007) and the fact that the role of seagrasses 47

In press with Botanica Marina, 2016
3
in carbon fluxes is acknowledged (Mateo et al. 2006), there is a need to understand 48
variation in biomass and carbon storage across species and sites. The aim of the present 49
study was to carry out a comprehensive assessment of all accessible literature on 50
African seagrass species, to establish the current knowledge on biomass stocks and 51
productivity, and to identify the geographic distribution of these data around Africa. 52
Materials and methods 53
Both the primary and grey literature were used. Four search engines - Google Scholar, 54
Yahoo, Science Direct and ISI Web of Science - were used when looking for any 55
available information on seagrass biomass and productivity studies in Africa up to the 56
end of the year 2015. In addition, manual searches from libraries were done especially 57
for the grey literature. Several researchers thought to have been involved in seagrass 58
biomass and carbon studies in Africa were contacted to provide any available 59
information. The search terms used were ‘seagrass’ in combination with one of the 60
following: “above-ground biomass” ,“below-ground biomass”, “biomass stocks”, 61
“carbon burial”, “productivity”, “Africa”, “target seagrass species” and “names of 62
countries” along the African coasts. Where data on biomass and productivity were given 63
as a range with no means reported, the mid-point was taken as an estimate of the mean 64
from that study. In some cases, relevant information was not given in the text but could 65
be reliably estimated from the figures. Data on biomass and productivity rates for 66
different species at different sites were investigated and summarized. 67
Results 68
Of the over 300 abstracts initially found, 32 papers and 8 reports or theses gave 69
information on biomass and/or productivity in Africa. Of these, 25 reported on seagrass 70

In press with Botanica Marina, 2016
4
biomass stocks alone while 15 reported entirely on productivity or a combination of 71
biomass stocks and productivity. Six reports or theses were on biomass stocks and three 72
on productivity, though one thesis reported on both biomass and productivity (Table 1). 73
Table 1: Published papers, reports/theses on seagrass biomass and productivity 74
studies around Africa 75
Country Biomass stocks Productivity
Papers Reports/theses Papers Reports/theses
Algeria Semroud 1990
Egypt Gab-Alla
2001
Mostafa 1996
Kenya Duarte et al.
1998
Ochieng and
Erftemeijer
1999
Kamermans
et al. 2002
Ochieng and
Erftemeijer
2003
Uku and
Björk 2005
Gwada 2004
Duarte et al.
1996
Hemminga et
al. 1995
Ochieng and
Erftemeijer
1999
Uku and Björk
2005
Ochieng et
al.1995
Libya Pergent et al.
2002
Mauritania
Laan and
Wolff 2006
Vermaat et al.
1993
Vermaat et al.
1993
Van Lent et al.
1991
Mauritius Daby 2003

In press with Botanica Marina, 2016
5
Morocco Bououraour et
al. 2015
Boutahar et al.
2015
Mozambique Bandeira
1997
Bandeira
2002
de Boer 2000
Martins and
Bandeira
2001
Paula et al.
2001
Larsson 2009 Bandeira 2002
de Boer 2000
Bandeira 2000
Larsson 2009
Seychelles Aleem 1984
South Africa Adams et al.
1992
Christie 1981
Hanekom et
al. 1988
Talbot et al.
1987
Grindley 1976

In press with Botanica Marina, 2016
6
Tanzania Eklöf et al.
2005
Gullström et
al. 2006
Kamermans
et al. 2002
Lugendo et
al. 2001
Lyimo et al.
2006
Lyimo et al.
2008
Mvungi 2011 Lyimo et al.
2006
Tunisia Sghaier et al.
2011
Sghaier 2012
Sghaier 2012
76
These peer reviewed papers, together with the reports and theses, come from studies 77
carried out primarily on the Western Indian Ocean (WIO) coastline, especially in Kenya 78
(Gazi Bay and around Mombasa), Tanzania (sites around Zanzibar Island), 79
Mozambique (Inhaca Island), Aldabra Island in the Seychelles Republic, Mauritius and 80
along the coast of South Africa. Other studies have been conducted at Sharm El-Moyia 81
Bay along the Red Sea coastline of Egypt, Banc d’ Arguin in N.W Mauritania and at 82
some bays and lagoons such as Ghar El Melh Lagoon in Northern Tunisia and at 83
Montazah Bay of Egypt on the southern Mediterranean Sea (Fig. 1). Some studies 84
(unpublished) have recently been reported from Marcha Bay, Jbel Moussa Bay and the 85
Atlantic coast of Morocco (Table 2). 86

In press with Botanica Marina, 2016
7
87
88
Fig. 1: Sites along the coastline of the African continent where seagrasses have 89
been studied 90

In press with Botanica Marina, 2016
8
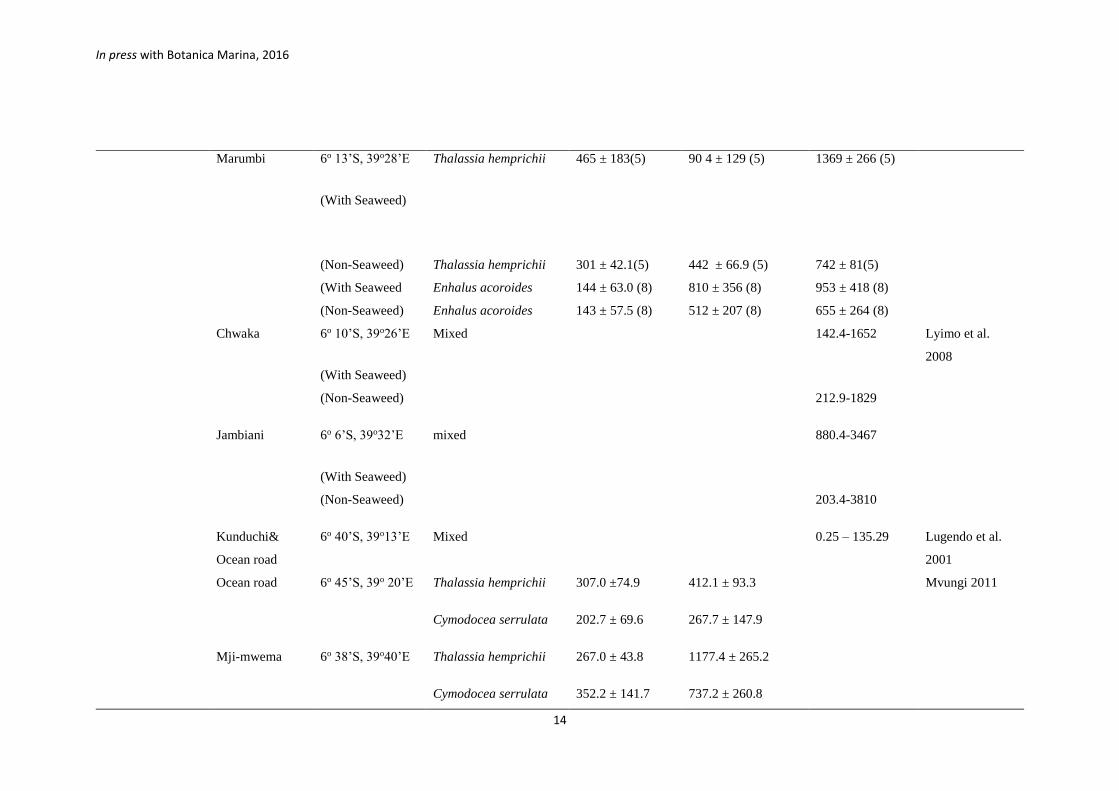
Table 2: Mean (± S.E) values for above-ground, below-ground and total biomass reported for different seagrass species at sites around 91
Africa 92
Country Location Latitude
&Longitude
Species Above-ground
biomass (g DW
m-2)
Below -ground
biomass (g DW m-2)
Total biomass (g
DW m-2)
Reference
Egypt Montazah Bay
31o 12’N,
29o55’E
Cymodocea nodosa 287 Mostafa 1996
Sharm El Moyia
Bay
27o 9’N
34o3’E
Halophila stipulaceae 270 Gab-Alla 2001
Kenya Galu
4o 18’S, 39o32’E Thalassodendron
ciliatum
40.6 ± 40.6 Uku et al. 1996
Diani 4o 18’S, 10o32’E Thalassodendron
ciliatum
279.3 ± 97.6 Uku et al. 1996
Diani 4o 18’S, 10o32’E Mixed 430 (33) Kamermans et
al. 2002
Gazi 4o 25’S, 39o30’E Thalassodendron
ciliatum
316.1± 41 368.1 ± 22 725.5 ± 252.5 Ochieng and
Erftemeijer 2003
Chale lagoon 4o 25’S, 39o30’E Thalassodendron
ciliatum
243.4 Duarte et al.
1998

In press with Botanica Marina, 2016
9
Mombasa 4o 2’S, 39o41’E Mixed 471.6 ± 66.7 Kamermans et
al. 2002
Roka 1o 36’S, 39o12’E Mixed 644 (7) Kamermans et
al. 2002
Mombasa
Marine Park
4o 2’S, 39o41’E Mixed 760 ± 96 Ochieng and
Erftemeijer 1999
Nyali
4o 03’S, 39o43’E Thalassodendron
ciliatum–North East
monsoon
277.4 ± 36.3 364.9 ± 83.5 Gwada 2004
Thalassodendron
ciliatum-South East
monsoon
269.5 ± 65 312.0 ± 123
Nyali 4o 03’S, 39o43’E Mixed 604 (33) Kamermans et
al. 2002
Kenyatta 4o 00’S, 39o44’E Mixed 233 (33)
Watamu 3o 23’S, 39o59’E Mixed 457 (33)
Mauritania Banc d’ Arguin 20o 35’N,
16o15’W
Mixed 335 Vermaat et al.
1993
Mixed 255.0 Laan and Wolff
2006
Mauritius Mon Choisy
Bay
20o 17’S, 5733’W Syringondium
isoetifolium
129.3 Daby 2003

In press with Botanica Marina, 2016
10
Halophila ovalis 102.5
Morocco Marcha lagoon 40o 39’N, 8o48’W Cymodocea nodosa 8.02-61.2 10.8 -235 Boutahar et al.
2015
Atlantic coast 23o 30’N,
15o56’W
Zostera noltii 32- 259 21- 314 Bououarour et
al. 2015
Jbel Moussa
Bay
30o 8’N, 5o21’W Zostera noltii 3.08 ± 1.12 7.72 ± 1.38
Mozambique
Inhaca 25o 58’S, 32o55’E Thalassodendron
ciliatum
355.2 ± 111.1 792. 4± 342.9 1148 (30) Bandeira 1997
Zostera capensis
(Summer)
15.7 ± 4.5 173.4 ± 47.5 190 ± 51.2 (10) de Boer 2000
Cymodocea serrulata
(Summer)
34.1 ± 18.6 38.6 ± 14.0 82.0 ± 30.8 (10)
Halodule wrightii
(Summer)
16.0 ± 22.2 17.1± 14.5 22.2 ± 21.7 (10)
Zostera capensis
(Winter)
25.7 ± 8.0 198.9 ± 75 219.5 ± 78.1 (10)
Cymodocea serrulata
(Winter)
17.6 ± 15.2 27.0 ± 14.4 43.1 ±21.8 (10)
Halodule wrightii
(Winter)
6.9 ± 5.5 18.1 ± 6.5 22.9 ± 8.2 (10)

In press with Botanica Marina, 2016
11
Inhaca
(Northern Bay)
25o 58’S, 32o55’E Thalassia hemprichii 154.4 ± 22.7 633.0 ± 163.5 787.4 ± 233.8 Martins and
Bandeira 2001
Halodule wrightii 30.7 ± 11.9
Halophila ovalis 0.6 ± 0.4
Zostera capensis 4.8 ± 2
Cymodocea rotundata 39.9 ± 18.7
Inhaca
(Southern Bay)
25o 58’S, 32o55’E Thalassia hemprichii 147.1 ± 68.65 1729.7± 495.25 1876 ± 389.4
Halodule wrightii 0.9 ± 0.7
Halophila ovalis 0 ± 0
Zostera capensis 0 ± 0
Cymodocea rotundata 4.5 ± 4 3
25o 58’S, 32o55’E Thalassodendron
ciliatum
50.1-170.7 0.04-1471.1 Paula et al. 2001
Thalassia hemprichii 14.2-291.1 9.21 – 1307.6
Zostera capensis 7.9 – 51.3 66.0 – 195.5
Inhaca 25o 58’S, 32o55’E Thalassia hemprichii 49.8 ± 3.1 Larsson 2009
Seychelles Aldabra Island 9o 41’S, 46o42’E Halodule uninervis 243 Aleem 1984
Halophila ovalis 46.5

In press with Botanica Marina, 2016
12
Mixed species 425
Thalassia hemprichii 412.5
Thalassodendron
ciliatum
468
Syringondium
isoetifolium
435
South Africa Knysna estuary 34o 05’S, 23o21’E Zostera capensis 206 Grindley 1976
Langebaan
lagoon
33o 01’S, 18o01’E Zostera capensis 217 Christie 1981
Swartkops
estuary
33o 52’S, 25o38’E Zostera capensis 75.8-124.7 Talbot et al 1987
Kromme
Estuary
34o 09’S, 24o51’E Zostera capensis
(Winter 1979)
105 ± 44 Hanekom et al.
1988
Zostera capensis
(Summer 1980)
55 ± 21
Kromme
Estuary
34o 09’S, 24o51’E 244 Adams et
al.1992
Tanzania
Chwaka 6o 10’S, 39o26’E Thalassia hemprichii 897.2 ± 754.8 - - Kamermans et
al. 2002
Chwaka 6o 10’S, 39o26’E Thalassia hemprichii 85 Eklöf et al. 2005
Enhalus acoroides 100
Thalassodendron
ciliatum
90

In press with Botanica Marina, 2016
13
Chwaka 6o 10’S, 39o26’E
Mixed 62 -105 Gullström et al.
2006
Chwaka
6o 10’S, 39o26’E
Enhalus acoroides 76.4-105.1 (20) Gullström et al
2008
Thalassia hemprichii 61.8-99.1(20)
Mixed 94.5 (20)
Jambiani 6o 6’S, 39o32’E
(With Seaweed)
Thalassia hemprichii 90.4 ±16.1(5) 185 ± 32.9 (5) 276 ± 48.7 (5) Lyimo et al.
2006
(Non Seaweed) Thalassia hemprichii 609 ± 71.5 (5) 2455±726 (5) 3063 ± 715 (5)
Chwaka 6o 10’S, 39o26’E
(With Seaweed)
Thalassia hemprichii 108 ± 23.8 (5) 179±57.9 (5) 286 ± 81.5 (5)
(Non-Seaweed) Thalassia hemprichii 175 ± 19.0 (5) 220 ± 3.4 (5) 393 ± 18.7 (5)
(With Seaweed) Enhalus acoroides 177 ± 85.5 (8) 563 ± 272 (8) 740 ± 358 (8)
(Non-Seaweed) Enhalus acoroides 199 ± 54.5 (8) 415 ± 114 (8) 614 ± 98.9 (8)
In press with Botanica Marina, 2016
14
Marumbi
6o 13’S, 39o28’E
(With Seaweed)
Thalassia hemprichii 465 ± 183(5) 90 4 ± 129 (5) 1369 ± 266 (5)
(Non-Seaweed) Thalassia hemprichii 301 ± 42.1(5) 442 ± 66.9 (5) 742 ± 81(5)
(With Seaweed Enhalus acoroides 144 ± 63.0 (8) 810 ± 356 (8) 953 ± 418 (8)
(Non-Seaweed) Enhalus acoroides 143 ± 57.5 (8) 512 ± 207 (8) 655 ± 264 (8)
Chwaka 6o 10’S, 39o26’E
(With Seaweed)
Mixed 142.4-1652 Lyimo et al.
2008
(Non-Seaweed) 212.9-1829
Jambiani 6o 6’S, 39o32’E
(With Seaweed)
mixed 880.4-3467
(Non-Seaweed) 203.4-3810
Kunduchi&
Ocean road
6o 40’S, 39o13’E Mixed 0.25 – 135.29 Lugendo et al.
2001
Ocean road 6o 45’S, 39o 20’E Thalassia hemprichii 307.0 ±74.9 412.1 ± 93.3 Mvungi 2011
Cymodocea serrulata 202.7 ± 69.6 267.7 ± 147.9
Mji-mwema 6o 38’S, 39o40’E Thalassia hemprichii 267.0 ± 43.8 1177.4 ± 265.2
Cymodocea serrulata 352.2 ± 141.7 737.2 ± 260.8

In press with Botanica Marina, 2016
15
Kiwengwa 5o 60’S, 39o23’E Mixed 115 (30) Kamermans et
al. 2002 Dongwe 6o 11’S, 39o32’E Mixed 224 (21)
Tunisia Ghar El Melh
Lagoon
37o 09’N,
10o13’E
Cymodocea nodosa 97.3 ± 51.4 264.7 ± 69.2 327.7 ± 86.1 Sghaier 2012
Cymodocea nodosa 82.5 ± 15.38 333.9 ± 49.4 413.8 ± 46 Sghaier et al.
2011
Northern lagoon
of Tunis
37o 14’N, 09o
56’E
Zostera noltii 79.75 Imen et al. 2014
93
NEM –North East Monsoon, SEM – South East Monsoon. Value in parenthesis (n) where available represents the sample size. In some studies, the total biomass is not equal 94
to the sum of the above-ground and the below-ground due to differences in the samples sizes but are captured as reported in the studies. 95
The four families of seagrass and species studied on biomass and productivity in Africa; Hydrocharitaceae (Enhalus acoroides (L.F) Royle, Halophila minor (Zoll.) den 96
Hartog, Halophila ovalis (R.Br.) Hook f., Halophila stipulaceae (Forsk.) Aschers and Thalassia hemprichii (Enhrenberg) Ascherson) Cymodoceae (Cymodocea rotundata 97
Ehrenb. Et Hempx.et Aschers.Cymodocea serrulata (R.Br.) Aschers. et Magnus, Cymodocea nodosa (Ucria) Aschers., Halodule uninervis (Forsk.) Aschers. in Bossier, 98
Halodule wrightii Aschers., Syringondium isoetifolium (Aschers.) Dandy and Thalassondendron ciliatium (Forsk.) den Hartog); Zosteraceae (Zostera capensis Setchell, 99
Zostera noltii, ); Posidonaceae (Posidonia oceanica (L.) Delile). 100
101

In press with Botanica Marina, 2016
16
Data were available for 14 species, with biomass data available for 13 species (Table 2), 102
while data on seagrass productivity were available for 10 species (Table 3). Most of the 103
seagrass biomass studies considered mixed stands, but Thalassodendron ciliatum and 104
Thalassia hemprichii were the most widely studied individual species, each having been 105
a subject of research in 9 out of the 35 locations where biomass studies were reported 106
and in 5 and 6 locations, respectively, out of the 18 locations for productivity studies. 107
Halodule wrightii, Cymodocea rotundata, Halophila stipulaceae and Halodule 108
uninervis have been studied for biomass stocks in only one location each. Similarly, 109
with the exception of Thalassia hemprichii and Thalassodendron ciliatum, a majority of 110
the other species reported in productivity research were studied in only one location 111
(Table 3). Thalassodendron ciliatum was the only species reported to have been studied 112
for all the productivity indices (Table 3).113

In press with Botanica Marina, 2016
17
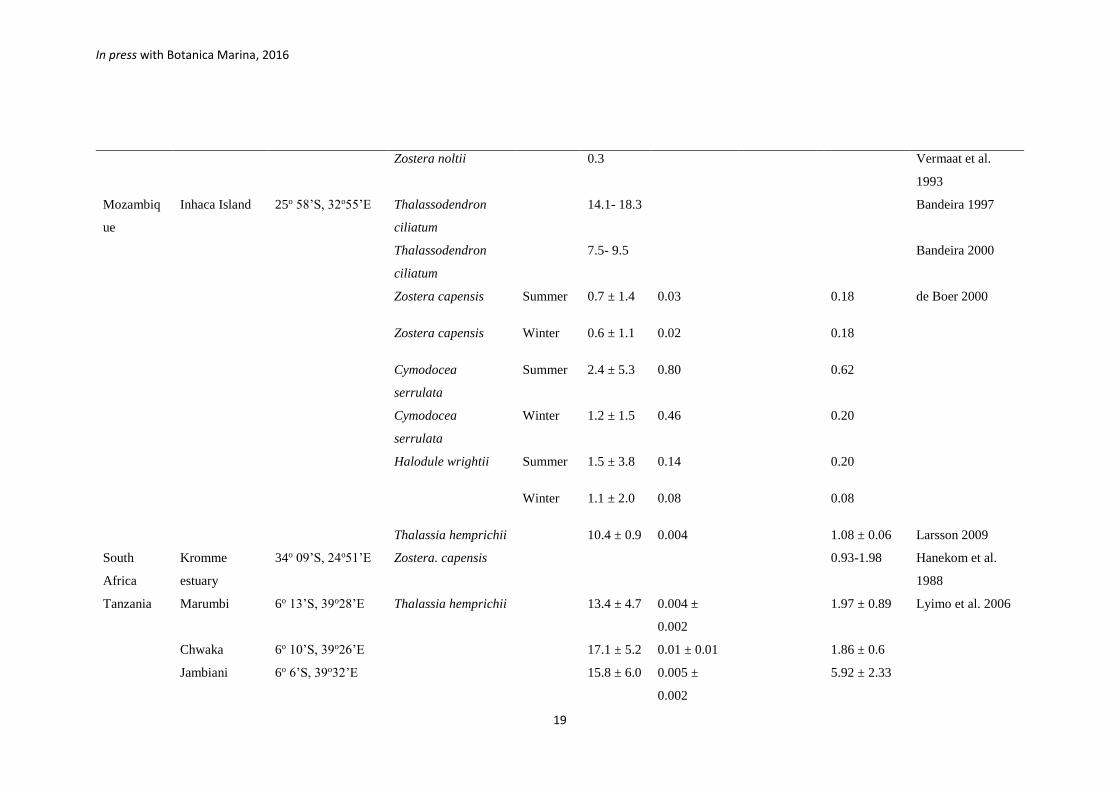
Table 3: Productivity values expressed as rates of leaf growth, leaf dry weight production, rhizome growth and total dry weight 114
production for different seagrass species at sites around Africa 115
116
Country location Latitude &
Longitude
Species Season Leaf
growth
(mm
shoot-1
day-1)
Leaf
production
(g DW
shoot-1 d-1)
Rhizome
growth(mm
d-1)
Total
Production
(g DW m-2
d-1)
Reference
Algeria Marsa 35o 51’N, 10o35’E Posidonia oceanica 0.02 Semroud 1990
Tament foust 0.35
Kenya Gazi Bay
4o 25’S, 39o30’E Thalassodendron
ciliatum
7.5 Hemminga et al.
1995
4o 25’S, 39o30’E Thalassodendron
ciliatum
20.7 ± 0.8 4.43 ± 2.7 Ochieng 1995
4o 25’S, 39o30’E Mixed species 2.4 ± 0.6 Ochieng 1995
Chale lagoon 4o 25’S, 39o30’E Thalassodendron
ciliatum
0.4 Duarte et al. 1996
Mombasa
Marine park
4o 2’S, 39o41’E Mixed species 8.2 ± 2.8 Ochieng and
Erftemeijer 1999
Nyali 4o 03’S, 39o43’E Thalassia hemprichii S.E 17.2 ± 9.5 0.008 ±
0.002
5.5 ± 4.9
(30)
Uku and Björk
2005
N.E 28.5 ± 4.1 0.008 ±
0.006
5.3 ± 0.5
(30)

In press with Botanica Marina, 2016
18
Vipingo 3o 45’S, 39o50’E S.E 17.1 ± 2.6 0.004 ±
0.001
2.4 ± 1.04
(30)
N.E 17.1 ± 2.8 0.004 ±
0.002
3.3 ±1.1(30)
Nyali 4o 03’S, 39o43’E Thalassodendron
ciliatum
S.E 17.3 ± 1.6 0.005 ±
0.005
3.7 ± 2.4
(30)
N.E 18.8 ± 5.9 0.006 ±
0.003
3.1 ± 1.8
(30)
Vipingo 3o 45’S, 39o50’E S.E 12.4 ± 5.7 0.005 ±
0.002
2.9 ± 2.4
(30)
N.E 12.4 ± 5.3 0.004 ±
0.001
1.8 ± 1.6
(30)
Nyali 4o 03’S, 39o43’E Cymodocea
rotundata
S.E 12.8 ± 1.6 0.002 ±
0.0005
2.1 ± 0.5
(30)
N.E 14.9 ± 1.8 0.002 ±
0.0002
2.3 ± 0.5
(30)
Vipingo 3o 45’S, 39o50’E S.E 10.0 ± 9.1 0.001 ±
0.0006
2.0 ± 1.1
(30)
N.E 11.7 ± 2.0 0.001 ±
0.0005
1.9 ± 1.0
(30)
Libya Farwa lagoon 33o 05’N, 11o44’E 0.02- 0.1 Pergent et al. 2002
Mauritania Banc d Arguin 20o 35’N, 16o15’W Cymodocea nodosa 0.003 Van Lent et al.
1991
In press with Botanica Marina, 2016
19
Zostera noltii 0.3 Vermaat et al.
1993
Mozambiq
ue
Inhaca Island 25o 58’S, 32o55’E Thalassodendron
ciliatum
14.1- 18.3 Bandeira 1997
Thalassodendron
ciliatum
7.5- 9.5 Bandeira 2000
Zostera capensis Summer 0.7 ± 1.4 0.03 0.18 de Boer 2000
Zostera capensis Winter 0.6 ± 1.1 0.02 0.18
Cymodocea
serrulata
Summer 2.4 ± 5.3 0.80 0.62
Cymodocea
serrulata
Winter 1.2 ± 1.5 0.46 0.20
Halodule wrightii
Summer 1.5 ± 3.8 0.14 0.20
Winter 1.1 ± 2.0 0.08 0.08
Thalassia hemprichii 10.4 ± 0.9 0.004 1.08 ± 0.06 Larsson 2009
South
Africa
Kromme
estuary
34o 09’S, 24o51’E Zostera. capensis 0.93-1.98 Hanekom et al.
1988
Tanzania Marumbi 6o 13’S, 39o28’E Thalassia hemprichii 13.4 ± 4.7 0.004 ±
0.002
1.97 ± 0.89 Lyimo et al. 2006
Chwaka 6o 10’S, 39o26’E 17.1 ± 5.2 0.01 ± 0.01 1.86 ± 0.6
Jambiani 6o 6’S, 39o32’E 15.8 ± 6.0 0.005 ±
0.002
5.92 ± 2.33

In press with Botanica Marina, 2016
20
Marumbi 6o 13’S, 39o28’E 19.4 ± 7.1 0.02 ± 0.01 2.05 ± 0.9
Chwaka 6o 10’S, 39o26’E Enhalus acoroides 24.8 ± 9.4 0.02 ± 0.01 2.77 ± 1.6
Tunisia Ghar El Melh
Lagoon
37o 09’N, 10o13’E Cymodocea nodosa 3.35 (21) 1.2 ± 1 (21) 1.42 (20) Sghaier et al. 2011
Tabarka 36o 57’N, 8o45’E
Zostera noltii 0.36
El Kantaoui 35o 51’N, 10o35’E
Posidonia oceanica
0.14 Sghaier et al. 2013
117
In press with Botanica Marina, 2016
21
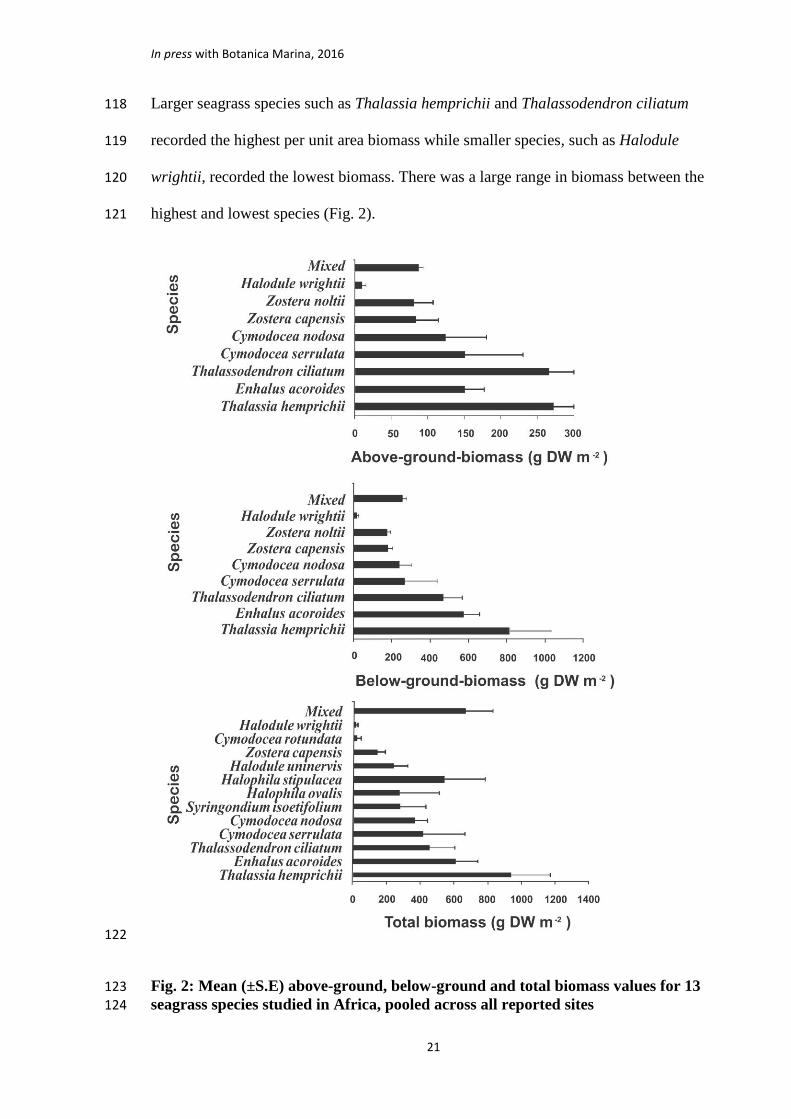
Larger seagrass species such as Thalassia hemprichii and Thalassodendron ciliatum 118
recorded the highest per unit area biomass while smaller species, such as Halodule 119
wrightii, recorded the lowest biomass. There was a large range in biomass between the 120
highest and lowest species (Fig. 2).121
122
Fig. 2: Mean (±S.E) above-ground, below-ground and total biomass values for 13 123
seagrass species studied in Africa, pooled across all reported sites 124

In press with Botanica Marina, 2016
22
The highest number of published biomass and productivity studies in Africa were 125
carried out between 1996 and 2010 accounting for 65.6% of the total, while 62.5% of 126
theses, reports or articles (unpublished or currently under peer review) have emerged 127
between 2010 and 2015 (Fig. 3). 128
129
Fig. 3: Number of publications, reports/theses containing information on biomass 130
and productivity of African seagrasses between 1976 and 2015 131
132
Biomass of seagrasses in Africa 133
We obtained 47 data sets for both the above- and below-ground biomass and 73 for total 134
biomass contained within the 32 papers and 8 reports or theses (Table 1). The total and 135
the above-ground biomass data were each reported in 21 of the 40 papers, reports and 136
theses while below-ground biomass was reported in 15 of those papers, theses and 137
reports. The total biomass for all species combined revealed large variation between 138

In press with Botanica Marina, 2016
23
sites (Table 2). The mean above- and below-ground biomasses for all species and across 139
all sites were 174.4 and 474.6 g DW m-2, respectively, representing an above to below-140
ground biomass ratio of almost 1:3. The mean total biomass was 514.3 g DW m-2. This 141
was calculated from the data available on total biomass and not necessarily from the 142
sum of above-ground and below-ground biomass as some studies did not record either 143
the above-ground or the below-ground biomass (Table 2). The highest total biomass 144
was recorded for mixed seagrasses in a non-seaweed area at Jambiani in Zanzibar at 145
3063.3 g DW m-2 whilst the lowest total biomass of 0.6 g DW m-2 was recorded for 146
Halophila ovalis at Northern Bay on Inhaca Island off Mozambique in the same study 147
(Table 2). In terms of species, the highest biomass was recorded for Thalassia 148
hemprichii at 1876 g DW m-2 in Southern Bay of Inhaca Island, Mozambique (Table 2). 149
Comparison of the means for the above-ground, below-ground and total biomasses for 150
individual species reveal that the highest mean biomasses were found for Thalassia 151
hemprichii at 271.7 g DW m-2, 817.8 g DW m-2 and 928.0 g DW m-2, respectively, 152
while the lowest mean biomasses were for Halodule wrightii at 11.5 g DW m-2, 17.6 g 153
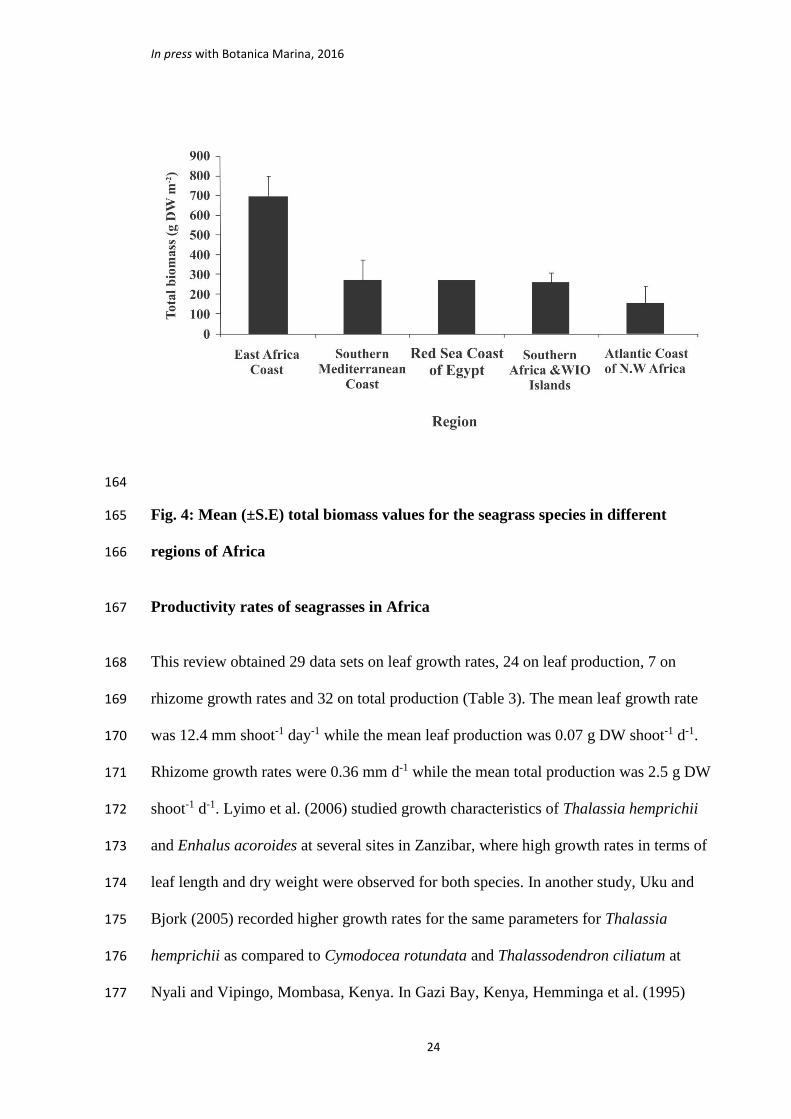
DW m-2 and 19.2 g DW m-2, respectively. In terms of the five regions where the 154
seagrass data are available (Fig. 4), the East African coast has the highest mean above-155
ground, below-ground and total biomass at 256.8, 587.1 and 778.1 g DW m-2, 156
respectively. The South Mediterranean seagrasses had below-ground and above-ground 157
biomasses of 299.3 and 155.6 g DW m-2, respectively, while the South Africa and the 158
WIO Islands had means of 413.3 and 95.7 g DW m-2, respectively, for the same 159
parameters. Data available from the North West African region show the lowest mean 160
biomass for the three parameters with 61.06 g DW m-2 for the above-ground biomass, 161
145.2 g DW m-2 for the below-ground biomass and 159.4 g DW m-2 for the total 162
biomass (Fig. 4). 163
In press with Botanica Marina, 2016
24
164
Fig. 4: Mean (±S.E) total biomass values for the seagrass species in different 165
regions of Africa 166
Productivity rates of seagrasses in Africa 167
This review obtained 29 data sets on leaf growth rates, 24 on leaf production, 7 on 168
rhizome growth rates and 32 on total production (Table 3). The mean leaf growth rate 169
was 12.4 mm shoot-1 day-1 while the mean leaf production was 0.07 g DW shoot-1 d-1. 170
Rhizome growth rates were 0.36 mm d-1 while the mean total production was 2.5 g DW 171
shoot-1 d-1. Lyimo et al. (2006) studied growth characteristics of Thalassia hemprichii 172
and Enhalus acoroides at several sites in Zanzibar, where high growth rates in terms of 173
leaf length and dry weight were observed for both species. In another study, Uku and 174
Bjork (2005) recorded higher growth rates for the same parameters for Thalassia 175
hemprichii as compared to Cymodocea rotundata and Thalassodendron ciliatum at 176
Nyali and Vipingo, Mombasa, Kenya. In Gazi Bay, Kenya, Hemminga et al. (1995) 177

In press with Botanica Marina, 2016
25
reported total productivity for Thalassodendron ciliatum that was much higher than 178
reported from other sites (Table 3). In another study of a monospecific stand of 179
Thalassodendron ciliatum at Gazi Bay, Ochieng (1995) recorded a mean shoot growth 180
rate of 20.7 mm day-1 which was higher than the rate recorded in most of the other 181
studies for the same species. The review for all species, whether growing in 182
multispecific or pure stands, indicated that Zostera capensis and Cymodocea serrulata 183
had the lowest shoot growth rates of less than 1 mm shoot-1 day-1 recorded at Inhaca 184
Island, Mozambique (de Boer, 2000). Some seasonality is indicated for Thalassia 185
hemprichii with a maximum of 28.5 mm shoot-1 day-1 during the North East monsoon 186
and 17.2 mm shoot-1 day-1 during the South East monsoon at Nyali in Mombasa (Uku 187
and Björk. 2005). Daily leaf production also differed between sites and species with a 188
maximum of 0.01 g DW shoot-1 d-1 for Thalassia hemprichii recorded at Chwaka in 189
Zanzibar (Lyimo et al. 2006). Lowest daily leaf production was 0.001 g DW shoot-1 d-1 190
for Cymodocea rotundata recorded at Vipingo in Mombasa (Uku and Björk. 2005). The 191
mean productivity rates for all species, where available, indicated that Thalassia 192
hemprichii had the highest total productivity rates while the lowest was in an eelgrass, 193
Zostera capensis (Table 4). The mean leaf production per day for individual species was 194
highest in Cymodocea serrulata while the lowest was in Cymodocea rotundata. 195
Comparison of rhizome growth rates indicated highest rates in Cymodocea nodosa and 196
lowest in Posidonia oceanica. The mean for total production was highest in mixed 197
stands while the lowest was recorded in Halophila ovalis (Table 4).198

In press with Botanica Marina, 2016
26
Discussion and Conclusion 199
This assessment of studies on seagrass biomass stocks and productivity around Africa 200
found a limited number of papers and reports with most of them reporting from 201
countries on the Western Indian Ocean coastline (Kenya, Tanzania, Mozambique, South 202
Africa, Madagascar, Seychelles and Mauritius). A few studies have also been reported 203
from the Red Sea coastline of Egypt, the north eastern part of the Atlantic coastline on 204
the coast of Mauritania and Morocco and more recently some studies (unpublished), 205
have emerged from the Mediterranean coastline of Tunisia. However, the limited 206
number of studies demonstrates a paucity of information on the carbon budget and 207
flows in Africa. Similar observations of a geographical bias in research on seagrass 208
biomass stocks, with Africa particularly underrepresented, have been made in other 209
reviews (Duarte and Chiscano 1999, Fourqurean et al. 2012). Some of the seagrass 210
studies in Africa concentrated on one biomass pool (above-ground or below-ground) 211
while others focused on total biomass only (Table 2). An important observation in this 212
review is that seagrass studies in Africa have ignored the sediment organic carbon, the 213
most important part of the putative ‘blue carbon’ sink provided by seagrasses, revealing 214
a major gap in seagrass blue carbon work. Since the reviewed studies reported on only 215
14 out of a total of 34 species in the Tropical Atlantic, Tropical Indo-Pacific and South 216
African flora, the current work suggests that the basic ecology, including productivity 217
and standing stock, of many species remains largely unknown. 218
The available data from the seagrass biomass and productivity studies in Africa reveal 219
that seagrasses allocate higher biomass to their below-ground than their above-ground 220
components, with mean estimates for the above and below-ground biomasses of 174.4 g 221
DW m-2 and 474.6 g DW m-2, respectively. In a review of seagrass biomass from 222

In press with Botanica Marina, 2016
27
different studies globally, Duarte and Chiscano (1999) arrived at above- and below-223
ground mean biomasses of 223.9 g DW m-2 and 237.4 g DW m-2, respectively. These 224
findings differ from the results of this study in which the above-ground biomass was 225
only ~37 % of the biomass below-ground. Though these results deviate from our 226
findings, our results are consistent with other observations, such as the most recent 227
review of a global dataset, that the below-ground component of seagrasses forms the 228
largest proportion of the living seagrass biomass and may constitute about two thirds of 229
the total biomass in seagrass meadows (Fourqurean et al. 2012). The similarity of 230
above-ground and below-ground biomass estimates in Duarte and Chiscano (1999) was 231
attributed to the fact that some seagrass biomass studies did not measure the below-232
ground biomass, which in some cases could account for 15-50 % of the total production 233
as observed in an earlier study (Duarte et al. 1998). Though grazing and mechanical 234
damage inflicted by wave scouring and by human activities may not significantly affect 235
seagrass productivity and biomass storage, it nevertheless impacts on the meadows 236
leading to high turnover rates especially for the above-ground component. 237
The mean estimate for total seagrass biomass in this review of 514.3.4 g DW m-2 is 238
within the global range. The seagrasses of Abu Dhabi in the United Arab Emirates were 239
estimated to contain a total biomass of 122.3 g DW m-2 (Campbell et al. 2014). In a 240
review of global seagrass carbon storage, the Posidonia oceanica of the Mediterranean 241
Sea were found to have the highest biomass at 2144 g DW m-2 while the mean biomass 242
from the global seagrass data was estimated at 738.4 g DW m-2 (Fourqurean et al. 243
2012). While this global estimate is higher than our total African biomass estimate, this 244
could be explained by the influence of the high biomass of Posidonia oceanica in other 245
regions as well as the limited information on seagrass biomass from Africa in previous 246
global estimates. In terms of the five regions along the coasts of Africa where seagrass 247

In press with Botanica Marina, 2016
28
research has been done, this study observed that the East African seagrasses had the 248
highest biomass at 738.1 g DW m-2 compared to 370.8 g DW m-2 for the Southern 249
Mediterranean where Cymodocea nodosa was the dominant species. No study was 250
found from this southern part of the Mediterranean Sea containing information for 251
Posidonia oceanica. 252
The review observed that higher biomass values occurred in larger species compared to 253
the smaller species (Fig 2). This may suggest that larger species tend to develop higher 254
below-ground biomass and hence have a higher capacity for biomass storage due to the 255
relatively slow turnover of the below-ground materials (Duarte and Chiscano 1999). 256
The current assessment of available data from Africa on seagrass biomass supports this 257
view. 258
The current review arrived at a mean total production estimate of 912.5 g DW m-2 yr-1 259
against 1012 g DW m-2 yr-1 obtained in a previous seagrass biomass and production 260
reassessment using a global data set (Duarte and Chiscano 1999) and an earlier one of 261
816 g DW m-2 yr-1 (Duarte and Cebrián 1996). Seagrass beds with mixed species were 262
found to have the highest total production, estimated at 1935 g DW m-2 yr-1, followed 263
by Thalassodendron ciliatum at 1423 g DW m-2 yr-1, suggesting that some species do 264
better when in association with others. Growth patterns for different species and 265
variation in environment between sites could account for the differences in values 266
observed. Some species may have the potential to accumulate biomass but this may be 267
kept low by resource limitation or due to the heavy losses caused by physical 268
disturbance (Duarte and Chiscano 1999). Biomass and productivity for some seagrass 269
species was reported to exhibit seasonality which could be attributed to periodical 270
fluctuations in abiotic factors such as irradiance, temperature and hydrological 271
conditions (Uku and Björk 2005,de Boer 2000). 272

In press with Botanica Marina, 2016
29
The estimates arrived at in this study may involve considerable errors, given the general 273
paucity of studies, particularly for some seagrass species, and a lack of uniformity in the 274
sampling methods used by different researchers. However, with the development of the 275
Blue Carbon sampling manual by the International Blue Carbon Initiatives Scientific 276
Working Group (Howard et al. 2014, http://the blue carbon initiative.org), and new 277
emphasis on researchers adopting uniform sampling protocols, future research should 278
produce more reliable and comparable estimates. Whilst the research gap revealed here 279
may be similar to many other areas in which Africa is under-represented, seagrasses 280
perhaps present a particular challenge for research in countries with relatively poor 281
infrastructure and resources, since they may require expensive sampling work utilizing 282
specialized skills such as scuba diving. 283
Considering that the African coastline is extensive with large areas of seagrass cover, 284
the spatial extent of study is very limited. The fact that this review did not find seagrass 285
biomass studies from the West African coast, with the exception of Mauritania which is 286
more to the North West coast, is another clear indication of the paucity of knowledge on 287
seagrass biomass stocks in Africa. A majority of the studies have been done on the West 288
Indian Ocean coastline mainly through funding by the West Indian Ocean Marine 289
Sciences Association (WIOMSA) in partnership with the well-established research 290
Institutions in the region or through partnership with institutions outside Africa. This 291
signifies the importance of strengthening collaboration between institutions and the 292
need for increased research funding if the knowledge gaps are to be filled. As the first 293
review of seagrass biomass and productivity in Africa, we hope the current work will 294
generate interest among the scientific community by identifying an important and 295
missed opportunity for research. By contributing to a better understanding of the role of 296

In press with Botanica Marina, 2016
30
seagrass ecosystems in carbon budgets in Africa this may help to support the protection 297
of these valuable ecosystems. 298
Acknowledgements 299
This article is based on research undertaken for Coastal Ecosystem Services in East 300
Africa (CESEA) NE/L001535/1 research project and was funded with support from the 301
Ecosystem Services for Poverty Alleviation (ESPA) programme. The ESPA programme 302
is funded by the Department for International Development (DFID), the Economic and 303
Social Research Council (ESRC) and the Natural Environment Research Council 304
(NERC). Additional support was made through Edinburgh Napier University and Kenya 305
Marine and Fisheries Research Institute (KMFRI) to which we are grateful. Finally, we 306
thank the three anonymous reviewers for their constructive comments which improved 307
the quality of the manuscript.308

In press with Botanica Marina, 2016
31
References 309
Adams, J. B., and M. M. B. Talbot. 1992. The influence of river impoundment on the 310
estuarine seagrass Zostera capensis Setchell. Bot. Mar.35: 69–76. 311
Aleem, A. A. 1984. Distribution and ecology of seagrass communities. Deep Sea 312
Res.31: 919 – 933. 313
Bandeira, S. O. 1997. Dynamics, biomass and total rhizome length of the seagrass 314
Thalassodendron ciliatum at Inhaca Island, Mozambique. Plant Ecol.130: 133–315
141. 316
Bandeira, S.O.2000. High production rates of the seagrass Thalassodendron ciliatum 317
from the rocky and sandy habitats in Southern Mozambique: A comparative study 318
In: (Diversity and Ecology of Seagrasses in Mozambique): Emphasis on 319
Thalassodendron ciliatum. Structure, Dynamics, Nutrients and Genetic Variability. 320
Ph. D. Thesis, Göteborg. University, Sweden. pp.18. 321
Bandeira, S. O. 2002. Leaf production rates of Thalassodendron ciliatum from rocky 322
and sandy habitats. Aquat. Bot.72: 13–24. 323
Bououarour, O., R. EL.Kamcha, L. Boutahar, A. Tnoumi, Z. Bendahhou, A. Benhoussa 324
and B. Hocein. 2015. In:(Mediterranean Seagrass Workshop). Spatial patterns of 325
the Zostera noltii meadows across the Atlantic coast of Morocco: is there a 326
latitudinal gradient?-Sardinia. Italy. pp. 81. 327
Boutahar, L.,Y. S. Ramzi, O. Atef, R. EL. Kamcha, A. Benhoussa, E. Ostale and H. 328
Bazairi. 2015. In (Mediterranean Seagrass Workshop).First data on biomass and 329
In press with Botanica Marina, 2016
32
abundance of two eelgrass (Zostera marina) meadows south to the strait of 330
Gilbraltar Jbel Moussa, Morocco. -Sardinia, Italy.pp. 109. 331
Campbell, J. E., E. A. Lacey, R. A. Decker, S. Crooks and J. W. Fourqurean. 2014. 332
Carbon Storage in Seagrass Beds of Abu Dhabi, United Arab Emirates. Estuaries 333
Coast. 38: 242-251. 334
Christie, N. D. 1981 - Primary production in the LangebaanLagoon. In:(J. H. Day. eds). 335
Estuarine Ecology with Particular Reference to Southern Africa. Cape Town; 336
Balkema. pp.101-115. 337
Daby, D. 2003. Effects of seagrass bed removal for tourism purposes in a Mauritian 338
Bay. Environ. Pollut. 125: 313–324. 339
De Boer, W. F. 2000. Biomass dynamics of seagrasses and the role of mangrove and 340
seagrass vegetation as different nutrient sources for an intertidal ecosystem. Aquat. 341
Bot.66: 225–239. 342
Duarte, C. M. 1996a. Growth and population dynamics of Thalassodendron ciliatum in 343
a Kenyan back-reef lagoon.Aquat. Bot.55: 1–11. 344
Duarte, C. M. and J. Cebrián.1996b. The fate of marine autotrophic production. Limnol. 345
Oceanogr.41: 1758–1766. 346
Duarte, C., M. Merino and N. Agawin. 1998. Root production and below-ground 347
seagrass biomass. Mar. Ecol.171: 97–108. 348
Duarte, C. and C. Chiscano. 1999. Seagrass biomass and production: a reassessment. 349
Aquat. Bot.65: 159–174. 350

In press with Botanica Marina, 2016
33
Eklöf, J. S., M. de la Torre Castro, L. Adelsköld, N. S Jiddawi, and N. Kautsky. 2005. 351
Differences in macrofaunal and seagrass assemblages in seagrass beds with and 352
without seaweed farms. Est. Coast. Shelf Sci.63: 385–396. 353
Fourqurean, J. W.,C. M. Duarte, H. Kennedy, N. Marbà, M. Holmer, M. A. Mateo and 354
D. Krause-jensen. 2012. Seagrass ecosystems as a globally significant carbon 355
store. Nat. Geo.5: 1–5. 356
Gab-Alla, A. 2001. Ecological Status of the Seagrass Community in Sharm El-Moyia 357
Bay (Gulf of Aqaba, Red Sea) after Oil Pollution in 1999. Mar. Sci.12: 231–239. 358
Grindley, J. R. 1976. Report on ecology of Knysna Estuaryand proposed Braamekraal 359
Marina. (Internal Report). School of Environmental Studies, University of Cape 360
Town. South Africa. pp.133. 361
Gullström, M., B. Lundén, M. Bodin, J. Kangwe, M. C. Öhman, M.S.P. Mtolera and M. 362
Björk. 2006. Assessment of changes in the seagrass-dominated submerged 363
vegetation of tropical Chwaka Bay (Zanzibar) using satellite remote sensing. Est. 364
Coast. Shelf Sci.67: 399–408. 365
Gullström, M., M. Bodin, P. G. Nilsson and M.C. Öhman. 2008. Seagrass structural 366
complexity and landscape configuration as determinants of tropical fish 367
assemblage composition. Mar. Ecol. Prog. Ser.363:241–255. 368
Gwada, P. 2004. An assessment of seagrass survival and functioning in response to 369
manipulations in sediment redox at Nyali Lagoon, MombasaKenya.WIOMSA 370
report. MARG-1. GRANTEE 2001/2. 371

In press with Botanica Marina, 2016
34
Hanekom, N., L. Lagoon. 1988. Distribution and variations in seasonal biomass of 372
eelgrass. Zostera capensis in the Kromme estuary, St Francis Bay South Africa. 373
S.Afri. J. mar. Sci.7: 51–59. 374
Hemminga, M. A., P. Gwada, F. J. Slim, P. de Koeyer and J. Kazungu. 1995. Leaf 375
production and nutrient contents of the seagrass Thalassodendron ciliatum in the 376
proximity of a mangrove forest (Gazi Bay, Kenya). Aquat. Bot.50: 159–170. 377
Howard, J., S. Hoyt, K. Isensee, M. Telszewski and E. Pidgeon. 2014. (eds). Coastal 378
Blue Carbon Methods for assessing carbon stocks and emmission factors in 379
mangroves, tidal salt marshes and seagrasses. Conservation International, 380
Intergovernmental Oceanographic Commission of UNESCO, International Union 381
for Conservation of Nature, Arlington, Virginia, USA. 382
Imen, B. S.and S Abdessalem. 2015. In (Mediterranean Seagrass Workshop). 383
Distribution , biomass and phenology of Zostera noltii meadows in the Northern 384
lagoon of Tunis in the summer of 2014. -Sardinia, Italy. pp. 80. 385
Kamermans, P., M.A. Hemminga, J. F.Tack, M. A. Mateo, N. Marbà, M. Mtolera and 386
Daele, T. Van. 2002. Groundwater effects on diversity and abundance of lagoonal 387
seagrasses in Kenya and on Zanzibar Island ( East Africa ). Mar. Ecol. Prog. 388
Ser.231: 75–83. 389
Laan, B. B., P. A. Van Der and W.J Wolff. 2006. Circular pools in the seagrass beds of 390
the Banc d ’ Arguin , Mauritania , and their possible origin. Aquat. Bot.84: 93–100. 391

In press with Botanica Marina, 2016
35
Larsson, S. 2009. The Production of the Seagrass Thalassia hemprichii in relation to 392
epiphytic biomass. M.sc. thesis (unpublished). Göteborg. University, Sweden. pp. 393
12. 394
Lugendo, B. R. Y. Mgaya and A. Semesi. 2001. The seagrass and associated 395
macroalgae at selected beaches along Dar es Salaam coast. In: (M. D.Richmond 396
and J.Francis, eds) Marine Science Development in Tanzania and East Africa. 397
WIOMSA Books Series.pp. 359–374. 398
Lyimo, T. J.,E.F. Mvungi, C. Lugomela and M. Björk. 2006. Seagrass biomass and 399
productivity in Seaweed and Non- Seaweed Farming areas in the East Coast of 400
Zanzibar.West Indi. Ocea. J. Mar. Sci.5: 141 – 152. 401
Lyimo, T., E. Mvungi and Y. Mgaya. 2008. Abundance and diversity of seagrass and 402
macrofauna in the intertidal areas with and without seaweed farming activities in 403
the east coast of Zanzibar. Tanz. J. Sci.34:41-52. 404
Martins, A. and S. Bandeira. 2001. Biomass distribution and leaf nutrient concentrations 405
and resorption of Thalassia hemprichii at Inhaca Island, Mozambique. S. Afri. J. 406
Bot.67: 439–442 407
Mateo M.A., J. Cebrian, K. Dunton, T. Mutchler 2006. Carbon Flux in Seagrass 408
Ecosystem. In: (A. Larkum, R. Orth and C. Duarte. eds). Seagrass Biology, 409
Ecology and Conservation. Netherlands, Springer-Verlag. pp.159-192. 410
Mostafa, H.M. 1996. Preliminary observations of the seagrass Cymodocea nodosa 411
(Ucria) Ascherson in the Mediterranean waters of Alexandria, Egypt. Bull. of Natl 412
Inst. Ocea. Fish. 22: 19-28. 413

In press with Botanica Marina, 2016
36
Mvungi, E. F. 2011. Seagrasses and eutrophication Interactions between seagrass 414
photosynthesis. Ph.Dthesis (unpublished)Stockholm University, Sweden. pp 44. 415
Nellemann, C., E. Corcoran, C. M. Duarte, L.Valdes, C. De Young, L. Fonseca and 416
Grimsditch. (Eds).2009. Blue carbon. A Rapid Response Assessment.GRID-417
Arendal.United Nations Environmental Programme. ISBN: 978-82-7701-060-1. 418
Ochieng, C. A. 1995. Productivity of seagrasses with respect to intersystem fluxes Gazi 419
Bay (Kenya). In: Interlinkages between Eastern African Coastal Ecosystems. 420
Contract No .T53-CT92-0114. Final report. pp. 82-86. 421
Ochieng, C. A.and P. L. Erftemeijer.1999. Accumulation of seagrass beach cast along 422
the Kenyan coast: a quantitative assessment. Aquat. Bot.65:221–238. 423
Ochieng, C. A. and P. L. Erftemeijer.2003. Seagrasses of Tanzania and Kenya..In: (E. 424
Green, F. Short, eds). World Atlas of Seagrasses. World Conservation Monitoring 425
Centre. University of California Press, USA, Berkely. pp. 93-100. 426
Paula, J., P. F. Ecosta, A. Martins and D. Gove.2001. Patterns of abundance of 427
seagrasses and associated infaunal communities at Inhaca Island, Mozambique. 428
Est. Coast. Shelf Sci. 53: 307–318. 429
Pergent, G.,A. Djellouli,A. A. Hamza, K. S. Ettayeb, A. A. El Mansouri, F. M. Talha, 430
and F Platini.2002. Characterization of the benthic vegetation in the Farwà Lagoon 431
(Libya). J. Coast. Cons.8: 119-126. 432
Semroud, R., S.Mezegrane, L.Soltane. 1990. Etude lépidochronologique de Posidonia 433
oceanica dans la régiond’Alger (Algérie): donnéspréliminaires. Rapp. P.V.Réun. 434
Comm.Int. Explor. Sci. Médit. 31: 10. 435

In press with Botanica Marina, 2016
37
Sghaier, Y. R., R. Zakhama-Sraieb, and F. Charfi-Cheikhrouh.2011. Primary production 436
and biomass in a Cymodocea nodosa meadow in the Ghar El Melh lagoon, Tunisia. 437
Bot. Mar.54: 411–418. 438
Sghaier, Y. R. 2012. Seasonal variation of Cymodocea nodosa in the Ghar El Melh 439
lagoon ( Tunisia ), with reference to insolation , temperature and salinity 440
effects.Bull. Inst. Natn. Scien. Tech.Mede. Salammbõ. 39: 117-125. 441
Sghaier, Y. R., R. Zakhama-Sraieb, and F. Charfi-Cheikhrouha.2013. Patterns of 442
shallow seagrass (Posidonia oceanica) growth and flowering along the Tunisian 443
coast. Aquat. Bot.104: 185–192. 444
Short, F., T. Carruthers,W. Dennison, and M. Waycott. 2007. Global seagrass 445
distribution and diversity: A bioregional model. J. Exp. Mar. Biol. and Ecol.350: 446
3–20. 447
Talbot, M. M. B., G. C. Bate,. 1987. The distribution and biomass of the seagrass 448
Zostera capensis in a warm-temperate estuary. Bot. Mar.30: 91–99. 449
Uku, J. N., E. E. Martens and K. M. Mavuti. 1996. An Ecological Assessment of Littoral 450
Seagrass Communities in Diani and Galu Coastal Beaches , Kenya.M.sc. thesis 451
(unpublished). University of Nairobi. pp 185. 452
Uku, J. N and Björk, M. 2005. Productivity aspects of three tropical seagrass species in 453
areas of different nutrient levels in Kenya. Est. Coast. Shelf Sci63: 407–420. 454
Van Lent, F., P. H. Nienhuis, and J.M Verschuure. 1991. Production and Biomass of the 455
Seagrasses Zostera-noltii Hornem and Cymodocea nodosa (Ucria) Aschers at the 456
In press with Botanica Marina, 2016
38
Banc-Darguin (Mauritania, N.W Africa). A Preliminary approach. Aquat. Bot.41: 457
353–367. 458
Vermaat, J. E., J. J. Beijer,R. Gijlstra, M. J. M. Hootsmans, C. J. M. Philippart., N. W. 459
van den Brink, and W.van Vierssen. 1993. Leaf dynamics and standing stocks of 460
intertidal Zostera noltii Hornem. and Cymodocea nodosa (Ucria) Ascherson on the 461
Banc d’Arguin (Mauritania). Hydrobiologia.258: 59–72. 462