STATUS OF AGRICULTURAL INNOVATIONS, INNOVATION …Bungoma South Farmers Innovation Platform SIMLESA...
108
STATUS OF AGRICULTURAL INNOVATIONS, INNOVATION PLATFORMS AND INNOVATIONS INVESTMENT Program of Accompanying Research for Agricultural Innovation www.research4agrinnovation.org Kenya
Transcript of STATUS OF AGRICULTURAL INNOVATIONS, INNOVATION …Bungoma South Farmers Innovation Platform SIMLESA...
STATUS OF AGRICULTURAL INNOVATIONS,INNOVATION PLATFORMS AND
INNOVATIONS INVESTMENT
Program of Accompanying Research for Agricultural Innovation www.research4agrinnovation.org
Kenya

Status of
Agricultural Innovations,
Innovation Platforms
and Innovations Investment
in Kenya

Citation:
Makini, F. W; Kamau, G; Makelo, M; Mose, L. O; Salasya, B; Mulinge, W and Ong'ala, J (2016). Status of Agricultural Innovations, Innovation Platforms, and Innovations Investment. 2015 PARI
project country report: Republic of Kenya. Forum for Agricultural Research in Africa (FARA), Accra Ghana. FARA encourages fair use of this material. Proper citation is requested. Acknowledgements
FARA: Yemi Akinbamijo, Fatunbi Oluwole Abiodun, Augustin Kouevi
ZEF: Heike Baumüller, Joachim von Braun, Oliver K. Kirui Detlef Virchow,
The paper was developed within the project “Program of Accompanying Research for Agricultural Innovation” (PARI), which is funded by the German Federal Ministry of Economic Cooperation and Development (BMZ).

v
Table of Contents Abbreviations and Acronyms vii Study Background ix STUDY 1: Inventory of Agricultural Technological Innovations
Introduction 2 Methodology 4 Sources of information 4 Results 6 Value Chains addressed by Innovations 7 Innovation Triggers 8 Innovation types by their triggers 8 Scale of innovations 10 Stakeholders involved 10 Roles of stakeholders 11 Effects of innovations 12 Innovation Benefits 12 Beneficiaries of Innovations 13 STUDY 2: Inventory and Characterisation of Agricultural
Innovation Platforms
Introduction 16 Methodology 19 Results 22 Main Value Chains in the Innovation Platforms 23 Actors in the IPs and their Roles 24
Entry points for the IPs 26 Achievements realized by the innovation platforms 27
Challenges faced by IPs 28 Success Case Study 29 Focal Area Development Committee (FADC) Innovation Platform 29 IP characterisation 30 Sustainability 32 Achievements 33 Challenges 33
Domestic Horticultural Markets for Kieni East and West Sub-counties: A case of embargo innovation platform 34
IP characterisation 35 Achievements 35 Challenges 37
vi
Sustainability 37 Bungoma South Farmers Innovation Platform SIMLESA (BUSOFIPS) 37 IP characterisation 38 Implementation 39 Sustainability 39 Achievements 40 Challenges 40
Failure Case Study 42 Gadam Sorghum Innovation Platform in Tharaka North and South sub-Counties 42 IP characterisation 42 Implementation and management of IP 43 Sustainability 44 Achievements 44 Challenges 45
Mworoga SIMLESSA Innovation Platform 46 IP characterisation 46 Achievements 47 Challenges 47 Lessons learnt from the IPs 48 STUDY THREE: Investments in Innovations for Agricultural
Development and Food and Nutrition Security
Introduction 50 Methodology 52 Results 53 Trends in Investment 54 Trends in National and Agricultural Growth 55 Agricultural GDP as explained by annual expenditure in agriculture 56 Crop Productivity Trends 56 Specific projects 62
Synthesis of project impacts 62 Challenges in the sector 70 Conclusion 71 Lessons learnt and recommendations 73 References 74 Appendices 77
vii
ABBREVIATIONS AND ACRONYMS
AfDB African Development Bank AgGDP The Agricultural Gross Domestic Product ASAL Arid and Semi-Arid Lands ASARECA Association for Strengthening Agricultural Research in Eastern and
Central Africa ASDS Agricultural Sector Development Strategy ASDSP Agricultural Sector Development Support Programme ASK Agricultural Shows of Kenya ASTI Agricultural Science and Technology Indicators ATIRI Agricultural Technology and Information Response Initiative CDFZ Coast Disease Free Zones DRSLP Drought Resilience and Sustainable Livelihoods Project EAAPP East African Agricultural Productivity Project EABLM East African Breweries Ltd and East African Malting ERA Economic Review of Agriculture FCRP Food Crops Research project GDP Gross Domestic Product GoK Government of Kenya ICT Information Communication Technology IFPRI International Food Policy Research Institute KACCAL Kenya Adaptation to Climate Change in Arid and Semi-Arid Lands KALRO Kenya Agricultural and Livestock Research Organization KAPAP Kenya Agricultural and Productivity Project KAPP Kenya Agricultural Productivity Project KAP-SLM Kenya Agricultural Project-Sustainable Land Management KARI Kenya Agricultural Research Institute KENFF Kenya National Farmers Federation KEPHIS Kenya Plant Health Inspectorate Services KES Kenya Shilling KSPFS Kenya Special Project on Food Security KSU KALRO Seed Unit MOA Ministry of Agriculture MOALF Ministry of Agriculture, Livestock and Fisheries MSLMAPS Mainstreaming Sustainable Land Management in Agro-Pastoral
Production Systems NAAIP National Accelerated Agricultural Inputs Access Project NALEP National Agricultural and Livestock Extension Program NARP National Agriculture Research Project NGOs Non-Governmental Organizations NIB National Irrigation Board
viii
NMK Njaa Marufuku Kenya NPT National Performance Trials NSWCP National Soil and Water Conservation Project PARI Program of Accompanying Research for Agricultural Innovation PEGRES Project for Enhancing Gender Responsive Extension Services RICEMAPP Rice-based Marketing Agriculture Promotion Project RPLRP Regional Pastoral Livelihoods Resilience Project SDCP Smallholder Dairy Commercialization Project SHDP Smallholder Dairy Project SHEP-PLUS
Smallholder Horticulture Empowerment Promotion Project for Local and Up scaling
SHEP-UP Smallholder Horticulture Empowerment & Promotion Unit Project SHoMAP Smallholder Horticulture Marketing Programme SIDA Swedish International Development Agency TFP Total Factor Productivity THVC Traditional High Value Crops USAID United States Agency for International Development WKIEMP Western Kenya Integrated Ecosystems Management Project YMAP Youth in Modern Agriculture Project

ix
STUDY BACKGROUND
Science and technology remains the fulcrum for development over the ages. There is hardly any national development in contemporary history that is not based on consistent efforts from the science and technology sector. The spate of development in agriculture follow suit; the state of efficiency in science and technology generation correlates highly with the development of agriculture. In Africa, agriculture is considered as the sector with the best potential to lead the socioeconomic development of countries on the continent. However, the sector is bedevilled with many constraints that could be categorized as technological, socio-cultural, institutional, infrastructural, and economical. The poor productivity of the enterprise stream in the sector is clearly seen from its contribution to a country’s GDP versus the number of active workers engaged in the sector. Africa’s agriculture currently engages about 65% of the working population and its average contribution to GDP still stands at 22.9%.
The crave to develop Africa has received good attention in recent years, starting with the political will of the heads of states, under the auspices of the Africa Union Commission, to develop and implement the Comprehensive Africa Agricultural Development Programme (CAADP), the Science Technology and Innovation Strategy (STISA). The Forum for Agricultural Research in Africa (FARA) also came up with a handful of continental initiatives, such as the Sub-Saharan Africa Challenge Programme (SSA CP), Strengthening Capacity for Agricultural Research and
Development in Africa (SCARDA), Dissemination of New Agricultural Technologies in Africa (DONATA) and several others. The different initiatives aim to foster change by addressing specific issues that constitute constraints in the path of progress in Africa agriculture. The notion that African agricultural research system has generated a lot of technologies with great potentials, but which are not realized due to different institutional and organizational constraints—more specifically, the way agricultural research and development systems is organized and operated—is prevalent among stakeholders in the sector. Indeed, this notion appeals to reasoning. However, there is no known cataloguing or documentation of existing technologies and their veracity in delivering broad-based outcomes. The possibility of finding some documentation in annual reports of research institutes, journal articles and thesis in the universities is known, but this will not meet an urgent need.
Thus, the Programme of Accompanying Research for Agricultural Innovation (PARI) commissioned the three studies reported in this volume to provide a compressive analysis of the state of agricultural technology generation, innovation, and investment in innovations in the last 20 years in selected countries in Africa.

x
Study 1 is the “situation analysis of agricultural innovations in the country” and provides succinct background on the spate of agricultural innovation in the last 30 years. It provides useable data on the different government, international and private sector agricultural research and development interventions and collates information on commodities of interest and technologies generated over the years. It also conducted an assessment of the different interventions so as to highlight lessons learnt from such interventions, with regard to brilliant successes and failures.
Study 2 concerns a “scoping studies of existing agricultural innovation platforms in the country”. It carried out an identification of all the existing Innovation Platforms (IP) in the country, including identification of commodity focus, system configuration, and partnership model. The study provides an innovation summary for each IP for use in the electronic IP monitor platform. It further synthesises the lessons learnt from the agricultural IPs established through different initiatives in the country in the last ten years.
Study 3 was an “Assessment of the national and international investment in agricultural innovation”. It is an exhaustive assessment of investments in innovation for agricultural development, food and nutrition security in the country. It collates updated data on investment levels in the past and present, including a projection for the next decade requirement to assure food and nutritional security in the country.
The three studies form the comprehensive collation on the state of agricultural innovation in the 12 countries where the PARI project is being implemented. It is expected that these studies will benefit all stakeholders in Africa’s agricultural research and development, including the users of technologies, research stakeholders, extension system actors and, more importantly, the policymakers.

STUDY 01
Inventory of Agricultural Technological Innovations (1995 to 2015)
INTRODUCTION
The economy of many African countries is largely driven by agricultural development in a mutually reinforcing way. The agricultural sector provides 80% of the livelihoods, creates employment to about 60% of the people and 63% of the rural households derive their incomes from agriculture (MTIP II, 2012-2018). It is therefore imperative that governments should channel all efforts into addressing challenges and utilizing opportunities in the agricultural sector. Towards this end, agricultural research organizations have generated many technologies, but their impact on farmers’ livelihood and quality of life has been minimal (Juma, 2011; World Bank, 2006). Among other reasons attributed to this state of affairs is the linear approach to technology development that fails to consider the inputs and involvement of the non-research sector actors (Biggs et al., 1981; Hawkins et al., 2009). Recent approaches to research and development have deviated from the traditional linear model and embraced engagement of multiple value chain actors to promote innovation in the agricultural system (World Bank, 2006). An example of such an approach is the Integrated Agricultural Research for Development (IAR4D) advocated by FARA, which is premised on the continuous interaction among actors in a network to facilitate social learning. The ultimate aim is to generate innovations rather than mere research products or technologies (Nokoe et al., 2013; Hall et al., 2006; Nederlof et al., 2011). The theoretical basis of this concept is the agricultural innovation systems framework which has increasingly gained currency in agricultural systems to enhance innovation capacity among relevant actors (World Bank, 2006; Kimenye and Mcewan, 2014). The framework lays emphasis on innovation as the application of new knowledge and the interactive learning between actors in a social and institutional context for social and economic outcomes (Hounkonnou, 2012). The knowledge may be acquired through learning, research or experience, but cannot be considered as an innovation until it is applied (Hall, Mytelka and Oyeyinka, 2005; Kilelu, Klerkx, Leuwis, 2008). The term “innovation” can be used both as a result or a product and the process leading up to that result (Brodtrick, 1999). In this study, innovation is defined as new knowledge that is generated and utilized/applied to improve a system for social and economic benefits. For new knowledge to qualify as an innovation, it has to find users, who deploy it for economic and social benefits. The innovation can be of technical, organizational or institutional type and may occur in different domains in the agricultural sector and may occur in combination as bundles (Triomphe et al., 2012).

Study 1: Inventory of Agricultural Technological Innovations 3
Technical innovations are new technical knowledge used to improve performance by minimizing operational costs or providing a solution to a challenge. An example may be an improved crop variety or animal breed which is adopted by producers, or a new technical process which improves efficiency. Organizational innovations are new organizational setups intended to increase performance by reducing costs, improving productivity or improving access to required resources. An example may be the collective access to input or output markets, or production clusters to minimize losses or costs. Institutional innovations may be new operational instruments in form of social norms, or operating procedures which facilitate effectiveness in processes. They may be new policies, acts or legislation that open up bottlenecks in a system. An example may be relaxation of import requirements and policy incentives. However, they have to be deployed to qualify as innovations. Agriculture plays an important role in the development of the Kenyan economy. The sector engages over 40% of the national population and over 70% of the rural population. It provides formal employment to 18% of the population and provides livelihood opportunities to the growing youth population (ASDS, 2010-2020). Recent efforts by the government of Kenya to develop the sector are expressed in its medium-term investment plan, which is aligned to the Comprehensive African Agricultural Development Programme (CAADP) framework (MTIP II, 2013-2018). The plan gives adequate recognition to the diversity of agro-ecological conditions and stakeholder configuration. It proposes investment in six strategic thrusts: increased productivity and competitiveness, private sector participation, sustainable NRM, extension services, increasing market access, and effective implementation. The Programme for Accompanying Research for Innovation (PARI) is a partnership initiative between the Forum for Agricultural Research in Africa (FARA) and the International Food Policy Research Institute (IFPRI), which is entrenched in the “One World No Hunger” initiative of the government of Germany. The PARI project aims to secure and enhance investments in Agricultural Innovation Centres (AICs) in a sustainable way through a dedicated cooperation between research and application. PARI takes cognisance of the successes of research and innovation initiatives in African agriculture—an example being the integrated agricultural research for development (IAR4D) concept promoted by FARA. The programme aims to build an independent accompanying research to support the scaling of agricultural innovations in Africa and thereby spurring development of the African agriculture sector.
Despite many years and huge financial resources invested in Kenya agriculture, food and nutrition insecurity continues to be a challenge; this requires a transformation of agriculture by leveraging on the use of innovations. While many studies have been
4 PROGRAMME FOR ACCOMPANYING RESEARCH IN INNOVATION (PARI)
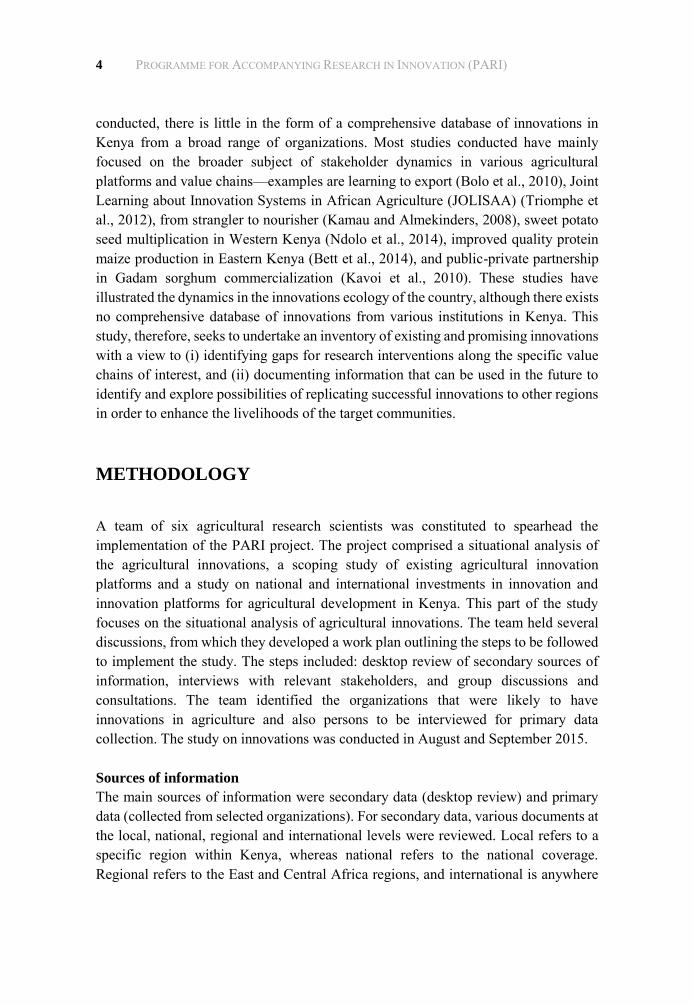
conducted, there is little in the form of a comprehensive database of innovations in Kenya from a broad range of organizations. Most studies conducted have mainly focused on the broader subject of stakeholder dynamics in various agricultural platforms and value chains—examples are learning to export (Bolo et al., 2010), Joint Learning about Innovation Systems in African Agriculture (JOLISAA) (Triomphe et al., 2012), from strangler to nourisher (Kamau and Almekinders, 2008), sweet potato seed multiplication in Western Kenya (Ndolo et al., 2014), improved quality protein maize production in Eastern Kenya (Bett et al., 2014), and public-private partnership in Gadam sorghum commercialization (Kavoi et al., 2010). These studies have illustrated the dynamics in the innovations ecology of the country, although there exists no comprehensive database of innovations from various institutions in Kenya. This study, therefore, seeks to undertake an inventory of existing and promising innovations with a view to (i) identifying gaps for research interventions along the specific value chains of interest, and (ii) documenting information that can be used in the future to identify and explore possibilities of replicating successful innovations to other regions in order to enhance the livelihoods of the target communities.
METHODOLOGY
A team of six agricultural research scientists was constituted to spearhead the implementation of the PARI project. The project comprised a situational analysis of the agricultural innovations, a scoping study of existing agricultural innovation platforms and a study on national and international investments in innovation and innovation platforms for agricultural development in Kenya. This part of the study focuses on the situational analysis of agricultural innovations. The team held several discussions, from which they developed a work plan outlining the steps to be followed to implement the study. The steps included: desktop review of secondary sources of information, interviews with relevant stakeholders, and group discussions and consultations. The team identified the organizations that were likely to have innovations in agriculture and also persons to be interviewed for primary data collection. The study on innovations was conducted in August and September 2015.
Sources of information The main sources of information were secondary data (desktop review) and primary data (collected from selected organizations). For secondary data, various documents at the local, national, regional and international levels were reviewed. Local refers to a specific region within Kenya, whereas national refers to the national coverage. Regional refers to the East and Central Africa regions, and international is anywhere

Study 1: Inventory of Agricultural Technological Innovations 5
outside of East and Central Africa. The desktop study involved in-depth review of related literature and up-to-date reports on agricultural innovations. The literature reviewed included published articles and books; national and international annual and quarterly agricultural reports, project reports from government and non-government organizations (NGOs), Faith-based organizations (FBOs) and community-based organizations (CBOs), media reports, and archives in the respective stakeholder organizations. From the desktop review and group discussions, target organizations for primary data collection were identified and listed. The organizations identified included national research organizations, international research organizations (mainly the CGIAR group), universities, and the private sector, such as seed companies and non-government organizations. A number of existing innovations were also identified during the desktop review and brainstorming sessions. The literature review and brainstorming sessions came up with 32 organizations that were likely to have innovations in agriculture. Given the time constraint, it was not possible to visit all the organizations listed. There was, therefore, the need to rationalize them to identify a few to be visited. The following criteria were used to select the organizations: prior knowledge that the organization had developed innovations; geographical proximity to an organization already selected; likelihood that the organization would provide unique information from what other organizations would provide. The rationalization process led to a list of 25 organizations, which were 5 CGIAR organizations, 7 universities, 3 seed companies, 2 NGOs and 8 national research institutes. Using information gathered during literature review and brain storming sessions, the team developed a checklist for data collection from various organizations. The checklist included information on the following aspects that describe the innovation:
Type/nature of innovation (technical, organizational or institutional) Domain of the innovation (such as livestock, crop, governance, etc) Value chain (such as maize, dairy, etc) Stakeholders involved and levels of interaction Stakeholder roles Triggers to the development of the innovation (such as low productivity, policy
change, market demand, diseases/pests, etc) Scale of the innovation (local, national, regional or international) Beneficiaries of the innovation and how they benefitted Effect of innovation (positive, negative, promising)

6 PROGRAMME FOR ACCOMPANYING RESEARCH IN INNOVATION (PARI)
The team reconstituted itself into two groups of three members each, which visited the selected organizations in accordance with appointments made earlier. On arrival at the respective organizations, the teams interviewed relevant contact persons (i.e. those working in agriculture and related fields) using the checklist described earlier. For the organizations which the research team could not personally visit due to time limitations, the checklist was sent to them and the relevant persons were asked to fill and send them back. FINDINGS
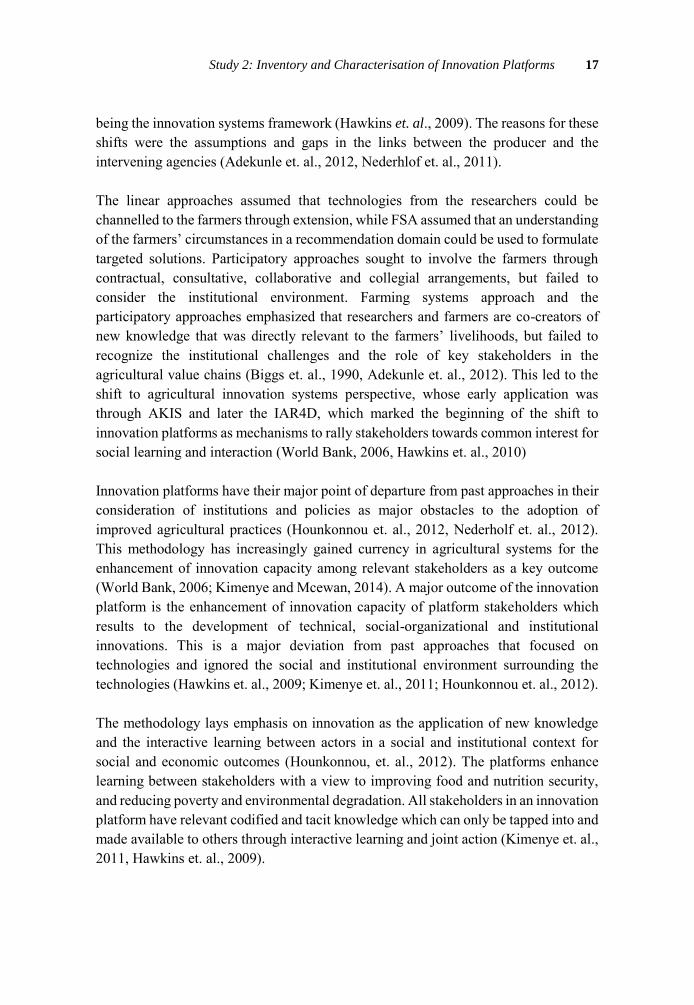
Types of Innovations and Domains The results in Figure 1 showed that 43 innovations were identified and categorized into: technical, organizational and institutional. Majority (61%) of the innovations were technical, 23% were organizational and 16% were institutional.
Figure 1. Types of innovation
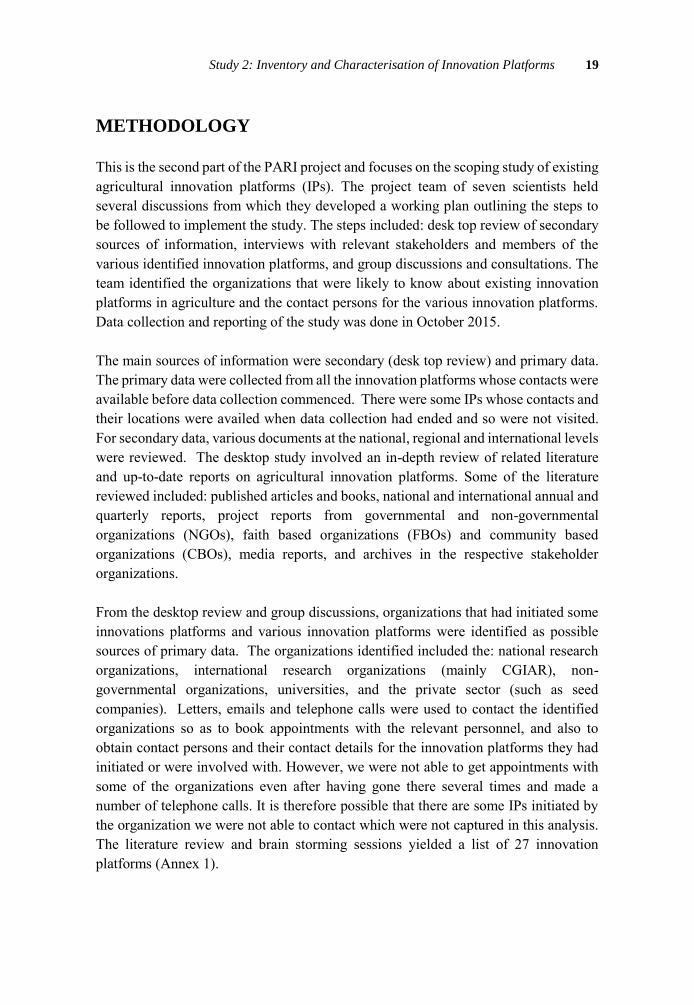
The innovations were in eight domains: cropping, livestock, governance, marketing, finance, processing, natural resource management (NRM) and value addition (figure 2). Overall, 62% of the innovations were in the crop domains; livestock and governance had 10 % each, while marketing had 6%. Comparatively, the innovations in natural resource management, value addition and financing domains were less than 5%. Majority of the technical innovations (n=25) were in crops (17 cases). Others were in livestock (5 cases), processing (2 cases) and value addition (1 case). Organizational innovations (n=10) were mainly in the crop domain (8 cases), governance (3 cases),
Institutional, 16%
Organizational, 23%Technical,
61%

Study 1: Inventory of Agricultural Technological Innovations 7
marketing (1 case) and financing (1 case). The institutional innovations were in crop (4 cases), governance (2 cases) and financing (1 case). Value chain addressed by innovations
The dominant value chains were potato (16.3%), tea (14%), dairy (12%), banana (9%), maize and sorghum (7%). Other value chains were sugar, wheat, barley, finger millet, goat, horticulture and rice. Most of the crop-based value chains were cereal crops, except for tea, potato, banana, cassava and horticulture. There were three innovations that addressed all crops and one innovation addressing all livestock (table 1)
Figure 2. Domain of innovation Table 1. Value chains hosting the identified innovations
Value Chain Percent Value Chain Percent
Potato 16.3 Sugar 4.7 Tea 14.0 Wheat 4.7 Dairy 11.6 All crops and livestock 2.3 Banana 9.3 Barley 2.3
All Crops 7.0 Cassava 2.3
Maize 7.0 Finger millet 2.3 Sorghum 7.0 Goat 2.3 Rice 4.7 Horticulture 2.3
010203040506070
Per
cen
tag
e o
f In
no
va
tio
n
Domain
8 PROGRAMME FOR ACCOMPANYING RESEARCH IN INNOVATION (PARI)
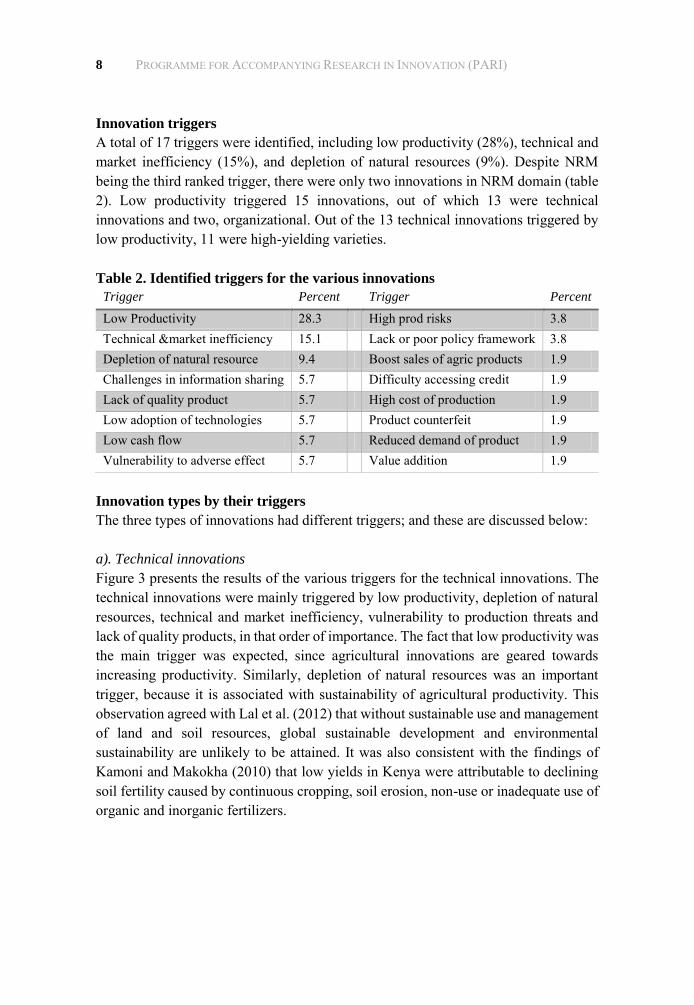
Innovation triggers
A total of 17 triggers were identified, including low productivity (28%), technical and market inefficiency (15%), and depletion of natural resources (9%). Despite NRM being the third ranked trigger, there were only two innovations in NRM domain (table 2). Low productivity triggered 15 innovations, out of which 13 were technical innovations and two, organizational. Out of the 13 technical innovations triggered by low productivity, 11 were high-yielding varieties. Table 2. Identified triggers for the various innovations
Trigger Percent Trigger Percent
Low Productivity 28.3 High prod risks 3.8 Technical &market inefficiency 15.1 Lack or poor policy framework 3.8 Depletion of natural resource 9.4 Boost sales of agric products 1.9 Challenges in information sharing 5.7 Difficulty accessing credit 1.9 Lack of quality product 5.7 High cost of production 1.9 Low adoption of technologies 5.7 Product counterfeit 1.9 Low cash flow 5.7 Reduced demand of product 1.9 Vulnerability to adverse effect 5.7 Value addition 1.9
Innovation types by their triggers
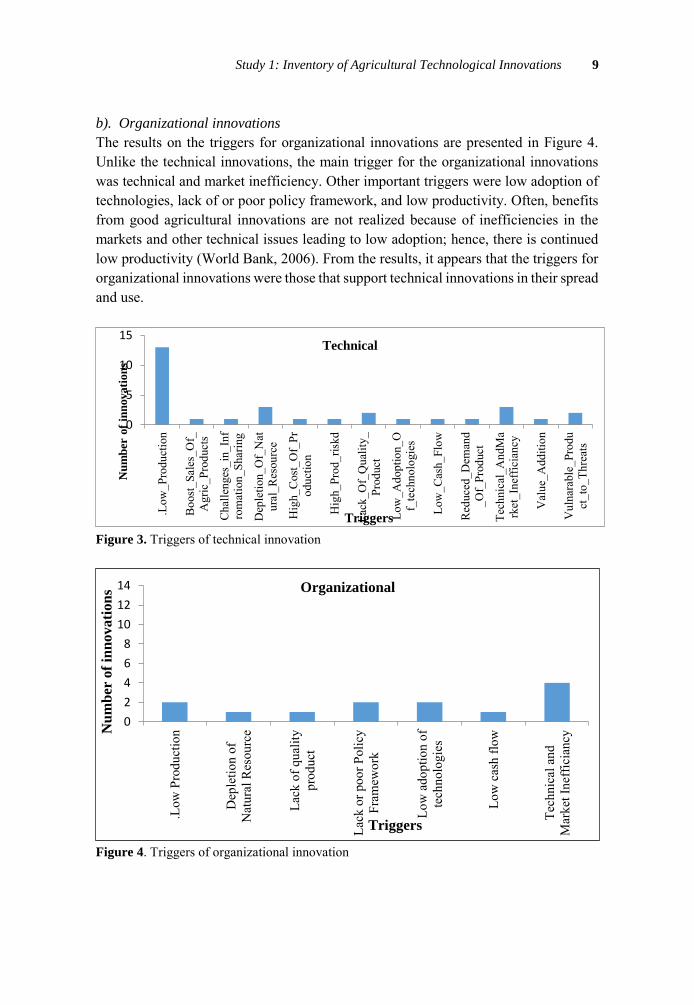
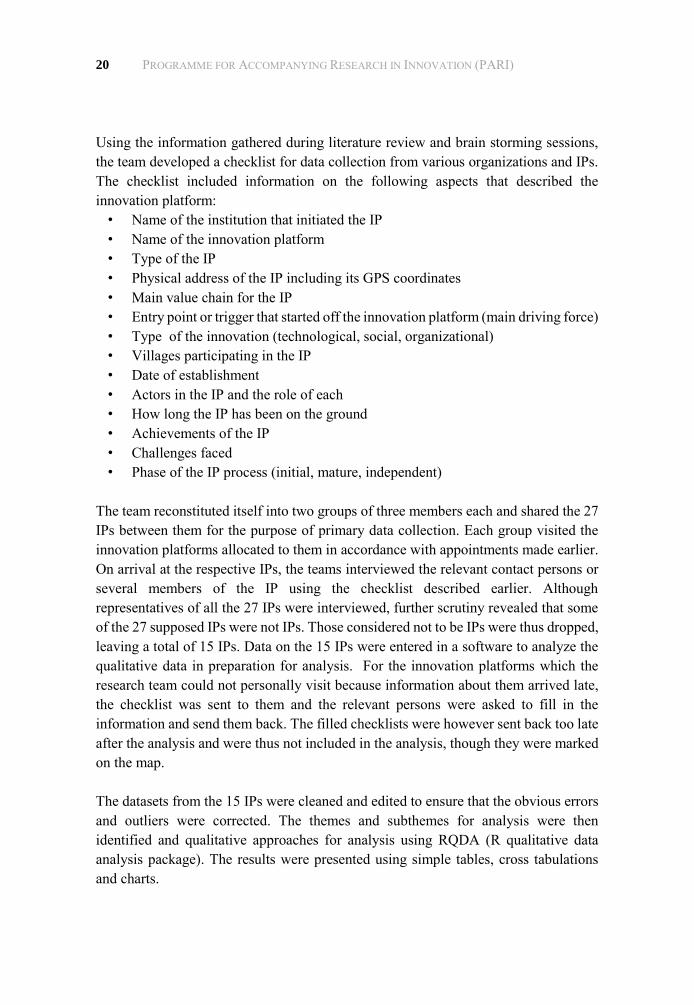
The three types of innovations had different triggers; and these are discussed below: a). Technical innovations
Figure 3 presents the results of the various triggers for the technical innovations. The technical innovations were mainly triggered by low productivity, depletion of natural resources, technical and market inefficiency, vulnerability to production threats and lack of quality products, in that order of importance. The fact that low productivity was the main trigger was expected, since agricultural innovations are geared towards increasing productivity. Similarly, depletion of natural resources was an important trigger, because it is associated with sustainability of agricultural productivity. This observation agreed with Lal et al. (2012) that without sustainable use and management of land and soil resources, global sustainable development and environmental sustainability are unlikely to be attained. It was also consistent with the findings of Kamoni and Makokha (2010) that low yields in Kenya were attributable to declining soil fertility caused by continuous cropping, soil erosion, non-use or inadequate use of organic and inorganic fertilizers.
Study 1: Inventory of Agricultural Technological Innovations 9
b). Organizational innovations
The results on the triggers for organizational innovations are presented in Figure 4. Unlike the technical innovations, the main trigger for the organizational innovations was technical and market inefficiency. Other important triggers were low adoption of technologies, lack of or poor policy framework, and low productivity. Often, benefits from good agricultural innovations are not realized because of inefficiencies in the markets and other technical issues leading to low adoption; hence, there is continued low productivity (World Bank, 2006). From the results, it appears that the triggers for organizational innovations were those that support technical innovations in their spread and use.
Figure 3. Triggers of technical innovation
Figure 4. Triggers of organizational innovation
0
5
10
15
.Low
_Pro
duct
ion
Boo
st_S
ales
_Of_
Agr
ic_P
rodu
cts
Cha
lleng
es_i
n_In
fro
mat
ion_
Shar
ing
Dep
letio
n_O
f_N
atur
al_R
esou
rce
Hig
h_C
ost_
Of_
Prod
uctio
n
Hig
h_Pr
od_r
iskd
Lack
_Of_
Qua
lity_
Prod
uct
Low
_Ado
ptio
n_O
f_te
chno
logi
es
Low
_Cas
h_Fl
ow
Red
uced
_Dem
and
_Of_
Prod
uct
Tech
nica
l_A
ndM
ark
et_I
neff
icia
ncy
Val
ue_A
dditi
on
Vul
nara
ble_
Prod
uct
_to_
Thre
ats
Nu
mb
er o
f in
novati
on
s
Triggers
Technical
0
2
4
6
8
10
12
14
.Low
Pro
duct
ion
Dep
letio
n of
Nat
ural
Res
ourc
e
Lack
of q
ualit
ypr
oduc
t
Lack
or p
oor P
olic
yFr
amew
ork
Low
ado
ptio
n of
tech
nolo
gies
Low
cas
h flo
w
Tech
nica
l and
Mar
ket I
neff
icia
ncyN
um
ber
of
inn
ovati
on
s
Triggers
Organizational

10 PROGRAMME FOR ACCOMPANYING RESEARCH IN INNOVATION (PARI)
c) Institutional innovation
Figure 5 presents the results on the triggers for institutional innovations. There were almost as many triggers as there were institutional innovations, which implied that each innovation was developed to address a specific challenge.
Figure 5. Triggers of institutional innovations Scale of Innovation
Out of all the innovations identified for local application, 65.1% had a national scale application, 21% had a regional scale, while 2% could be applied at an international scale (figure 6).
Figure 6. Scale of the innovations
Stakeholders Involved
There were 11 different stakeholders involved in the development of the identified technologies. The major stakeholders involved were research and training organizations (76.7%), farmers (67.4%), national and county governments (41.9%),
02468
101214
Cha
lleng
es in
Infr
omat
ion_
Shar
ing
Dep
letio
n O
f Nat
ura
Res
ourc
e
Diff
icul
tyA
cces
sing
Cre
dit
Hig
h Pr
oduc
tion
risks
Low
Cas
h Fl
ow
Prod
uct
Cou
nter
Feig
ht
Tech
nica
l an
dM
arke
t Ine
ffic
ianc
y
Vul
nara
ble
Prod
uct
to T
hrea
tsNu
mb
er o
f in
no
va
tio
ns
Triggers
Institutional
International, 2%
Regional, 21%
National, 65%
Local, 100%

Study 1: Inventory of Agricultural Technological Innovations 11
international centres (34.9%), regulators (27.9%), seed companies (23.3%) and NGOs (20.9%). A striking observation was that participation of the private sector and market actors was minimal— less than 25.6%.
Figure 7. Stakeholders involved in the innovation Roles of stakeholders
The stakeholders played different roles; the roles of major ones were the initiation of innovation (21%), provision of resources (18%), implementation of innovation (14%), and provision of information (11%). Other roles played by different stakeholders were provision of technical support (9%), training and capacity building (9%), provision of services (5%) and management of innovation (3%) (table 3).
Table 3. Stakeholder's roles in the innovation process
Roles of the Stakeholder Percent Major actors
Initiating innovation 21.3 Research and training organization, producer companies and NGOs
Provision of Resources 18.0 International agricultural organizations, financial and development organization, private sector
Implementation of Innovation
13.9 Farmers, market actors, producer companies
Provide information for Innovation
10.7 Farmers, NGO,
Identify and mobilize stakeholders
9.8 National and county governments, NGO,
Provision of technical support
9.0 Research and training organization,
Training and capacity building
9.0 Research and training organization,
Provision of services 4.9 National and county governments, NGO, Management of innovation 3.3 Farmers, NGO
76.7 67.4
41.934.9
27.9 25.6 23.3 20.9 18.67
0102030405060708090
Res
earc
h an
dTr
aini
ngO
rgar
niza
tions
Far
mer
s
Nat
iona
l and
Cou
nty
Gov
ernm
ent
Agr
icIn
tern
atio
nal
Org
aniz
atio
ns G
over
nmen
tA
utho
rity
and
Reg
ulat
ory…
Fin
acia
l and
Dev
elop
men
tIn
stiti
tutio
n
Pro
duce
rC
ompa
nies
NG
Os
Mar
ket A
ctor
s
Priv
ate
Sect
or
Per
cen
tag
e o
f In
no
va
tio
n
Stakeholders
12 PROGRAMME FOR ACCOMPANYING RESEARCH IN INNOVATION (PARI)
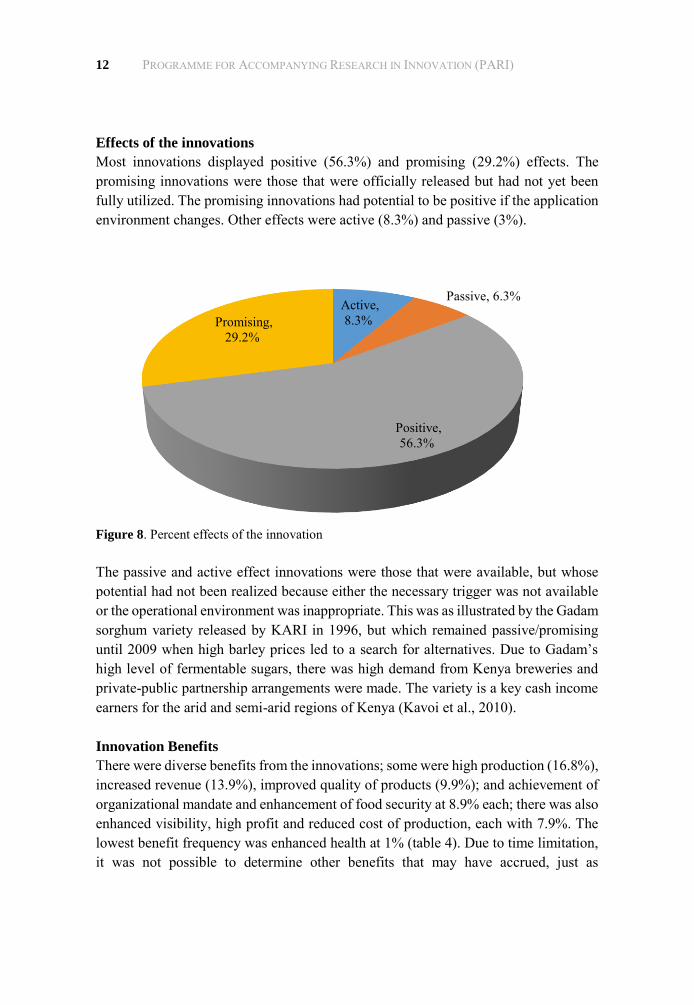
Effects of the innovations
Most innovations displayed positive (56.3%) and promising (29.2%) effects. The promising innovations were those that were officially released but had not yet been fully utilized. The promising innovations had potential to be positive if the application environment changes. Other effects were active (8.3%) and passive (3%).
Figure 8. Percent effects of the innovation The passive and active effect innovations were those that were available, but whose potential had not been realized because either the necessary trigger was not available or the operational environment was inappropriate. This was as illustrated by the Gadam sorghum variety released by KARI in 1996, but which remained passive/promising until 2009 when high barley prices led to a search for alternatives. Due to Gadam’s high level of fermentable sugars, there was high demand from Kenya breweries and private-public partnership arrangements were made. The variety is a key cash income earners for the arid and semi-arid regions of Kenya (Kavoi et al., 2010). Innovation Benefits
There were diverse benefits from the innovations; some were high production (16.8%), increased revenue (13.9%), improved quality of products (9.9%); and achievement of organizational mandate and enhancement of food security at 8.9% each; there was also enhanced visibility, high profit and reduced cost of production, each with 7.9%. The lowest benefit frequency was enhanced health at 1% (table 4). Due to time limitation, it was not possible to determine other benefits that may have accrued, just as
Active, 8.3%
Passive, 6.3%
Positive, 56.3%
Promising, 29.2%

Study 1: Inventory of Agricultural Technological Innovations 13
demonstrated by the use of Gadam sorghum as a food source, as against the original intent as a source of income (Kavoi et al., 2010). Table 4. Benefits of the innovation
Benefits Percent Main Beneficiaries
High productivity 16.8 Farmer Increased revenue 13.9 Farmer Improved quality product 9.9 Product consumer Achieve organizational mandate 8.9 NGOs & private organization research &
learning institution Enhance food security 8.9 National & county government Enhanced visibility 7.9 Research and learning institution High profit 7.9 Market actors, financial & development
organizations Reduced cost of production 7.9 Farmer Empowerment 6.9 Farmer Increased employment 4.0 National & county government Improved management system 3.0 Research & learning institution Reduced risk 3.0 Farmer Enhanced health 1.0 Product consumer
Figure 9. Innovation beneficiaries
Beneficiaries of Innovations
The main beneficiaries of the innovation were farmers. The others are shown in figure 9. The study succeeded in identifying and describing key innovations and their characteristics in Kenya. A total of 43 innovations were identified and described according to type, domain, value chain and stakeholders. Technical innovations were the most dominant types, followed by organizational and institutional innovations. It is noteworthy that the organizational and institutional innovations were minimal across the organizations studied. This is despite the innovation types, perhaps implying that
010203040
Per
cen
tag
e
Beneficiaries
14 PROGRAMME FOR ACCOMPANYING RESEARCH IN INNOVATION (PARI)
an enabling environment must be created for any technical innovation to thrive. As observed by Hawkins et al. (2012), Hounkonnu et al. (2009) and Biggs et al. (1981), there is need for R&D organizations to consider multiple sources of innovations, since technical innovations are applied in specific social and institutional environments. There is therefore the need to be responsive to inputs from non-research actors and, especially, the intended users who have tacit knowledge that can be tapped into through active interaction. Besides, a lot of innovations were in the cropping domain while NRM was among the least domain for the identified innovations. This raises concern, since this is crucial to achieving sustainable production systems (Lal, 2011). The study also revealed a total of 17 triggers, the key one being low productivity, which triggered 15 innovations with 13 of them being technical innovations and two organizational. High yielding varieties constituted 11 out of the 13 innovations. It would be interesting to unpack this trigger in a detailed study, given the fact that low soil fertility could be one of the components and high yielding varieties may not necessarily and adequately address the challenge. The study also identified that innovations were applied at different scales, with the dominant scale being local, followed by national, and then regional. The effects of various innovations also ranged from positive, through promising to passive—this finding provided pointers to areas that warrant further research to define what may be required to move innovations from the lower end of passive to upper end of positive. The study further revealed 11 stakeholder categories across the organizations, as well as their roles and interactions. While time constraint did not allow the study teams to interview any of the stakeholders, it would be interesting to get the stakeholders’ views on their roles in the development of these innovations, since earlier studies (Triomphe 2009; Kamau et al., 2008) have illustrated mixed views of these stakeholders. This is despite the views expressed by the lead organizations that there had been mutual interaction. The major benefits of the innovations for the farmers were high productivity and increased revenue. There were also benefits to NGOs and county governments, who cited the fact that their food security objectives were being met. Research organizations enhanced their visibility, while market actors earned higher profits. A detailed study, in which all actors are interviewed, may be necessary to reveal other benefits not found in the current study. Overall, however, the study laid a foundation on which more detailed studies could be carried out as follow up.

STUDY 02
Inventory and Characterization of
Innovation Platforms
16 PROGRAMME FOR ACCOMPANYING RESEARCH IN INNOVATION (PARI)
INTRODUCTION
A vast majority of the population in sub-Saharan Africa directly or indirectly depend on agriculture for their livelihood, and the sector contributes substantially to the GDP of many countries. The sector creates most of the jobs in Africa, apart from a few countries that rely on oil and other minerals. The total agricultural population stands at 530 million people and is expected to exceed 580 million by 2020, which accounts for 48% of the total African population (World Bank 2006). The sector has continued to absorb a large proportion of the working population, where half of all new entrants to Africa’s working population have turned to agriculture. Overall, the sector accounts for 32% of the Gross Domestic Product (GDP) and provides employment to more than 60-65% of the labour force (Juma, 2011). Specific examples of the contribution of the sector to the GDP include: Ethiopia (47%), Tanzania (43%), Uganda (30%) and Kenya (24%) (Salami et. al., 2010). Despite the key role played by the agricultural sector in Africa, many challenges have continued to confront the sector, and these include: inadequate funding, weak policy and institutional frameworks, barriers to information flow between stakeholders, inefficient production methods, poor post-harvest handling, among others (World Bank, 2006). Therefore, efforts are required towards addressing these challenges for the sector to positively contribute towards poverty reduction, food and nutrition security and reduction of environmental degradation. In addition, attention is required towards changing the focus from area expansion to increase in agricultural productivity per unit area of land. This can be achieved through better and efficient production methods, facilitation of input and output markets, improvement of agricultural policy, as well as strengthening local institutions and viewing agriculture as a knowledge-based entrepreneurial activity (World Bank 2006; Juma, 2011).
A lot of effort has been put in the past to develop and disseminate yield improving technologies. However, the gap between potential yields and on-farm yields has remained wide. This has manifested itself in the form of low quantity and quality of yield, degradation of natural resources, post-harvest yield losses and inadequate nutrition (World Bank, 2006). The progression of approaches used by R&D agencies over the years could be generally grouped into three: linear, participatory and innovation systems-based approaches. The linear transfer of technology approaches were used from the 1950s up to the early 1970s, followed by a shift to the Farming Systems Approach (FSA).in the late 70s and the Participatory Approaches in the 1980s. This later gave way to the Agricultural Knowledge and Information Systems (AKIS) in the 1990s and, in the late 1990s, FARA initiated the IAR4D, with its foundation
Study 2: Inventory and Characterisation of Innovation Platforms 17
being the innovation systems framework (Hawkins et. al., 2009). The reasons for these shifts were the assumptions and gaps in the links between the producer and the intervening agencies (Adekunle et. al., 2012, Nederhlof et. al., 2011). The linear approaches assumed that technologies from the researchers could be channelled to the farmers through extension, while FSA assumed that an understanding of the farmers’ circumstances in a recommendation domain could be used to formulate targeted solutions. Participatory approaches sought to involve the farmers through contractual, consultative, collaborative and collegial arrangements, but failed to consider the institutional environment. Farming systems approach and the participatory approaches emphasized that researchers and farmers are co-creators of new knowledge that was directly relevant to the farmers’ livelihoods, but failed to recognize the institutional challenges and the role of key stakeholders in the agricultural value chains (Biggs et. al., 1990, Adekunle et. al., 2012). This led to the shift to agricultural innovation systems perspective, whose early application was through AKIS and later the IAR4D, which marked the beginning of the shift to innovation platforms as mechanisms to rally stakeholders towards common interest for social learning and interaction (World Bank, 2006, Hawkins et. al., 2010) Innovation platforms have their major point of departure from past approaches in their consideration of institutions and policies as major obstacles to the adoption of improved agricultural practices (Hounkonnou et. al., 2012, Nederholf et. al., 2012). This methodology has increasingly gained currency in agricultural systems for the enhancement of innovation capacity among relevant stakeholders as a key outcome (World Bank, 2006; Kimenye and Mcewan, 2014). A major outcome of the innovation platform is the enhancement of innovation capacity of platform stakeholders which results to the development of technical, social-organizational and institutional innovations. This is a major deviation from past approaches that focused on technologies and ignored the social and institutional environment surrounding the technologies (Hawkins et. al., 2009; Kimenye et. al., 2011; Hounkonnou et. al., 2012). The methodology lays emphasis on innovation as the application of new knowledge and the interactive learning between actors in a social and institutional context for social and economic outcomes (Hounkonnou, et. al., 2012). The platforms enhance learning between stakeholders with a view to improving food and nutrition security, and reducing poverty and environmental degradation. All stakeholders in an innovation platform have relevant codified and tacit knowledge which can only be tapped into and made available to others through interactive learning and joint action (Kimenye et. al., 2011, Hawkins et. al., 2009).

18 PROGRAMME FOR ACCOMPANYING RESEARCH IN INNOVATION (PARI)
The innovation platforms primarily focus on the processes of stakeholder interaction themselves, rather than just on the technology and policy options as outputs. It is these processes rather than the technical results or outputs that are learned and adapted for use in other situations to solve other complex problems. With a view to understanding the status of innovation platforms in Kenya, the BMZ through FARA has supported this PARI study, which is a follow up on the study on innovations in Kenya completed earlier Over the years, the Kenyan government has invested significantly towards the programmes in the public research and development agencies. In the government’s agricultural sector development strategy, the private sector is being encouraged to participate in extension services. Despite all the efforts and resources invested, food and nutrition insecurity, low incomes and quality of life of the population continue to be a challenge. This requires a transformation of agriculture by leveraging on the use of available technical, social-organizational and institutional innovations which emanate from interaction between stakeholders. The innovation platform provides a site for stakeholders to interact and deploy the available innovations, as well as generate more appropriate innovations. Many organizations have embraced the use of innovation platforms in different parts of the country and there is a need to understand the way they are being set up, operated and sustained with a view to drawing lessons and make recommendations on how to strengthen and increase the effectiveness of this methodology. Many projects have been implemented in Kenya and publications have been written, but most of these are stand-alone publications that focus on specific innovation platforms. Additionally, most of the studies have broadly focused on the subject of stakeholder dynamics in various agricultural innovation platforms and value chains. Such studies are such as Kimenye and Mcewann (2011), Nederholf et. al. (2011), ICRISAT discussion paper, Bolo (2010), Hawkins et. al., (2009), Triomphe et. al. (2012) and Kavoi et. al., (2013). All these studies and others have mainly looked at the different innovations and innovation platforms, but none has considered a broad outlook on the innovation platforms of different types, different organizations and different value chains. This study seeks to assess the existing and promising innovation platforms with a view to: (i) identify gaps for research interventions along the specific value chains of interest, and (ii) document information that can be used in the future to identify and explore possibilities of replicating successful innovation platforms in other regions in order to enhance the livelihood of the target communities
Study 2: Inventory and Characterisation of Innovation Platforms 19
METHODOLOGY This is the second part of the PARI project and focuses on the scoping study of existing agricultural innovation platforms (IPs). The project team of seven scientists held several discussions from which they developed a working plan outlining the steps to be followed to implement the study. The steps included: desk top review of secondary sources of information, interviews with relevant stakeholders and members of the various identified innovation platforms, and group discussions and consultations. The team identified the organizations that were likely to know about existing innovation platforms in agriculture and the contact persons for the various innovation platforms. Data collection and reporting of the study was done in October 2015. The main sources of information were secondary (desk top review) and primary data. The primary data were collected from all the innovation platforms whose contacts were available before data collection commenced. There were some IPs whose contacts and their locations were availed when data collection had ended and so were not visited. For secondary data, various documents at the national, regional and international levels were reviewed. The desktop study involved an in-depth review of related literature and up-to-date reports on agricultural innovation platforms. Some of the literature reviewed included: published articles and books, national and international annual and quarterly reports, project reports from governmental and non-governmental organizations (NGOs), faith based organizations (FBOs) and community based organizations (CBOs), media reports, and archives in the respective stakeholder organizations. From the desktop review and group discussions, organizations that had initiated some innovations platforms and various innovation platforms were identified as possible sources of primary data. The organizations identified included the: national research organizations, international research organizations (mainly CGIAR), non-governmental organizations, universities, and the private sector (such as seed companies). Letters, emails and telephone calls were used to contact the identified organizations so as to book appointments with the relevant personnel, and also to obtain contact persons and their contact details for the innovation platforms they had initiated or were involved with. However, we were not able to get appointments with some of the organizations even after having gone there several times and made a number of telephone calls. It is therefore possible that there are some IPs initiated by the organization we were not able to contact which were not captured in this analysis. The literature review and brain storming sessions yielded a list of 27 innovation platforms (Annex 1).
20 PROGRAMME FOR ACCOMPANYING RESEARCH IN INNOVATION (PARI)
Using the information gathered during literature review and brain storming sessions, the team developed a checklist for data collection from various organizations and IPs. The checklist included information on the following aspects that described the innovation platform: • Name of the institution that initiated the IP • Name of the innovation platform • Type of the IP • Physical address of the IP including its GPS coordinates • Main value chain for the IP • Entry point or trigger that started off the innovation platform (main driving force) • Type of the innovation (technological, social, organizational) • Villages participating in the IP • Date of establishment • Actors in the IP and the role of each • How long the IP has been on the ground • Achievements of the IP • Challenges faced • Phase of the IP process (initial, mature, independent)
The team reconstituted itself into two groups of three members each and shared the 27 IPs between them for the purpose of primary data collection. Each group visited the innovation platforms allocated to them in accordance with appointments made earlier. On arrival at the respective IPs, the teams interviewed the relevant contact persons or several members of the IP using the checklist described earlier. Although representatives of all the 27 IPs were interviewed, further scrutiny revealed that some of the 27 supposed IPs were not IPs. Those considered not to be IPs were thus dropped, leaving a total of 15 IPs. Data on the 15 IPs were entered in a software to analyze the qualitative data in preparation for analysis. For the innovation platforms which the research team could not personally visit because information about them arrived late, the checklist was sent to them and the relevant persons were asked to fill in the information and send them back. The filled checklists were however sent back too late after the analysis and were thus not included in the analysis, though they were marked on the map.
The datasets from the 15 IPs were cleaned and edited to ensure that the obvious errors and outliers were corrected. The themes and subthemes for analysis were then identified and qualitative approaches for analysis using RQDA (R qualitative data analysis package). The results were presented using simple tables, cross tabulations and charts.

Study 2: Inventory and Characterisation of Innovation Platforms 21
It was necessary to select from the list of fifteen IPs, three successful and two unsuccessful ones to be used as case studies. In order to objectively select the most successful and the non- successful ones, we developed a criteria for scoring, weighting and then ranking the various IPs. The following steps were followed to do that:
a. Identification of the criteria: Five criteria for ranking were identified and agreed upon as shown in
b. Table 5. c. Each IP was scored against each of the criterion. The score ranged from 0 to 3. d. The five criteria were then weighted based on how important they were for the
success of the IP. The weight ranged from 5 to 1, where a criterion with a score of 5 was most important and a criterion with a score of 1 was least important in determining the success of the IP
e. The scores for each criterion obtained in 2 above were then weighted based on the weight of the criterion to give weighted scores.
f. The weighed scores were summed for each IP and the sum was used to rank the IP, where the IP with the highest score was the most successful and the IP with the lowest score was the least successful
g. The weighted scores, total scores and ranking of the 15 IPs are shown in table 2.
Table 5: Criteria for ranking various innovation platforms
Criteria Explanation
Number of actors active at the same time
The more the number of actors at the same time the higher the score
Process of IP initiation How the IP was formed Proof of sustainability The features put in place to ensure sustainability Achievements (People-centred)
Achievements made that benefitted the various stakeholders
Emerging value chains If the IP has triggered to start of new value chains rather than the initial one. The more the emerging value chains the higher the score
The three highest ranking IPs (Kakamega-FADC, BUSOFIPS and Mbaringo) were chosen as the successful case studies. Even though Mbaringo and QPM Embu had the same score, Mbaringo was picked because it was initiated by a different organization from the organizations who initiated the first two. For the unsuccessful IPs, the four lowest ranking IPs were not the ones picked, because they had not reached the level or age where they could be considered unsuccessful. They were young IPs and so their scores were low because they had not reached the level of some of the criteria used, such as sustainability and people-centred achievements. The next two from the bottom
22 PROGRAMME FOR ACCOMPANYING RESEARCH IN INNOVATION (PARI)
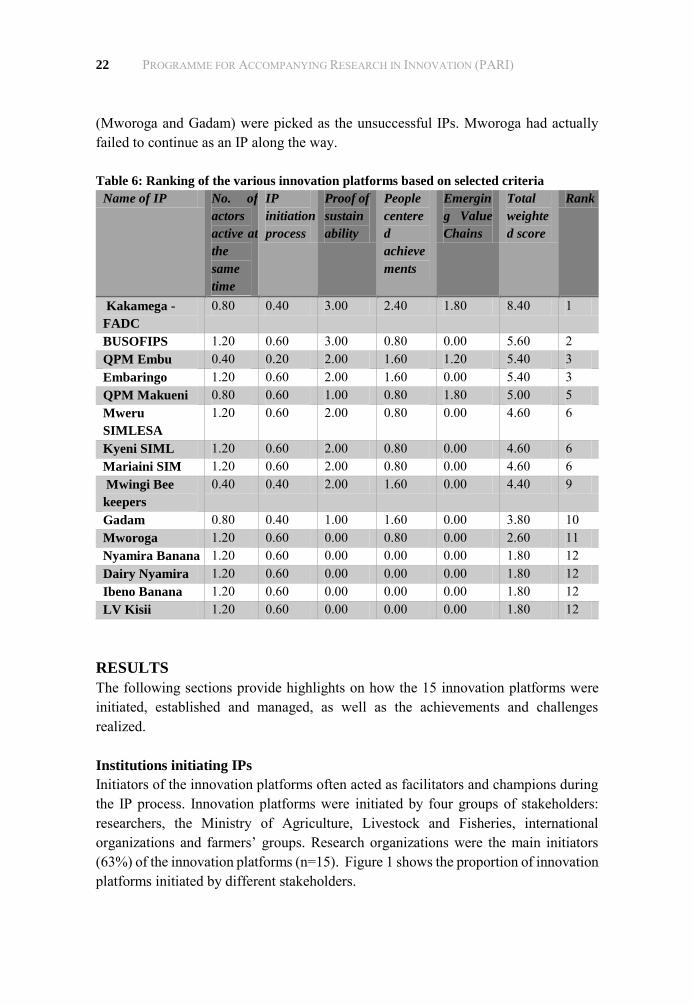
(Mworoga and Gadam) were picked as the unsuccessful IPs. Mworoga had actually failed to continue as an IP along the way. Table 6: Ranking of the various innovation platforms based on selected criteria
Name of IP No. of
actors
active at
the
same
time
IP
initiation
process
Proof of
sustain
ability
People
centere
d
achieve
ments
Emergin
g Value
Chains
Total
weighte
d score
Rank
Kakamega -
FADC
0.80 0.40 3.00 2.40 1.80 8.40 1
BUSOFIPS 1.20 0.60 3.00 0.80 0.00 5.60 2 QPM Embu 0.40 0.20 2.00 1.60 1.20 5.40 3 Embaringo 1.20 0.60 2.00 1.60 0.00 5.40 3 QPM Makueni 0.80 0.60 1.00 0.80 1.80 5.00 5 Mweru
SIMLESA
1.20 0.60 2.00 0.80 0.00 4.60 6
Kyeni SIML 1.20 0.60 2.00 0.80 0.00 4.60 6 Mariaini SIM 1.20 0.60 2.00 0.80 0.00 4.60 6 Mwingi Bee
keepers
0.40 0.40 2.00 1.60 0.00 4.40 9
Gadam 0.80 0.40 1.00 1.60 0.00 3.80 10 Mworoga 1.20 0.60 0.00 0.80 0.00 2.60 11 Nyamira Banana 1.20 0.60 0.00 0.00 0.00 1.80 12 Dairy Nyamira 1.20 0.60 0.00 0.00 0.00 1.80 12 Ibeno Banana 1.20 0.60 0.00 0.00 0.00 1.80 12 LV Kisii 1.20 0.60 0.00 0.00 0.00 1.80 12
RESULTS
The following sections provide highlights on how the 15 innovation platforms were initiated, established and managed, as well as the achievements and challenges realized.
Institutions initiating IPs
Initiators of the innovation platforms often acted as facilitators and champions during the IP process. Innovation platforms were initiated by four groups of stakeholders: researchers, the Ministry of Agriculture, Livestock and Fisheries, international organizations and farmers’ groups. Research organizations were the main initiators (63%) of the innovation platforms (n=15). Figure 1 shows the proportion of innovation platforms initiated by different stakeholders.

Study 2: Inventory and Characterisation of Innovation Platforms 23
Figure 10. Proportion of innovation platforms by different initiators Main value chains in the innovation platforms
Innovation platforms were initiated to address issues/opportunities in both crop- and livestock-based value chains. A majority of the crop-based value chains addressed issues/opportunities in cereals, while the livestock-based value chains addressed issues and opportunities in dairy and honey. Overall (n=15), about one in every three platforms addressed issues on maize-bean value chain (figure 2).
Figure 11. Proportion of innovation platforms by value chains Although some IPs addressed particular value chains, overtime they matured and evolved to address some emerging issues or took advantage of emerging opportunities. Examples of such IPs that evolved include Embu and Makueni QPM, initially meant
Famer Group6% International Org
6%
Nationa Goverment (MoA)
25%National Research Org (KALRO)
63%
05
101520253035
Perc
enta
ge o
f IPs
Main Value chain

24 PROGRAMME FOR ACCOMPANYING RESEARCH IN INNOVATION (PARI)
for maize but took opportunity of the increased maize stover and grain by-products to start dairy, pig and poultry value chains. The “Focal Area Development Committee” innovation platform initially meant for finger millet, now also addresses issues related to poultry, dairy and maize. These evolutions were important given that membership in an IP is dynamic and new interests and opportunities arise in the life of the IP. Table 3 summarizes the value chains and their respective emerging value chains.
Table 7: Emerging value chains
Name of Innovation Platform
Value Chain
Initial Emerged
Embu QPM Maize Pigs and Poultry Makueni QPM Maize Dairy and Poultry Focal Area Development Committee Finger Millet Poultry, Dairy and Maize
Actors in the IP and their roles
Figure 3 shows the distribution of the participation of actors in various innovation platforms. Most of the value chain actors undertook critical functions in the value chain, such as supply of innovations and other facilitating inputs, processing, and access of actors to finances. Research organizations, county governments and farmers’ groups were dominant in at least 10 of the 15 innovation platforms.
Figure 12. Participation of various actors in innovation platforms The various actors played different roles which were not necessarily mutually exclusive. For instance, funding of innovation platforms was undertaken by non-
02468
10121416
Nu
mb
er o
f IP
Actor
Actors of the IPs

Study 2: Inventory and Characterisation of Innovation Platforms 25
government organizations (NGOs), national and county governments, international organizations and farmers’ groups (table 4). Table 8. Actors of the innovation platforms and their roles
Actors Roles of the actors
County Government (MOA) Capacity building Mobilizing and organizing farmers Providing market for products Technical support Farmers’ Group Initiating the IP Funding Training of Trainers Production of commodity (value chain) Financial Institutions Promotion of financial products to farmers Provision of credit facilities Input Suppliers Supply of inputs for production Promotion of products to farmers International Organizations Funding Initiating the IP Learning Institution Technical support National Government (MoA) Funding Initiating the IP Non-Governmental Organizations
Funding
Capacity building Mobilizing and organizing farmers Technical support Processing Providing ready market by buying produce from farmers Research Organizations Capacity building Technical support Funding Initiating the IP Seed Companies Supply seeds for demonstration
Figure 4 shows that most of the actors in the IP undertake more than one role. Overall, funding, technical support and capacity building, and mobilizing and organizing farmers were the predominant roles undertaken by the various value chains. Research organizations (KALRO) were involved in the initiation of most IPs, while international

26 PROGRAMME FOR ACCOMPANYING RESEARCH IN INNOVATION (PARI)
organization predominantly undertook funding of the IPs. Farmers’ groups mainly provided funds and production activities of the various value chains.
Figure 13. Intensity of roles of actors in innovation platforms Entry points for the IP
There were several triggers for initiating various platforms (figure 4). These triggers formed the entry points for starting the IPs. Broadly, the triggers aimed at improving household food security, household income and natural resource conservation. One in every three platforms were triggered by poor marketing environment. Other notable triggers included: low productivity and degradation of the natural resource, low productivity and need for alternative food sources. In 13% of the cases, availability of a ready market (an opportunity) was the main trigger.
0
2
4
6
8
10
12
Nu
mb
er o
f Ip
s
Actors in the IP
Capacity Building Credit FacilityFunding Initiating the IPMobilizing & Organizing Farmers Production of ValueChainPromotion of Products to Farmers Providing MarketProvision of Credit Facilities Supply Input Materials

Study 2: Inventory and Characterisation of Innovation Platforms 27
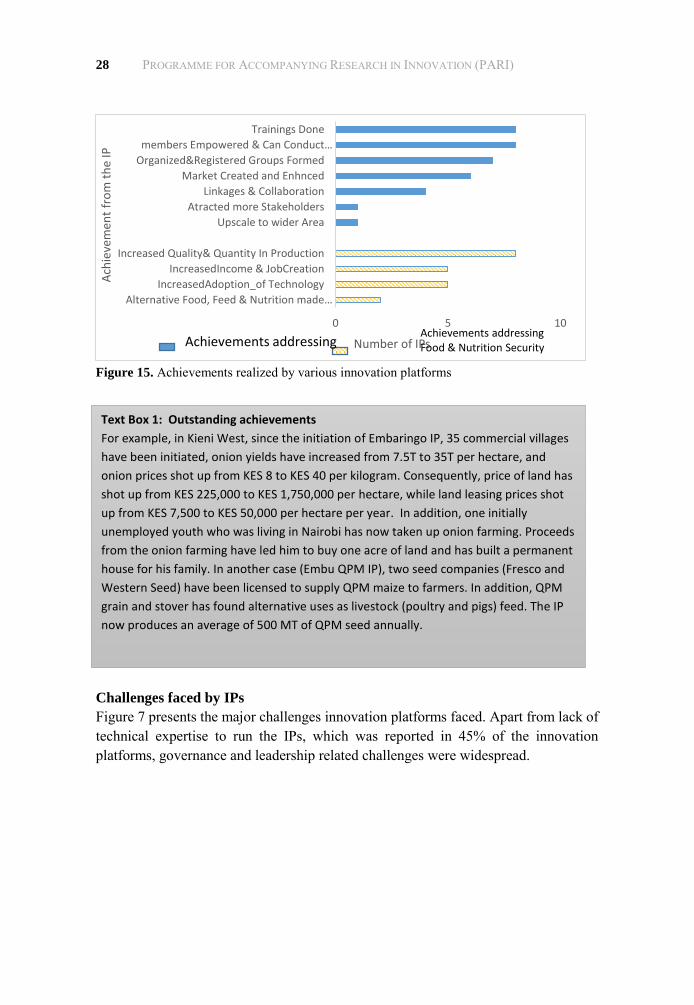
Figure 14. Triggers for initiating Innovation Platforms Achievements realized by the innovation platforms
The IPs (both technical and organizational) realized several achievements (figure 6). Most of the achievements realized by the organizational type innovation platforms focused mainly on sustainability of the IPs, while the technical type innovation platforms focused mainly on food security and nutrition of the actors. Among the main organizational achievements realized were: training of farmers; empowerment of farmers to undertake production and marketing activities independently, and access of farmers to collectively access input and product markets at negotiated prices. In addition, the linkage of the farmers with other actors was enhanced. Resulting from the enhanced adoption of technological innovations, the quantity and quality of agricultural production has increased, leading to increased food and nutrition security, household income and job creation.
Alternative food & Nutritions; 13%
Low Productivity and Degradation
of Natural Resource; 13%
Available Market ; 13%
Low productivity; 20%
Poor Marketing Enviroment; 34%
Poor Quality Input; 7%
28 PROGRAMME FOR ACCOMPANYING RESEARCH IN INNOVATION (PARI)
Figure 15. Achievements realized by various innovation platforms
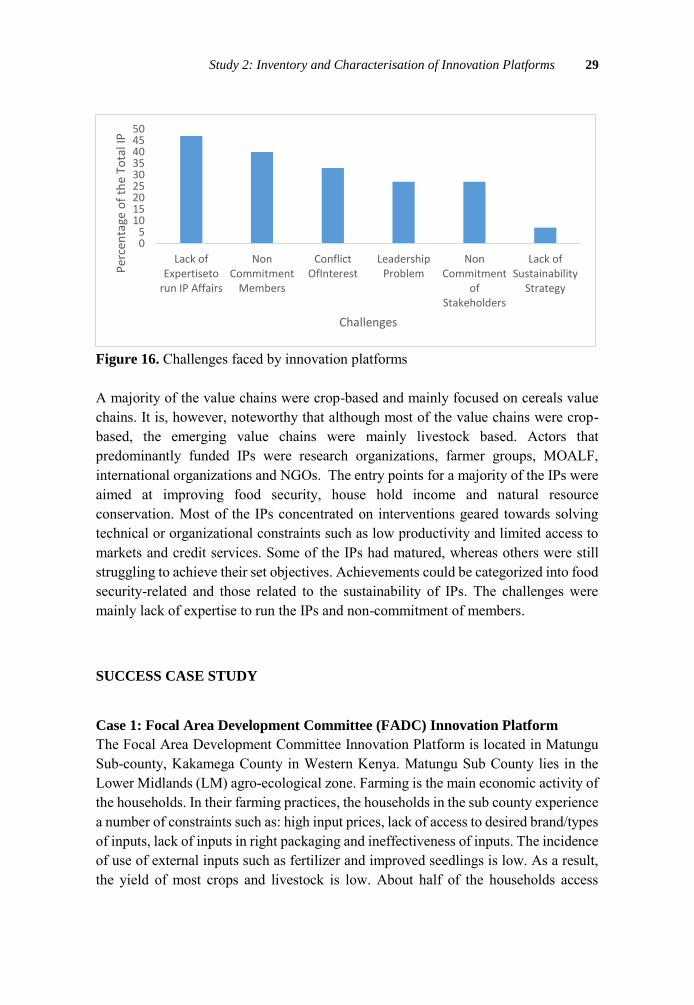
Challenges faced by IPs
Figure 7 presents the major challenges innovation platforms faced. Apart from lack of technical expertise to run the IPs, which was reported in 45% of the innovation platforms, governance and leadership related challenges were widespread.
0 5 10
Alternative Food, Feed & Nutrition made…
IncreasedAdoption_of Technology
IncreasedIncome & JobCreation
Increased Quality& Quantity In Production
Upscale to wider Area
Atracted more Stakeholders
Linkages & Collaboration
Market Created and Enhnced
Organized&Registered Groups Formed
members Empowered & Can Conduct…
Trainings Done
Number of IPs
Ach
ieve
men
t fr
om
th
e IP
Achievements addressingAchievements addressingFood & Nutrition Security
Text Box 1: Outstanding achievements
For example, in Kieni West, since the initiation of Embaringo IP, 35 commercial villages
have been initiated, onion yields have increased from 7.5T to 35T per hectare, and
onion prices shot up from KES 8 to KES 40 per kilogram. Consequently, price of land has
shot up from KES 225,000 to KES 1,750,000 per hectare, while land leasing prices shot
up from KES 7,500 to KES 50,000 per hectare per year. In addition, one initially
unemployed youth who was living in Nairobi has now taken up onion farming. Proceeds
from the onion farming have led him to buy one acre of land and has built a permanent
house for his family. In another case (Embu QPM IP), two seed companies (Fresco and
Western Seed) have been licensed to supply QPM maize to farmers. In addition, QPM
grain and stover has found alternative uses as livestock (poultry and pigs) feed. The IP
now produces an average of 500 MT of QPM seed annually.
Study 2: Inventory and Characterisation of Innovation Platforms 29
Figure 16. Challenges faced by innovation platforms
A majority of the value chains were crop-based and mainly focused on cereals value chains. It is, however, noteworthy that although most of the value chains were crop-based, the emerging value chains were mainly livestock based. Actors that predominantly funded IPs were research organizations, farmer groups, MOALF, international organizations and NGOs. The entry points for a majority of the IPs were aimed at improving food security, house hold income and natural resource conservation. Most of the IPs concentrated on interventions geared towards solving technical or organizational constraints such as low productivity and limited access to markets and credit services. Some of the IPs had matured, whereas others were still struggling to achieve their set objectives. Achievements could be categorized into food security-related and those related to the sustainability of IPs. The challenges were mainly lack of expertise to run the IPs and non-commitment of members.
SUCCESS CASE STUDY
Case 1: Focal Area Development Committee (FADC) Innovation Platform
The Focal Area Development Committee Innovation Platform is located in Matungu Sub-county, Kakamega County in Western Kenya. Matungu Sub County lies in the Lower Midlands (LM) agro-ecological zone. Farming is the main economic activity of the households. In their farming practices, the households in the sub county experience a number of constraints such as: high input prices, lack of access to desired brand/types of inputs, lack of inputs in right packaging and ineffectiveness of inputs. The incidence of use of external inputs such as fertilizer and improved seedlings is low. As a result, the yield of most crops and livestock is low. About half of the households access
05
101520253035404550
Lack ofExpertiseto
run IP Affairs
NonCommitment
Members
ConflictOfInterest
LeadershipProblem
NonCommitment
ofStakeholders
Lack ofSustainability
Strategy
Per
cen
tage
of
the
Tota
l IP
Challenges

30 PROGRAMME FOR ACCOMPANYING RESEARCH IN INNOVATION (PARI)
agriculture-related services from public providers. Generally, market information, value addition technologies, formal saving and agricultural credit are low, with only 14% of male-headed households, 3% of female-headed households and 4% of youth- headed households accessing credit. In an effort to reach more farmers with agricultural production technologies and information, the Ministry of Agriculture, Livestock and Fisheries, under the National Agricultural and Livestock Extension Program (NALEP), started using the group approach to extension services. IP Characterization
The Focal Area Development Committee Innovation Platform (IP) was initiated in 2007 by the Ministry of Agriculture, Livestock and Fisheries, under the National Agricultural and Livestock Extension Program (NALEP). As mentioned in the introduction, NALEP started using the group approach to offer extension services so that many farmers could be reached. For any given location, they would start by training many farmers over a period of two years (two to three times a week). At the end of the training, the farmers who were apt at learning and had better understood the teachings were selected and placed in groups called the Focal Area Development Committee (FADC). Each FADC was to represent a location (administrative unit) and acted as a link between the Ministry of Agriculture, Livestock and Fisheries and the farmers. The Focal Area Development Committee Innovation Platform started off as of such groups. The group would be exposed to various technologies and ideas, and they in turn train other farmers. The group also organized demonstrations and field days which was facilitated by the Ministry of Agriculture, Livestock and Fisheries. At those initial stages the demonstrations and field days were funded by the Ministry of Agriculture, Livestock and Fisheries. The FADC innovation platform was triggered by the need to increase agricultural productivity and income for the members, and also to exploit the ready market for finger millet. FADC Matungu organized a field day under the National Agricultural and Livestock Extension Program, where the Kenya Agricultural and Livestock Research Organization (KALRO) attended and presented the idea of growing finger millet. The group picked up the idea because, at that time, the production of finger millet was very low in the area and there was an available market; which meant if they produced they could set their own price and earn high income from the crop. They therefore, as FADC IP, started growing finger millet as their entry point to increase their income levels. The production of finger millet in the area was almost nil at that time and, by growing finger millet, following the agronomic practices recommended by KALRO, they recorded high yields.
Study 2: Inventory and Characterisation of Innovation Platforms 31
The main actors at the initiation and establishment stages were the Ministry of Agriculture, Livestock and Fisheries (MOALF), FADC and farmers, and Kenya Agricultural and livestock Research Organization. The MOALF trained the members on good husbandry practices for both crops and livestock, and helped the team organize themselves into a group. The group finally transformed themselves into an IP, and started off by organizing demonstrations and field days and mobilizing farmers as their main role. The demonstrations and fields days were facilitated by the MOALF staff. They (FADC) also practiced what they learned (mainly general crop and livestock husbandry practices) on their farms. The role of the rest of the farmers was implementation of the lessons learned on their farms. The Kenya Agricultural and Livestock Research Organization introduced the idea of growing finger millet and trained the farmers on the agronomic practices and value addition. The Kenya Agricultural and Livestock Research Organization also bought inputs (fertilizer and seed) on credit for the farmers, which was returned either in kind (finger millet) or in cash. In addition, KALRO organized various meetings and workshops where various stakeholders along the finger millet value chain including FADC, farmers, millers, market information providers and value addition specialist and processors exchanged information and took advantage of the exciting opportunities such as available markets. A number of other stakeholders like the Kenya Agricultural Commodity Exchange (KACE), came on board, who provided information on the demand for various commodities in different markets, including the prices offered. Women groups joined in the production of finger millet, and also did value addition to come up with products such as finger millet crackers, cakes and biscuits. Other players were Unga Limited (a milling company), who bought the finger millet for milling. As the IP grew, the FADC members started contributing money every month to enable them run the IP and plan and support their own activities. They then attracted and/or invited other actors such as banks, who gave credit at negotiated interest rates and input suppliers from whom they bought inputs at negotiated prices. Others such as seed companies contracted the group to produce seed maize, which was inspected by the Kenya Plant Health Inspectorate Services (KEPHIS). The seed production contract earned them a profit of Ksh 300,000. They also wrote a proposal and submitted to Njaa Marufuku, which was funded (Ksh. 120,000). They continued to organize demonstrations and field days and invite the MOALF and KALRO to facilitate. They also acted as a link through which various organizations demonstrate and promote their products and services
The central players of the IP are the 16 members of FADC. They act a link between the farmers and various other actors, including the MOALF, KALRO, input providers
32 PROGRAMME FOR ACCOMPANYING RESEARCH IN INNOVATION (PARI)
and credit suppliers and the produce markets. They organize and call for stakeholder meetings such as demonstrations and field days and invite relevant stakeholders as the need arises. They organize for joint collective marketing of the produce and acquisition of inputs. They in addition go out to obtain new ideas and technologies and expose other farmers to them. They have come up with several technical innovations by modifying the existing recommendations. Some of the FADC members have been sponsored by KALRO and MOALF to interact with members of other IPs and farmers outside of Kenya.
At the initial stages, the activities of the IP were mainly limited to the adoption of improved agricultural production technologies (both crops and livestock). They then introduced finger millet, which became the main value chain of the IP. With finger millet, many activities emerged. The women groups started value addition of finger millet to make cakes, biscuits, cakes and crackers, which increased the value of finger millet. A major activity of the IP was marketing. The group pooled the finger millet produce and looked for markets and negotiated the price. In the early years of the IP, they sold the finger millet at a very high price of Ksh. 200 per kg. Although the price is now lower than the initial one, it is still above average. They also collectively negotiated the price of inputs so that they could buy at a lower price. Currently, the IP uses the funds saved to collectively buy fertilizer, and the members refund later. With the increased utilization of finger millet, the members realized that there was a lot of stover and grain, and so they started dairy and poultry farming, where they are the main source of feed.
Sustainability of the IP
The role played by the initiator and subsequent initial funders has slowly reduced, and the IP has continued to find alternative ways of funding its activities. The role of organizing activities and exposures has also moved from the initiators, and FADC has now reached a point where they are fully organizing their activities. They call in and/or consult the MOALF and KALRO as the need arises. The sustainability measures that the IP has put in place include the diversification of the value chains, where they started with the finger millet, but have expanded to dairy, poultry, maize, bananas and horticultural crops (such as pumpkin and water melon). Members contribute money to run the IP and they also write proposals and obtain funds. In addition, they liaise with financial organizations and negotiate interest friendly loans. The training they received has helped them to be more knowledgeable and to think intelligently. They are contracted by seed companies for maize seed production.
Study 2: Inventory and Characterisation of Innovation Platforms 33
Achievements
Increased income earnings: members have purchased various items such as land, cattle, machines for making livestock feed, and are able to send their children to better schools. One of the members sponsored his wife for university education
They have organized for collective marketing of the produce where they negotiate the price, and so get a higher price
They are raising funds through various means (member contributions, proposal writing, obtaining interest friendly loans, getting contracts, e.g., for seed production)
Each member has at least one other activity/value chain besides the finger millet they started with
Collective purchasing of fertilizer and other inputs at negotiated prices Production of finger millet has greatly increased, from a yield of less than
100kg per ha to 2 -3 tons per hectare. They provided a fora for other organization to market their products, e.g., seed
companies They have joined with three other IPs from three different counties (Bungoma,
Busia and Siaya) and formed an umbrella organization, “Magharibi Kilimo Biashara,” represented by four counties, where they share ideas and push forward their agenda on marketing, production and ways of raising funds.
They have attracted an investor (NIRAF) who is currently putting up a factory for milling finger millet and is targeting the umbrella organization “Magharibi Kilimo Biashara” as the main suppliers of the raw finger millet
Challenges
The group faces leadership challenges, where some of the leaders are not committed. They are also facing marketing challenges for finger millet, because the finger millet production has greatly increased. They also have financing challenges, what they are able to raise is not sufficient. The FADC members who are the central players of the IP seem to be quick to learn and are very enterprising. It is notable that they have reached out and joined other IPs in three other counties and formed a larger organization, the Magharibi Kilimo Biashara (which means “Western Business Farming”). This should add to the sustainability of the IP, as they have widened their interactions and sources of ideas. As already noted, this umbrella group has attracted a processor, who is putting up a milling company targeting the umbrella organization as the main supplier of the finger millet. It is also notable that they use the funds from their kitty to train and encourage other farmers in the sub-location and other areas to adopt innovative technologies. They are also able to write proposals and source for

34 PROGRAMME FOR ACCOMPANYING RESEARCH IN INNOVATION (PARI)
funds. This is a group that with a little facilitation in terms of funding, technical and organization ideas can be used by the national and county governments to encourage entrepreneurship in farmers and to pass on extension messages. The group, though it was formed to be used by the Ministry of Agriculture, Livestock and Fisheries for extension purposes, has translated itself into a formidable and successful innovation platform. They organize and spearhead their own activities and find innovative ways of raising funds. They bring in relevant players as the need arises and take hold of opportunities as they come. They have increased the number of value chains they are involved in and they go out of their way to link up with like-minded IPs in other counties so as to achieve their objectives. The Magharibi Kilimo Biashara that they jointly formed with other IPs is an impressive idea. This IP should be supported financially by exposing them to various possible sources of funds, as well as extra training and exposure to new agricultural ideas and leadership and management, as that will not just benefit themselves but the larger community. The national and county governments, as well as other development organizations should link up and help this IP grow further and also use the IP to reach other farmers.
Case 2: Domestic Horticultural Markets for Kieni East and West Sub-counties:
A case of embargo innovation platform
Nyeri County is located in the central region of the country. It covers an area of 2,475.4 km2. It borders Laikipia County to the north, Kirinyaga County to the east, Murang’a County to the south, Nyandarua County to the west and Meru County to the North East. Agriculture is the backbone of the county’s economy. It is the major source of employment and income generation for the farmers, youths and other players in the agricultural value chains. The main food crops grown in the county are maize, beans, Irish potatoes and vegetables. The major cash crops are coffee, tea, horticulture and cut flowers. Livestock is also a major farming activity, with dairy cattle, poultry, pigs, goats and sheep as the major livestock kept. The main challenges facing the agricultural sector in the county include: inadequate rainfall, inaccessibility to credit facilities, and undeveloped marketing systems. Kieni East Sub-county and Kieni West Sub-county are known for production of horticultural crops such as onions, potato, and tomato. Before Farm Concern International set foot in these sub-counties, farming in this area was subsistence-oriented. Crop yields were low, partly due to poor quality seed and famine relief was the norm. Despite the availability of markets, farmers disposed of their produce individually to brokers who dictated the prices. Farm Concern International (an international NGO) identified these gaps and, in 2010, a project was initiated with the main purpose of linking farmers to access markets and to introduce hybrid varieties. This was in line with the core mandate of the NGO, which includes: a) Spearheading
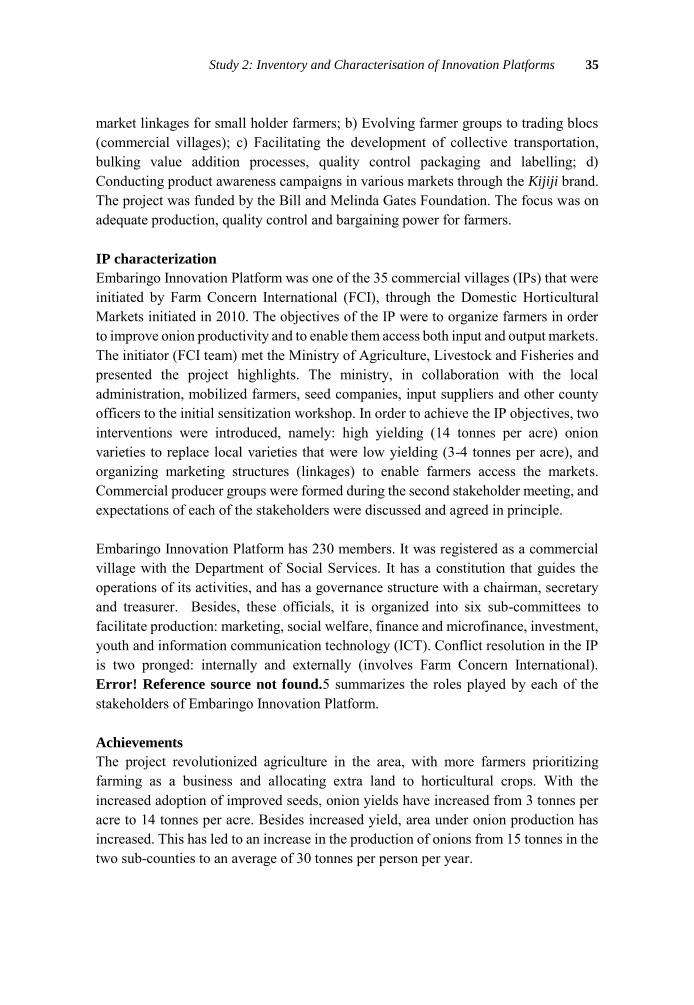
Study 2: Inventory and Characterisation of Innovation Platforms 35
market linkages for small holder farmers; b) Evolving farmer groups to trading blocs (commercial villages); c) Facilitating the development of collective transportation, bulking value addition processes, quality control packaging and labelling; d) Conducting product awareness campaigns in various markets through the Kijiji brand. The project was funded by the Bill and Melinda Gates Foundation. The focus was on adequate production, quality control and bargaining power for farmers.
IP characterization
Embaringo Innovation Platform was one of the 35 commercial villages (IPs) that were initiated by Farm Concern International (FCI), through the Domestic Horticultural Markets initiated in 2010. The objectives of the IP were to organize farmers in order to improve onion productivity and to enable them access both input and output markets. The initiator (FCI team) met the Ministry of Agriculture, Livestock and Fisheries and presented the project highlights. The ministry, in collaboration with the local administration, mobilized farmers, seed companies, input suppliers and other county officers to the initial sensitization workshop. In order to achieve the IP objectives, two interventions were introduced, namely: high yielding (14 tonnes per acre) onion varieties to replace local varieties that were low yielding (3-4 tonnes per acre), and organizing marketing structures (linkages) to enable farmers access the markets. Commercial producer groups were formed during the second stakeholder meeting, and expectations of each of the stakeholders were discussed and agreed in principle.
Embaringo Innovation Platform has 230 members. It was registered as a commercial village with the Department of Social Services. It has a constitution that guides the operations of its activities, and has a governance structure with a chairman, secretary and treasurer. Besides, these officials, it is organized into six sub-committees to facilitate production: marketing, social welfare, finance and microfinance, investment, youth and information communication technology (ICT). Conflict resolution in the IP is two pronged: internally and externally (involves Farm Concern International). Error! Reference source not found.5 summarizes the roles played by each of the stakeholders of Embaringo Innovation Platform. Achievements
The project revolutionized agriculture in the area, with more farmers prioritizing farming as a business and allocating extra land to horticultural crops. With the increased adoption of improved seeds, onion yields have increased from 3 tonnes per acre to 14 tonnes per acre. Besides increased yield, area under onion production has increased. This has led to an increase in the production of onions from 15 tonnes in the two sub-counties to an average of 30 tonnes per person per year.
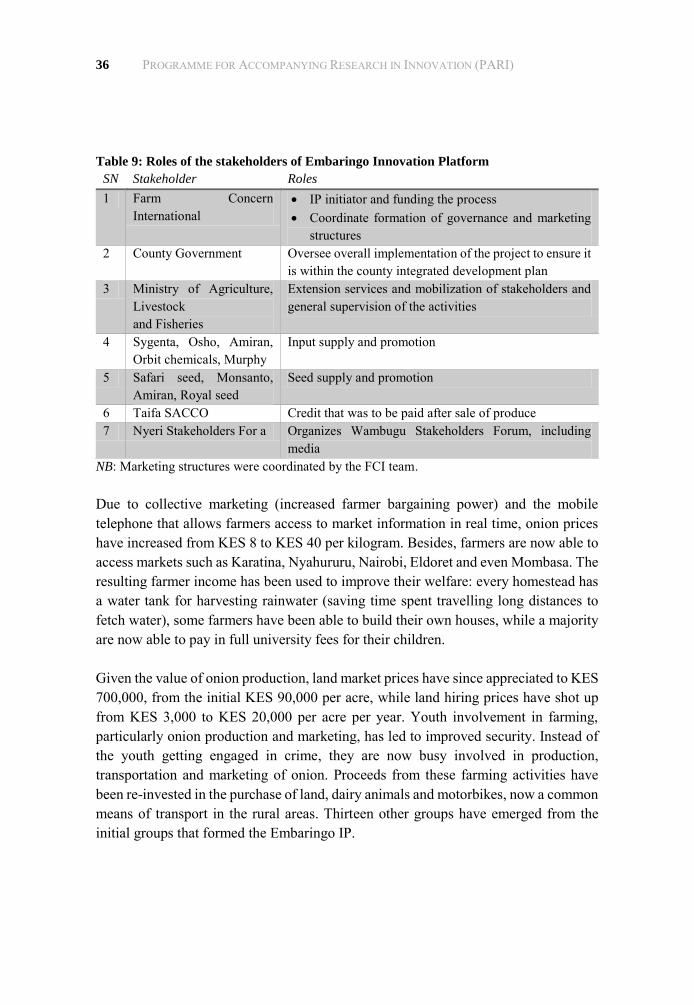
36 PROGRAMME FOR ACCOMPANYING RESEARCH IN INNOVATION (PARI)
Table 9: Roles of the stakeholders of Embaringo Innovation Platform
SN Stakeholder Roles
1 Farm Concern International
IP initiator and funding the process Coordinate formation of governance and marketing
structures 2 County Government Oversee overall implementation of the project to ensure it
is within the county integrated development plan 3 Ministry of Agriculture,
Livestock and Fisheries
Extension services and mobilization of stakeholders and general supervision of the activities
4 Sygenta, Osho, Amiran, Orbit chemicals, Murphy
Input supply and promotion
5 Safari seed, Monsanto, Amiran, Royal seed
Seed supply and promotion
6 Taifa SACCO Credit that was to be paid after sale of produce 7 Nyeri Stakeholders For a Organizes Wambugu Stakeholders Forum, including
media NB: Marketing structures were coordinated by the FCI team.
Due to collective marketing (increased farmer bargaining power) and the mobile telephone that allows farmers access to market information in real time, onion prices have increased from KES 8 to KES 40 per kilogram. Besides, farmers are now able to access markets such as Karatina, Nyahururu, Nairobi, Eldoret and even Mombasa. The resulting farmer income has been used to improve their welfare: every homestead has a water tank for harvesting rainwater (saving time spent travelling long distances to fetch water), some farmers have been able to build their own houses, while a majority are now able to pay in full university fees for their children. Given the value of onion production, land market prices have since appreciated to KES 700,000, from the initial KES 90,000 per acre, while land hiring prices have shot up from KES 3,000 to KES 20,000 per acre per year. Youth involvement in farming, particularly onion production and marketing, has led to improved security. Instead of the youth getting engaged in crime, they are now busy involved in production, transportation and marketing of onion. Proceeds from these farming activities have been re-invested in the purchase of land, dairy animals and motorbikes, now a common means of transport in the rural areas. Thirteen other groups have emerged from the initial groups that formed the Embaringo IP.
Study 2: Inventory and Characterisation of Innovation Platforms 37
Challenges
The negative effects of climate change (unpredictable rainfall patterns and intensities) and low adoption of water harvesting technologies are a major challenge to farmers in this area, as they rely on rain-fed agriculture. Other challenges include: farm produce spoilage and reduced quality due to poor feeder roads, and labour shortage due to expansion in area under onion production.
Sustainability
This IP has several features that will contribute to its sustainability, key among them are:
Farm Concern international has linked the IP farmers to other stakeholders such as input suppliers. The farmers’ bargaining power has been enhanced; hence they buy inputs at relatively lower prices and sell products at relatively higher prices, enhancing their profits.
The Embaringo IP has links with other IPs to form a company, The African Farms and Markets (AFMA), which allows for collective supply of inputs.
IP has conflict resolution mechanisms and members have been trained on governance and crisis management.
The IP has constructed food stores to serve as bulk onion collection centres and also cater for surplus production, thus moderating price fluctuations.
The IP has invested in machinery and also operates a bank account. Increasing number of youth participating in the IP either as producers,
transporters or marketers.
The IP is successful given the many actors that play their roles and the benefits it has given its members: increased productivity, group cohesion and governance. The group benefitted greatly from the initiator.
Case 3: Bungoma South Farmers Innovation Platform SIMLESA (BUSOFIPS)
Agriculture is the major occupation and source of income that drives the Bungoma County’s economy. It is the main source of household food and provides raw materials to agro-based industries. Bungoma County is the fourth largest producer of maize and beans after Trans Nzoia, Uasin Gishu and Nakuru Counties. About 60% of the population live below the poverty line, which is higher than the national average (45.2% in 2009). Over-reliance on rainfall exposes the producers to the impacts of climate change. Rainfall and temperature fluctuations lead to increased incidence and emergence of new pests and diseases, which in turn lead to low crop yields and post-harvest losses. Some of the other major challenges to agricultural production in the county are: limited access to farm inputs (such as certified seeds and fertilizer) as a
38 PROGRAMME FOR ACCOMPANYING RESEARCH IN INNOVATION (PARI)
result of poor infrastructure and distribution network, inadequate extension services due to a high farmer to staff ratio, cultivation on steep slopes and encroachment into forests leading to catchment degradation and soil erosion, and poor market access. Also, the extension personnel lack access to emerging knowledge on modern farming practices. The Bungoma South Farmers Innovation Platform SIMLESA (BUSOFIPS) was established in 2012 as part of the Sustainable Intensification of Maize-Legume Systems for Food Security in Eastern and Southern Africa (SIMLESA) project, in collaboration with the Kenya Agricultural Research Institute (KALRO). The main aim of the innovation platform is to assist farmers in Bungoma County of western Kenya, a region with low agricultural productivity, to access good agricultural practices and increase their productivity. Information from SIMLESA’s innovation platforms has helped farmers to improve their seed and farming technologies, such as conservation agriculture and intercropping, and use of herbicides to control weeds. The farmers have now realized better harvests, a greater variety of food crops on their farms and healthier cattle, enabling them to provide for the basic needs of their families. IP Characterization
The innovation platform is both technical and organizational, whose entry point was low productivity and soil degradation. The main objectives of establishing the IP were:
To bring together stakeholders working on maize and legumes To promote conservation agriculture technology to increase production and
reduce food insecurity. The villages participating in the IP include: Mayanja, Kibabii, Bukembe, East Bukusu and Musikoma. The main stakeholders in the IP include: KALRO, MOALF, farmers, Kenya Seed Company, Seedco, Panar, Western Seed Company, input suppliers, NGO, CBOs, financial institutions, processors and marketing agents. Table 7 provides information on the initiator, other stakeholders and their roles. The stakeholders include most of the important actors in the maize value chain. Their major roles are: capacity building (farmer empowerment), promotion, advice and linkages to credit and markets. Apart from the provision of funding, the initiator provided technology promotion and advisory services. The majority of the beneficiary stakeholders provided limited funding in the form of registration and subscription fee from individual members (KES 200), CBOs (KES 500) and participating institutions/organizations (KES 1,000). To ensure accountability, receipts are issued once payments are made.
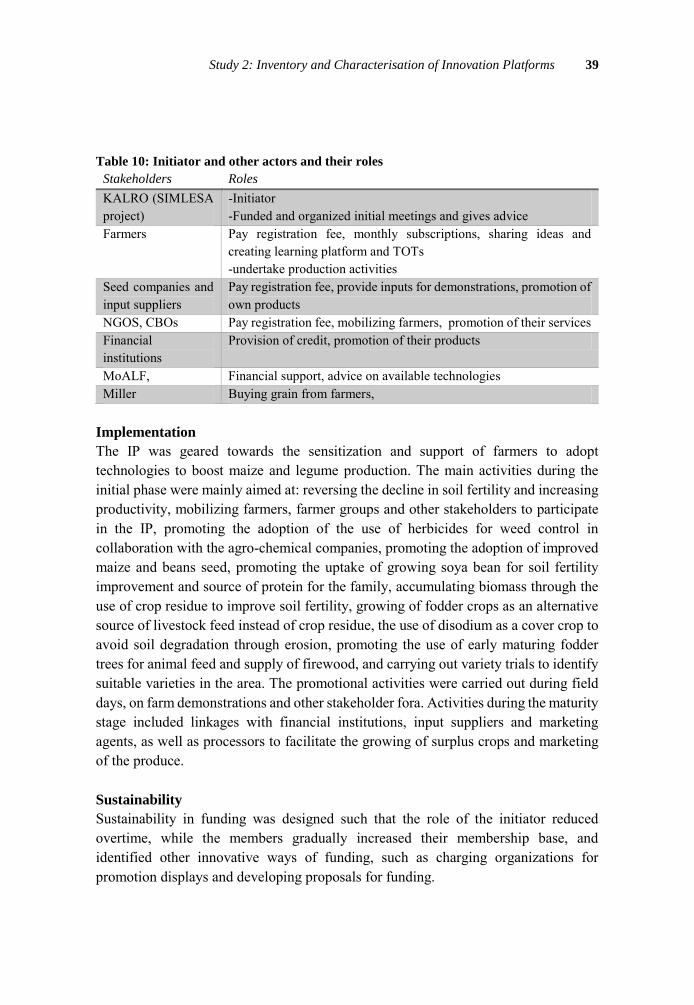
Study 2: Inventory and Characterisation of Innovation Platforms 39
Table 10: Initiator and other actors and their roles
Stakeholders Roles
KALRO (SIMLESA project)
-Initiator -Funded and organized initial meetings and gives advice
Farmers Pay registration fee, monthly subscriptions, sharing ideas and creating learning platform and TOTs -undertake production activities
Seed companies and input suppliers
Pay registration fee, provide inputs for demonstrations, promotion of own products
NGOS, CBOs Pay registration fee, mobilizing farmers, promotion of their services Financial institutions
Provision of credit, promotion of their products
MoALF, Financial support, advice on available technologies Miller Buying grain from farmers,
Implementation
The IP was geared towards the sensitization and support of farmers to adopt technologies to boost maize and legume production. The main activities during the initial phase were mainly aimed at: reversing the decline in soil fertility and increasing productivity, mobilizing farmers, farmer groups and other stakeholders to participate in the IP, promoting the adoption of the use of herbicides for weed control in collaboration with the agro-chemical companies, promoting the adoption of improved maize and beans seed, promoting the uptake of growing soya bean for soil fertility improvement and source of protein for the family, accumulating biomass through the use of crop residue to improve soil fertility, growing of fodder crops as an alternative source of livestock feed instead of crop residue, the use of disodium as a cover crop to avoid soil degradation through erosion, promoting the use of early maturing fodder trees for animal feed and supply of firewood, and carrying out variety trials to identify suitable varieties in the area. The promotional activities were carried out during field days, on farm demonstrations and other stakeholder fora. Activities during the maturity stage included linkages with financial institutions, input suppliers and marketing agents, as well as processors to facilitate the growing of surplus crops and marketing of the produce. Sustainability
Sustainability in funding was designed such that the role of the initiator reduced overtime, while the members gradually increased their membership base, and identified other innovative ways of funding, such as charging organizations for promotion displays and developing proposals for funding.

40 PROGRAMME FOR ACCOMPANYING RESEARCH IN INNOVATION (PARI)
Achievements
The IP has graduated from the initial phase and is gradually moving towards the maturity phase. The following are some of the achievements which have also contributed to the sustainability of the IP: Registration of the IP and its promotion has attracted recognition by the county
government Yield increase from 1.8 to 3.6 MT per hectare for maize, and from 0.2 to 1.1 MT
per hectare for beans More farmers have taken up conservation agriculture technologies (herbicides,
crop residues left on farm, cover crops, and fodder crops.) The IP developed and submitted a proposal to the Agricultural Sector
Development Support Programme (ASDSP), which was funded The IP organizes demonstrations and field days and invites various stakeholders
to participate The IP has established linkages to buyers of produce and input suppliers. The
forum is used by other institutions to demonstrate and promote their products and services
The IP now produces surplus food for the market.
Challenges
Despite the IP making great progress during the initial phase and early maturity phase, a number of challenges persist. These challenges arise from both internal and external factors, which in turn threaten the continual sustainability of the IP. One of the serious challenge is the IP leadership problem, arising from the fact that the chair of the IP, the MOALF representative, who due to transfers is not always the same person. Occasionally, the new person that comes in does not have the vision of the IP at heart. Other challenges include but not limited to: Non-commitment of members in resource mobilization and implementation of
agreed actions Limited funds Limited technical expertise Unfavourable weather arising from climate change Pests and diseases Poor accessibility of raw materials (have to travel long distances to acquire raw
material for processing activities)

Study 2: Inventory and Characterisation of Innovation Platforms 41
The salient features of this IP that may explain its success include: establishment of the IP in an area where there was a need to address issues affecting a priority value chain, ensuring that all stakeholders were represented (including key value chain actors and enablers), instituting capacity building for all stakeholders and ensuring sustainability through exit strategy. The key lessons learnt from the operationalization and success of the IP are: Ensuring timely availability of seed and other supporting technologies like CA
and herbicides by involving the relevant input companies and specialists/extension personnel made the IP more sustainable.
Establishment of strong linkages to the market to ensure that there was a ready market for surplus output ensured a continued demand for technologies and a drive to produce more.
An IP addressing a local need and not imposed on stakeholders by ensuring awareness and capacity building is likely to succeed.
Even though it was not explicitly reported, the lack of continuity arising from the fact that the ministry staff who chair the IP are often transferred, we foresee an inconsistency in leadership that could derail the activities of the IP.
The IP has been generally successful because it was well-constituted and structured. The IP structure enabled all stakeholders to benefit from the operations of the IP, which were mainly symbiotic (win-win in nature). For example, the IP usually organizes demonstrations and field days to sensitize the farmers to adopt conservation agriculture technologies. The institutions involved in the IP such as seed companies, input suppliers and even financiers use this gatherings/forums of the platform to advertise, promote and market their products, while farmers benefited by accessing the latest farming information and technology. The IP is threatened by the new surge in pest and diseases, and weather challenges.
In order to address the various challenges the IP stakeholders are facing, the following recommendations were proposed: The leadership capacity of farmers and the CBOs should be built to enable them
to take up full leadership of the IP. The IP should consider introducing Integrated Pest and Disease Management
(IP&DM) and climate smart technologies to counter the effects of climate change and resulting resurgence of pests and diseases.
Members of the IP require training in group dynamics to counter the non-commitment of members to IP activities.
42 PROGRAMME FOR ACCOMPANYING RESEARCH IN INNOVATION (PARI)
IP Failure Case Study
Case 1: Gadam Sorghum Innovation Platform in Tharaka North and South sub-
Counties
Tharaka Nithi County is located in the Upper Eastern region of Kenya and borders Embu, Meru, Kirinyaga, Nyeri and Kitui Counties. This county is subdivided into four (4) administrative sub-counties namely: Tharaka North, Tharaka South, Meru South and Maara. Agriculture is the major land use in the county with 1,449.6 km2 of arable land. The majority of the county residents are small-scale farmers, with an average land holding of 2.9 hectares. The region is characterized by erratic rainfall patterns, with shifts in planting time, resulting in frequent crop failure, moisture stress during the crop growing period and heavy rains during harvesting. Additional challenges are food insecurity and low household income, high post-harvest losses,• poor market access due to poor road networks (particularly in the interior parts of the county), lack of good storage and value addition facilities and exploitation of producers by the middlemen. The prevailing climatic conditions are suited for the cultivation of sorghum, and one of the improved sorghum varieties is Gadam-el-hamam. This variety has a higher fermentable starch comparable to barley, and an effort to commercialize its production was initiated through an innovation platform. The objective of the IP was to promote its production and marketing among the smallholder farmers in the semi-arid areas.
IP Characterization
The various stakeholders held discussions, and the sensitization and mobilization of farmers was thereafter done on the importance of growing sorghum in the area and the huge market available. The fora for this sensitization included workshop, farmer barazas, field days and FM radio station advertisements. Farmers were then organized into village-based sorghum grain production cells of between 15 and 20 individual farmers. The production cells were used as a fora for the training of farmers on good husbandry and handling practices to maintain high grain quality for the brewing industry. Each farmer was provided with enough seeds from the KALRO seed unit to kick-start the production process. The trigger for this innovation platform was the available market for Gadam sorghum grain, occasioned by the need for EABLM to reduce barley importation costs. The Gadam sorghum had been released many years before this opportunity arose, but there had never been any interest in its production on a large scale. The IP was therefore formed to utilize the opportunity availed by the demand from the East African Breweries.
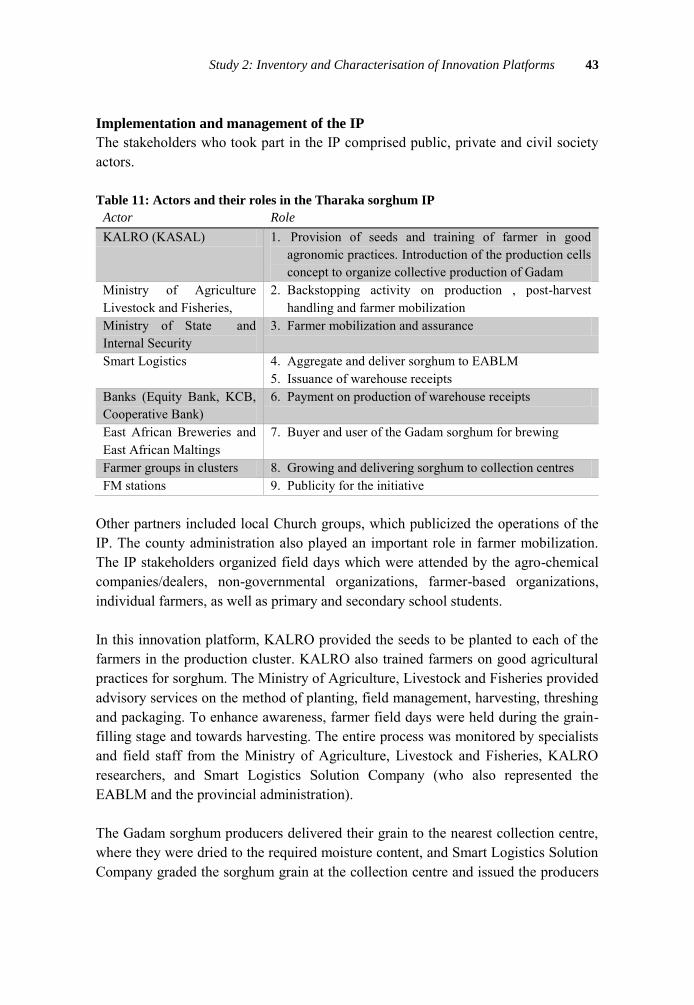
Study 2: Inventory and Characterisation of Innovation Platforms 43
Implementation and management of the IP
The stakeholders who took part in the IP comprised public, private and civil society actors.
Table 11: Actors and their roles in the Tharaka sorghum IP
Actor Role
KALRO (KASAL) 1. Provision of seeds and training of farmer in good agronomic practices. Introduction of the production cells concept to organize collective production of Gadam
Ministry of Agriculture Livestock and Fisheries,
2. Backstopping activity on production , post-harvest handling and farmer mobilization
Ministry of State and Internal Security
3. Farmer mobilization and assurance
Smart Logistics 4. Aggregate and deliver sorghum to EABLM 5. Issuance of warehouse receipts
Banks (Equity Bank, KCB, Cooperative Bank)
6. Payment on production of warehouse receipts
East African Breweries and East African Maltings
7. Buyer and user of the Gadam sorghum for brewing
Farmer groups in clusters 8. Growing and delivering sorghum to collection centres FM stations 9. Publicity for the initiative
Other partners included local Church groups, which publicized the operations of the IP. The county administration also played an important role in farmer mobilization. The IP stakeholders organized field days which were attended by the agro-chemical companies/dealers, non-governmental organizations, farmer-based organizations, individual farmers, as well as primary and secondary school students. In this innovation platform, KALRO provided the seeds to be planted to each of the farmers in the production cluster. KALRO also trained farmers on good agricultural practices for sorghum. The Ministry of Agriculture, Livestock and Fisheries provided advisory services on the method of planting, field management, harvesting, threshing and packaging. To enhance awareness, farmer field days were held during the grain-filling stage and towards harvesting. The entire process was monitored by specialists and field staff from the Ministry of Agriculture, Livestock and Fisheries, KALRO researchers, and Smart Logistics Solution Company (who also represented the EABLM and the provincial administration). The Gadam sorghum producers delivered their grain to the nearest collection centre, where they were dried to the required moisture content, and Smart Logistics Solution Company graded the sorghum grain at the collection centre and issued the producers

44 PROGRAMME FOR ACCOMPANYING RESEARCH IN INNOVATION (PARI)
with a warehouse receipt. The farmers were paid through Equity Bank on the production of a warehouse receipt. Later on, Equity bank initiated mobile banking services through a vehicle ferrying money on specified days to specific areas from where farmers could be paid. Afterwards, this system was replaced with payment through Equity Bank agents. The other banks like Kenya Commercial Bank and Cooperative also got involved in the payment through the Coop and KCB Mtaani agents
Sustainability
The training of the stakeholders was mainly focused on the production of sorghum, but not so much on the group dynamics and governance in groups. Seed and other inputs for production of this crop were provided to the farmers, but no sustainability mechanisms were built in the whole process. This led to a collapse of the innovation platform once the main actors pulled out and no more funds were available through the KALRO project. Another failure of sustainability was owing to the imposition of a tax on sorghum beer by the government, which adversely affected sorghum beer sales. The market shrunk in size and this forced many producers to stop the production of the crop.
Achievements of the IP
Several achievements can be listed from this platform. Among these achievements was the conversion of sorghum into a cash crop for the area. This led to an increase in sorghum grain production from the region, where the crop was previously viewed as a poor man’s crop. Another achievement was the social learning between and among the stakeholders from which various technical and organizational innovations were introduced. Examples of the technical innovations included the method of planting, and bird damage evasion through planting of millets to divert birds’ attention. The farmers also applied their local knowledge and were able to convert the leftover sorghum into local delicacies that sustained them during the famine periods, without relying on maize. From a socio-organizational point of view, the arrangement into production clusters was a new concept in the area. The aggregation for collection was also a new concept, as well as the warehouse receipt system. The system of collection and delivery of sorghum grain was also a socio-organizational arrangement that worked well for the IP, while the payment on production of receipt at the bank was also a technical innovation. The model adopted by the IP was successful in bringing several partners together for a common purpose, i.e., increased food security and household income in Tharaka County, which is a region dominated by pearl millet, green grams and cowpeas.
Study 2: Inventory and Characterisation of Innovation Platforms 45
Challenges
The main challenges the farmers faced included: Distortion of price of sorghum with entry of brokers Storage of produce in anticipation for higher prices Pests and diseases Increased labour costs due to bird scaring Lack of appropriate storage facilities Tax on sorghum beer
The Gadam sorghum case is a good example of how market demand can be a trigger and can lead to renewed interest in a commodity that may be available but unutilized (a good example of ‘technology on the shelf’). The variety was released in 1996, but became popular and useful in 2009 through the demand by EABLM. It is, however, important to note that despite this favourable market, there was a need to have suitable contextual environment from a biophysical, socioeconomic and institutional point of view. Unfavourable weather conditions, farm-gate price distortion by brokers and the imposition of tax on sorghum brews led to a drop in total Gadam grain tonnage. The actors in the Gadam sorghum played their roles effectively, but it also seems like they focused more on the production, collection and marketing of sorghum, and left out an important role of building the capacity of the farmers to take over the management of the platform. This could explain the lack of sustainability of this platform From this case, it is apparent that while a focus on an opportunity is important, it is equally important to develop soft skills in the farmers to take on management and leadership roles in an innovation platform. This facilitates the continuation of the platform long after the main actors have left. In this case it seems like this was not done. It is therefore recommended that capacity building of stakeholders and especially the farmers should be an important consideration in the IPs. Another issue that is important to consider is the policy environment where the imposition of tax (later removed) led to a discouragement by EABLM to continue buying sorghum. While this is due to the need for tax revenue by the government, it is worthwhile to note that the tax revenue earned may be less than the money that the government later spends to rescue the inhabitants of the ASALs from poverty and food needs. Instead of taxation on such crops, more support should be given to the ASAL farmers to discourage dependency. The active role of the private stakeholders such as the banks and the Smart Logistics Solution Company is a good example of the potential that is still untapped. Even though the IP did not continue, the experience gained should be applied in upcoming innovation platforms.
46 PROGRAMME FOR ACCOMPANYING RESEARCH IN INNOVATION (PARI)
Case 2: Mworoga SIMLESSA Innovation Platform
Meru County is located to the east of Mount Kenya, whose peak cuts through the southern boundary of the county. It shares borders with Laikipia to the west, Nyeri to the south west, Tharaka/Nithi to the east and Isiolo to the north. The county has a total area of 6,936 km2 and borders Kirinyaga, Embu, Makueni and Nyeri Counties. There are several agro ecologies found in the area, which include the Upper, Midland and Low Midland zones. The crops grown include maize, beans, bananas, pigeon peas, cow peas and cash crops (tea, coffee, and banana). In the recent past, most farmers have been shifting from traditional cash and food crops to horticultural crops, which attracts relatively higher prices in the market. The main livestock typest are goats, cattle, sheep, pigs, rabbits and poultry, which are reared on a small-scale since most land is used for the farming of food and cash crops. Agricultural challenges in the county include declining soil fertility, soil erosion, environmental degradation due to adverse effects of climate change and poor marketing systems. In the ASAL areas, low moisture is a major challenge due to low rainfall. The Mworoga innovation platform is located in the Egoji Ward of Meru County, and falls under agro-ecological zone LM4 at an elevation of 990masl. It is in a zone suitable for the cultivation of maize, pigeon peas, millet and tobacco, among other crops. Maize is the most important staple crop, while pigeon peas are an important source of cheap dietary protein and income for a majority of the rural households. The Mworoga IP was initiated as part of the SIMLESSA project, whose objectives were: (i) to characterize maize-legume production and input and output value chain systems and impact pathways, and identify broad systemic constraints and options for field testing, (ii) test and develop productive, resilient and sustainable smallholder maize-legume cropping systems for local scaling out, (iii) increase the range of maize and legume varieties available for smallholders through regional testing and release, (iv) support the development of regional and local innovation platforms, and (v) support capacity building to increase the efficiency of agricultural research today and in the future. The objective of the IP was to evaluate and promote technologies and innovations from the various research and development stakeholders, farmers and other partners. The platform provided an opportunity to include institutional and individual actors towards the achievement of technical, institutional and organizational innovations for socioeconomic benefits.
IP characterization
Initiation activities of Mworoga IP started in 2011 with a secondary review of literature of projects that had taken place in this area in the past and the organizations that were involved. This led to an identification of partners to be contacted and sensitized on the
Study 2: Inventory and Characterisation of Innovation Platforms 47
objectives and implementation of the project. A meeting was then organized to sensitize the farmers from three villages to participate in the baseline surveys to identify and prioritize the area on agricultural production constraints and opportunities. The meeting was also used as an opportunity to select the site of the innovation platform. The criteria used to select the IP site were: farmers’ willingness to host the IP and to train other farmers, willingness to provide labour and some inputs not provided by the project, and ease of access to the plot throughout the year. The benefits that the farmers expected to receive from joining the IP initiatives included learning from one another, learning from R&D agencies, faster uptake of improved technologies and consequent improvement of productivity. Throughout the initiation process, it was emphasized that the idea was for “all to work towards improving food security in the region.” The major value chains identified for this IP were maize and pigeon peas, and the trigger was the low level of maize and pigeon peas yields due to low soil fertility. Conservation agricultural practices were considered to be one way of increasing the soil fertility and also improving the management of natural resources. The actors involved in the Mworoga innovation platform included local administration, Ministry of Agriculture, Livestock and Fisheries, KALRO, Women Enterprise Fund, UAP Insurance and the local farmers. The local administration helped in the mobilization of the farmers and in other administrative issues, while the MOALF provided advisory and backstopping services. On crop production practices, KALRO provided training on conservation agriculture practices, demonstration and seed money to start the platform. The local stakeholders were the farmers who participated through the provision of land, labour and other farm level logistical support. The Women Enterprise Fund provided credit to the platform members, while UAP Insurance introduced and trained farmers on crop insurance package.
Achievements
This IP platform operated for three years, during which three conservation agriculture technologies were tested. Additionally, the farmers were trained on crop insurance package, group dynamics, crop management and informal seed production.
Challenges
The challenges faced by the IP included failure of the initiator to focus on tobacco, which is the priority value chain in the area. There was also low partner commitment and differing interests and objectives among the participating partners. Some members had very high expectations which were not met. There were also limited skills to establish and manage the innovation platforms
48 PROGRAMME FOR ACCOMPANYING RESEARCH IN INNOVATION (PARI)
The Mworoga innovation platform had a predetermined entry point and objectives. The farmers had no voice in selecting and working on their practical priorities. Thus a major challenge was the commitment of the farmers to focus on a value chain which was not a priority. Another issue that is worth noting is that there were few partners in the area and, this being an ASAL area, members had very high expectations which were unmet. All these factors combined, led to the collapse of the platform after three years of operation. It is therefore recommended that any innovation platform should carefully select the entry point and also focus on the priority of the area, even though the project may be dealing with another value chain. This would increase the chances of success of an innovation platform. Lessons Learnt from IPs
1. Initial capacity building, especially on group dynamics and operations of the IP, provides a springboard for central actors to become independent and think outside the box.
2. Leadership of the IP is a critical success factor and, while external actors can lead in the initial stages, this role should be handed over gradually to the central actors.
3. Strategies for raising funds independent from those provided by the initiator are necessary for the sustenance of the IP activities.
4. Selection and focus on the priority value chain which addresses the appropriate issues/opportunities such as markets is a determinant of the success of IPs
5. Appropriate/conducive institutional and organizational environments are necessary for a technological innovation to thrive.

STUDY 03
Investments in Innovations for Agricultural
Development and Food and Nutrition Security
50 PROGRAMME FOR ACCOMPANYING RESEARCH IN INNOVATION (PARI)
INTRODUCTION
The agricultural sector in Kenya is the backbone of the economy and plays a major role in ensuring food security and steering economic growth, through a direct contribution of 26% to the gross domestic product (GDP) and an indirect contribution of 25% (GoK, 2010, 2014). It supplies raw materials to the manufacturing sector and accounts for 65% of Kenya’s total exports and employs over 40% of the total population. Over 70% of the rural population depend on agriculture for their livelihood through small-scale farming, with about 75 % of total agricultural output and 70 % of marketed agricultural production coming from around two to three-hectare farms (GoK, 2004, GoK, 2010, UNEP, 2015). Farming in Kenya is characterized by low adoption of improved inputs such as hybrid seeds, concentrate feeds, fertilizers, pesticides and low mechanization. There is, therefore, a huge potential for increasing productivity through the adoption of improved inputs and practices (GoK, 2010, GoK 2015, UNEP 2015). Sixteen percent of the 576,000 square kilometres of total land area in Kenya is of high to medium potential. This potentially arable land is dominated by commercial agriculture, with cropland occupying 31 %, grazing land 30 %, and forests 22 %, while the rest is arid and semi-arid lands (ASAL) used by ranchers, agro-pastoralists and pastoralists. Due to Kenya’s reliance on rainfed agriculture, the sector is vulnerable to weather variability leading to fluctuations in production and income, and is one of the many factors that are attributed to the country’s food insecurity (GoK, 2009, GoK 2014, Alila and Atieno, 2006).
The growth of agricultural gross domestic product (AgGDP) is more effective in reducing poverty, thus making agriculture a key sector to drive the economy. This is demonstrated by the first two decades after Kenya’s independence, when the agricultural sector, as well as the national economy recorded a growth of 6% per annum for agriculture and 7 % for the national economy, respectively (GoK, 2009). This growth was driven by ample available land, better use of technology together with government support to agricultural extension and research, agricultural inputs, marketing, credit and agro-processing, in addition to the establishment of agricultural institutions such as farmers’ cooperatives. An average of 13 % of the national budget was allocated to this sector during this period (GoK, 2009).This growth, however, declined to 3.5 % in the 1980s and fell further to an average rate of 1.3 % in the 1990s, due to low investment, mismanagement, virtual collapse of the agricultural institutions and negligence of agricultural extension and research services (Muyanga and Jayne 2006, GOK, 2009). This was the period of the Structural Adjustment Programme
Study 3: Investments in Innovations for Agricultural Development… 51
(SAP), which encouraged poorly sequenced privatization in the sector and saw budgetary allocation to agriculture declining to 2 % or less of the national budget (GoK, 2009, Kibaara et al., 2009). In 2000, the sector showed signs of revival, when a rate of 2.4 % was recorded, as a result of the governments’ efforts for agriculture to be recognized as a priority sector that is key to economic growth in the context of the Economic Recovery Strategy for Employment and Wealth Creation (ERS) and the Strategy for Revitalizing Agriculture (SRA). The government gradually started to invest more in the sector and to increase budgetary allocation to an average of 4.5 % of the total national budget. The sector reached a high growth rate of 6.1% in 2007 (GoK, 2009; GoK, 2011). Under the economic pillar of Kenya’s Vision 2030 and the Agricultural Sector Development Strategy, the agricultural sector is expected to contribute towards the reduction of the current level of poverty (44-46%) as per the 2014 estimates (World Bank, 2015; GoK, 2009). While this is a 10% improvement from the past 12 years, more effort is still expected in order to develop the agricultural sector for increased food security and income. Several challenges confront the sector, key among which are inadequate budgetary allocation, low adoption of improved technologies, high costs of inputs and reduced effectiveness of extension services among others (GoK, 2011; GoK, 2009; Kibaara et al., 2009). Inadequate budgetary allocation to the agricultural sector is a key constraint that leads to reduced service delivery by the agricultural sector departments. The funds allocated to the sector have persistently been lower than the requirement (GoK, 2014). In 2003, under the Maputo Declaration, African heads of state committed to allocate 10% of their annual budgets to the agricultural sector; but in many countries, including Kenya, this has not yet been realized (Samuel and Bingxin, 2012). The reduced level of funding to the sector in turn has an effect of reducing funding to agricultural research and, thus, a reduction in the generation, testing and scaling up of new innovations. It has been shown that for Kenya and five other countries, agricultural research has a mean internal rate of return of 43% and, for every dollar invested, there is a return of three dollars for national agricultural research and seven for the CG centres (Fuglie and Rada, 2013). This is an indication of the important role played by the agricultural research system even though there are other services that are also important such as the extension services, functional markets, transportation infrastructure, as well as enabling policy and institutional support for agriculture to play its key role of driving the Kenyan economy. Adequate financial and institutional support as well as appropriate deployment is therefore key to accomplishing the role expected of the
52 PROGRAMME FOR ACCOMPANYING RESEARCH IN INNOVATION (PARI)
sector and reverse the escalating food insecurity and diminishing levels of incomes of the Kenyan population. As indicated by many experiences within the Kenyan agricultural research and development over the years, well-targeted investment within programmes and projects in the horticulture, dairy, tea and food crops subsectors have a lot of potential towards making a significant impact on rural life. There is therefore a need to assess the investment in the agricultural sector and the resultant impact with a view to making well-grounded recommendations for future investments. The broad objective of this study is therefore to review and assess the extent and level of national and international investments on agricultural innovations in Kenya, while the specific objectives are to:
1. Review the national and international investments that have taken place in agricultural innovations in Kenya;
2. Review the context(s) within which the investments were made; 3. Assess the extent of the investments and the specific innovations targeted; 4. Analyze and determine the value addition of these investments to the target
innovations. Note that it was a bit difficult to exclusively isolate investments in agricultural innovations; hence, investment in agriculture in general was used as a proxy for the investment in agricultural innovation. METHODOLOGY
The study was conducted through a collection of secondary data from various sources on investments in the agriculture sector as well as agricultural research. The data collected included the period when the investments were done and in what innovations. Data were also collected on the major agricultural commodities in terms of outputs generated, incomes realized and productivity levels. Regression analysis was carried out to further understand the impacts of these investments on the target innovations. Secondary sources of data included the Ministry of Agriculture, Livestock and Fisheries (MoALF) databases, the Kenya National Bureau of Statistics and the National Project Documents. Data on investments in agricultural research were obtained from the Agricultural Science and Technology Indicators (ASTI) database that had been collected over years by KALRO in collaboration with the International Food Policy Research Institute (IFPRI). Other sources of data were end of

Study 3: Investments in Innovations for Agricultural Development… 53
project/monitoring and evaluation reports of major on-going and/or concluded programmes of the Ministry of Agriculture (MOA) and the Internet. A combination of methods were employed to analyze both the qualitative and quantitative data in order to realize the objectives of the study. The quantitative data were analyzed using descriptive statistics, graphs, charts and regression analysis. Trend analysis was undertaken to show relationships between investment on one hand and productivity (TFP), income (GDP) and food security. Trends were also used to show the gap between budgetary allocation to agriculture and requirements as per the Maputo Declaration. In order to explain the context in which the investments were made, brief explanations were given for each of the major programmes/initiatives that addressed issues of food insecurity and poverty over the past twenty years (1995-2014). For each of the programmes/initiatives, the financiers were asked to provide an account of their contribution to critical areas such as productivity, nutrition, climate change and environment. Similarly, to assess the extent of the investments and specific innovations targeted, a review of existing project/programme documents was undertaken. To determine the value addition/impacts of the investments, simple regression analyses were done to show the impacts of investments on factor productivity, food security and income as shown in the following equation:.
𝑌 = 𝑎 + 𝑏𝑋𝑖 + 𝑒 Where: Y = expected impact (total factor productivity; GDP; annual GDP growth rate, AgGDP;
annual AgGDP growth rate) a = intercept b = coefficient Xi = explanatory variable (investment in agriculture; investment in agricultural research;
investments in research supporting services and infrastructure), e = the error term.
RESULTS This section focuses on the overall investments in the agricultural sector, trends in national and agricultural growth, selected crop productivity and trends, and examples of specific project investments and related impacts.
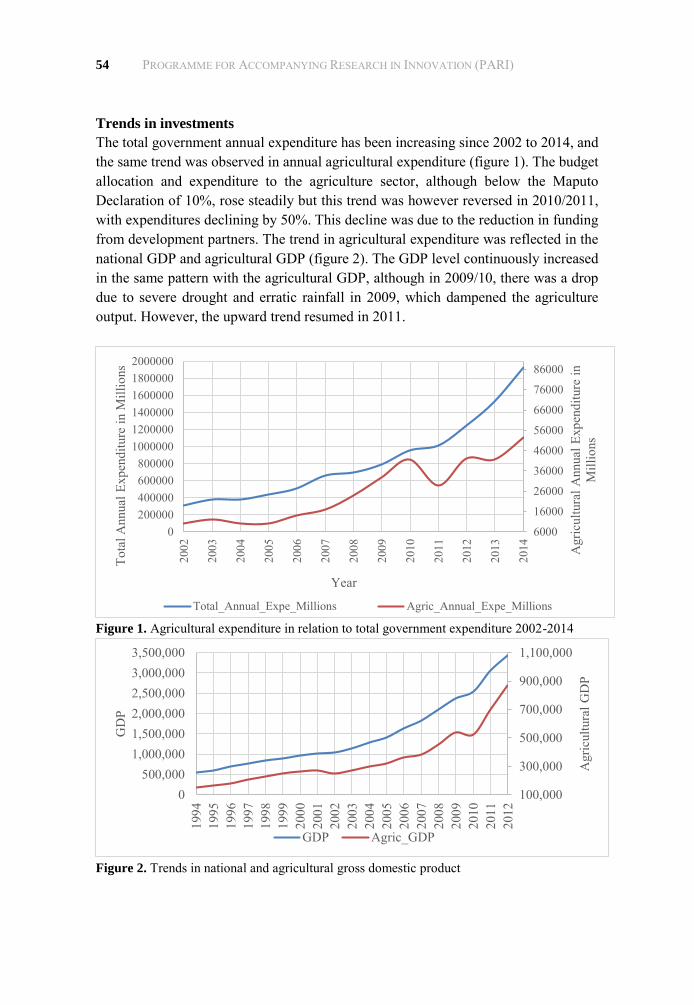
54 PROGRAMME FOR ACCOMPANYING RESEARCH IN INNOVATION (PARI)
Trends in investments
The total government annual expenditure has been increasing since 2002 to 2014, and the same trend was observed in annual agricultural expenditure (figure 1). The budget allocation and expenditure to the agriculture sector, although below the Maputo Declaration of 10%, rose steadily but this trend was however reversed in 2010/2011, with expenditures declining by 50%. This decline was due to the reduction in funding from development partners. The trend in agricultural expenditure was reflected in the national GDP and agricultural GDP (figure 2). The GDP level continuously increased in the same pattern with the agricultural GDP, although in 2009/10, there was a drop due to severe drought and erratic rainfall in 2009, which dampened the agriculture output. However, the upward trend resumed in 2011.
Figure 1. Agricultural expenditure in relation to total government expenditure 2002-2014
Figure 2. Trends in national and agricultural gross domestic product
6000
16000
26000
36000
46000
56000
66000
76000
86000
0200000400000600000800000
100000012000001400000160000018000002000000
2002
2003
2004
2005
2006
2007
2008
2009
2010
2011
2012
2013
2014 Agr
icul
tura
l Ann
ual E
xpen
ditu
re in
M
illio
ns
Tota
l Ann
ual E
xpen
ditu
re in
Mill
ions
Year
Total_Annual_Expe_Millions Agric_Annual_Expe_Millions
100,000
300,000
500,000
700,000
900,000
1,100,000
0500,000
1,000,0001,500,0002,000,0002,500,0003,000,0003,500,000
1994
1995
1996
1997
1998
1999
2000
2001
2002
2003
2004
2005
2006
2007
2008
2009
2010
2011
2012
Agr
icul
tura
l GD
P
GD
P
GDP Agric_GDP

Study 3: Investments in Innovations for Agricultural Development… 55
Figure 3 shows the percentage of the total government expenditure to the agricultural expenditure from 1995 to 2010, in relation to the achievement of the Maputo declaration. The lowest percentage was 3.2% in 2008 and the highest was 6.8% in 2000. The average percentage from 2000 to 2010 is 4.5 %, which is about half of the expected 10%.
Figure 3. Kenyan agriculture expenditure as % of total government expenditure Source: Samuel and Bingxin (2012)
Trends in National and Agricultural Growth
The overall growth of the Kenyan economy showed varied trends from 2000 to 2014 (figure 4). During this period, the highest growth rate was achieved in 2010 at 8%, followed by 7% in 2007. In 2004, 2006, 2009 and 2013, the growth rate was more than 5%; although in the other years, the values were lower than this. The growth rates of 5% and above could be attributed to the favourable macroeconomic and political environment, while the low rates, especially in 2002 and 2008, could be attributed to the political uncertainty during the election years. On agricultural GDP, 2001, 2005 and 2010 witnessed a growth rate of above 7%, while 2006 and 2013 witnessed a 5% rate. These rates were attributed to the good weather, good macroeconomic and political environments. The lowest growth rates of -3 and -4 was witnessed in 2002 and 2008, respectively, which were the election years. The post-election violence that erupted in 2007/8 led to the disruption of agricultural activities.
5.5
6.8
4.3 4.1 4.4 4.54.9
3.23.9
4.6
0
2
4
6
8
10
1995 2000 2003 2004 2005 2006 2007 2008 2009 2010
% o
f To
tal A
gric
ult
ure
exp
end
itu
re
Years 1995 -2010
Maputo Declaration

56 PROGRAMME FOR ACCOMPANYING RESEARCH IN INNOVATION (PARI)
Figure 4. Overall Kenyan economic growth vis-a -is agricultural growth
Agricultural GDP as explained by annual expenditure in agriculture
The result of the regression analysis showed that investments in agriculture explained about 73% of the variation in agricultural GDP. This is consistent with the economic theory because the investments are mainly in the form of inputs into agriculture, which are necessary in increasing agricultural productivity. The result was as follows: Agric GDP = 155000 +13.47 Agric Expenditure +e (Adj. R2 = 0.725, p = 0.0005) This implies that for agricultural GDP to increase, investments in agriculture must also increase. From separate regressions, investments in agriculture did not significantly influence total factor productivity or growth in agricultural GDP. This would imply that increase in investments in agriculture is more in increasing area (such as investments in irrigation) and less towards increasing productivity. This could be because most of the investments in increasing agricultural productivity stop at piloting with minimal up-scaling and out-scaling.
Crop productivity trends
a. Maize productivity
Figure 5 shows maize production statistics in terms of area under the crop, production in tonnes and yields in tonnes per hectare, from 1992-2014. The area under maize was 1.5million ha from 1994 to 2002 and increased to 2.2million in 2012. The increase could be attributed to expansion into areas that were not traditionally maize growing. The production trend rose from 1.7m tons in 1995 and stabilized at 2.5m tons in 2002
-10
-5
0
5
10
15
1998 2000 2002 2004 2006 2008 2010 2012 2014 2016
Overall growth and agricultural growth
Overall_Growth Agricultural_Growth
Linear (Agricultural_Growth)

Study 3: Investments in Innovations for Agricultural Development… 57
to 2006, when it peaked at over 3.0m tons. The trend dropped to 2.9m tons in 2008 and then rose to 3.6m tons in 2012. In 2012, the area under maize increased dramatically due to the addition of the Galana irrigation scheme. However, yields were lower due to drought and the Maize lethal necrosis disease that affected the crop in the North Rift area.
Figure 5. Trends in maize acreage, production and yield, 1994-2012
b. Wheat productivity
Wheat production, area and yield declined until 2001, when there was a sharp increase in production (figure 6). This decline was as a result of poor distribution of rainfall, the Russian aphid and diseases. However, cutting edge research by KALRO developed new wheat varieties that were tolerant to drought (e.g., Kenya Ibis), soil acidity (Njoro-BW2) and resistance to the new strain of wheat stem rust Ug99 (Kenya Robin and Eagle 10) that led to yield increases. A good wheat producer price also motivated farmers to expand area under wheat. The decline of yield from 2007 was due to a new strain of UG 99 virus, while a low area under production was as a result of low producer prices occasioned by excess imports.
-0.20
0.30
0.80
1.30
1.80
2.30
2.80
0
500
1,000
1,500
2,000
2,500
3,000
3,500
4,000
1990 1995 2000 2005 2010 2015
Yiel
d T
on
/Ha
Pro
du
ctio
in 0
00
Ton
s, A
rea
in 0
00
Ha
Maize Productivity
Maize_Area_000 Maize_Production_000Tons
Maize_Yield Linear (Maize_Area_000)
Linear (Maize_Production_000Tons) Linear (Maize_Yield)
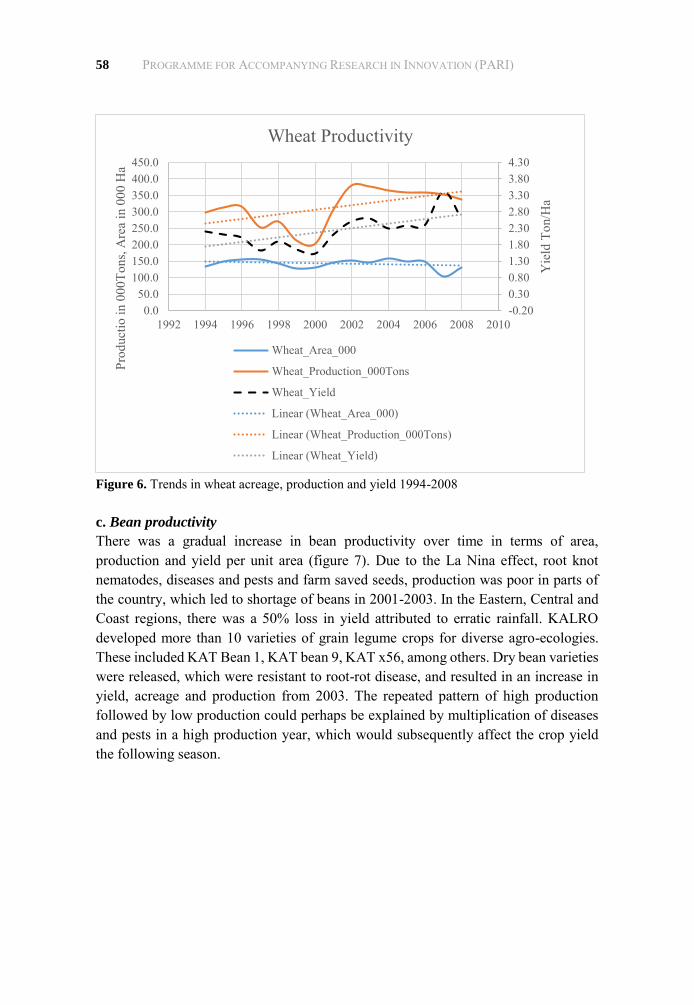
58 PROGRAMME FOR ACCOMPANYING RESEARCH IN INNOVATION (PARI)
Figure 6. Trends in wheat acreage, production and yield 1994-2008
c. Bean productivity
There was a gradual increase in bean productivity over time in terms of area, production and yield per unit area (figure 7). Due to the La Nina effect, root knot nematodes, diseases and pests and farm saved seeds, production was poor in parts of the country, which led to shortage of beans in 2001-2003. In the Eastern, Central and Coast regions, there was a 50% loss in yield attributed to erratic rainfall. KALRO developed more than 10 varieties of grain legume crops for diverse agro-ecologies. These included KAT Bean 1, KAT bean 9, KAT x56, among others. Dry bean varieties were released, which were resistant to root-rot disease, and resulted in an increase in yield, acreage and production from 2003. The repeated pattern of high production followed by low production could perhaps be explained by multiplication of diseases and pests in a high production year, which would subsequently affect the crop yield the following season.
-0.200.300.801.301.802.302.803.303.804.30
0.050.0
100.0150.0200.0250.0300.0350.0400.0450.0
1992 1994 1996 1998 2000 2002 2004 2006 2008 2010
Yie
ld T
on/H
a
Prod
uctio
in 0
00To
ns, A
rea
in 0
00 H
aWheat Productivity
Wheat_Area_000
Wheat_Production_000Tons
Wheat_Yield
Linear (Wheat_Area_000)
Linear (Wheat_Production_000Tons)
Linear (Wheat_Yield)

Study 3: Investments in Innovations for Agricultural Development… 59
Figure 7. Trends in beans acreage, production and yield, 1994-2012
d. Sorghum productivity
Figure 8 shows that total sorghum production and yield in Kenya decreased dramatically between 1994 and 1997, due to the unavailability of high quality seed in sufficient quantities. The release of KARI Mtama 1, 2 and 3, accompanied with the agronomic packages resulted in the increased yield and production recorded in 1998 to 2005. The decline in 2007-2008 was occasioned by the infamous post-election instability and a concomitant decline in sorghum production. Since 2008, total sorghum consumption in Kenya increased once again, due to the stability in the country and the growing demand for Gadam sorghum within the brewing industry for use in beer production (GoK, 2009; 2011). There was rapid expansion in the consumption of Gadam sorghum in the Eastern Province due to the contractual arrangement with Kenya Breweries Limited. Due to increased health concerns and awareness, the use of sorghum products has seen a gradual increase, as reflected by the quantity and range of processed sorghum products sold in local supermarkets. Concerted efforts in the promotion of the cultivation of sorghum as an alternative to maize in marginal areas also contributed to its increased production. An imposition of sales tax on sorghum brews in 2010 seems to have negatively affected sorghum acreage and production.
0.000.100.200.300.400.500.600.700.800.90
0
200,000
400,000
600,000
800,000
1,000,000
1,200,000
1990 1995 2000 2005 2010 2015
Yie
ld T
on/H
a
Prod
uctio
in 0
00To
ns, A
rea
in 0
00 H
aBeans Productivity
Beans_Area_000 Beans_Production_000Tons
Beans_Yield Linear (Beans_Area_000)
Linear (Beans_Production_000Tons) Linear (Beans_Yield)
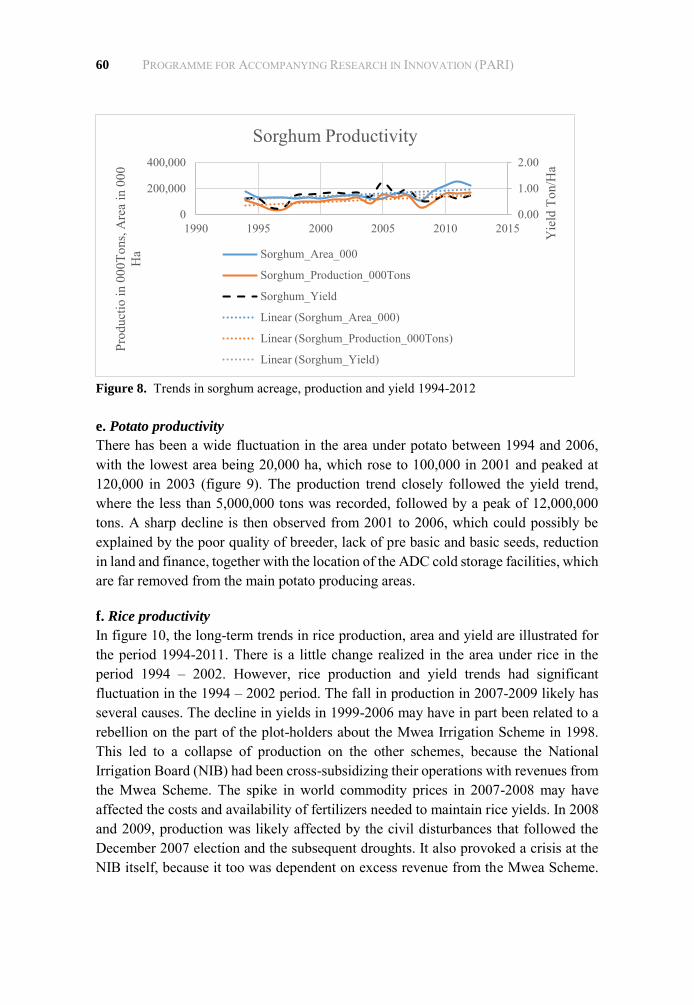
60 PROGRAMME FOR ACCOMPANYING RESEARCH IN INNOVATION (PARI)
Figure 8. Trends in sorghum acreage, production and yield 1994-2012
e. Potato productivity
There has been a wide fluctuation in the area under potato between 1994 and 2006, with the lowest area being 20,000 ha, which rose to 100,000 in 2001 and peaked at 120,000 in 2003 (figure 9). The production trend closely followed the yield trend, where the less than 5,000,000 tons was recorded, followed by a peak of 12,000,000 tons. A sharp decline is then observed from 2001 to 2006, which could possibly be explained by the poor quality of breeder, lack of pre basic and basic seeds, reduction in land and finance, together with the location of the ADC cold storage facilities, which are far removed from the main potato producing areas. f. Rice productivity
In figure 10, the long-term trends in rice production, area and yield are illustrated for the period 1994-2011. There is a little change realized in the area under rice in the period 1994 – 2002. However, rice production and yield trends had significant fluctuation in the 1994 – 2002 period. The fall in production in 2007-2009 likely has several causes. The decline in yields in 1999-2006 may have in part been related to a rebellion on the part of the plot-holders about the Mwea Irrigation Scheme in 1998. This led to a collapse of production on the other schemes, because the National Irrigation Board (NIB) had been cross-subsidizing their operations with revenues from the Mwea Scheme. The spike in world commodity prices in 2007-2008 may have affected the costs and availability of fertilizers needed to maintain rice yields. In 2008 and 2009, production was likely affected by the civil disturbances that followed the December 2007 election and the subsequent droughts. It also provoked a crisis at the NIB itself, because it too was dependent on excess revenue from the Mwea Scheme.
0.00
1.00
2.00
0
200,000
400,000
1990 1995 2000 2005 2010 2015 Yie
ld T
on/H
a
Prod
uctio
in 0
00To
ns, A
rea
in 0
00
Ha
Sorghum Productivity
Sorghum_Area_000
Sorghum_Production_000Tons
Sorghum_Yield
Linear (Sorghum_Area_000)
Linear (Sorghum_Production_000Tons)
Linear (Sorghum_Yield)

Study 3: Investments in Innovations for Agricultural Development… 61
Mwea Rice Farmer’s Cooperative Society (MRFCS) managed the scheme until 2003. The NIB was restructured in 2002 to adapt to the government policy on liberalization, while problems with MRFCS management of the scheme resulted in deterioration of the infrastructure and issues om the allocation of available irrigation water.
Figure 9. Potato productivity and trends
Figure 10. Milled rice production, area and yield on government irrigation schemes, 1994-2011 Source: GoK (2015), in SA table 67, and ES table 8.18. Production and yield converted to milled rice equivalent by multiplying by 5/8.
0
50
100
150
0
5000
10000
15000
1990 1995 2000 2005 2010
Are
a in
000
Ha,
Yie
ld T
on/H
a
Prod
uctio
in 0
00To
ns
Potato Productivity
Potatos_Production_000Tons
Potatos_Area_000
Potato Yields
Linear (Potatos_Production_000Tons)
Linear (Potatos_Area_000)
Linear (Potato Yields )
0
1
2
3
4
5
6
0
20
40
60
80
100
120
140
1990 1995 2000 2005 2010 2015
Pro
du
ctio
n in
00
0 T
on
, Are
a in
00
0 H
a
Rice
Ricet_Area_000 Rice_Production_000Tons
Rice_Yields Linear (Ricet_Area_000)
Linear (Rice_Production_000Tons) Linear (Rice_Yields)

62 PROGRAMME FOR ACCOMPANYING RESEARCH IN INNOVATION (PARI)
f. Dairy productivity
While there was a noticeable increase in the number of dairy animals since 2005, milk production declined steadily since 2007. There has also been a noticeable increase in the productivity of dairy animals since 2005 (figure 11).
Figure 11. Milk production and number of dairy animals, 1990-2010
Specific projects investments
During the period 2006-2015, the MoALF implemented several projects in different counties, which were funded by the Kenya government and other international financiers. The projects focused on improving food security and income, sustainable land management, marketing and youth empowerment (table1). The projects were implemented in various counties, with six of them covering more than half of the total number of counties in the country. The rest of the projects covered from one to 20 counties each, due to their specificity. The funding levels ranged from $0.47m to $117m, and the implementation periods were from 2006 to 2015.
Synthesis of project impacts
An examination of the projects implemented by the Ministry of Agriculture and the research organizations reveals a diversity of issues that the projects were meant to address. These fall into four broad areas, which are: increase in productivity for food security and household income (NMK, NALEP, EAAPP, KAPAAP), employment (UPAP, ShoMAP), natural resource management (WKIEMP, KACCAL, KAPSLM) and social inclusion (YMAP). The NAIAAP project addressed input affordability and accessibility. Selected projects are presented in the following textboxes to illustrate the impact/outcomes arising out of their implementation.

Study 3: Investments in Innovations for Agricultural Development… 63
Table 1. MoALF projects, counties, budgets and source of funds (2006-2015)
Project Scope Objective Period Amount
(USD
million)
Source
ASDSP 47 counties
To increase food security, equitable income through improved production and productivity
2012-17 60.7 SIDA GoK
KAPAP 20 counties
To increase agricultural productivity and incomes
2008- 15
60 GoK/WB
NMK 47 counties
To contribute to poverty reduction and food insecurity
2006-15 2 GoK
EAAPP 24 counties
To increase agricultural productivity and competitiveness, increase farm incomes and reduce poverty
2009-15 24 GoK/WB
SHDP 8 counties,
To contribute to poverty reduction and enhance food security
2008-15 20.75 GoK/ AfDB
SHEP-UP
33 counties
To improve livelihoods of small holder horticulture farmers
2010-15 3.73 GoK/JICA
SHEP-PLUS
18 counties
To increase number of horticulture smallholders applying SHEP approach
THVC 31 counties
To increase productivity by facilitating access to affordable quality inputs
2006-present
13.5 GoK
PEGRES 3 counties
To improve livelihoods of smallholder farmers, pastoralists and fisherfolk
2014-17 2.95 GoK/JICA
KAP-SLM
9 counties
To facilitate agricultural producers to adopt environmentally sound land management practices
2010-15 10 GEF/WB
KACCAL
4 counties
To enhance the resilience of communities and sustainability of rural livelihoods threatened by climate change
2012-16 5.5 GEF/WB
DRSLP 6 counties
To enhance drought resilience and improve sustainable livelihoods
2013-18 54.8 AfDB GoK
SHoMAP
7 counties
To increase domestic horticulture productivity and improve produce and input marketing
2007-15 23 GoK/IFAD
RICEMAPP
1 county To establish, disseminate and promote the adoption of the market-oriented approach in the Mwea Irrigation scheme
2012-17 1.8 GoK/JICA
YMAP 5 counties
To increase youth participation in horticultural production agribusiness and agro processing
2012-13 1.2 GoK
NAAIAP
41 counties
To improve (inputs) seeds and fertilizer access and affordability
2007 to present
0.47 GoK
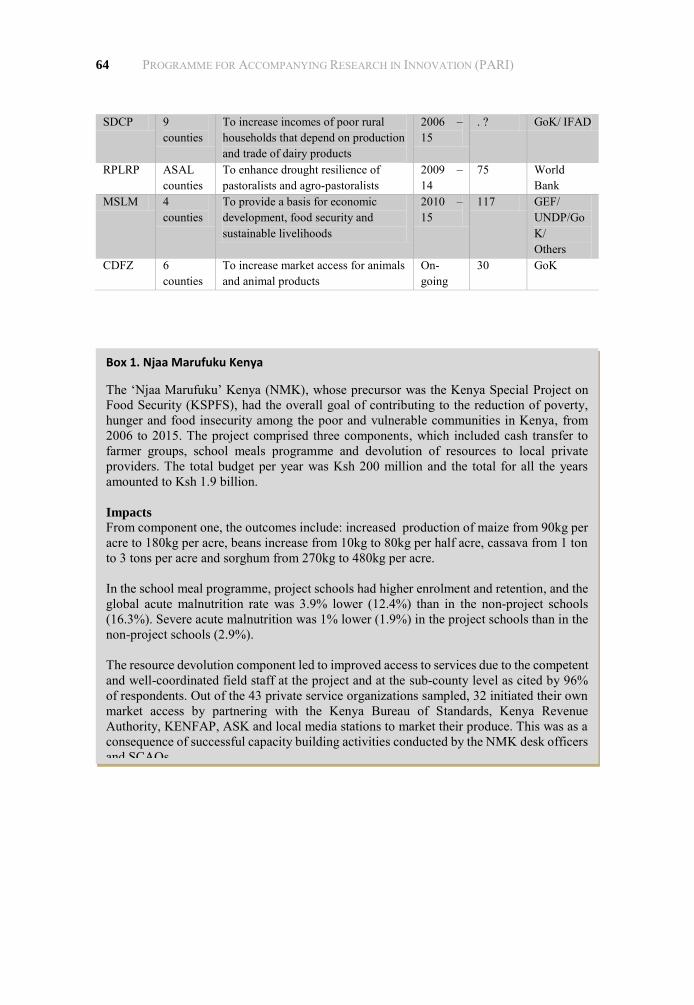
64 PROGRAMME FOR ACCOMPANYING RESEARCH IN INNOVATION (PARI)
SDCP 9 counties
To increase incomes of poor rural households that depend on production and trade of dairy products
2006 – 15
. ? GoK/ IFAD
RPLRP ASAL counties
To enhance drought resilience of pastoralists and agro-pastoralists
2009 – 14
75 World Bank
MSLM 4 counties
To provide a basis for economic development, food security and sustainable livelihoods
2010 – 15
117 GEF/ UNDP/GoK/ Others
CDFZ 6 counties
To increase market access for animals and animal products
On-going
30 GoK
Box 1. Njaa Marufuku Kenya
The ‘Njaa Marufuku’ Kenya (NMK), whose precursor was the Kenya Special Project on Food Security (KSPFS), had the overall goal of contributing to the reduction of poverty, hunger and food insecurity among the poor and vulnerable communities in Kenya, from 2006 to 2015. The project comprised three components, which included cash transfer to farmer groups, school meals programme and devolution of resources to local private providers. The total budget per year was Ksh 200 million and the total for all the years amounted to Ksh 1.9 billion. Impacts
From component one, the outcomes include: increased production of maize from 90kg per acre to 180kg per acre, beans increase from 10kg to 80kg per half acre, cassava from 1 ton to 3 tons per acre and sorghum from 270kg to 480kg per acre. In the school meal programme, project schools had higher enrolment and retention, and the global acute malnutrition rate was 3.9% lower (12.4%) than in the non-project schools (16.3%). Severe acute malnutrition was 1% lower (1.9%) in the project schools than in the non-project schools (2.9%). The resource devolution component led to improved access to services due to the competent and well-coordinated field staff at the project and at the sub-county level as cited by 96% of respondents. Out of the 43 private service organizations sampled, 32 initiated their own market access by partnering with the Kenya Bureau of Standards, Kenya Revenue Authority, KENFAP, ASK and local media stations to market their produce. This was as a consequence of successful capacity building activities conducted by the NMK desk officers and SCAOs.

Study 3: Investments in Innovations for Agricultural Development… 65
Box 2: The National Agricultural and Livestock Extension Program (NALEP)
The National Agriculture and Livestock Extension Program (NALEP) was implemented in 43 districts of the five provinces (Central, Western, Rift Valley, Nyanza and Eastern) from 2000 to 2005. The programme used the focal development area approach (FDA), and aimed at increasing agricultural production, food security, higher incomes and improved environment through a coherent national extension service on crops, livestock, land and water management.
Impacts
This programme accelerated the adoption rates of poultry vaccination, improved soil fertility management, dairy feeding, cattle dipping and goat keeping through increased credit uptake (6% to 23%), awareness and discouraging the “handout mentality” (16% to 12%). Farmers diversified their enterprises (16%) with rates of diversification ranging from 26.3% in Rift Valley to 20.4% in the Western and 4% in the Central Province. Marked increases in diversification were 11.3 % for cassava planting in the Western Province, 7% for maize in the Nyanza Province, 6% for beans in the Central Province, 4.5% for bananas in the Western Province and 1.7% for sweet potatoes in the Rift Valley Province. Cassava planting in the Western Province increased after the introduction of varieties that are high yielding, low cyanide content and resistant to mosaic virus disease and drought. Priority livestock enterprises for diversification in order of importance were dairy cattle, poultry, goats, sheep and pigs. Farm productivity was highest in maize and milk, moderate in beans, vegetables and bananas, and marginal in sorghum, eggs and honey production, because of low input use. Due to this increase, farmers selling maize, sorghum and beans increased by 2%, 2.6% and 6.2%, respectively, while those selling goat, cattle and sheep products increased by 4.5%, 2.8% and 1.6%, respectively. Participation in common interest groups (CIGs) eased marketing constraints through facilitating access to local food markets for 50% of the farmers, contributing to marketing (54%) and stimulating (23.7%) of the farmer-groups to add value to farm produce before selling. Farmers receiving free farm inputs reduced from 16% to 12%, and credit uptake rose from 6% to 23%. The programme was effective in enhancing the participation of farmers in environmental conservation, HIV/AIDs awareness and control, creating farmer awareness about democratic and human rights, but not consumer rights. Farmer participation in HIV/AIDs awareness and control was greater in Nyanza (73.4%) and Western (59%), and the remaining provinces were at less than 50%. It is worth noting that currently, this project has been transformed into the Agricultural Sector Development Program, which is covering all the 47 counties and each has a list of three priority value chains that they are pursuing. Source: Ministry of Agriculture: (2007) NALEP Internal Impact Assessment Report

66 PROGRAMME FOR ACCOMPANYING RESEARCH IN INNOVATION (PARI)
Box 3: East African Agricultural Productivity Project (EAAPP)
The specific objectives of the project were to: enhance regional specialization in agricultural research, enhance regional collaboration in agricultural training and dissemination, and facilitate the increased sharing of agricultural information, knowledge and technology across the recipient’s boundaries. These objectives were pursued by tracking progress on strengthening regional centres of excellence, technology generation, training and dissemination and improved availability of seeds, planting materials and livestock germplasm. The commodity value chains were dairy, wheat, cassava and rice in Kenya, Ethiopia, Uganda and Tanzania, respectively. The EAAPP Kenya Chapter was supported with a total of $1.6 million (Ksh. 1,674,109,347). Impacts
The rate of change in regional specialization and collaboration in agricultural research across the four participating countries was 63%, an increase of 53% points above the baseline and exceeding the targets. A total of 138 new technologies were developed and these included new varieties. About 23 new technologies were disseminated across country boundaries, including; two Tanzanian rice varieties released in Kenya and Tanzania, and undergoing NPT in Ethiopia, four clones of Napier grass from Kenya recommended for dissemination in Uganda, botanical seed of cassava with enhanced carotene sent to Ethiopia, Tanzania and Kenya. Dissemination materials were produced such as leaflets, brochures, manuals and booklets. All countries developed communication strategies and there is an increase in the adoption of new varieties, breeds and management practices by farmers from 35 to 53%. Land under improved crop varieties increased from 2,755 ha in 2010 to 12,807 ha in 2014. Stakeholder satisfaction in technologies increased from 23 to 69%, especially in wheat and cassava attributed to disease resistance of the released varieties. Relative to non-project households, yields, production, incomes, food security and economic status improved for dairy in Kenya, rice in Tanzania and cassava in Uganda.
Source: ASARECA (2014)

Study 3: Investments in Innovations for Agricultural Development… 67
Box 4: Kenya Agricultural Productivity Project (KAPP) The Kenya Agricultural Productivity Project (KAPP) was initiated in 2004 and the Phase 1 was successfully completed in 2007. The total budget was $20,120,038 (KES 1,669,963,116). The broad objectives were to improve the overall system by supporting generation, dissemination, and adoption of agricultural technology through reforms in extension to improve pluralism, change in the existing system of agricultural research to improve accountability and impact, and increased empowerment of producer organizations to influence planning, design, implementation, funding and M&E of research, extension, training and capacity building activities. The KAPP KARI sub-component financed the implementation of priority research programmes in crops, animal production and health and socioeconomics. Impacts
The project supported both long-term and short-term training for generation and dissemination of technologies. Similarly an ICT strategy was developed that enhanced collaboration with partners and consortia such as FAO, CTA, CABI, ASARECA-RAIN, FARA, KENET, KAINET and universities. These partnerships greatly improved access to on-line/electronic information. Construction and rehabilitation of offices, staff houses and retreat centres and purchase of moveable assets improved the working environment. The ICT equipment were procured, and LAN and WAN networks were established in all the KALRO centres. KARI (now KALRO) adopted the APVC approach and aligned its research to the national policy of commercializing agriculture. Several technologies and information bulletins were developed, some of which were channelled through ATIRI and CBOs for testing and dissemination. 350 farmer groups requesting for 300 technologies were funded, leading to many farmers across the country acquiring desired technologies/information. Two modern biotechnology laboratories were set up and set for accreditation. Three effective vaccines were packaged and released (Oil-based FMD vaccine, ECF immunization, Thermo stable Newcastle disease 1-2 vaccine, CCPP penside latex agglutination kit). A 2,400 indigenous bird breeding flock was established at Naivasha and 3,000 improved birds availed to the farmers. Two Napier stunt disease resistant varieties were identified Agricultural Research Investment Service was set up for internal income generation. It led to piloting of business operations in 11 KALRO centres. KSU, which was operating on cost recovery basis was established to maintain all pre-released elite and released parental lines/varieties, increase breeder seed in the centre farms and train seed growers. 180 varieties were maintained, 1,034 MT of seed produced and 150,000 fruit tree seedlings propagated. 1.5 million cassava cuttings and 1.66 million sweet potato vines were sold. Source: KAPAP end of project report
68 PROGRAMME FOR ACCOMPANYING RESEARCH IN INNOVATION (PARI)
Box 5: United States Aid to International Development (USAID)
Funding for the USAID-KARI partnership (2004-2012): US $ 3,328,166
Support to Kenyan agriculture by the United States Aid to International Development
(USAID) started in 1964 and, in 1967, the food crops research project (FCRP-615-229) was
initiated, which gave rise to most of Kenya’s maize hybrids. A later phase supported the
new National Agriculture Research Project (NARP), which evolved after the formation of
KARI in 1979. Phase I began in 1987 to 1991, while phase II started in 1992 to 1998. The
National Agribusiness Development Support Project (NARP III) followed from phase II,
with the aim being to increase participation and efficiency of the private sector in
supplying agricultural inputs to smallholders and providing output market services.
The current USAID-KARI partnership, which built on past collaborations, started in 2003,
with a focus on biotechnology and, in 2004, then a broadening to include maize, dairy,
soil fertility and horticulture. In 2007, a nutri-business component was added, while in
2009 a food security dimension was incorporated with a focus on “increased rural
incomes”. The budget for this project was $415,000 per year for eight years, which
amounted to $3,328,1661.
Impacts
On soil fertility amendment, a pH baseline for the western region was established, and
the addition of lime and planting of grasses for soil fertility were introduced. Agricultural
lime was stocked by 33% of total agro dealers in the project area
On livestock diseases, five (5) disease diagnostic kits were tested and commercial
production is at an advanced stage, while an East Coast Fever vaccine was developed and
commercialized. Medicated helminthes feed blocks to protect animals against parasites
and provide supplementary nitrogen, minerals and energy were developed, and
commercialization is at an advanced stage. To improve livestock fodder, eight Lucerne
varieties were identified and local ones are undergoing national performance testing.
For food security, 29 maize varieties, and cassava, sweet potato and African leafy
vegetables varieties were made available for up-scaling to farmers
On export crops, USAID support enabled the rose flower to comprise 70% by value of all
export flowers, A rust free (kutuless) French bean with extra fine pods was released,
which has expanded French bean production to Bungoma and Trans Nzoia counties
To improve nutrition, two nutritional products (NIMIX and MAMIX) were produced, and
are awaiting certification by the Kenya Bureau of Standards; but in the meantime,
households continue using them at the local level
Source: Evaluation of the USAID-KARI partnership for increased rural household incomes
(2004-2013)

Study 3: Investments in Innovations for Agricultural Development… 69
The project in box 6, randomly selected from the many that have been implemented by the MoALF and KALRO, provide a snapshot view of the potential for investment in agricultural innovations. Out of the six projects, only three (NALEP, NMK and NAIAAP) have a countrywide reach. The significance of this is that the projects started with pilots that worked and funds were later availed for coverage in the 47 counties. The National Agriculture and Livestock Extension Programme started as the Soil and
Box 6: The Western Kenya Integrated Ecosystems Management Project (WKIEMP)
The Western Kenya Integrated Management Project (WKIEMP) started in 2005 as a direct
concern to the silting of Lake Victoria, due to massive runoff and sediment flows from
Rivers Yala, Nzoia and Nyando. The project had a budget of $4.1 million and the
development objective was to improve the productivity and sustainability of land use
systems in the three river basins.
Impacts
The number of food-deficit months per annum reduced from 5.3 to 4.3 months in the
beneficiary households, while the non-beneficiary ones reported an increase from 4.9 to
5.4months. Additionally, nearly 60% of the beneficiary households indicated an increase in
the production and consumption of food over the period as compared to only 31 to 37% of
the non-beneficiaries.
About 90% of project beneficiaries (70% women) were satisfied with the project interventions. This was especially important since it is taboo for women in the community to engage in tree planting since it is a preserve of the men. A total of 2,600,000 million tree seedlings, equivalent to 2600 hectares of land (assume 1000 seedlings/ha) were planted and there was a greater increase in the adoption rates of tree planting activities observed in the beneficiary households compared to the control groups (timber trees and fruit trees: 23% increase in adoption over the project period; fodder trees: 39%; and soil fertility trees: 40%). A total of 2,200 hectares of land were put under sustainable land management and there
was a 45% decrease in the incidence of soil erosion in the project intervention areas. The
economic rate of return (ERR) over 22 years was estimated to be 18% versus 14% in an
alternative scenario of a decreased number of beneficiaries. The beneficiaries ranked
improved food yield and food security as the second largest impact (23% of all the impacts
identified), next to the improved environment (31%), of IEM technology adoption.
Increased food production has a direct impact on poverty alleviation, as the study recently
conducted in the lower Nzoia river basin indicated that food was the biggest priority
(accounting for 30% of all the needs), according to the local respondents. The social rate of
return for the project, which included the environmental benefits from carbon
sequestration, was estimated to be 19.3%.
Source: Western Kenya Integrated Ecosystem management project, Report No: ICR00001533, Dec 2010
70 PROGRAMME FOR ACCOMPANYING RESEARCH IN INNOVATION (PARI)
Water Management Programme under SIDA support and progressed on to the catchment and focal area development approach, during which the common interest groups (CIGS) were used as an organizational approach. In the current ASDSP phase, stakeholder platforms have been developed to address the issues in each county’s three priority chains. In the case of Njaa Marufuku Kenya (NMK), the pilot phase was done through the Agricultural Technology and Information Initiative (ATIRI), which focused on working with stakeholders to address food and income security through the provision of technologies and information. The project was initially piloted in a few districts and later to the 47 counties. The provision of funds to the farmers in support of their technology needs and the private sector support were aimed at introducing innovations and supporting them within the rural communities. As for the NAIAAP programme, which provides subsidized fertilizers to farmers, the programme was piloted and proved successful, and it was rolled out to the entire country, which has led to an increase in the usage of this important input, especially given the decreasing levels of soil fertility. While the long-term impacts of these three projects are yet to be seen in a significant scale, they provide worthwhile experiences which all projects in the country could follow for wide scale impacts rather than ending at the pilot phase.
Challenges in the sector
One of the major challenges that characterize investments in Kenya is the issue of providing funds for projects at the pilot phase, but none for up- and out-scaling. This is a complex challenge since the donors have their own priorities and the country also needs to implement projects in the different areas. However, this can be mitigated by putting conditions that ensure that adequate funds are availed to cover at least three quarters of the counties for every project that is introduced. Another challenge is the new administrative dispensation in the country, where agriculture is devolved to the county governments, but its linkage to the national is still clear. This is exacerbated by the fact that the projects used as examples in this study started before the new devolved governments took over. Possibly this challenge could be solved through a forum where each county government would be required to commit itself to continuing with the projects, using the project and own funds as well as address the issue of out-scaling. As indicated earlier, a large proportion of Kenya’s agriculture is rain-fed making the country vulnerable to unfavourable/unpredictable rainfall and other weather/climate-related issues. Research on resilient crops is on-going, however, there is a need to also explore other ways to deal with this serious setback to the country’s agriculture. A possible approach would be to encourage water harvesting and irrigation in addition to
Study 3: Investments in Innovations for Agricultural Development… 71
drought tolerant crops and hardy animals. Small farm mechanization, which is grossly underexploited, could be encouraged since there is a lot of drudgery in most farm operations. Certain commodities such as potatoes are constrained by minimal availability of breeder, pre-basic and basic seeds. This is due to the limited physical, financial and land resources. Because of the importance of this commodity, there is a need to explore available options to address this challenge. One way is to embrace hydroponics and tissue culture techniques on a larger scale and, thereafter, train community groups in a similar model to the banana hardening nurseries with a view to increasing clean seeds for the farmers. It is clear that agricultural innovations could have an impact if the policy and institutional environments are conducive. As a result, there is a need for research to develop relevant policies. A good example is provided by Gadam sorghum, whose production improved due to the demand from the breweries. However, due to a tax imposed on sorghum beer, the production nose-dived. It therefore became necessary for a policy to remove this taxation to be established. This led to a reversal in production and an upward trend in area under production. The government therefore needs to support the sector and avoid imposing taxes, especially on crops that help to improve the livelihoods of small-scale farmers. A critical area that has been a long-term challenge is diseases and pests of crops and livestock. With changes in climate and weather patterns, this is anticipated to increase; hence, there is a need to develop more disease and pest tolerant-plants, as well as appropriate disease and pest management strategies. This will reduce the losses incurred from these scourges.
Conclusion
From the study, a few conclusions can be made. For example, it is apparent from the investment trends that the national budget assumed an increasing trend from 2002 to 2014, similar to the agriculture budget, although this experienced a 50% reduction in 2010/11. However, the agricultural budget as a proportion of the national budget is still way below the 10% Maputo Declaration agreed upon by the African heads of state in 2003. The highest percentage recorded was 6.8% in 2000, while the overall has been 4.5 %. Conversely, growth in this sector is intricately and directly intertwined with the national GDP, and in countries that have achieved the 10% benchmark or higher, there has been a marked impact on their GDPs (Samuel and Bingxin, 2012). There is, therefore, a need for the government to give special attention to the agricultural sector if rapid impact on rural poverty and food insecurity is to be realized. The national and agricultural growth trends also reveal that the highest national GDP (8.4%) was achieved in 2010, followed by 7% in 2007, while 5% and 6% were

72 PROGRAMME FOR ACCOMPANYING RESEARCH IN INNOVATION (PARI)
achieved from 2004 to 2013. High growth rates were attributed to the good weather, favourable macroeconomic policies and political environments. The 2002 and 2008 growth rates were very low (-3 % and -4 %, respectively) due to these been election years, especially in 2008 when there was post-election violence. It is therefore clear that a conducive political environment is necessary if positive and significant growth in the national and agricultural GDPs is to be realized. As contained in the Vision 2030, there is a need for a deliberate attention to this area in order to facilitate both national and agricultural development. As shown by regression of the investments, a total of 73% of the variation in agricultural GDP is explained by investments in the form of inputs to agriculture, which are necessary in increasing agricultural productivity. It is, however, worth noting that these investments did not significantly influence total factor productivity, or growth in agricultural GDP, which implies that the investments were in the form of expansion of production area into irrigation areas and other former non-crop areas, and less towards increasing productivity. As indicated by this situation, there is a need for future investments to focus on the deliberate increase in productivity, similar to the current NAIAAP initiative. This initiative could be expanded to include other inputs such as pesticides and post-harvest handling aspects. A focus on the crop productivity trends using the selected crops reveals a combination of factors that explain increase in productivity levels as well as decline. In general, increase in production area appears to be an explanatory factor in all the cases. Other factors include favourable weather, new high yielding and disease tolerant varieties, access and affordability of inputs (viz NAIAAP), favourable markets (e.g., Gadam sorghum and wheat) and a favourable political environment. The decline was due to factors such as unfavourable weather and political environment, reduction in area, occurrence of new pests and diseases (e.g., Russian wheat aphid, Ug99, MLND and bean root rot), poor producer prices, use of uncertified seeds, tax imposition (e.g., sorghum brews), poor quality breeder and basic seeds among others. It is, therefore, necessary for investments in agricultural innovations to be directed to the development of high yielding and tolerant varieties, input subsidies, institutional and policy environment (especially on markets) as well as attention to basic seeds (such as in potato). An overarching factor is the political environment that the government needs to actively safeguard. Finally, overreliance on rain-fed agriculture continues to be a hindrance to the potential of the Kenyan agricultural sector. Smallholder agriculture, as demonstrated by the SHEP-Up and SHoMAP projects, should be expanded to ensure production throughout

Study 3: Investments in Innovations for Agricultural Development… 73
the year. Other investments could also be made on drudgery elimination strategies, including smallholder mechanization, for example, through the use of small farm machinery, such as small tractors and others. Examples drawn from selected projects have shown that the focus is on increasing food security and income, sustainable land management, marketing, inputs affordability and youth empowerment. Most of these projects had positive impacts, although this appears to be on a limited scale, hence there is a need to deliberately pay attention to impact at the nationwide scale. It is apparent that this was not considered by the policy makers, and investments were approved without consideration to any measure to ensure expansion to areas outside the pilot scale. Examples of projects with measures to expand nationwide are provided by the NALEP project that has been transformed into the Agricultural Sector Development Program (ASDSP), with a nation-wide reach. A potential approach would be to concentrate investments on projects such as these, which are already showing promise rather than scattering the investments to all areas with an ultimate result of low or insignificant impact.
Lessons learnt and recommendations
1. Over the years, it is clear that the higher the level of agricultural expenditure, the more the corresponding positive effect on the agricultural growth and, in turn, the national GDP growth, which is a desirable scenario that the government should strive to uphold.
2. There are positive outcomes when the sector received close to the 10% allocation, which is similar to countries that achieved an allocation of 10% and above. There is, therefore, a need for Kenya to achieve the Maputo Declaration.
3. Investments in new high yielding and tolerant crop varieties, proper agronomic practices, input access and affordability, small-scale irrigation and mechanization, as well as institutional and policy strengthening, and a deliberate effort to ensure political stability are important areas for impact to be achieved.
4. Relying on expansion in area under production that several projects have focused on may not be feasible on the long-term, since there is limited land for expansion. There should be a deliberate effort to increase productivity per unit area. Efforts ought to be geared towards intensification in managing small land sizes, with a possible strategy of enhancing extension services to ensure that input subsidies such as fertilizers are tied to soil test results and clearly defined land sizes under production. A model such as the one applied in coffee where farmers were supplied with fertilizer depending on the number of trees a farmer has could be explored for food crops.

74 PROGRAMME FOR ACCOMPANYING RESEARCH IN INNOVATION (PARI)
5. Investments at the pilot scale should be reduced and, instead, landscape level investments should be increased in order to fast track impacts at the national level. This is an effort that could be accelerated by the county agricultural departments, who should be discouraged from what the national government has been doing owing to logistical considerations.
6. There is a need to encourage decentralized seed production and/or community seed production systems where possible that may potentially reduce the challenge of quality seeds.
References
Adekunle A.A., Ellis-Jones, J., Ajibefun, I., Nyikal, R.A., Bangali, S., Fatunbi, O. and Ange, A. (2012). Agricultural innovation in sub-Saharan Africa: Experiences from multiple-stakeholder approaches. Forum for Agricultural Research in Africa (FARA), Accra, Ghana.
Alila, P. O. and Atieno, R. (2006). Agricultural policy in Kenya: Issues and processes. A paper for the Future Agriculture Consortium Workshop, Institute of Development Studies, 20-22 March.
ASARECA. (2014). End of Phase 1 Evaluation of the Eastern Africa Agricultural Productivity Programme (EAAPP) – Final Report. ASARECA, Entebbe, Uganda.
Bett, C., Githaiga T., Njana J. and Munyao J. (2014). Improved quality protein maize dissemination and production in medium and low altitude ecologies of Kenya. In: S. Kimenye and D. Mcewann (eds) Scaling Up, Dissemination and Adoption of
Agricultural Technologies through Innovation Platforms: Lessons from Eastern and
Central Africa.
Biggs, S.D. and. Clay, E.J. (1981). Sources of innovation in agricultural technology. World
Development, 9(4): 321-336. Bol, M.O. (2010). Learning to export: Building farmers’ capabilities through partnerships in
Kenya’s flower industry. ISDA, Montpellier, France. Brodtrick, O. (1999). Risk, innovation and values: Examining the tensions. Final report
prepared for Risk Management Division, Comptrollership Branch, Treasury Board of Canada. Ottawa: Centre for Public Management.
Fuglie, K.O. and Rada, N.E. (2013). Resources, Policies, and Agricultural Productivity in Sub-
Saharan Africa. USDA-ERS, Washington DC. Government of Kenya (GoK). (2004). Strategy for Revitalizing Agriculture 2004-2014.
Ministry of Agriculture and Ministry of Livestock and Fisheries Development, Nairobi.
Government of Kenya (GoK). (2007). Kenya Vision 2030. Government Printers, Nairobi. Government of Kenya (GoK). (2009). Agriculture Sector Development Strategy. Government
Printers, Nairobi. Government of Kenya (GoK). (2010). Agricultural Sector Development Strategy-Medium-
Term Investment Plan: 2010-2015. Government Printers, Nairobi.
Study 3: Investments in Innovations for Agricultural Development… 75
Government of Kenya (GoK). (2011). National Food and Nutrition Security Policy. Agricultural Sector Coordination Unit. Government Printers, Nairobi.
Government of Kenya (GoK). (2014). Medium-term Expenditure Framework 2014/15-2016/17 for Agriculture, Rural and Urban Development Sectors. Government of Kenya, Nairobi.
Government of Kenya (GoK). (2015). Economic Survey 2015. Kenya National Bureau of Statistics, Nairobi.
Hawkins, R., Hemskerk W., Booth R., Daane J., Maatman A. and Adekunle A. (2009). Integrated Agricultural Research for Development (IAR4D). A Concept paper for the Forum for Agricultural Research in Africa (FARA) in Sub-Saharan African Challenge Programme (SSA CP). FARA, Accra, Ghana. Pp.92.
Hounkonnou, D., Kossou D., Kuyper T.W., Leeuwis C., Nederlof E.S., Röling N., Sakyi-Dawson O., Traoré M. and van Huis A. (2012). An innovation systems approach to institutional smallholder development in West Africa. Agricultural Systems 108(0): 74-83.
Juma, C. (2011). The New Harvest: Agricultural Innovation in Africa. Oxford University Press, Oxford.
Kamau, G. and Almekinders, C. (2009). From strangler to nourisher. How rice farmers turned a challenge into an opportunity and the possible lessons for agricultural innovations researchers London: Earthscan.
Kavoi, J. and Kamau, G. (2010). Poster presented during the National Council for Science and Technology Exhibition, May, 2010, Kenyatta International Conference Centre, Nairobi.
Kavoi, J., Kamau, G. and Kisilu, R. (2013). Experiences on formation and management of Gadam sorghum innovation platform in semi-arid lower eastern Kenya. In: F.W., Makini, G.M., Kamau, M.N. Makelo and G.K. Mburathi, editors. A Guide for
Developing and Managing Innovation Platforms. Kenya Agricultural Research Institute, Nairobi.
Kavoi, J., Karanja, D. and Wafula, J. (2010). Turning challenges into opportunities: Commercialization of Gadam Sorghum in maize dominated farming systems of lower semi-arid areas of Eastern Kenya. Paper presented during the 12th KARI biennial scientific conference, 9th – 11th August, 2011, KARI Headquarters, Kaptagat Road, Nairobi, Kenya.
Kavoi, J., Karanja, D., Wafula, J., Kisilu, R. and Arithi, C. (2011). Gadam Sorghum Commercialization through a Public-Private-Partnership Initiative in Semi-Arid Eastern Kenya: Lessons Learnt. Paper presented during the End of Project Conference, 9th to 11th August, 2011, KARI Headquarters, Nairobi, Kenya.
Kibaara, B., Ariga, J., Olwande, J. and Jayne, T.S. (2009). Trends in Kenyan Agricultural
Productivity: 1997-2007. Tegemeo Institute of Agricultural Policy and Development, Nairobi.
Kimenye, L. and McEwan, M. (2014). Scaling Up, Dissemination and Adoption of Agricultural
Technologies using Innovation Platforms—Lessons from Eastern and Central Africa. ASARECA (Association for Strengthening Agricultural Research in Eastern and Central Africa), Entebbe.

76 PROGRAMME FOR ACCOMPANYING RESEARCH IN INNOVATION (PARI)
Muyanga, M. and Jayne, T.S. (2006). Agricultural Extension in Kenya: Practice and Policy
Lessons. Tegemeo Institute of Agricultural Policy and Development Nairobi, Nairobi, Kenya.
Nederlof, S., Wongtschowski, M. and van’der Lee, F. (2011). Putting heads together: Agricultural innovation platforms in practice. Development, Policy & Practice
Bulletin 396. Nokoe K.S., Rijn F., Adekunle A., Ayanwale A. and Nyikahadzoi K. (2013). Similarities
among FARA-led innovation platforms. European Scientific Journal 9(36). Salami, A., Kamara, A.B. and Zuzana, B. (2010), Smallholder Agriculture in East Africa:
Trends, Constraints and Opportunities. Working Papers Series No 105. African Development Bank, Tunis, Tunisia.
Samuel, B. and Bingxin Y. (2012). Complying with the Maputo. Trends in public agricultural expenditures and implications for pursuit of optimal allocation of public agricultural spending. ReSAAKS Annual Trends and Report Outlook Report. IFPRI, Washington DC.
Triomphe, B., Floquet, A., Kamau, G., Letty, B. Vodouhe, D., Ngang’a, T., Stevens, J., Berg, J. van den, Selemna, N., Bridier, B., Crane, T. Almekinders, C., Waters-Bayers, A. and Hocdé, H.(2012).What does an inventory of recent innovation experiences tell us about agricultural innovation in Africa? Journal of Agricultural Education and
Extension UNEP. (2015). Green Economy Sector Study on Agriculture in Kenya. UNEP, Nairobi, Kenya. World Bank (2006). Enhancing Agricultural Innovation: How to Go Beyond the Strengthening
of Research Systems. The World Bank; Washington DC. World Bank. (2015). World Bank Development Indicators. World Bank, Washington DC.
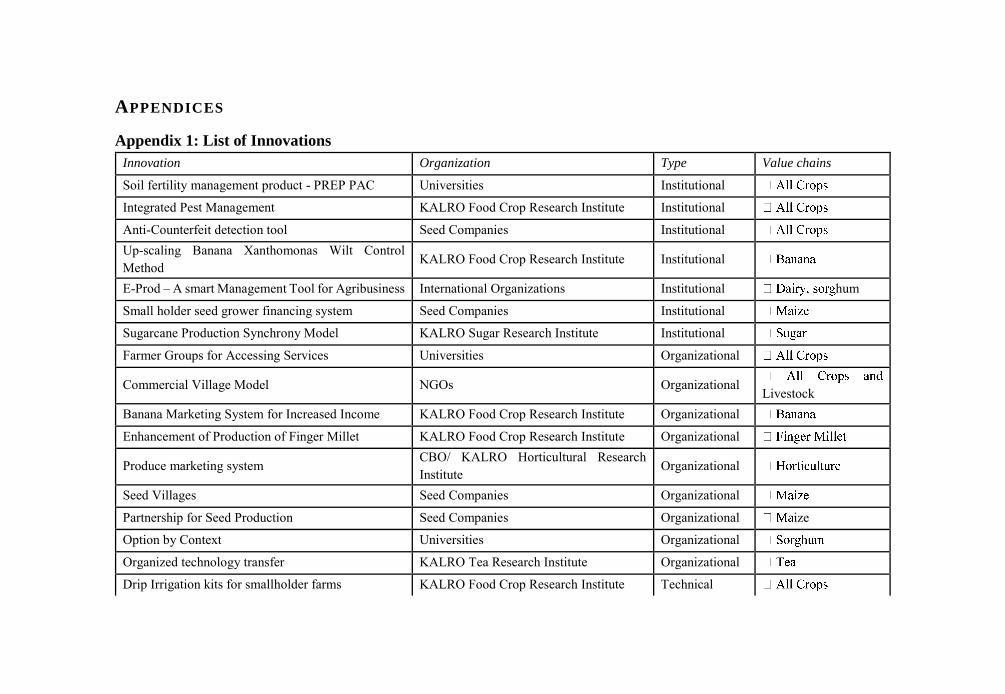
APPENDICES
Appendix 1: List of Innovations
Innovation Organization Type Value chains
Soil fertility management product - PREP PAC Universities Institutional
Integrated Pest Management KALRO Food Crop Research Institute Institutional
Anti-Counterfeit detection tool Seed Companies Institutional Up-scaling Banana Xanthomonas Wilt Control Method
KALRO Food Crop Research Institute Institutional
E-Prod – A smart Management Tool for Agribusiness International Organizations Institutional hum
Small holder seed grower financing system Seed Companies Institutional
Sugarcane Production Synchrony Model KALRO Sugar Research Institute Institutional
Farmer Groups for Accessing Services Universities Organizational
Commercial Village Model NGOs Organizational Livestock
Banana Marketing System for Increased Income KALRO Food Crop Research Institute Organizational
Enhancement of Production of Finger Millet KALRO Food Crop Research Institute Organizational
Produce marketing system CBO/ KALRO Horticultural Research Institute
Organizational
Seed Villages Seed Companies Organizational
Partnership for Seed Production Seed Companies Organizational ize
Option by Context Universities Organizational
Organized technology transfer KALRO Tea Research Institute Organizational
Drip Irrigation kits for smallholder farms KALRO Food Crop Research Institute Technical

78 PROGRAMME FOR ACCOMPANYING RESEARCH IN INNOVATION (PARI)
Grace Aliciana & Cerise Laurel varieties Universities Technical
Kijiji Motorized Chippers NGOs Technical
Commercialization of Bracharia planting material KALRO Food Crop Research Institute Technical Maize Cowpea Gruel Milk Mixture for pre weaner calves.
KALRO Industrial Crop Research Institute Technical
Hemp Cooling Technology for milk KALRO Sheep and Goat Research Institute
Technical
Natural Pasture Improvement through reseeding KALRO Arid and Range Land Research Institute
Technical
Supplementating Natural Pasture KALRO Arid and Range Land Research Institute
Technical
Kenya Mpya Variety KALRO Horticultural Research Institute Technical
Purple Gold Variety KALRO Horticultural Research Institute Technical
Asante New Variety KALRO Horticultural Research Institute Technical
Kenya Mavuno Variety KALRO Horticultural Research Institute Technical
Kenya Karibu Variety KALRO Horticultural Research Institute Technical
Sherekea Variety KALRO Horticultural Research Institute Technical
Use of Rice Husk as a source of Silicon KALRO Industrial Crop Research Institute Technical
The Hydrotiller KALRO Industrial Crop Research Institute Technical Integration of Macia with water harvesting and farmer Organization
KALRO Food Crop Research Institute Technical
KEN83-737 and D8484 KALRO Sugar Research Institute Technical
Fortified Yoghurts KALRO Tea Research Institute Technical
Molecular Tools for development of New Varieties KALRO Tea Research Institute Technical
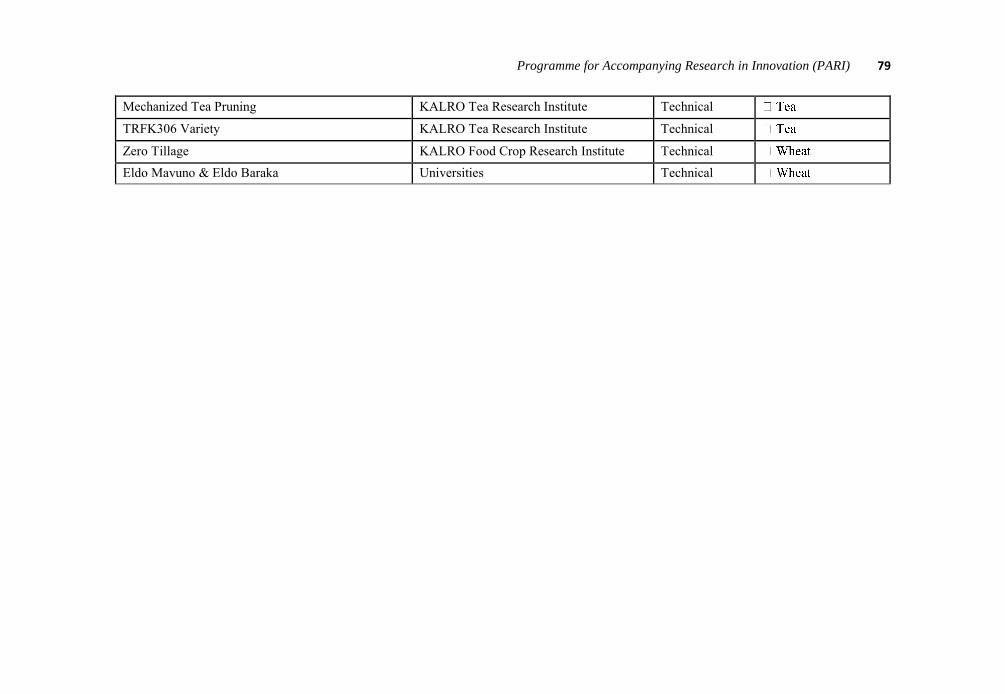
Programme for Accompanying Research in Innovation (PARI) 79
Mechanized Tea Pruning KALRO Tea Research Institute Technical
TRFK306 Variety KALRO Tea Research Institute Technical
Zero Tillage KALRO Food Crop Research Institute Technical Eldo Mavuno & Eldo Baraka Universities Technical
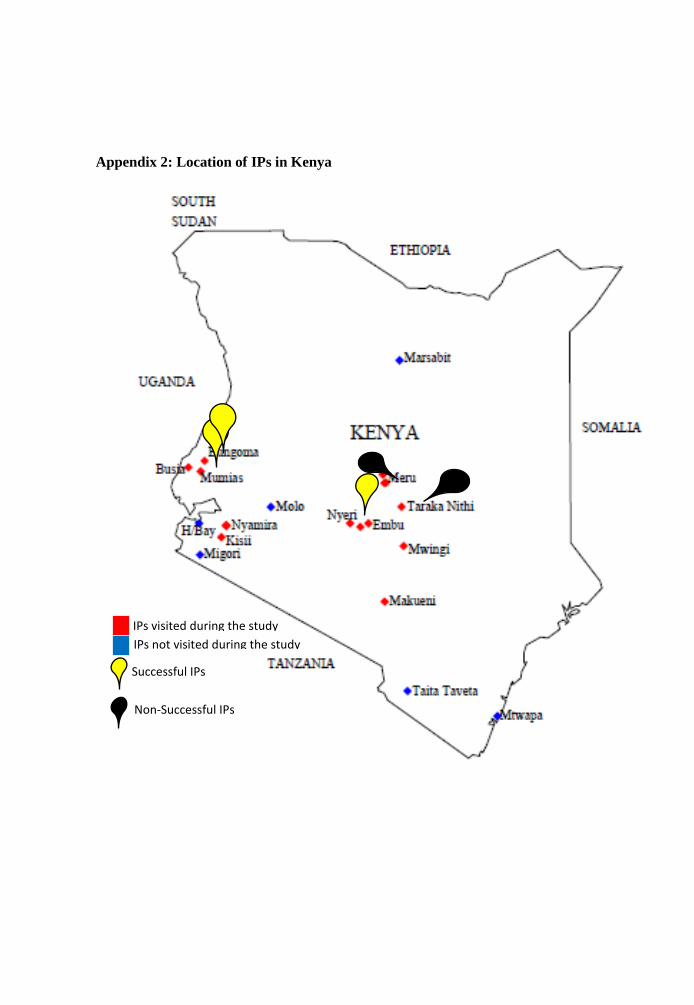
Appendix 2: Location of IPs in Kenya
IPs visited during the study
IPs not visited during the study
Successful IPs
Non-Successful IPs

Programme for Accompanying Research in Innovation (PARI) 81
Appendix 3: Summary of the Innovation platforms
Banana Value Chain Marketing
IP Name Banana Value Chain Marketing
Entry Point or VC Poor access and availability of clean planting materials Low production and productivity Poor marketing channels
Innovations (technical or
social and economic
innovations)
Technical Organizational
Location (name and GPS
coordinates in UTM or
degrees)
Nyamira County Governors Complex ,Third Floor wing A GPS -05741, 34.9355
Intervention areas
(regional/province/distric
Nyamira County
IP webpage: Not available
Participating villages 135 villages in 20 wards in Nyamira County
Date IP establishment 2013
Institutions setting up the
IP
ASDSP, County Department of Agriculture, AFFA, World Vision, USAID-KAVES (EAMDA and Farm Concern), Africa Harvest ,KALRO
Funding agents SIDA-ASDSP, County department of Agriculture, World Vision, Africa Harvest, KAVES
Number of years
activities on the ground
2
IP is still active or not Active
Facilitators (names and
contacts)
Yuvenalis Orange ASDSP Coordinator, Nyamira County Mobile Phone: (+254)722245454
Achievements to date Hardening nursery, production and marketing committees formed Functional vertical and horizontal linkages created Various groups trained 4 hardening nurseries established Market linkages created and enhanced Increased production and bunch quality Two marketing organizations registered
Challenges Partners failure to honour the pledges Poor resource mobilization skills among groups Conflict of interest
Sustainability issues Structures well established Capacity building workshops well planned
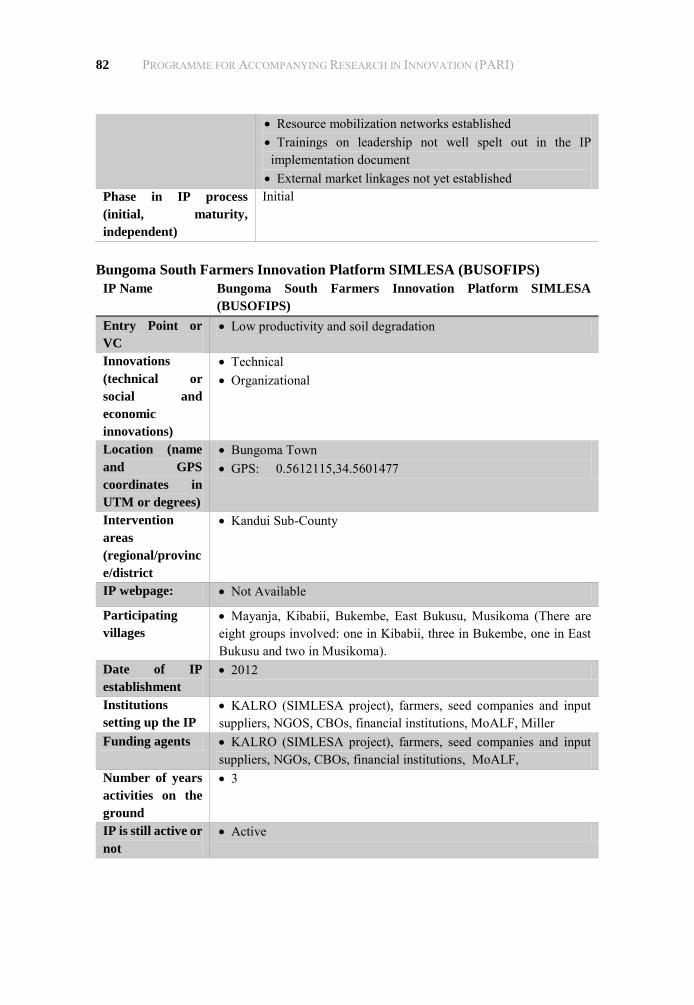
82 PROGRAMME FOR ACCOMPANYING RESEARCH IN INNOVATION (PARI)
Resource mobilization networks established Trainings on leadership not well spelt out in the IP implementation document External market linkages not yet established
Phase in IP process
(initial, maturity,
independent)
Initial
Bungoma South Farmers Innovation Platform SIMLESA (BUSOFIPS)
IP Name Bungoma South Farmers Innovation Platform SIMLESA
(BUSOFIPS)
Entry Point or
VC
Low productivity and soil degradation
Innovations
(technical or
social and
economic
innovations)
Technical Organizational
Location (name
and GPS
coordinates in
UTM or degrees)
Bungoma Town GPS: 0.5612115,34.5601477
Intervention
areas
(regional/provinc
e/district
Kandui Sub-County
IP webpage: Not Available
Participating
villages
Mayanja, Kibabii, Bukembe, East Bukusu, Musikoma (There are eight groups involved: one in Kibabii, three in Bukembe, one in East Bukusu and two in Musikoma).
Date of IP
establishment
2012
Institutions
setting up the IP
KALRO (SIMLESA project), farmers, seed companies and input suppliers, NGOS, CBOs, financial institutions, MoALF, Miller
Funding agents KALRO (SIMLESA project), farmers, seed companies and input suppliers, NGOs, CBOs, financial institutions, MoALF,
Number of years
activities on the
ground
3
IP is still active or
not
Active

Programme for Accompanying Research in Innovation (PARI) 83
Facilitators
(names and
contacts)
Roselyne Oside Juma +254 721 441397 David Simiyu + 254 721 998097
IP members
(regrouped by
VC actors and
sectors)
Still maintain the original value chain
Opportunities
addressed
Available conservation agriculture technologies Promotion of conservation agriculture technologies
Achievements to
date
Registration of the IP Yield increase for maize from 8 to 16 bags per acre and beans from
1 to 5 bags per acre More farmers have taken up conservation agriculture technologies
(herbicides, crop residues left on farm, cover crops, and fodder crops.)
Wrote a proposal to ASDSP, which was funded Farmer group plans and holds demonstrations and field days linkage to buyer Forum used by institutions for demonstrations Market surplus
Challenges Non commitment of members Leadership problems
Sustainability
issues
Smoothly transitioning from initiator to the members
Phase in IP
process (initial,
maturity,
independent)
Maturity
Dairy Processing and Marketing
IP Name Dairy processing and Marketing
Entry Point or VC Poor marketing channels
Innovations (technical or
social and economic
innovations)
Organizational
Location (name and GPS
coordinates in UTM or
degrees)
Nyamira County Governors Complex ,Third Floor wing A GPS -0.5741, 34.9355
Intervention areas
(regional/province/district
Nyamira County
IP webpage: Not available

84 PROGRAMME FOR ACCOMPANYING RESEARCH IN INNOVATION (PARI)
Participating villages 125 villages in 20 Wards in Nyamira County
Date of IP establishment 2013
Institutions setting up the
IP
ASDSP, County department of Livestock, USAID-KAVES (EAMDA ), KENAFF, Farmer group
Funding agents SIDA-ASDSP, County department of Livestock, KENAFF, USAID- KAVES
Number of years activities
on the ground
2
IP is still active or not Active
Facilitators (names and
contacts)
Yuvenalis Orenge ASDSP Coordinator, Nyamira County Mobile Phone: (+254)72245454
Opportunities addressed Available milk market
Achievements to date A county apex cooperative formed Functional linkages created Establishment of 2 milk collectioncentres Animal health association formed Functional linkages created 10,000 dairy cows served Increased milk yield Increased acreage for fodder and pasture crops
Challenges Partners’ failure to honour the pledges Poor resource mobilization skills among groups Poor cohesion among some group members.
Sustainability issues Structures well established Capacity building workshops well planned Resource mobilization networks established Trainings on leadership not well spelt out in the IP
implementation document External market linkages not yet established
Phase in IP process (initial,
maturity, independent)
Initial stage
Embu QPM Innovation Platform
IP Name Embu QPM Innovation Platform
Entry Point or VC Access to alternative protein source to the resource poor farmer (small scale farmers)
Innovations (technical or social
and economic innovations)
Technological

Programme for Accompanying Research in Innovation (PARI) 85
Location (name and GPS
coordinates in UTM or
degrees)
Manyatta division, Embu county. GPS: -0.4294069,37.4738825
Intervention areas
(regional/province/district/…)
Embu county
IP webpage: Not Available
Participating villages Makengi, Ena, Itabua, Mutwovalle (over 100 farmers were involved in thi work)
Date of IP establishment 2003
Institutions setting up the IP CIMMYT, KALRO, Catholic Relief Services-Diocese of Embu
Funding agents CIMMYT (QPMD), KAPP, KALRO
Number of years activities on
the ground
10
IP is still active or not Active
Facilitators (names and
contacts)
Dr Mutinda, Research Scientist, KALRO Embu Mobile Phone: 0723533193
Opportunities addressed QPM seed availability
Achievements to date 2 seed companies licensed to market for production (Freshco, Westrern seed)
Maize has diversified from food to feed (pigs and chicken)
Through QPM - managed to increase and stabilize maize production at 30%
Networking with Ministry of Health-Embu to avail QPM to lactating mothers and for weaning babies
100,000 tonnes of QPM seed sold in the region (ECA countries- ASARECA)
Managed to produce 500 tonnes of QPM annually in Embu.
Challenges Lack of maintenance of QPM villages for seed production. (organizational issues)
Sustainability issues Mechanisms for seed production in sufficient quantities not established.
Diversified utilization of QPM maize will encourage private companies to produce the seed
Phase in IP process (initial,
maturity, independent)
Independent
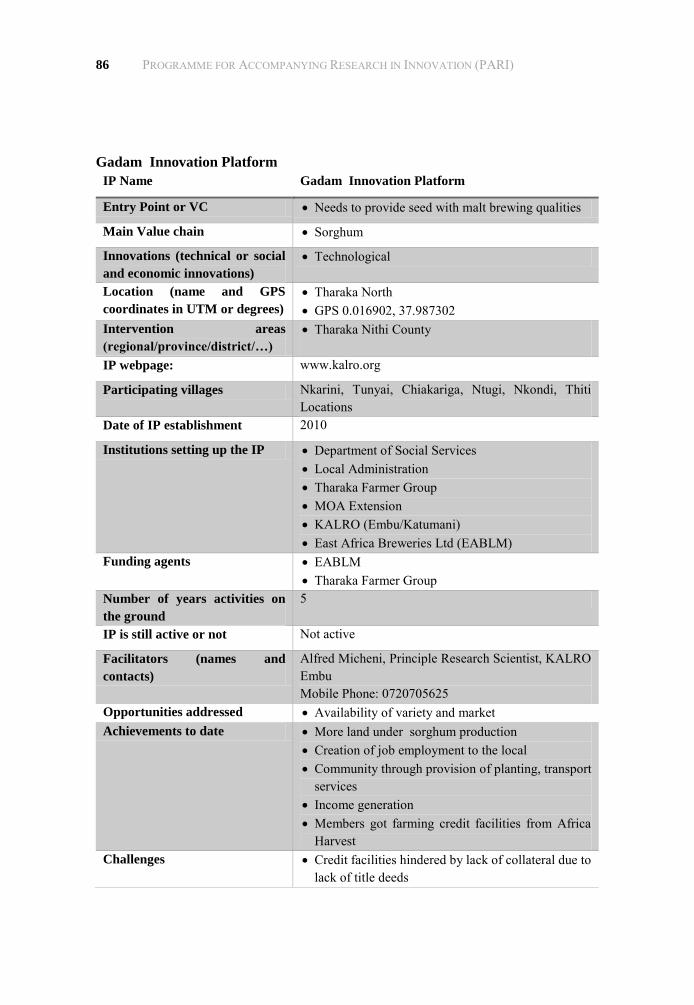
86 PROGRAMME FOR ACCOMPANYING RESEARCH IN INNOVATION (PARI)
Gadam Innovation Platform
IP Name Gadam Innovation Platform
Entry Point or VC Needs to provide seed with malt brewing qualities
Main Value chain Sorghum
Innovations (technical or social
and economic innovations)
Technological
Location (name and GPS
coordinates in UTM or degrees)
Tharaka North GPS 0.016902, 37.987302
Intervention areas
(regional/province/district/…)
Tharaka Nithi County
IP webpage: www.kalro.org
Participating villages Nkarini, Tunyai, Chiakariga, Ntugi, Nkondi, Thiti Locations
Date of IP establishment 2010
Institutions setting up the IP Department of Social Services Local Administration Tharaka Farmer Group MOA Extension KALRO (Embu/Katumani) East Africa Breweries Ltd (EABLM)
Funding agents EABLM Tharaka Farmer Group
Number of years activities on
the ground
5
IP is still active or not Not active
Facilitators (names and
contacts)
Alfred Micheni, Principle Research Scientist, KALRO Embu Mobile Phone: 0720705625
Opportunities addressed Availability of variety and market Achievements to date More land under sorghum production
Creation of job employment to the local Community through provision of planting, transport
services Income generation Members got farming credit facilities from Africa
Harvest Challenges Credit facilities hindered by lack of collateral due to
lack of title deeds

Programme for Accompanying Research in Innovation (PARI) 87
Sustainability issues Marketing contracts were not signed hence the collapse of the marketing chain
Alternative food sources need to be introduced to minimize diverting the malting sorghum
Phase in IP process (initial,
maturity, independent)
Maturity
Geeto/Mweru SIMLESA Innovation Platform
IP Name Geeto/Mweru SIMLESA Innovation Platform
Entry Point or VC Need to improve maize and bean production under conservation agriculture practices
Main Value chain Maize and Beans
Innovations (technical
or social and economic
innovations)
Technological
Location (name and
GPS coordinates in
UTM or degrees)
Mweru location, Igoji East Ward in Meru County. GPS: 0.1743333, 37.7268333
Intervention areas
(regional/province/dist
rict/…)
Meru County
IP webpage: www.kalro.org
Participating villages 8 villages involved in Igoji East Ward
Date of IP
establishment
2013
Institutions setting up
the IP
Geeto/Mweru farmer group Local administration MoA Extension KALRO (Embu) Equity bank Panner seed company
Funding agents SIMLESA Program Geeto/Mweru Farmer Group
Number of years
activities on the ground
2
IP is still active or not Active
Facilitators (names
and contacts)
Alfred Micheni, Principle Research Scientist, KALRO Embu Mobile Phone: 0720705625
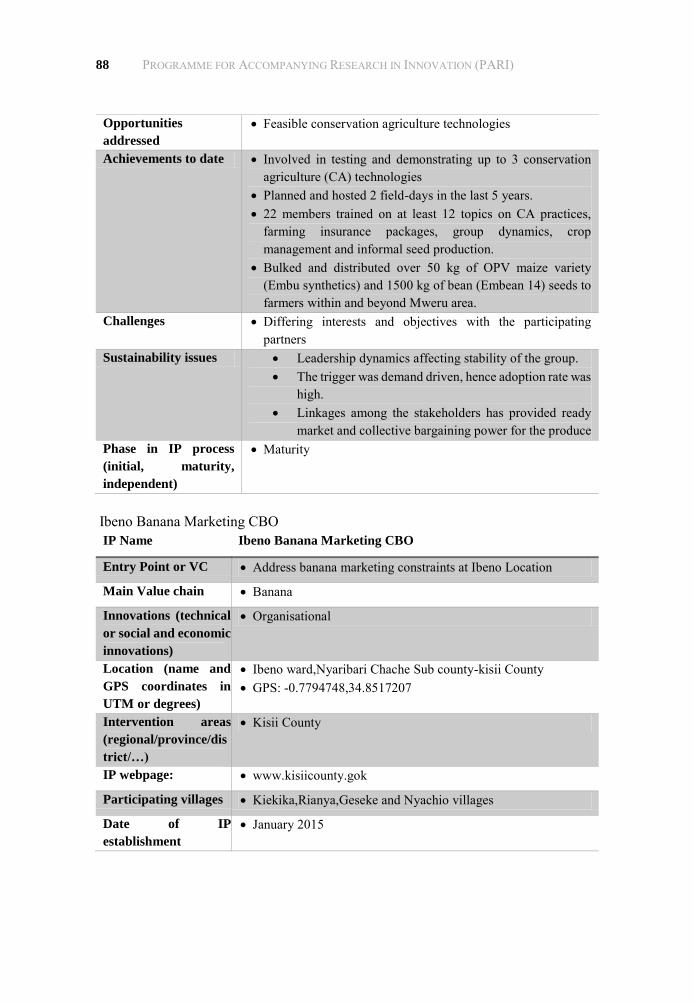
88 PROGRAMME FOR ACCOMPANYING RESEARCH IN INNOVATION (PARI)
Opportunities
addressed
Feasible conservation agriculture technologies
Achievements to date Involved in testing and demonstrating up to 3 conservation agriculture (CA) technologies
Planned and hosted 2 field-days in the last 5 years. 22 members trained on at least 12 topics on CA practices,
farming insurance packages, group dynamics, crop management and informal seed production.
Bulked and distributed over 50 kg of OPV maize variety (Embu synthetics) and 1500 kg of bean (Embean 14) seeds to farmers within and beyond Mweru area.
Challenges Differing interests and objectives with the participating partners
Sustainability issues Leadership dynamics affecting stability of the group. The trigger was demand driven, hence adoption rate was
high. Linkages among the stakeholders has provided ready
market and collective bargaining power for the produce Phase in IP process
(initial, maturity,
independent)
Maturity
Ibeno Banana Marketing CBO
IP Name Ibeno Banana Marketing CBO
Entry Point or VC Address banana marketing constraints at Ibeno Location
Main Value chain Banana
Innovations (technical
or social and economic
innovations)
Organisational
Location (name and
GPS coordinates in
UTM or degrees)
Ibeno ward,Nyaribari Chache Sub county-kisii County GPS: -0.7794748,34.8517207
Intervention areas
(regional/province/dis
trict/…)
Kisii County
IP webpage: www.kisiicounty.gok
Participating villages Kiekika,Rianya,Geseke and Nyachio villages
Date of IP
establishment
January 2015
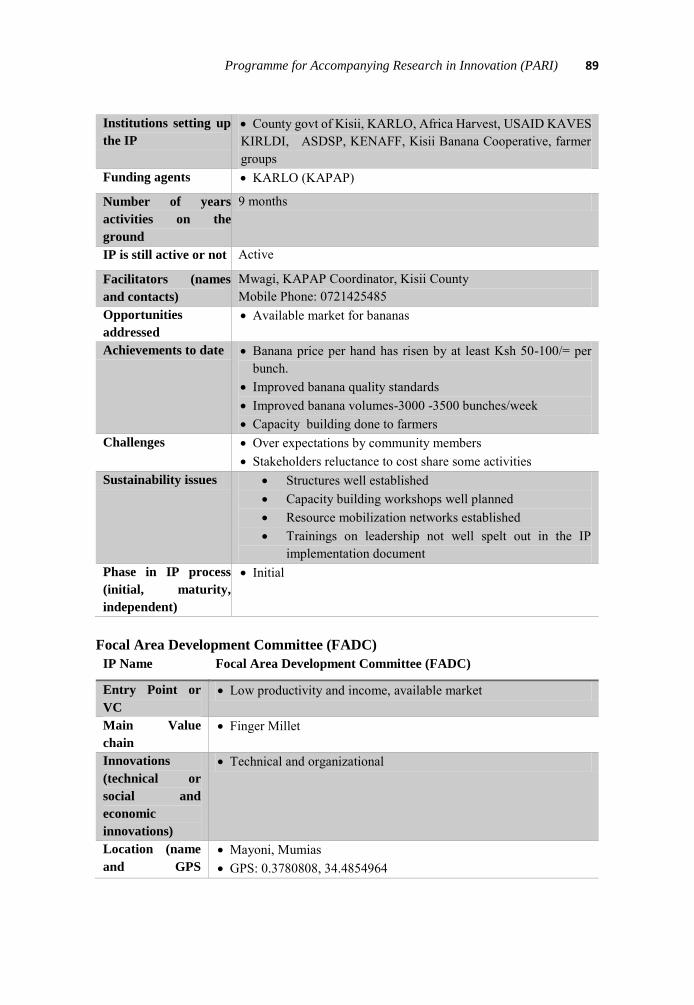
Programme for Accompanying Research in Innovation (PARI) 89
Institutions setting up
the IP
County govt of Kisii, KARLO, Africa Harvest, USAID KAVES KIRLDI, ASDSP, KENAFF, Kisii Banana Cooperative, farmer groups
Funding agents KARLO (KAPAP)
Number of years
activities on the
ground
9 months
IP is still active or not Active
Facilitators (names
and contacts)
Mwagi, KAPAP Coordinator, Kisii County Mobile Phone: 0721425485
Opportunities
addressed
Available market for bananas
Achievements to date Banana price per hand has risen by at least Ksh 50-100/= per bunch.
Improved banana quality standards Improved banana volumes-3000 -3500 bunches/week Capacity building done to farmers
Challenges Over expectations by community members Stakeholders reluctance to cost share some activities
Sustainability issues Structures well established Capacity building workshops well planned Resource mobilization networks established Trainings on leadership not well spelt out in the IP
implementation document Phase in IP process
(initial, maturity,
independent)
Initial
Focal Area Development Committee (FADC)
IP Name Focal Area Development Committee (FADC)
Entry Point or
VC
Low productivity and income, available market
Main Value
chain
Finger Millet
Innovations
(technical or
social and
economic
innovations)
Technical and organizational
Location (name
and GPS
Mayoni, Mumias GPS: 0.3780808, 34.4854964
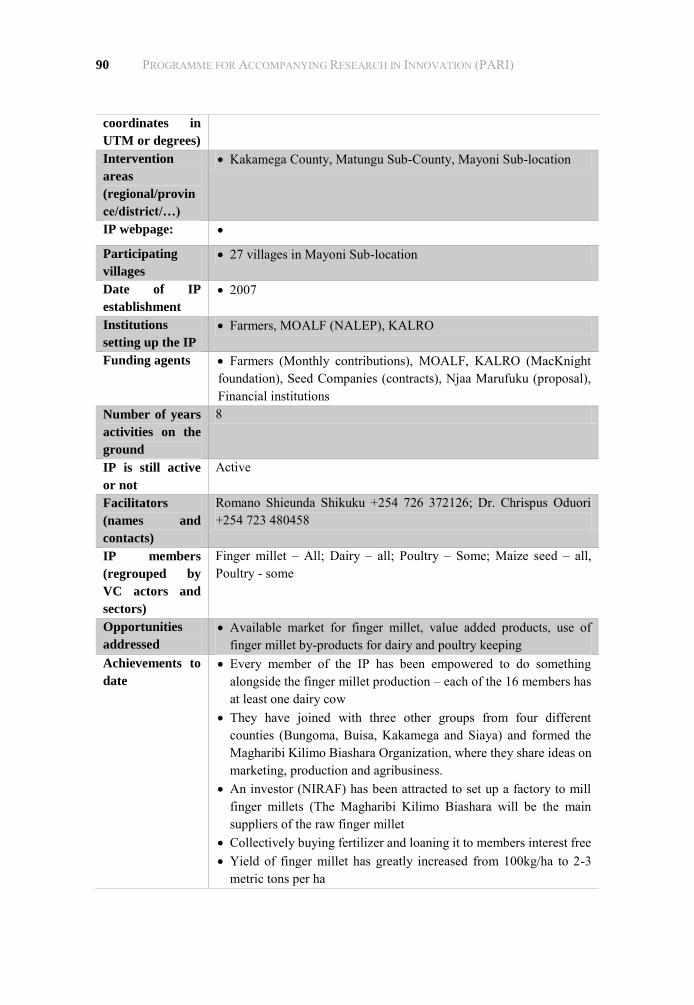
90 PROGRAMME FOR ACCOMPANYING RESEARCH IN INNOVATION (PARI)
coordinates in
UTM or degrees)
Intervention
areas
(regional/provin
ce/district/…)
Kakamega County, Matungu Sub-County, Mayoni Sub-location
IP webpage:
Participating
villages
27 villages in Mayoni Sub-location
Date of IP
establishment
2007
Institutions
setting up the IP
Farmers, MOALF (NALEP), KALRO
Funding agents Farmers (Monthly contributions), MOALF, KALRO (MacKnight foundation), Seed Companies (contracts), Njaa Marufuku (proposal), Financial institutions
Number of years
activities on the
ground
8
IP is still active
or not
Active
Facilitators
(names and
contacts)
Romano Shieunda Shikuku +254 726 372126; Dr. Chrispus Oduori +254 723 480458
IP members
(regrouped by
VC actors and
sectors)
Finger millet – All; Dairy – all; Poultry – Some; Maize seed – all, Poultry - some
Opportunities
addressed
Available market for finger millet, value added products, use of finger millet by-products for dairy and poultry keeping
Achievements to
date
Every member of the IP has been empowered to do something alongside the finger millet production – each of the 16 members has at least one dairy cow
They have joined with three other groups from four different counties (Bungoma, Buisa, Kakamega and Siaya) and formed the Magharibi Kilimo Biashara Organization, where they share ideas on marketing, production and agribusiness.
An investor (NIRAF) has been attracted to set up a factory to mill finger millets (The Magharibi Kilimo Biashara will be the main suppliers of the raw finger millet
Collectively buying fertilizer and loaning it to members interest free Yield of finger millet has greatly increased from 100kg/ha to 2-3
metric tons per ha

Programme for Accompanying Research in Innovation (PARI) 91
Pool the finger millet and negotiate for a higher price.
Challenges Leadership challenges Financing challenges Marketing challenges
Sustainability
issues
Sustainable – Management and funding of the IP has transitioned from the initiators to the central players; have diversified VCs and funding sources
Phase in IP
process (initial,
maturity,
independent)
Independent
Mbaringo Commercial Village
IP Name Mbaringo Commercial Village
Entry Point or VC Lack of marketing structures and improved varieties
Main Value chain All crops
Innovations (technical or
social and economic
innovations)
Organizational
Location (name and GPS
coordinates in UTM or
degrees)
Kieni Sub-County GPS: 0.5338135,37.1202868
Intervention areas
(regional/province/district/…
)
Kieni Sub county
IP webpage: [email protected]
Participating villages 35 commercial villages in Kieni East and Kieni West
Date of IP establishment 2010
Institutions setting up the IP Farmers’ groups, input suppliers, seed companies, financial institutions, Ministry of Agriculture, Livestock and Fisheries, county government, Farm Concern
Funding agents Farm Concern
Number of years activities on
the ground
4
IP is still active or not Active
Facilitators (names and
contacts)
Bernard Kimotho, Kieni site coordinator Mobile Phone: 0715408616
Opportunities addressed Availability of improved varieties Achievements to date 35 commercial villages established
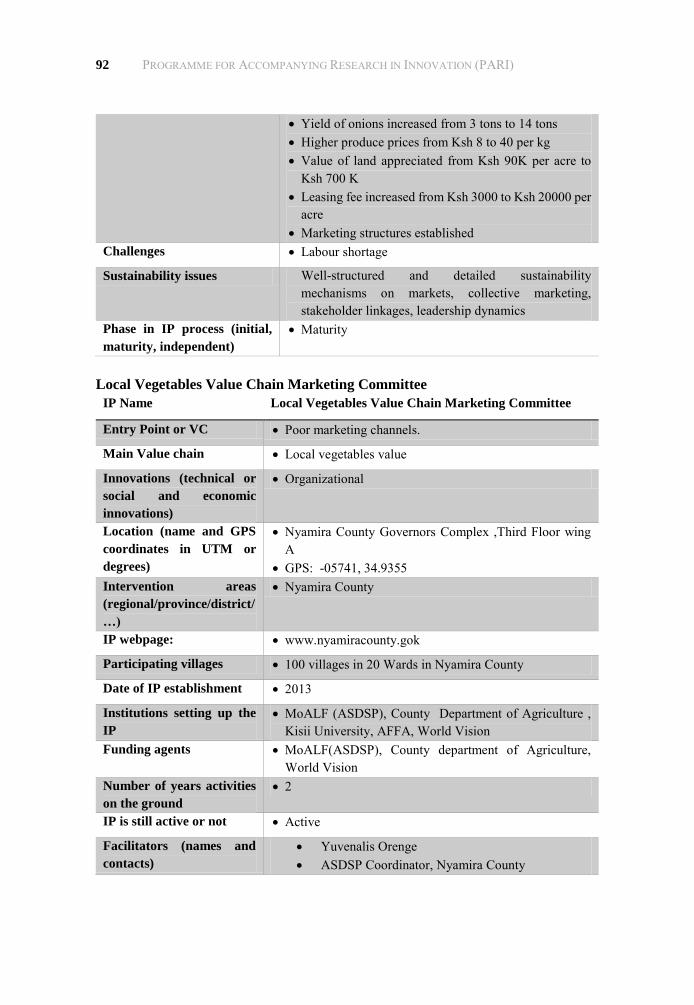
92 PROGRAMME FOR ACCOMPANYING RESEARCH IN INNOVATION (PARI)
Yield of onions increased from 3 tons to 14 tons Higher produce prices from Ksh 8 to 40 per kg Value of land appreciated from Ksh 90K per acre to
Ksh 700 K Leasing fee increased from Ksh 3000 to Ksh 20000 per
acre Marketing structures established
Challenges Labour shortage
Sustainability issues Well-structured and detailed sustainability mechanisms on markets, collective marketing, stakeholder linkages, leadership dynamics
Phase in IP process (initial,
maturity, independent)
Maturity
Local Vegetables Value Chain Marketing Committee
IP Name Local Vegetables Value Chain Marketing Committee
Entry Point or VC Poor marketing channels.
Main Value chain Local vegetables value
Innovations (technical or
social and economic
innovations)
Organizational
Location (name and GPS
coordinates in UTM or
degrees)
Nyamira County Governors Complex ,Third Floor wing A
GPS: -05741, 34.9355 Intervention areas
(regional/province/district/
…)
Nyamira County
IP webpage: www.nyamiracounty.gok
Participating villages 100 villages in 20 Wards in Nyamira County
Date of IP establishment 2013
Institutions setting up the
IP
MoALF (ASDSP), County Department of Agriculture , Kisii University, AFFA, World Vision
Funding agents MoALF(ASDSP), County department of Agriculture, World Vision
Number of years activities
on the ground
2
IP is still active or not Active
Facilitators (names and
contacts)
Yuvenalis Orenge ASDSP Coordinator, Nyamira County
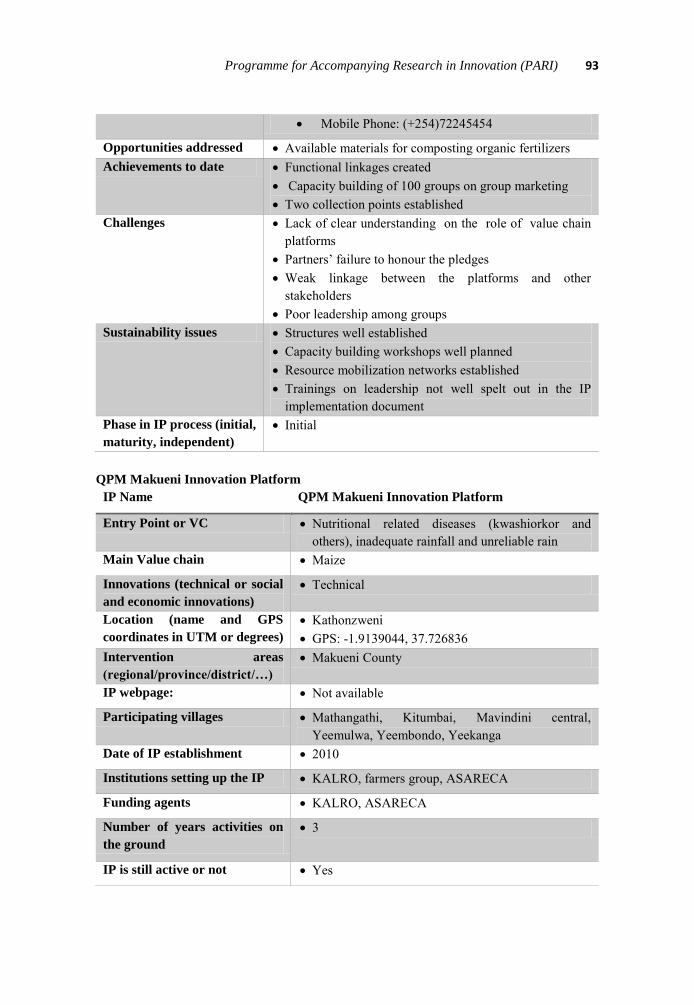
Programme for Accompanying Research in Innovation (PARI) 93
Mobile Phone: (+254)72245454
Opportunities addressed Available materials for composting organic fertilizers Achievements to date Functional linkages created
Capacity building of 100 groups on group marketing Two collection points established
Challenges Lack of clear understanding on the role of value chain platforms
Partners’ failure to honour the pledges Weak linkage between the platforms and other
stakeholders Poor leadership among groups
Sustainability issues Structures well established Capacity building workshops well planned Resource mobilization networks established Trainings on leadership not well spelt out in the IP
implementation document Phase in IP process (initial,
maturity, independent)
Initial
QPM Makueni Innovation Platform
IP Name QPM Makueni Innovation Platform
Entry Point or VC Nutritional related diseases (kwashiorkor and others), inadequate rainfall and unreliable rain
Main Value chain Maize
Innovations (technical or social
and economic innovations)
Technical
Location (name and GPS
coordinates in UTM or degrees)
Kathonzweni GPS: -1.9139044, 37.726836
Intervention areas
(regional/province/district/…)
Makueni County
IP webpage: Not available
Participating villages Mathangathi, Kitumbai, Mavindini central, Yeemulwa, Yeembondo, Yeekanga
Date of IP establishment 2010
Institutions setting up the IP KALRO, farmers group, ASARECA
Funding agents KALRO, ASARECA
Number of years activities on
the ground
3
IP is still active or not Yes
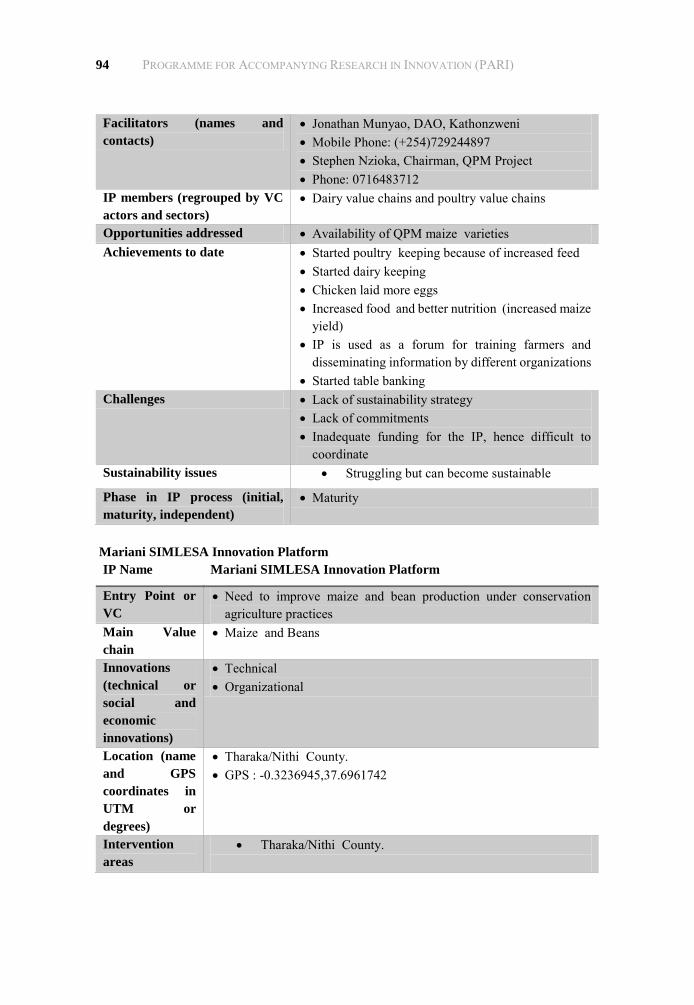
94 PROGRAMME FOR ACCOMPANYING RESEARCH IN INNOVATION (PARI)
Facilitators (names and
contacts)
Jonathan Munyao, DAO, Kathonzweni Mobile Phone: (+254)729244897 Stephen Nzioka, Chairman, QPM Project Phone: 0716483712
IP members (regrouped by VC
actors and sectors)
Dairy value chains and poultry value chains
Opportunities addressed Availability of QPM maize varieties Achievements to date Started poultry keeping because of increased feed
Started dairy keeping Chicken laid more eggs Increased food and better nutrition (increased maize
yield) IP is used as a forum for training farmers and
disseminating information by different organizations Started table banking
Challenges Lack of sustainability strategy Lack of commitments Inadequate funding for the IP, hence difficult to
coordinate Sustainability issues Struggling but can become sustainable
Phase in IP process (initial,
maturity, independent)
Maturity
Mariani SIMLESA Innovation Platform
IP Name Mariani SIMLESA Innovation Platform
Entry Point or
VC
Need to improve maize and bean production under conservation agriculture practices
Main Value
chain
Maize and Beans
Innovations
(technical or
social and
economic
innovations)
Technical Organizational
Location (name
and GPS
coordinates in
UTM or
degrees)
Tharaka/Nithi County. GPS : -0.3236945,37.6961742
Intervention
areas
Tharaka/Nithi County.

Programme for Accompanying Research in Innovation (PARI) 95
(regional/provin
ce/district/…)
IP webpage: Not available
Participating
villages
9 villages involved in Chuka ward
Date of IP
establishment
2011
Institutions
setting up the IP
Mariani farmer group, local administration, MoA Extension, Tharaka/Nithi County Government; Ministry of Agriculture, KALRO (Embu), Kilimo Salama Insurance Company
Funding agents SIMLESA Program, Mariani Farmer Group
Number of
years activities
on the ground
4
IP is still active
or not
Active
Facilitators
(names and
contacts)
Alfred Micheni, Principle Research Scientist, KALRO Embu Mobile Phone: 0720705625
Opportunities
addressed
Feasible conservation agriculture technologies available Newly released high yielding maize and bean varieties
Achievements to
date
Involved in testing and demonstrating up to 3 conservation agriculture (CA) technologies
Planned and hosted 2 field-days in the last 5 years. 20 members trained on at least 12 topics on CA practices, farming
insurance packages, group dynamics, crop management and informal seed production.
Participated in SIMLESA 12 M&E events of on-farm tested technologies
Bulked and distributed over 1000 kg of OPV maize variety (Embu synthetics) and 2500 kg of bean (Embean 14) seeds to farmers within and beyond Mariani area.
20 members toured other regions Prepared constitutional documents Hosted over 30 visitors on behalf KALRO and SIMLESA program Farmers: improved land productivity and socio welfare
Challenges Differing interests and objectives with the participating partners. High expectations from some members Needs for extra time and resources. Some funds are needed to start
off and steer the IP forwards. Additionally, the whole process is time
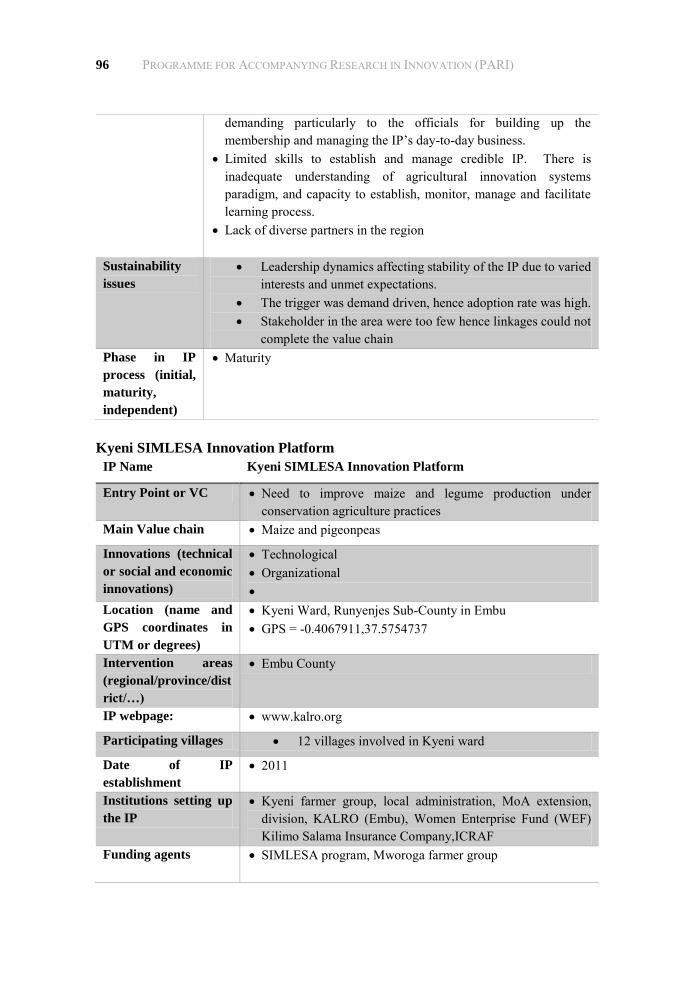
96 PROGRAMME FOR ACCOMPANYING RESEARCH IN INNOVATION (PARI)
demanding particularly to the officials for building up the membership and managing the IP’s day-to-day business.
Limited skills to establish and manage credible IP. There is inadequate understanding of agricultural innovation systems paradigm, and capacity to establish, monitor, manage and facilitate learning process.
Lack of diverse partners in the region
Sustainability
issues
Leadership dynamics affecting stability of the IP due to varied interests and unmet expectations.
The trigger was demand driven, hence adoption rate was high. Stakeholder in the area were too few hence linkages could not
complete the value chain Phase in IP
process (initial,
maturity,
independent)
Maturity
Kyeni SIMLESA Innovation Platform
IP Name Kyeni SIMLESA Innovation Platform
Entry Point or VC Need to improve maize and legume production under conservation agriculture practices
Main Value chain Maize and pigeonpeas
Innovations (technical
or social and economic
innovations)
Technological Organizational
Location (name and
GPS coordinates in
UTM or degrees)
Kyeni Ward, Runyenjes Sub-County in Embu GPS = -0.4067911,37.5754737
Intervention areas
(regional/province/dist
rict/…)
Embu County
IP webpage: www.kalro.org
Participating villages 12 villages involved in Kyeni ward
Date of IP
establishment
2011
Institutions setting up
the IP
Kyeni farmer group, local administration, MoA extension, division, KALRO (Embu), Women Enterprise Fund (WEF) Kilimo Salama Insurance Company,ICRAF
Funding agents SIMLESA program, Mworoga farmer group

Programme for Accompanying Research in Innovation (PARI) 97
Number of years
activities on the
ground
3
IP is still active or not Not Active
Facilitators (names
and contacts)
Alfred Micheni, Principle Research Scientist, KALRO Embu Mobile Phone: 0720705625
Opportunities
addressed
Feasible conservation agriculture technologies available Newly released high yielding maize and legume varieties
Achievements to date Involved in testing and demonstrating up to 3 conservation agriculture (CA) technologies
Members trained on at least 4 topics on CA practices, farming insurance packages, group dynamics, crop management and informal seed production.
Challenges Differing interests and objectives with the participating partners.
High expectations from some members Limited skills to establish and manage credible local
innovation platforms. Lack diverse partners in the region
Sustainability issues Leadership dynamics affecting stability of the IP due to varied interests and unmet expectations.
Stakeholder in the area were too few hence linkages could not complete the value chain to benefit the farmers
Phase in IP process
(initial, maturity,
independent)
Collapsed
Mwingi Bee Keepers Farmer Group
IP Name Mwingi Bee Keepers Farmer Group
Entry Point or VC Exploitation by middle men/brokers
Main Value chain Honey
Innovations (technical or social
and economic innovations)
Organizational
Location (name and GPS
coordinates in UTM or degrees)
Mwingi Town GPS: -0.9351009,38.0621039
Intervention areas
(regional/province/district/…)
Kitui County - Mwingi Sub-County,
IP webpage: www.kalro.org
Participating villages Minwani, Nuu, Nguni, Ngomeni, Kyuso, Mumoni, Mwingi Central and Tseukuru (8 villages)

98 PROGRAMME FOR ACCOMPANYING RESEARCH IN INNOVATION (PARI)
Date of IP establishment Before 2005
Institutions setting up the IP Mwingi Bee Keepers.(farmers), ICIPE,
Funding agents Farmers, ICIPE, IFAD, British High Commission, IFAD, Toyota, KOAN
Number of years activities on the
ground
Over 10 years
IP is still active or not Yes
Facilitators (names and contacts) David Kilonzi, Vice chairman, Mwingi Bee Keepers
Mobile Phone: (+254)712182909 IP members (regrouped by VC
actors and sectors)
All concentrating on honey
Opportunities addressed Collective marketing for higher price Achievements to date Moved from a self-help group to a CBO then to a
cooperative High income from honey for the farmers due to
good bargaining power Income generation and employment opportunities
Challenges Corrupt officials – steal from the group leaving it broke (Lack of integrity and transparency
Lack of expertise in managing the group Sustainability issues Have transformed themselves into a cooperative
society Phase in IP process (initial,
maturity, independent)
Independent
Mworoga SIMLESA Innovation Platform
IP Name Mworoga SIMLESA Innovation Platform
Entry Point or VC Need to improve maize and legume production under conservation agriculture practices
Main Value chain Maize and pigeon peas
Innovations (technical
or social and economic
innovations)
Technological Organizational
Location (name and
GPS coordinates in
UTM or degrees)
Mworoga Location, Igoji Ward in Meru County. GPS = 0.1813333, 37.75317

Programme for Accompanying Research in Innovation (PARI) 99
Intervention areas
(regional/province/distr
ict/…)
Meru County
IP webpage: www.kalro.org
Participating villages 3 villages in Igoji
Date of IP establishment 2011
Institutions setting up
the IP
Mworoga farmer group, local administration, MoA extension, division, KALRO (Embu), Women Enterprise Fund (WEF)
Funding agents SIMLESA program, Mworoga farmer group
Number of years
activities on the ground
3
IP is still active or not Not Active
Facilitators (names and
contacts)
Alfred Micheni, Principle Research Scientist, KALRO Embu
Mobile Phone: 0720705625 Opportunities
addressed
Feasible conservation agriculture technologies available Newly released high yielding maize and legume varieties
Achievements to date Involved in testing and demonstrating up to 3 conservation agriculture (CA) technologies
Members trained on at least 4 topics on CA practices, farming insurance packages, group dynamics, crop management and informal seed production.
Challenges Differing interests and objectives with the participating partners.
High expectations from some members Limited skills to establish and manage credible local
innovation platforms. Lack diverse partners in the region
Sustainability issues • Leadership dynamics affecting stability of the IP due to varied interests and unmet expectations. • Stakeholder in the area were too few hence linkages could not complete the value chain to benefit the farmers
Phase in IP process
(initial, maturity,
independent)
Collapsed