Status CWE Flow-Based Project
22
Status CWE Flow-Based Project European Market Design Working Group September 16 th 2013
Transcript of Status CWE Flow-Based Project

Status CWE Flow-Based Project
European Market Design Working GroupSeptember 16th 2013

2
Agenda
Status of FB Project
FB Project Planning
FB Market Coupling Fundamentals
External Parallel Run - Results
Next Steps
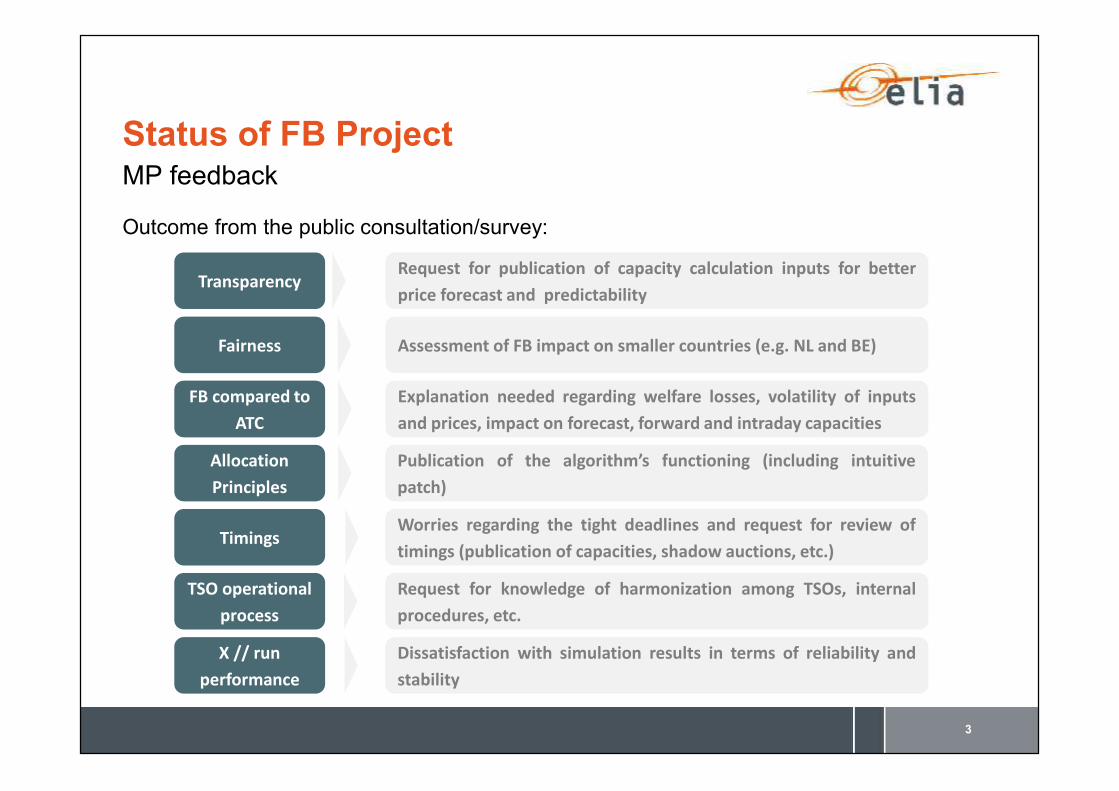
Status of FB ProjectMP feedback
3
Outcome from the public consultation/survey:
Request for publication of capacity calculation inputs for betterprice forecast and predictability
Assessment of FB impact on smaller countries (e.g. NL and BE)
Explanation needed regarding welfare losses, volatility of inputsand prices, impact on forecast, forward and intraday capacities
Transparency
Fairness
FB compared toATC
Publication of the algorithm’s functioning (including intuitivepatch)
Worries regarding the tight deadlines and request for review oftimings (publication of capacities, shadow auctions, etc.)
Request for knowledge of harmonization among TSOs, internalprocedures, etc.
AllocationPrinciples
Timings
TSO operationalprocess
Dissatisfaction with simulation results in terms of reliability andstability
X // runperformance

The raised concerns will be addressed during the upcoming Flow-Based User Groupmeetings and next CWE FB MC Market Forum on October 10th in Brussels
Additionally, MPs will be provided with a written communication on all questions
Project Partners will also communicate the CWE Project Planning, including foreseen GoLive Date, before the end of September and the start of the yearly auctions to themarket
In parallel, Project Partners are preparing the switch to the daily parallel run publication,supposed to start before the end of the year
Status of FB ProjectMP feedback

Status of FB ProjectStabilization of the external parallel run
5
• New prototype version
• Computation time decrease to about 20 min (instead of several hours)
• Higher number of representative FB domains for which FB/FBI market results aresimulated and published
• Still some learning, and consequently fine-tuning (see results for weeks 32 and 33)
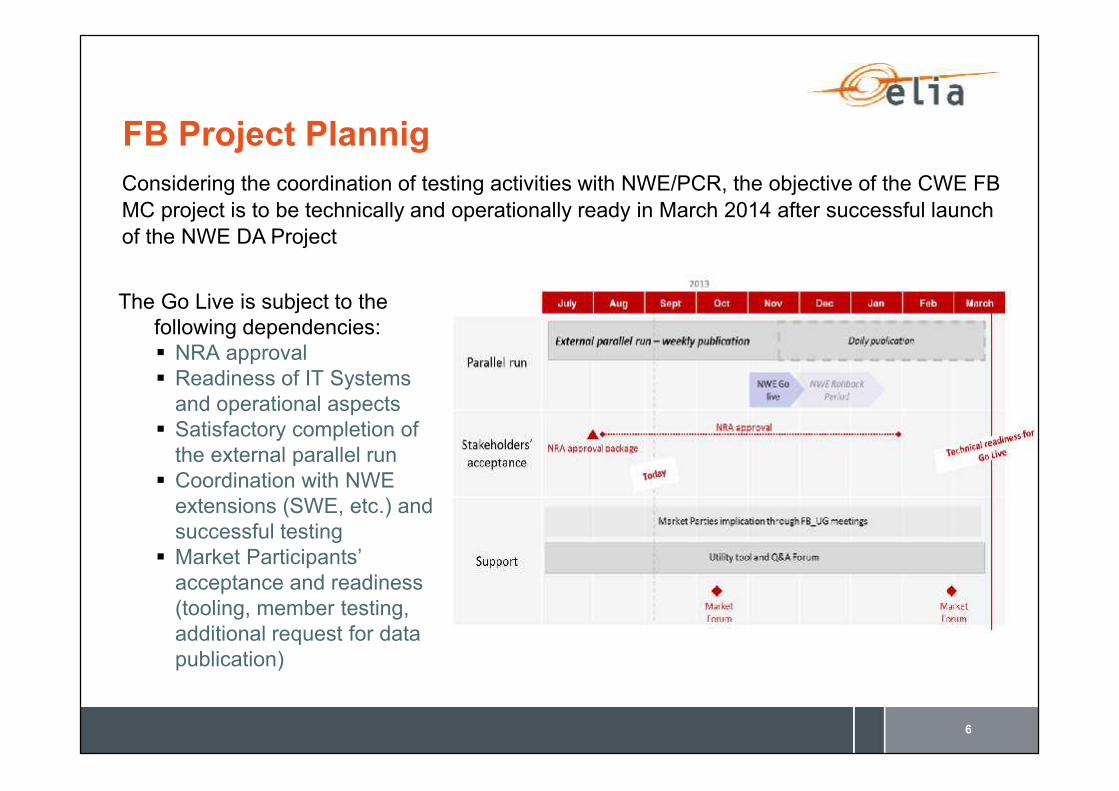
FB Project Plannig
6
Considering the coordination of testing activities with NWE/PCR, the objective of the CWE FBMC project is to be technically and operationally ready in March 2014 after successful launchof the NWE DA Project
The Go Live is subject to thefollowing dependencies: NRA approval Readiness of IT Systems
and operational aspects Satisfactory completion of
the external parallel run Coordination with NWE
extensions (SWE, etc.) andsuccessful testing Market Participants’
acceptance and readiness(tooling, member testing,additional request for datapublication)
FB Market Coupling Fundamentals
7
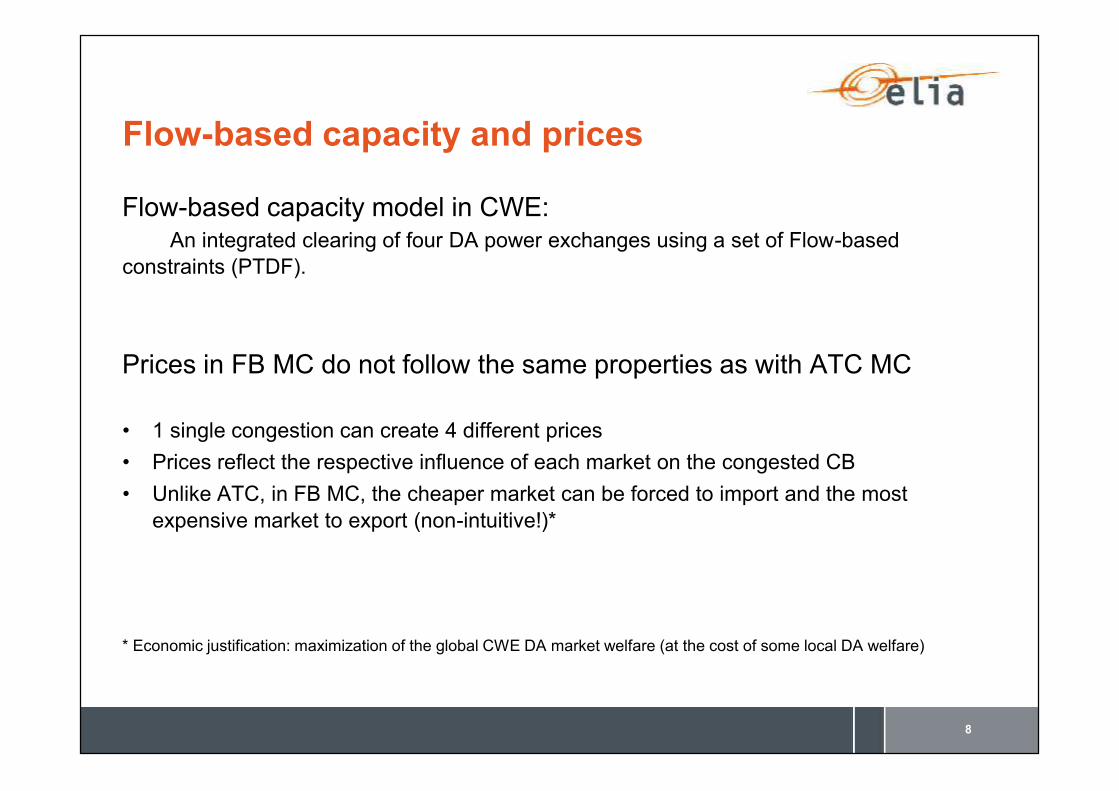
Flow-based capacity and prices
Flow-based capacity model in CWE:An integrated clearing of four DA power exchanges using a set of Flow-based
constraints (PTDF).
Prices in FB MC do not follow the same properties as with ATC MC
• 1 single congestion can create 4 different prices• Prices reflect the respective influence of each market on the congested CB• Unlike ATC, in FB MC, the cheaper market can be forced to import and the most
expensive market to export (non-intuitive!)*
* Economic justification: maximization of the global CWE DA market welfare (at the cost of some local DA welfare)
8

The optimization by Euphemia aims at maximizing the DA market welfare.In CWE, exchanges will be accepted until one CB is fully loaded (RAM fully used)
Control variable = Net PositionsInput data =
∑ Net Positions = 0
Market Coupling Algorithm
Order books+ PTDF matrix (D2CF + CB list + GSK)
Individual bid
Impact on Nodes
Impact on Flows
Impact on each Critical Branch
9

Market Coupling Results under FB
Output of the algorithm =- Net Position for each Hub- (Possibly) one congested Critical Branch: the first one for which RAM is fully used
Without congestion:Price convergence => one unique marginal price is determined
With congestion:- The congested CB has a “shadow price” = the welfare increase that would be created
by one extra MW capacity on this CB- Prices reflect the respective influence of each hub on the congested CB
10

For the use of the congested CB, trade b=>a is in competition with trade c=>aPTDFb=>a 30% of b=>a trade through the CBPTDFc=>a 20% of c=>a trade through the CB
c=>a trade induces less flows through the CB andwill allow a better valorisation of the transmission grid
For a RAM of 100 MW on the CB: 100/20%= 500 MW may be exchanged from c=>a100/30%= 333 MW may be exchanged from b=>a
Using less transmission capacity on the CB, the value of c=>a trade is 500/333 = 1,5 timeshigher than b=>a trade; which corresponds to the ratio : PTDFb=>a / PTDFc=>a
With implicit auction, this leads to the following relation between prices P in the 3 differenthubs a, b and c and corresponding PTDF:
0PTDFPTDFPP
PTDFPTDFPP
ca
ac
ba
ab
Example of “flow competition”
b c
aCB
30% 20%

Prices-PTDF relationFor one congested CB and 3 areas, it can be proven that:
• Ranking of prices according to PTDFs:if a CB is congested, the lowest the PTDF of the area, the highest its price:
• Trades with lowest impact on the CB (PTDFc in our example) will get priority.Bids from producers in c will be selected even if their price is higher than Pb (up to Pc)
• Price differences are proportional to PTDF differences As PTDFs are generally different for each hub, prices are also different.
In CWE, 1 congested CB creates 4 different prices PTDFs (= model quality) have a direct impact on prices
12
0PriceShadowPTDFPTDFPP
PTDFPTDFPP
PTDFPTDFPP
cb
bc
ca
ac
ba
ab
bccb PPPTDFPTDF

//RUN AGGREGATED RESULTSBased on 35 weeks
13
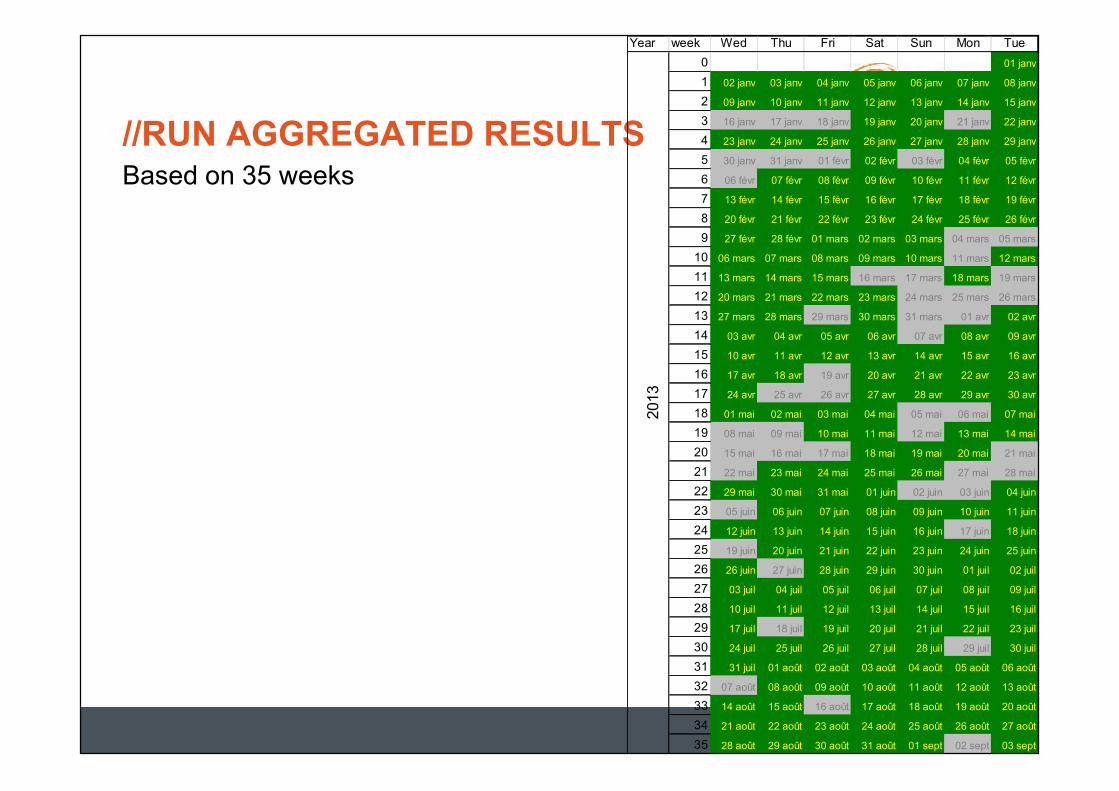
//RUN AGGREGATED RESULTSBased on 35 weeks
14
Year week Wed Thu Fri Sat Sun Mon Tue0 01 janv
1 02 janv 03 janv 04 janv 05 janv 06 janv 07 janv 08 janv
2 09 janv 10 janv 11 janv 12 janv 13 janv 14 janv 15 janv
3 16 janv 17 janv 18 janv 19 janv 20 janv 21 janv 22 janv
4 23 janv 24 janv 25 janv 26 janv 27 janv 28 janv 29 janv
5 30 janv 31 janv 01 févr 02 févr 03 févr 04 févr 05 févr
6 06 févr 07 févr 08 févr 09 févr 10 févr 11 févr 12 févr
7 13 févr 14 févr 15 févr 16 févr 17 févr 18 févr 19 févr
8 20 févr 21 févr 22 févr 23 févr 24 févr 25 févr 26 févr
9 27 févr 28 févr 01 mars 02 mars 03 mars 04 mars 05 mars
10 06 mars 07 mars 08 mars 09 mars 10 mars 11 mars 12 mars
11 13 mars 14 mars 15 mars 16 mars 17 mars 18 mars 19 mars
12 20 mars 21 mars 22 mars 23 mars 24 mars 25 mars 26 mars
13 27 mars 28 mars 29 mars 30 mars 31 mars 01 avr 02 avr
14 03 avr 04 avr 05 avr 06 avr 07 avr 08 avr 09 avr
15 10 avr 11 avr 12 avr 13 avr 14 avr 15 avr 16 avr
16 17 avr 18 avr 19 avr 20 avr 21 avr 22 avr 23 avr
17 24 avr 25 avr 26 avr 27 avr 28 avr 29 avr 30 avr
18 01 mai 02 mai 03 mai 04 mai 05 mai 06 mai 07 mai
19 08 mai 09 mai 10 mai 11 mai 12 mai 13 mai 14 mai
20 15 mai 16 mai 17 mai 18 mai 19 mai 20 mai 21 mai
21 22 mai 23 mai 24 mai 25 mai 26 mai 27 mai 28 mai
22 29 mai 30 mai 31 mai 01 juin 02 juin 03 juin 04 juin
23 05 juin 06 juin 07 juin 08 juin 09 juin 10 juin 11 juin
24 12 juin 13 juin 14 juin 15 juin 16 juin 17 juin 18 juin
25 19 juin 20 juin 21 juin 22 juin 23 juin 24 juin 25 juin
26 26 juin 27 juin 28 juin 29 juin 30 juin 01 juil 02 juil
27 03 juil 04 juil 05 juil 06 juil 07 juil 08 juil 09 juil
28 10 juil 11 juil 12 juil 13 juil 14 juil 15 juil 16 juil
29 17 juil 18 juil 19 juil 20 juil 21 juil 22 juil 23 juil
30 24 juil 25 juil 26 juil 27 juil 28 juil 29 juil 30 juil
31 31 juil 01 août 02 août 03 août 04 août 05 août 06 août
32 07 août 08 août 09 août 10 août 11 août 12 août 13 août
33 14 août 15 août 16 août 17 août 18 août 19 août 20 août
34 21 août 22 août 23 août 24 août 25 août 26 août 27 août
35 28 août 29 août 30 août 31 août 01 sept 02 sept 03 sept
2013
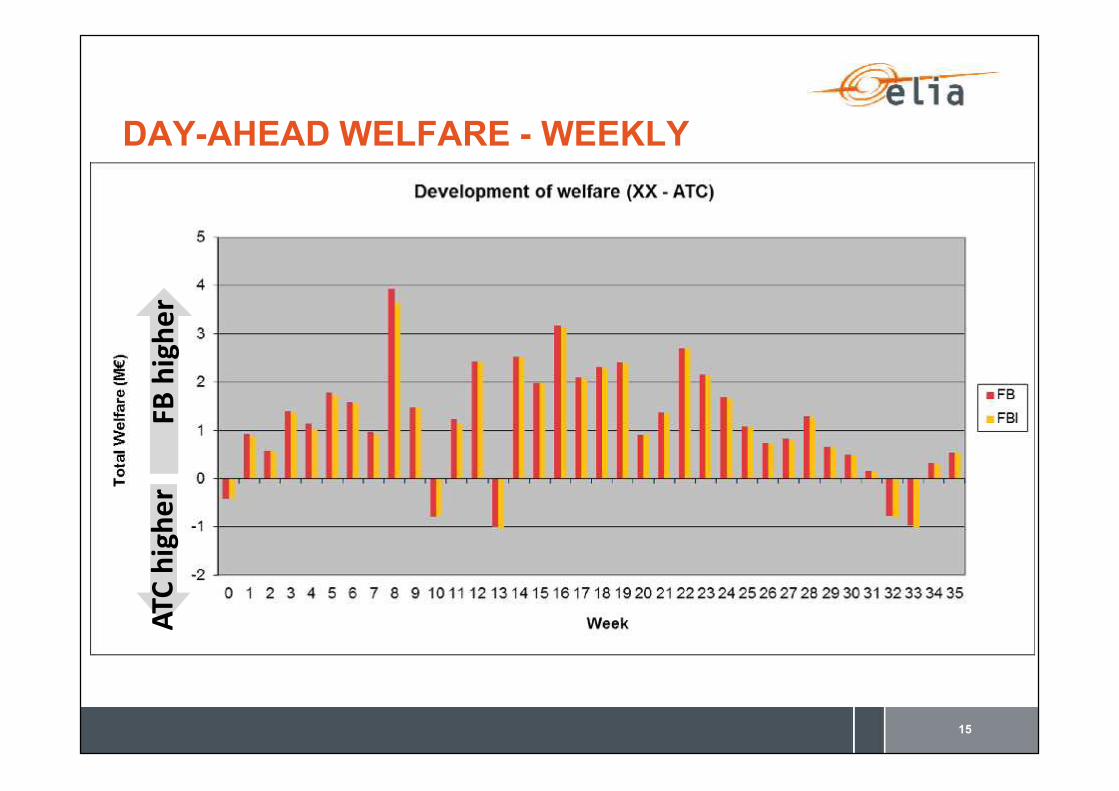
DAY-AHEAD WELFARE - WEEKLYAT
C hi
gher
FB h
ighe
r
15

16
AVERAGE DAY AHEAD MARKET WELFARE

17
DAY AHEAD MARKET WELFARE

18
PRICE CONVERGENCE

19
AVERAGE BASELOAD PRICE

20
AVERAGE BASELOAD PRICE
21
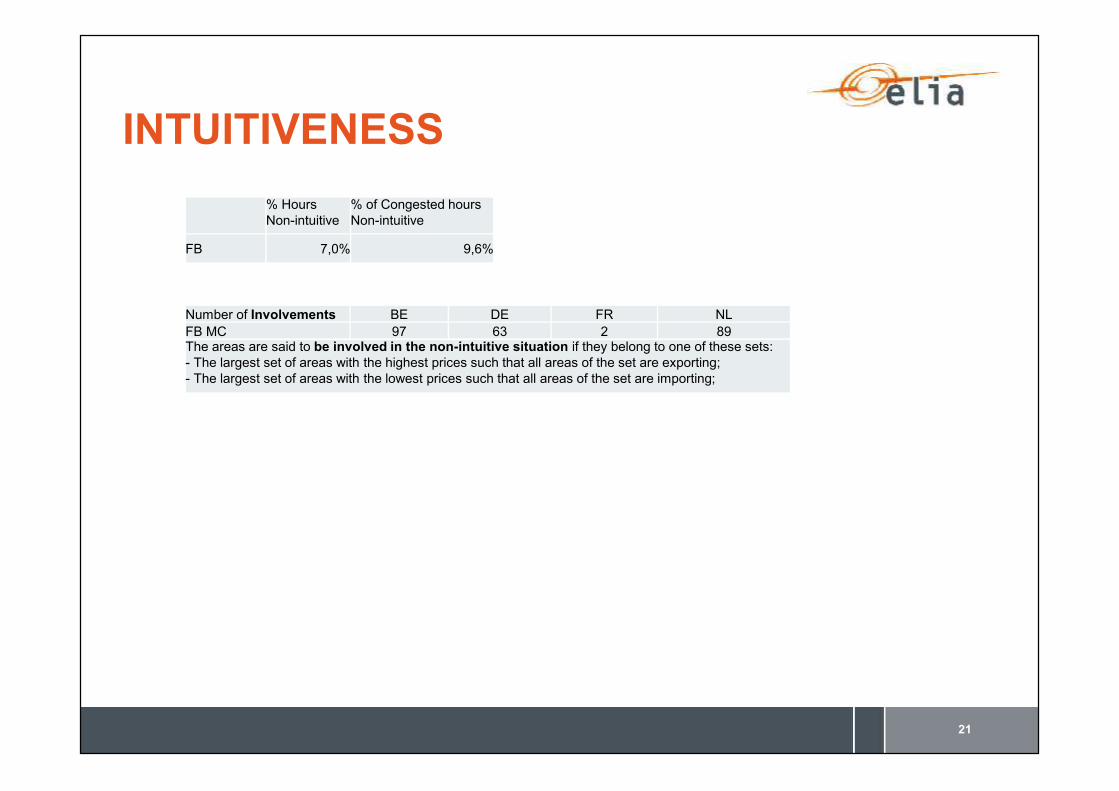
INTUITIVENESS% HoursNon-intuitive
% of Congested hoursNon-intuitive
FB 7,0% 9,6%
The areas are said to be involved in the non-intuitive situation if they belong to one of these sets:- The largest set of areas with the highest prices such that all areas of the set are exporting;- The largest set of areas with the lowest prices such that all areas of the set are importing;
Number of Involvements BE DE FR NLFB MC 97 63 2 89

NEXT STEPS
22
Fine-tuning of the external parallel run
Regulatory approval requests
Market Forum October 10th