Status and outlook for shale gas and tight oil development ...U.S. Energy Information Administration...
28
www.eia.gov U.S. Energy Information Administration Independent Statistics & Analysis Status and outlook for shale gas and tight oil development in the U.S. for The Energy Council March 09, 2013 | Washington, DC by Adam Sieminski, Administrator
Transcript of Status and outlook for shale gas and tight oil development ...U.S. Energy Information Administration...

www.eia.gov U.S. Energy Information Administration Independent Statistics & Analysis
Status and outlook for shale gas and tight oil development in the U.S.
for The Energy Council March 09, 2013 | Washington, DC by Adam Sieminski, Administrator

EIA’s mission and main functions
Adam Sieminski, Energy Council March 09, 2013 2
Independent Statistical and Analytical agency within the U.S. Department of Energy
– EIA collects, analyzes, and disseminates independent and impartial energy information to promote sound policymaking, efficient markets, and public understanding of energy and its interaction with the economy and the environment.
– By law, its data, analyses, and forecasts are independent of approval by any other officer or employee of the U.S. Government
[EIA] …is the gold standard for energy data around the world, and the accessibility of it is so much greater than other places – Dan Yergin, Platts Inside Energy

U.S. Shale Gas
3 Adam Sieminski, Energy Council March 09, 2013

An average well in shale gas and other continuous resource plays can also have steep decline curves, which require continued drilling to grow production
4
0
500
1,000
1,500
2,000
0 5 10 15 20
Haynesville
Eagle Ford
Woodford
Marcellus
Fayetteville
million cubic feet per year
Source: EIA, Annual Energy Outlook 2012
1
0%
50%
100%
0 5 10 15 20
Cumulative production = EUR
Adam Sieminski, Energy Council March 09, 2013

For example: Oil production by monthly vintage of wells in the Williston Basin
5
Source: DrillingInfo history through August 2012, EIA Short-Term Energy Outlook, February 2013 forecast
Adam Sieminski, Energy Council March 09, 2013
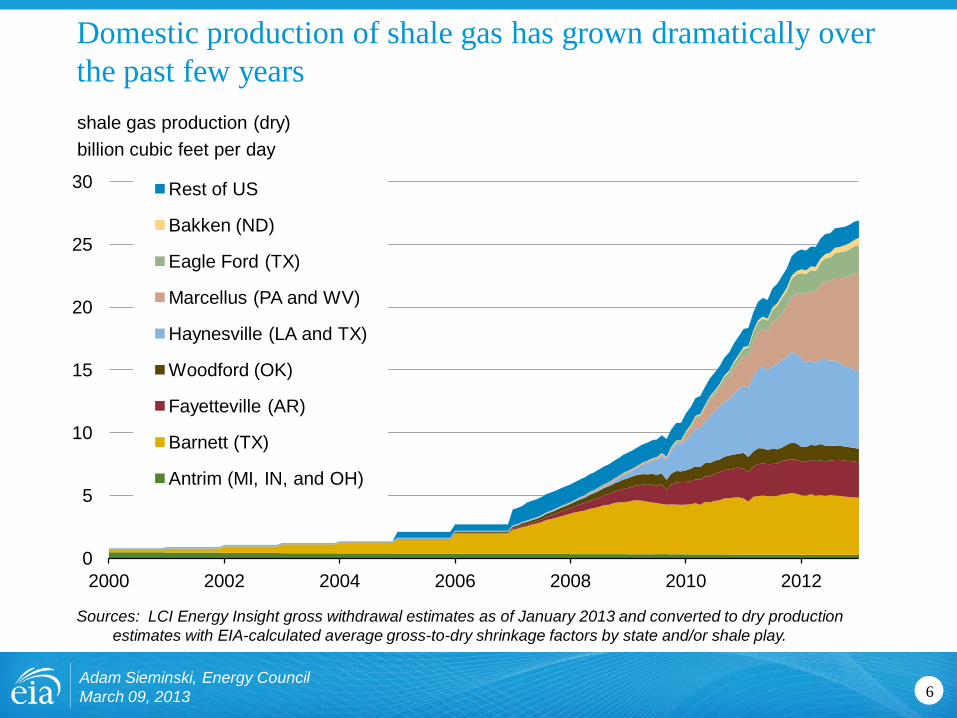
Domestic production of shale gas has grown dramatically over the past few years
6
shale gas production (dry) billion cubic feet per day
0
5
10
15
20
25
30
2000 2002 2004 2006 2008 2010 2012
Rest of US
Bakken (ND)
Eagle Ford (TX)
Marcellus (PA and WV)
Haynesville (LA and TX)
Woodford (OK)
Fayetteville (AR)
Barnett (TX)
Antrim (MI, IN, and OH)
Sources: LCI Energy Insight gross withdrawal estimates as of January 2013 and converted to dry production estimates with EIA-calculated average gross-to-dry shrinkage factors by state and/or shale play.
Adam Sieminski, Energy Council March 09, 2013

Shale gas leads growth in total gas production through 2040
7
U.S. dry natural gas production trillion cubic feet
Source: EIA, Annual Energy Outlook 2013 Early Release
0
5
10
15
20
25
30
35
1990 1995 2000 2005 2010 2015 2020 2025 2030 2035 2040
Associated with oil Coalbed methane
Tight gas
Shale gas
Alaska
Non-associated onshore
Non-associated offshore
Projections History 2011
Adam Sieminski, Energy Council March 09, 2013

8
0
5
10
15
20
25
30
35
2005 2011 2020 2025 2030 2035 2040
U.S. dry gas consumption trillion cubic feet
Source: EIA, Annual Energy Outlook 2013 Early Release
Projections History
Industrial*
Electric power
Commercial
Residential
Transportation**
33%
14%
6%
32%
12%
33%
19%
3%
31%
13%
*Includes combined heat-and-power and lease and plant fuel. **Includes pipeline fuel.
Gas to liquids 2%
Natural gas consumption is quite dispersed, with electric power, industrial, and transportation use driving future demand growth
Adam Sieminski, Energy Council March 09, 2013
0.0
0.5
1.0
1.5
2.0
2.5
3.0
1995 2000 2005 2010 2015 2020 2025 2030 2035 2040
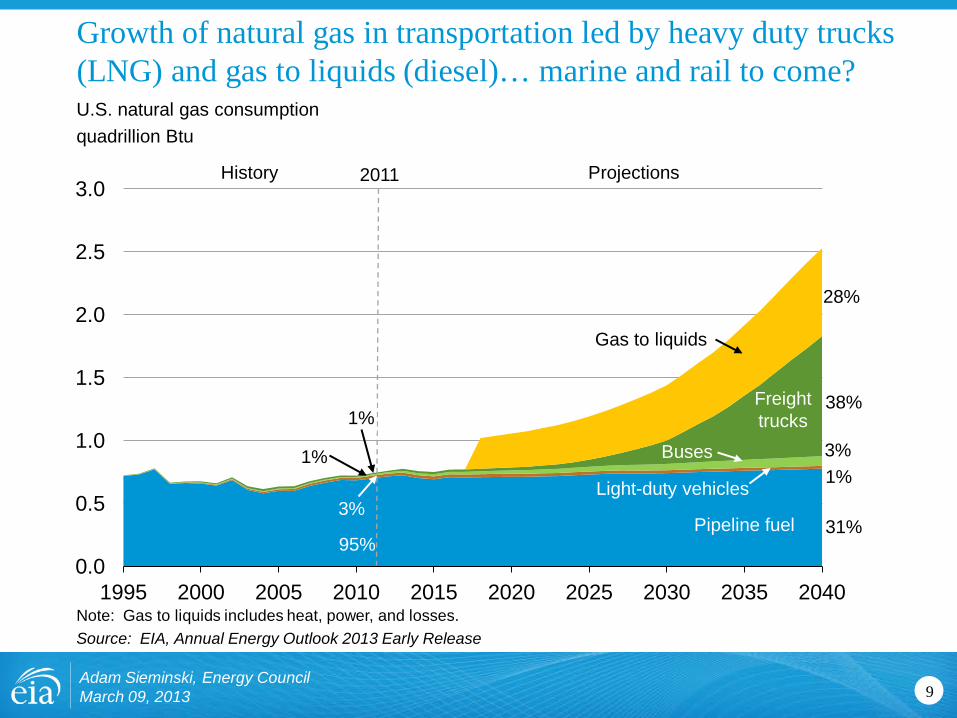
Growth of natural gas in transportation led by heavy duty trucks (LNG) and gas to liquids (diesel)… marine and rail to come?
9
U.S. natural gas consumption quadrillion Btu
Pipeline fuel
Light-duty vehicles
2011 History Projections
95%
3%
1%
1%
28%
38%
3%
31%
1% Buses
Freight trucks
Gas to liquids
Note: Gas to liquids includes heat, power, and losses. Source: EIA, Annual Energy Outlook 2013 Early Release
Adam Sieminski, Energy Council March 09, 2013

Total natural gas exports nearly quadruple by 2040 in the AEO2013 Reference case
10
U.S. natural gas exports trillion cubic feet
Source: EIA, Annual Energy Outlook 2013 Early Release
0
1
2
3
4
5
6
2010 2015 2020 2025 2030 2035 2040
Alaska LNG exports
Exports to Mexico
Exports to Canada
Lower 48 LNG exports
Adam Sieminski, Energy Council March 09, 2013
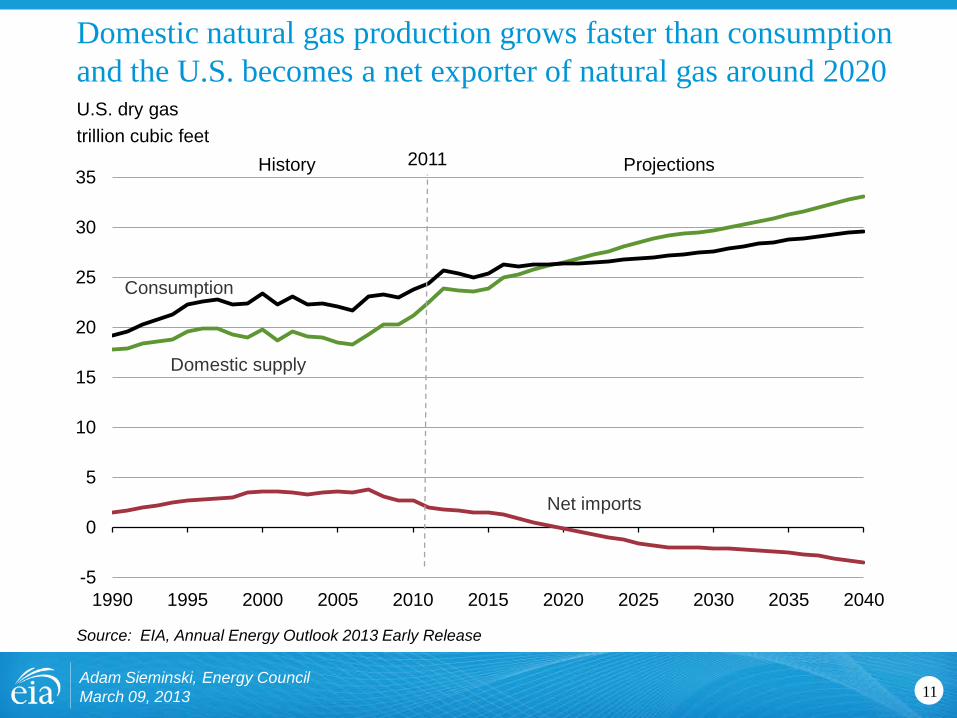
Domestic natural gas production grows faster than consumption and the U.S. becomes a net exporter of natural gas around 2020
11
-5
0
5
10
15
20
25
30
35
1990 1995 2000 2005 2010 2015 2020 2025 2030 2035 2040
U.S. dry gas trillion cubic feet
Source: EIA, Annual Energy Outlook 2013 Early Release
Projections History 2011
Consumption
Domestic supply
Net imports
Adam Sieminski, Energy Council March 09, 2013

U.S. Tight Oil
12 Adam Sieminski, Energy Council March 09, 2013

Domestic production of tight oil has grown dramatically over the past few years
13
tight oil production for select plays million barrels per day
Source: Drilling Info (formerly HPDI), Texas RRC, North Dakota department of mineral resources, and EIA, through October 2012.
Adam Sieminski, Energy Council March 09, 2013
0.0
0.2
0.4
0.6
0.8
1.0
1.2
1.4
1.6
1.8
2.0
2.2
2000 2002 2004 2006 2008 2010 2012
Eagle Ford
Bakken
Granite Wash
Bonespring
Monterey
Woodford
Niobrara-Codell
Spraberry
Austin Chalk

U.S. tight oil production leads a growth in domestic production of 2.6 million barrels per day between 2008 and 2019
14
U.S. crude oil production million barrels per day
Source: EIA, Annual Energy Outlook 2013 Early Release and Short-Term Energy Outlook, February 2013
0
2
4
6
8
1990 1995 2000 2005 2010 2015 2020 2025 2030 2035 2040
Projections History 2011
Alaska
Tight oil
Other lower 48 onshore
Lower 48 offshore
STEO Feb. 2013 U.S. crude oil projection
Adam Sieminski, Energy Council March 09, 2013

U.S. petroleum product exports exceeded imports in 2011 for first time in over six decades
15
annual U.S. net exports of total petroleum products, 1949 – 2011 million barrels per day
Source: EIA, Petroleum Supply Monthly
-4
-3
-2
-1
0
1
2
3
4
1949 1955 1961 1967 1973 1979 1985 1991 1997 2003 2009
imports
exports
net exports
net product exporter
Adam Sieminski, Energy Council March 09, 2013

U.S. dependence on imported liquids depends on both supply and demand
16
U.S. liquid fuel supply million barrels per day
Source: EIA, Annual Energy Outlook 2013 Early Release
0
5
10
15
20
25
1970 1975 1980 1985 1990 1995 2000 2005 2010 2015 2020 2025 2030 2035 2040
Consumption
Domestic supply
Net imports 45%
37%
Projections History 2011
60%
2005
Adam Sieminski, Energy Council March 09, 2013
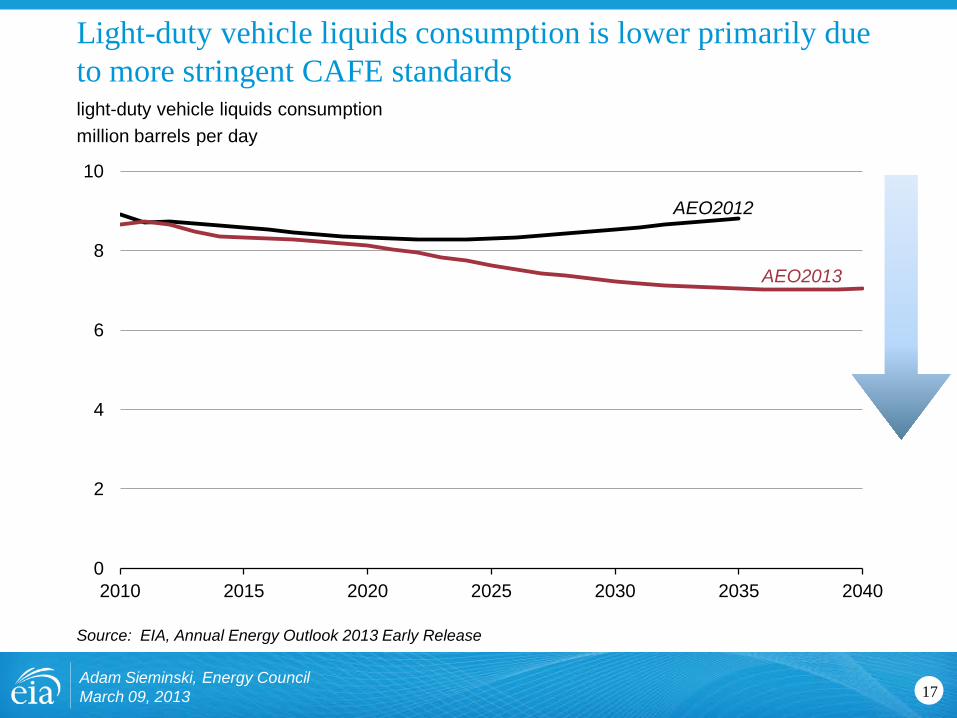
Light-duty vehicle liquids consumption is lower primarily due to more stringent CAFE standards
Adam Sieminski, Energy Council March 09, 2013 17
0
2
4
6
8
10
2010 2015 2020 2025 2030 2035 2040
light-duty vehicle liquids consumption million barrels per day
Source: EIA, Annual Energy Outlook 2013 Early Release
AEO2012
AEO2013

Global tight oil production comparisons
18
Source: Preliminary International Energy Outlook 2013, BP Energy Outlook 2030
0
2
4
6
8
10
12
2000 2010 2020 2030
Australia China Russia Argentina Mexico Canada United States
million barrels per day
BP Energy Outlook 2030 IEO2013 DRAFT
Adam Sieminski, Energy Council March 09, 2013

EIA Data & the Importance of Cooperation with the States
Adam Sieminski, Energy Council March 09, 2013 19

Groundwater Protection Council (GWPC)
Adam Sieminski, Energy Council March 09, 2013 20
• The Ground Water Protection Council (GWPC) consists of state ground water regulatory agencies (spun out of the IOGCC)
• The purpose is to promote and ensure the use of best management practices and fair but effective laws regarding comprehensive ground water protection
• FracFocus Website – FracFocus is the national hydraulic fracturing chemical registry and is managed by the GWPC and Interstate Oil and Gas Compact Commission (IOGCC)

Risked Based Data Management System (RBDMS)
Adam Sieminski, Energy Council March 09, 2013 21
• More than 22 regulatory agencies use the RBDMS data management system for tracking oil, gas, injection well and water protection activities
• Since 1992, development of RBDMS software underwritten through grants from the DOE. Funding has also been provided by state agencies including in-kind services
• Provides access to data for well history, tracking ownership, bonding, permitting, location, construction, inspection, production, and plugging/ restoration, and compliance
• RBDMS development is directed by the Technical Committee, a users’ group whose participation is drawn from multiple states

Adam Sieminski, Energy Council March 09, 2013 22
Oil and gas wells drilled in 2012 and RBDMS partners
Currently talking to TX, CA, LA, and WV

Objectives of EIA-GWPC partnership
Adam Sieminski, Energy Council March 09, 2013 23
• Increase public availability of timely, accurate, and comprehensive U.S. oil and gas production data
• Continually strive to meet emerging data needs such as current need for shale production data
• Provide timely analyses of oil and gas production trends through geospatial analysis
• Collaborate with RBDMS partners to develop tailored data systems

EIA – GWPC/RBDMS Working Together to Improve Oil/Gas Data Availability and Quality
Adam Sieminski, Energy Council March 09, 2013 24
• Phase 1: Central data repository consisting of the latest available data from each RBDMS state
– pilot project, proof of concept for 4 states underway now
– future expansion to all 22 states
– data not as timely as EIA-914 expansion but will be used for EIA-914 QA
• Phase 2: Improved data collection – establish common/standard data definitions/translation across states
– improve QA processes
– expand number of states
– provide more timely analyses of oil/gas production using geospatial analysis and other GWPC/RBDMS data

Annual natural gas well starts and natural gas production in Pennsylvania
25
wells started billion cubic feet per day
Source: Pennsylvania Department of Environmental Protection
Adam Sieminski, Energy Council March 09, 2013
0.0
1.0
2.0
3.0
4.0
5.0
6.0
7.0
0
500
1,000
1,500
2,000
2,500
3,000
3,500
2005 2006 2007 2008 2009 2010 2011 2012
Horizontal Wells Non-Horizontal Wells Gas Production

Adam Sieminski, Energy Council March 09, 2013 26
• ND Dept of Mineral Resources provides timely, complete and reliable oil and gas data and information
• Data collection – streamlined and automated – electronic only
– advanced edit procedures applied
– collection at multiple points provides checks and balances and ensures consistency
– enforcement provides for timely responses from respondents
• Data reporting – timely and accurate – monthly data published 45 days after end of the month
– few/minor revisions to data
– public accessibility: comprehensive data posted on internet site
– continuous process and reporting improvement expand the public’s understanding of oil/gas developments in the state
– interactive GIS map server available to public with well level and field level data
North Dakota’s oil/gas information model

Why EIA matters to you
Adam Sieminski, Energy Council March 09, 2013 27
• Data from all states in one location: comparisons/rankings/maps
• Data-mining to routine monthly data retrievals
• Context and perspective: short and longer term outlooks
• Webinars, workshops, conferences
• Energy Explained and Energy Kids
My Challenge as Administrator: Improving the quality, timeliness and accessibility of EIA information – data, analysis and outlooks Building on data information management systems like RBDMS could be a way for all of us to benefit

Adam Sieminski, Energy Council March 09, 2013 28
U.S. Energy Information Administration home page | www.eia.gov
Annual Energy Outlook | www.eia.gov/forecasts/aeo
Short-Term Energy Outlook | www.eia.gov/forecasts/steo
International Energy Outlook | www.eia.gov/forecasts/ieo
Today In Energy | www.eia.gov/todayinenergy
Monthly Energy Review | www.eia.gov/totalenergy/data/monthly
Annual Energy Review | www.eia.gov/totalenergy/data/annual
For more information