Status and Management of the Least Bell’s Vireo …...restoration of the Santa Ana Watershed to...
172
Status and Management of the Least Bell’s Vireo and Southwestern Willow Flycatcher in the Santa Ana River Watershed, 2017, and Summary Data by Site and Watershed-wide, 2000-2017 Prepared by Santa Ana Watershed Association Prepared for Orange County Water District U.S. Fish and Wildlife Service U.S. Army Corps of Engineers Principal Field Investigator and Author Richard Zembal Co-Authors and Field Investigators Melody Aimar Maricela Archer Allyson Beckman Florence Chan Cynthia Chavez Jill Coumoutso Patience Falatek Aaron Gallagher Susan M. Hoffman Nicole Housel Cameron Macbeth December 2017
Transcript of Status and Management of the Least Bell’s Vireo …...restoration of the Santa Ana Watershed to...

Status and Management of the Least Bell’s Vireo and Southwestern Willow Flycatcher in the
Santa Ana River Watershed, 2017, and Summary Data by Site and Watershed-wide, 2000-2017
Prepared by Santa Ana Watershed Association
Prepared for
Orange County Water District U.S. Fish and Wildlife Service U.S. Army Corps of Engineers
Principal Field Investigator and Author
Richard Zembal
Co-Authors and Field Investigators Melody Aimar
Maricela Archer Allyson Beckman
Florence Chan Cynthia Chavez Jill Coumoutso
Patience Falatek Aaron Gallagher
Susan M. Hoffman Nicole Housel
Cameron Macbeth
December 2017

Table of Contents ABSTRACT ...................................................................................................................................................... 1
INTRODUCTION ............................................................................................................................................. 2
METHODS ...................................................................................................................................................... 3
Study Location ........................................................................................................................................... 3
Monitored Sites ..................................................................................................................................... 4
San Jacinto ............................................................................................................................................ 4
San Timoteo Canyon ............................................................................................................................. 4
Meridian Conservation Area (former March SKR Preserve) .................................................................. 5
Santa Ana River (SAR) - Upstream ........................................................................................................ 5
Norco Bluffs, I-15 to River Rd. ............................................................................................................... 6
Temescal Canyon .................................................................................................................................. 7
Chino Hills .............................................................................................................................................. 8
Santa Ana Canyon ................................................................................................................................. 8
Upper Canyon ........................................................................................................................................ 9
Green River Golf Club ............................................................................................................................ 9
Featherly Regional Park ...................................................................................................................... 10
Sampled Sites ...................................................................................................................................... 11
Mockingbird Canyon ........................................................................................................................... 11
Incidental Sites .................................................................................................................................... 11
Vireo Monitoring ..................................................................................................................................... 12
Brown-headed Cowbird Trapping ........................................................................................................... 14
RESULTS ...................................................................................................................................................... 15
Vireo Abundance ..................................................................................................................................... 15
Chronology of Breeding Activity .............................................................................................................. 16
Nesting Site Preferences ......................................................................................................................... 16
Reproductive Success .............................................................................................................................. 17
Predation Rates ....................................................................................................................................... 17
Brown-headed Cowbird Parasitism ......................................................................................................... 18
Results and Discussion by Site ................................................................................................................. 18
Monitored Sites ................................................................................................................................... 18
San Jacinto .......................................................................................................................................... 18

San Timoteo Canyon ........................................................................................................................... 19
Meridian Conservation Area (former March SKR Preserve) ................................................................ 20
Santa Ana River (SAR) - Upstream ...................................................................................................... 21
SAR - Riverside Ave. to Van Buren Blvd. .............................................................................................. 22
SAR - Hidden Valley - North (north side of river) ................................................................................. 23
SAR - Hidden Valley - South (south side of the river) .......................................................................... 24
SAR - Goose Creek, Norco to I-15 ........................................................................................................ 24
Norco Bluffs, I-15 to River Rd. ............................................................................................................. 25
Temescal Canyon ................................................................................................................................ 26
Chino Hills ............................................................................................................................................ 27
Santa Ana Canyon ............................................................................................................................... 28
Upper Canyon ...................................................................................................................................... 29
Green River Golf Club .......................................................................................................................... 30
Featherly Regional Park ...................................................................................................................... 30
Sampled Sites ...................................................................................................................................... 32
Mockingbird Canyon ........................................................................................................................... 32
Incidental Sites .................................................................................................................................... 33
BROWN-HEADED COWBIRD TRAPPING RESULTS ....................................................................................... 33
Brown-headed Cowbird Trapping, March-July 2017 .............................................................................. 33
Non-Target Captures in Cowbird Traps, March-July 2017 ...................................................................... 34
Fall/Winter 2016-2017 Brown-headed Cowbird Trapping and Non-Target Captures ............................ 34
SIGHTINGS OF INTEREST – INCIDENTAL SPECIES OBSERVATIONS .............................................................. 34
Southwestern Willow Flycatcher ............................................................................................................. 35
DISCUSSION ................................................................................................................................................. 35
MANAGEMENT RECOMMENDATIONS ........................................................................................................ 37
FUNDING ACKNOWLEDGEMENTS............................................................................................................... 38
ACKNOWLEDGEMENTS ............................................................................................................................... 38
WORKS CITED .............................................................................................................................................. 40
Figure 1. Map of the Santa Ana Watershed. ............................................................................................... 42
Figure 2. Least Bell’s Vireo survey sites in the Santa Ana Watershed, 2017. ............................................. 43
Figure 3. Brown-headed Cowbird trap locations in the Santa Ana Watershed, 2017. ............................... 44
Figure 4. Norco Bluffs Vireo Survey Area. ................................................................................................... 45

Figure 5. Least Bell’s Vireo abundance in the Santa Ana Watershed, including Prado Basin, 2000-2017. 46
Figure 6. Least Bell’s Vireo territories at four sites in the Santa Ana Watershed, 2000-2017. .................. 47
Figure 7. Vireo Territories vs. Parasitism Rates in the Santa Ana Watershed, 2001-2017. ........................ 48
Figure 8. Least Bell’s Vireo nesting success, depredation rates, and parasitism rates in the Santa Ana Watershed, 2001-2017. .............................................................................................................................. 49
Figure 9. Brown-headed Cowbirds removed from sites in the Santa Ana Watershed, 2000-2017. .......... 50
Table 1. Least Bell’s Vireo abundance and distribution in the Santa Ana Watershed, 2013-2017. Numbers of territories, pairs, and fledglings detected. ............................................................................................. 51
Table 2. Least Bell’s Vireo status and management data at monitored and sampled sites in the Santa Ana Watershed, 2017. ................................................................................................................................ 56
Table 3. Least Bell’s Vireo survey dates and breeding chronology, 2017. .................................................. 57
Table 4. Least Bell’s Vireo nest placement preference at monitored and sampled sites in the Santa Ana Watershed, 2017. ........................................................................................................................................ 58
Table 5. Least Bell’s Vireo reproductive success and breeding biology data at monitored and sampled sites in the Santa Ana Watershed, 2017. .................................................................................................... 60
Table 6. Brown-headed Cowbird trapping results, March-July 2017 (grouped by funding source)........... 62
Table 7. Non-target avian captures in Brown-headed Cowbird traps, March-July 2017. .......................... 65
Table 8. Brown-headed Cowbird trapping results, fall/winter 2016-2017. ................................................ 67
Table 9. Non-target avian captures in Brown-headed Cowbird traps, fall/winter, 2016-2017. ................. 68
Table 10. Observations of all species by location, 2017. ............................................................................ 69
APPENDIX A: SURVEY SITES, STARTING AND ENDING COORDINATES ...................................................... A-1
APPENDIX B: WATERSHED-WIDE ANNUAL RESULTS, 2010-2017 .............................................................. B-1
Appendix B-1. Least Bell’s Vireo status and management and Brown-headed Cowbird management data at closely monitored and sampled sites in the Santa Ana Watershed, 2000-2017. ...................... B-2
Appendix B-2. Least Bell’s Vireo nest placement preferences at monitored and sampled sites in the Santa Ana Watershed, 2000-2017. ........................................................................................................ B-3
Appendix B-3. Least Bell’s Vireo reproductive success and breeding biology data at monitored and sampled sites in the Santa Ana Watershed, 2000-2017. ....................................................................... B-9
APPENDIX C: SUMMARY TABLES BY MANAGED SITE, 2000-2017 ............................................................. C-1
Appendix C-1-A. Least Bell’s Vireo status and management and Brown-headed Cowbird management data at survey sites in the Santa Ana Watershed, 2000-2017. .............................................................. C-2
Appendix C-2-A. Least Bell’s Vireo nest placement preferences at survey sites in the Santa Ana Watershed, 2000-2017. ....................................................................................................................... C-18

Appendix C-3-A. Least Bell’s Vireo reproductive success and breeding biology data at survey sites in the Santa Ana Watershed, 2000-2017. ................................................................................................ C-45
APPENDIX D: SUMMARY TABLES BY MANAGED SITE, 2000-2009 ............................................................ D-1

LBVI AND SWFL REPORT 2017 SANTA ANA WATERSHED ASSOCIATION ABSTRACT
1
ABSTRACT
The Santa Ana Watershed is the largest coastal river system in southern California. The Santa Ana Watershed Association (SAWA) is committed to the protection and improvement of natural areas within the watershed with major focus on the removal of invasive species, native habitat enhancement and the protection of endangered, threatened and other sensitive species. Since 2000, populations of endangered Least Bell’s Vireos (Vireo bellii pusillus) and Southwestern Willow Flycatchers (Empidonax traillii extimus) have been studied and managed during the breeding season. Data was taken on status, distribution, breeding chronology, reproductive success, and nest site characteristics. Additionally, Brown-headed Cowbird (Molothrus ater) trapping in or near riparian habitat was conducted concurrently as well as during the winter at several dairies in the watershed. SAWA biologists documented 1,208 Least Bell’s Vireo territories in the Santa Ana Watershed (excluding Prado Basin) in 2017, of which 623 were known to be paired. This represents a 13% increase in territories from 2016, and the highest number documented to date. One thousand fifty-two fledglings were also documented. Nesting success was 60% overall and 135 well-monitored pairs had a 3.6 reproductive success rate. Seventy-three percent of 312 vireo nests were placed in four species of willows (Salix spp.) and mulefat (Baccharis salicifolia). In 2017, Prado Basin reported another 549 vireos (Bonnie Johnson, personal communication, October 16, 2017), a 7% increase from the 511 documented in 2016.
In 2017, the watershed-wide cowbird parasitism rate of vireo nests was 4%, following a 3% rate in 2016. San Jacinto, San Timoteo Canyon, Santa Ana River (SAR) - Upstream, and Temescal Canyon were sites where parasitism was documented in 2017. Over 2,600 cowbirds were removed from 43 traps in the watershed during the nesting season. Additionally, more than 6,250 cowbirds were removed from the watershed during the fall and winter of 2016-2017. Over 111,000 cowbirds have been removed from the watershed by SAWA since cowbird management began.
Southwestern Willow Flycatchers were not detected by SAWA biologists in 2017; however, 17 migrant Willow Flycatchers were documented within the watershed. All wildlife species detected (148 avian, 23 mammalian, 23 herpetofauna and three fish) were incidentally reported by site.

LBVI AND SWFL REPORT 2017 SANTA ANA WATERSHED ASSOCIATION INTRODUCTION
2
INTRODUCTION
As the largest coastal river system in southern California, the Santa Ana Watershed is home to more than 6 million people and includes portions of San Bernardino, Riverside, Orange, and Los Angeles Counties. The Santa Ana Watershed Association (SAWA) is committed to the protection and improvement of natural habitat within the Santa Ana Watershed. Major focuses of SAWA are the removal of invasive species, native habitat enhancement and protection of endangered, threatened and other sensitive species. A large threat in the Santa Ana Watershed is the extremely prolific invasive weed, arundo (Arundo donax; hereafter “arundo”). Arundo chokes riverine systems while out-competing native vegetation resulting in a loss of habitat for native species and hampering flood control efforts. Due to its flammable nature, arundo increases the risk of fire, while also consuming twice the amount of water than native plants, thereby stressing a region that already has little available water. SAWA is dedicated to the restoration of the Santa Ana Watershed to encourage natural riverine functions and enhance riparian habitat in an effort to aid the recovery of the endangered Least Bell’s Vireo (Vireo bellii pusillus) and the Southwestern Willow Flycatcher (Empidonax traillii extimus).
The Least Bell’s Vireo (hereafter “vireo”) is a small, insectivorous bird that occupies riparian habitat in southern California and northern Baja Mexico. It is listed as endangered under both the State of California and the federal government due to the destruction of riparian habitat and brood parasitism by the Brown-headed Cowbird (Molothrus ater; hereafter “cowbird”). Vireo monitoring and cowbird control began in 1986 with only 19 known vireo pairs in the Prado Basin. The Prado Basin population has since increased to a high of 386 pairs and 600 territorial males in 2005 (Pike et al. 2005). The watershed-wide population (including Prado Basin) totaled over 1,700 territorial males in 2017. The Southwestern Willow Flycatcher (hereafter “willow flycatcher”) occupies riparian habitat throughout the southwest. It too is listed as endangered by the state and federal government due to habitat loss and cowbird parasitism. These two endangered species and several other sensitive species have been monitored and managed in the Prado Basin annually since 1986 and throughout the watershed since 2000.
The work reported herein is an expansion upon the Prado Basin efforts into other portions of the watershed through the implementation of the Santa Ana Watershed Program by SAWA and the Orange County Water District (OCWD) during the year 2017. Data collected in Prado Basin is reported separately by OCWD. This monitoring program was conducted during the avian nesting season to determine the number of vireos and willow flycatchers present, their breeding status, and nesting outcomes. Cowbird trapping in or near riparian habitat is conducted concurrently as well as during the fall and winter at several dairies in the watershed. Past efforts have included nest monitoring in the major riparian corridors of the watershed. In 2017, nest
LBVI AND SWFL REPORT 2017 SANTA ANA WATERSHED ASSOCIATION INTRODUCTION
3
monitoring occurred at several locations discussed here as monitored sites: San Jacinto, San Timoteo Canyon, Meridian Conservation Area, Santa Ana River (SAR – Upstream) from Riverside Ave. downstream to I-15, Norco Bluffs, Temescal Canyon, Chino Hills and the Santa Ana Canyon (SAC) below Prado Dam. Abundance and distribution data was documented at Mockingbird Canyon. Forty-four additional peripheral drainages within the watershed were sampled (≥3 visits) and incidental sightings were documented at sites visited on 1-2 occasions.
METHODS
Study Location
The Santa Ana Watershed is located in southern California and includes parts of San Bernardino, Riverside, Orange, and Los Angeles Counties and covers nearly 3,000 square miles (Figure 1). The watershed includes a diversity of terrain including mountains, foothills, valleys, and the coastal plain. The main river is the Santa Ana River (SAR), which contains more than 50 tributaries. Vireo were monitored in SAR from Riverside Avenue in the city of Riverside downstream through the Santa Ana Canyon to Weir Canyon Road, excluding Prado Basin. Tributaries of the Santa Ana River that were monitored include San Timoteo Canyon, Meridian Conservation Area, Temescal Canyon, and fragments of Chino Hills. Portions of the San Jacinto River and San Jacinto Wildlife Area were also monitored (Figure 2). Cowbird trapping was conducted throughout the watershed at monitored and sampled sites (Figure 3).
Study sites contained typical southern Californian riparian vegetation including tall canopies of Fremont cottonwood (Populus fremontii) and Goodding’s black willow (Salix gooddingii), sub-stories of arroyo and red willow (Salix lasiolepis and Salix laevigata, respectively), and mulefat (Baccharis salicifolia). Vegetation classifications follow nomenclatures listed in A Manual of California Vegetation (Sawyer et al. 2009). Lush riparian habitat is abundant throughout the study sites; however, invasive arundo is dominant in many locations of the middle watershed. Other non-native plants found dispersed among the sites include perennial pepperweed (Lepidium latifolium), castor bean (Ricinus communis), poison hemlock (Conium maculatum), and tamarisk (Tamarix ramosissima). Other than natural storm flow, the river’s water comes from discharged treated water, urban runoff, very limited natural springs, upwelling in the Prado Basin, and releases from the Seven Oaks and Prado Dams. The river is subjected to heavy human impacts from horseback riding, unauthorized trails, swimming, fishing, paintball gaming, homeless encampments, off-highway vehicle (OHV) use, trash dumping, and a variety of other illegal activities.

LBVI AND SWFL REPORT 2017 SANTA ANA WATERSHED ASSOCIATION METHODS
4
Monitored Sites
Monitored sites, for the purposes of this study, are those sites where territories were well-monitored (> 8 visits) and regular nest monitoring occurred. These sites included San Jacinto, San Timoteo Canyon, Meridian Conservation Area, the Santa Ana River - Upstream (Riverside Ave. to Van Buren Blvd., Hidden Valley - north and south sides of the river, Goose Creek, Norco to I-15, Norco Bluffs (I-15 to River Rd.), Temescal Canyon, Chino Hills, and the Santa Ana Canyon (Upper Canyon, Green River Golf Course, and Featherly Regional Park).
San Jacinto
San Jacinto includes two monitored sections: the San Jacinto River from Lake Park Drive to State Street, and the San Jacinto Wildlife Area. Both sites are located within the San Jacinto Valley in Riverside County. The San Jacinto Wildlife Area is managed by the California Department of Fish and Wildlife (CDFW) while the San Jacinto River is managed under multiple authorities. The San Jacinto River contains a number of invasive plant species, with the dominant invasive being tamarisk. To date, SAWA’s non-native management efforts have been limited to the removal of tamarisk from Mystic Lake. The lands surrounding these sites include upland coastal sage scrub, agricultural land, golf courses, and residential development.
The riparian zone in the San Jacinto River can be classified as a Populus fremontii Forest Alliance (Sawyer et al. 2009), with narrowleaf willow (Salix exigua) and mulefat as co-dominants. This habitat is also interspersed with scattered Goodding’s black willow. The dominant invasive plant in the riparian zone is tamarisk. The riparian zone in the San Jacinto Wildlife Area can be classified as a Salix gooddingii Woodland Alliance with Fremont cottonwood as a co-dominant. The area is also interspersed with red willow and mulefat. There are few invasive plants in the riparian areas, but perennial pepperweed and Russian thistle (Salsola tragus) can be found on adjacent land.
San Timoteo Canyon
San Timoteo Canyon is located near the city of Redlands within the counties of San Bernardino and Riverside. San Timoteo Creek originally contained many invasive plant species, most notably arundo and tamarisk. A program initiated by SAWA removed 239 acres of invasive plants from 1997 to 2001, and continues a maintenance program to control regrowth. Restoration of the native plant community through natural recruitment has taken place throughout the canyon resulting in a healthy riparian understory, the effects of natural storm cycles notwithstanding. The canyon’s immediate uplands contain citrus groves and remnants of over-grazed coastal sage scrub and chaparral. A railroad and a two-lane road border the canyon.

LBVI AND SWFL REPORT 2017 SANTA ANA WATERSHED ASSOCIATION METHODS
5
Development of portions of the uplands continues to occur. San Timoteo Creek was surveyed from Cooper's Creek to approximately 15 miles (24 km) downstream at the point the creek becomes channelized.
The entire riparian zone can be classified as a Salix laevigata Woodland Alliance (Sawyer et al. 2009), with arroyo willow as a co-dominant. However, the creek is also interspersed with Fremont cottonwood, Goodding’s black willow, and mulefat. The dominant invasive plant in the riparian zone is tamarisk. Dominant invasives in the adjacent upland zone are Russian thistle, mustard (Brassica sp.) and perennial pepperweed.
Meridian Conservation Area (former March SKR Preserve)
Meridian Conservation Area (former March SKR Preserve) is located in the city of Riverside in Riverside County. The riparian zone can be classified as a Salix laevigata Woodland Alliance (Sawyer et al. 2009), with arroyo willow as a co-dominant. Exotic grasses and mustard are the dominant invasives in the adjacent upland zone.
The Meridian Conservation Area is protected from development at this time. The surrounding land is being developed into warehouse facilities and housing tracts. In addition, construction on Van Buren Boulevard created noise and disturbance near vireo territories during the 2017 season, even though the riparian habitat itself was not altered. Damage to the habitat and potential harm to nesting vireos occurs when residents nearby use the conservation area as a recreational space, participate in OHV use, bicycling, jogging, hiking, and possibly camping. Besides using the existing dirt road, trails leading from the housing area to the road have been created, some near or through the riparian. A large homeless camp was also discovered in riparian habitat in the northern portion of the conservation area.
Santa Ana River (SAR) - Upstream
The upstream section extends along the Santa Ana River mainstem from Riverside Ave. in the City of Riverside downstream to Interstate 15 in Norco. The site is divided into four different sections to maintain the historic presentation of SAWA abundance and distribution data. These sections are: Riverside Ave. to Van Buren Blvd., Hidden Valley - North side of river, Hidden Valley - South side of river, and Goose Creek, Norco to I-15. A small portion of the Goose Creek section includes a mitigation area managed by the Inland Empire Resource Conservation District (IERCD). Prior to 2015, these sections of the river were not grouped together as “upstream”; all sites were reported separately. In 2015, the upstream section did not include Goose Creek, Norco to I-15; however, in 2016 a change in funding source now incorporates this area as part of SAR - Upstream.

LBVI AND SWFL REPORT 2017 SANTA ANA WATERSHED ASSOCIATION METHODS
6
There are a variety of habitat types throughout this section of the Santa Ana River. The riparian zone is classified as a Salix gooddingii Woodland Alliance with Fremont cottonwood as a co-dominant (Sawyer et al. 2009). The dominant invasive plant in the riparian zone of SAR - Upstream is arundo. Other invasive plant species include tamarisk, castor bean, perennial pepperweed, tree of heaven (Ailanthus altissima), and various palm species.
Several land managers are engaged in different stages of restoration or mitigation along this portion of the river. The surrounding land use includes commercial and residential properties, recreational trails, parks and golf courses. Within the riparian habitat itself, many large homeless encampments occur which has caused damage (e.g. vegetation clearing, trash dumping) to portions of the native habitat.
Norco Bluffs, I-15 to River Rd.
The area referred to as “Norco Bluffs” is comprised of the 3-mile long riparian zone located along the river between Interstate 15 and River Road. The U.S Army Corps of Engineers (USACE) considers this area as part of the Prado Basin. Vireos were monitored in select areas within Norco Bluffs, including the addition of a 250-acre parcel previously monitored by a USACE consultant prior to the 2015 breeding season. The addition of this habitat precludes the possibility of comparing population level data between 2015 and 2016; however, population data can be compared between 2016 and 2017 as the survey area was unchanged. Remaining USACE mitigation areas were not in SAWA’s scope of work for the 2017 breeding season and therefore not surveyed (Figure 4).
SAWA removed arundo in the winter of 2006 and 2007 from a 15-acre area located immediately south of Eastvale Community Park. No maintenance or removal was conducted within the area SAWA monitored in 2017. Past construction activities were conducted on the north side of the river by the City of Norco (hereafter “the City”) on the east and west sides of Hamner Ave. In the spring of 2011, the City constructed a large, protective stone levee east of Hamner Ave. as a result of damaging floods during the previous winter. Construction of the levee resulted in the removal of riparian habitat and noise disturbance to vireo territories nearby. Additional habitat was removed by the City in the spring of 2012 to allow for the widening of Hamner Ave. In the spring of 2015, the City conducted construction activities at a site located in the riparian area approximately 50 yards beyond the end of Old Hamner Rd. No existing riparian vegetation was removed. No construction activities occurred during the 2016 or 2017 nesting season.
Norco Bluffs is almost exclusively comprised of riparian plant species without adjacent upland. Native species of willow, predominantly Goodding’s black willow, dominate much of the

LBVI AND SWFL REPORT 2017 SANTA ANA WATERSHED ASSOCIATION METHODS
7
landscape, but large swaths are still heavily dominated by invasive arundo. According to A Manual of California Vegetation, the habitat within the Norco Bluffs survey area is classified as a Salix gooddingii Woodland Alliance with arundo as a co-dominant (Sawyer et al. 2009). Areas not dominated by mature Goodding’s black willow or arundo consist of early successional riparian woodland. These areas are where the river previously changed course and destroyed habitat, which has since regrown. Species in the more recently disturbed areas are composed of Goodding’s black willow, arroyo willow, Pacific willow (Salix lasiandra), and narrowleaf willow.
Temescal Canyon
Temescal Canyon is approximately 26 miles (42 km) long and located along Interstate 15 between Lake Elsinore and Highway 91. Survey areas include Railroad Canyon, Lake Elsinore, and Temescal Wash. The wash extends from Lake Elsinore downstream to two miles upstream of the intersection of Magnolia Avenue where it becomes channelized and flows into Prado Basin.
SAWA has monitored vireo in Temescal Canyon since 2001 when it began its arundo removal program. Temescal Wash is currently being managed for arundo regrowth and native vegetation has begun to reestablish. Five biologists covered the canyon over three visits in 2014, 2015, and 2016 with the goal of documenting an accurate territory count and as much data on reproductive status as time allowed. Due to additional funding for the 2017 season, a seasonal contract biologist was hired to cover the entirety of the canyon and collect the same data, albeit over several more visits. The additional visits resulted in a more complete dataset than was possible in prior years. However, the contractor was unable to collect a complete dataset from the habitat within the Dos Lagos golf course due to denial of access to the area. Consequently, the only data collected from this area was from a single visit early in the season.
The habitat within Temescal Canyon is characterized by patchy, but dense riparian vegetation. Privately owned sand and gravel mines operate downstream adjacent to the creek. A commercial fishing lake is located near the middle section of the wash. Areas of complete channelization without riparian habitat occur downstream of Lake Elsinore and the most downstream section of the wash. Many sections of the wash are channelized by riprap and berms, but still allow some meandering for quality riparian habitat. According to A Manual of California Vegetation, the riparian zone in Railroad Canyon and the wash downstream of Lake Elsinore is classified as a Salix gooddingii Woodland Alliance (Sawyer et al. 2009). The riparian habitat surrounding Lake Elsinore is dominated by Tamarix spp. Semi-natural shrubland stands also occur with patches of sparse Goodding’s black willow. Although SAWA has been effectively treating arundo since 2000, tamarisk has now become a dominant exotic throughout the wash, especially in areas surrounding Lake Elsinore.

LBVI AND SWFL REPORT 2017 SANTA ANA WATERSHED ASSOCIATION METHODS
8
Chino Hills
The fragments of riparian habitat in Chino Hills along Highway 71 have been surveyed annually since 2003. A total of fourteen riparian habitat patches were monitored in Chino Hills, including a small ravine off Butterfield Ranch Road, Slaughter Canyon Creek at Butterfield Park, a flood basin at Brookwood Lane and a patch of habitat at Slate Drive. Formerly considered assessment sites, habitat at Soquel Canyon and the Community Park at English Channel were also monitored in 2017. One section adjacent to Butterfield Ranch Road that historically held three territories was lost to development. Most of these locations occur on private property for which access is restricted. According to A Manual of California Vegetation, the riparian patches in Chino Hills are classified as a Salix gooddingii Woodland Alliance (Sawyer et al. 2009).
Santa Ana Canyon
The Santa Ana Canyon (SAC) is located downstream of the Prado Dam to Weir Canyon Road, a distance of approximately nine miles (14 km). Due to the differences in the habitat throughout the canyon, it was divided into three sites: the Upper Canyon, Green River Golf Club, and Featherly Regional Park. The Upper Canyon is located from Prado Dam downstream to the beginning of the Green River Golf Club. The Green River Golf Club covers approximately two miles (3.5 km) of the habitat, and about 4.4 miles (7 km) is in the County of Orange’s Featherly Regional Park. This location description and site history discuss the entire SAC.
This site has undergone a variety of impacts in the past decade. The Freeway Complex Fire of November 2008 destroyed habitat for an estimated 43 territories in SAC. However, this did not deter the vireo returning the following spring as expected, with only moderate decreases in 2009 at Upper Canyon and Featherly Regional Park. The USACE riverbank stabilization project (Reach 9) started in the winter of 2009 and 2010 near the western half of Green River Golf Club, removing over 16 acres of mature riparian habitat that survived the fire. This particular project directly affected six territories due to excavations that were needed to reconstruct the riverbed and banks in order to protect Highway 91 and adjacent homes. There were additional riparian impacts in the fall/winter of 2011 as the next phase of the riverbank stabilization project got underway further upstream, removing several more acres of mature riparian habitat. In 2014, Phase 3 of the stabilization project began and subsequently impacted the habitat of ten more vireo territories. In 2015, no USACE project work occurred during the nesting season in SAC. In 2016, Phase 5a of the Corps project began adjacent to La Palma Avenue in Yorba Linda, impacting nine vireo territories, though habitat was only partially removed from two territories. Additional disturbances in SAC in 2016 included repeated vegetation removal and grove expansion by the orange grove lessee in Featherly Park and the on-going brine-line project activities in the Upper

LBVI AND SWFL REPORT 2017 SANTA ANA WATERSHED ASSOCIATION METHODS
9
Canyon and adjacent to the Green River Golf Club. In 2017, activities in Phase 5a continued and Phase 5b began upstream, removing habitat from an additional 10 vireo territories. Concurrently, Phase 4 began on the south side of the river upstream from Canyon RV Park, completely removing habitat from one vireo territory and partially impacting other territories.
There is a variety of habitat types throughout SAC. Vireos typically inhabit the riparian zone along the river, but also use the adjacent upland habitats for nesting and foraging. According to A Manual of California Vegetation (Sawyer et al. 2009), the riparian zone is classified as a Salix gooddingii Woodland Alliance, with Fremont cottonwood as a co-dominant. The least disturbed adjacent upland is classified as a Sambucus nigra Shrubland Alliance. There are several areas adjacent to the riparian habitat that are in various stages of restoration and cannot be classified at this time. Additionally, there are some adjacent areas that are non-native dominant, such as the Green River Golf Club and Chino Hills State Park areas. The dominant invasive plant in the riparian zone is arundo. The dominant invasives in the adjacent upland zone are Russian thistle, mustard, and tocalote (Centaurea melitensis). Other invasive plant species in SAC include tamarisk, tree of heaven, castor bean, perennial pepperweed, gum tree (Eucalyptus sp.) and Peruvian pepper tree (Schinus molle).
Upper Canyon
The Upper Canyon is located adjacent to Highway 91 within the County of Riverside, from downstream of Prado Dam to the northeast edge of Green River Golf Club. This site is the upstream portion of what is considered the Santa Ana Canyon. The Upper Canyon has undergone a barrage of habitat disturbances from native vegetation removal, subsequent restoration, additional vegetation removal and a devastating fire in the last decade. Heavy construction around and just below Prado Dam occurred from 2005 to 2008 and removed habitat for ten territories in 2005. Some of the habitat that was restored after construction is now upland habitat; however, other restored riparian habitat is maturing and being used by the vireo. In November 2008, the Freeway Complex Fire destroyed a wide swath of habitat that had held six territories that were not detected in 2009 or 2010. These areas were part of Phase 2A of the USACE riverbank stabilization project which is now complete in the Upper Canyon and restoration activities are ongoing.
Green River Golf Club
The Green River Golf Club is located along the Santa Ana River in San Bernardino, Riverside, and Orange Counties, between the Upper Canyon site and Featherly Regional Park. This site is the middle portion of what is considered the Santa Ana Canyon.

LBVI AND SWFL REPORT 2017 SANTA ANA WATERSHED ASSOCIATION METHODS
10
Habitat at the Green River Golf Club has recovered well since the devastating Freeway Complex Fire that swept through SAC in November 2008. The USACE Reach 9 bank stabilization project removed almost 16 acres of habitat that was unburned and was occupied by six vireos. The next phase of the project started during the fall/winter of 2011 with several more acres of riparian habitat removed that included mature willow and cottonwood trees that had been spared by the 2008 wildfire. This area supported an additional 13 vireo territories in 2011. The 2010 project phase was roughly 75% complete at the end of the 2012 season with some replanting underway, but the net result for the 2012 season was still a large loss of habitat and construction activities, which most likely contributed to the decline in vireo activity that season. In 2014, no additional habitat was removed; however, construction continued adjacent to occupied habitat upstream of the railroad bridge in the beginning of the nesting season. On May 1 of that season, a vireo nest was found within 100 feet of construction activities that were moving toward the nest. The USACE and the U.S. Fish and Wildlife Service (USFWS) were both notified immediately, but work continued toward the nest. By the next week the nest had been abandoned with two eggs. Subsequently, other vireo nests were found near construction activities and work eventually stopped in this area for the rest of the 2014 season. No USACE related construction activities occurred at this site during the 2015 - 2017 nesting seasons. The Riverside County Santa Ana River Interceptor (SARI) Line project on the west side of the golf course impacted a small area in Lower Aliso Canyon in 2016. Although there was one vireo territory at this location in past years, none were documented in 2016 or 2017.
Featherly Regional Park
Featherly Regional Park is located along the Santa Ana River, between the west end of the Green River Golf Club and the Yorba Linda Blvd./Weir Canyon Rd. bridge in the County of Orange. This site is the downstream portion of what is considered the Santa Ana Canyon.
The Santa Ana River Trail and Parkway runs adjacent to the park. Public access is restricted; however, there is no fencing to deter entry into the riparian habitat. Phase 3 of the USACE reinforcement project began in 2014. Habitat was removed on both sides of the river, upstream from the Canyon RV Park. Restoration is now in progress for this phase of the Reach 9 Project. Phase 5a of the Reach 9 project began in 2016 and continued throughout the nesting season. Due to access limitations and high noise levels, vireos near this project were not closely monitored. Preparations for the next phase of this project downstream of Coal Canyon began late in the 2016 season. Vegetation in this area was prematurely removed from several vireo territories. It is unlikely that any vireo nests were disturbed by this activity since all closely monitored vireos in SAC were no longer nesting at this time. However, many resident avian species still had active nests that may have been impacted. In 2017, activities in Phase 5a

LBVI AND SWFL REPORT 2017 SANTA ANA WATERSHED ASSOCIATION METHODS
11
continued and Phase 5b began upstream, removing habitat from an additional 10 vireo territories. Concurrently, Phase 4 began on the south side of the river upstream from Canyon RV Park, completely removing habitat from one vireo territory and partially impacting other territories.
Sampled Sites
In 2005, SAWA expanded its monitoring program to all known potential vireo habitats in the watershed in an attempt to capture watershed-wide population numbers. These assessment surveys, now referred to as sampled sites, have proven valuable to SAWA as well as local, state and federal resource agencies by documenting previously unknown vireo occupancy and identifying areas in need of restoration. Sampled sites were surveyed at least three times during the 2017 nesting season in an attempt to document accurate territory numbers and incidental reproductive data. The first surveys were conducted between 4/10-4/27, the second surveys between 5/2-5/25, and the third between 6/12-6/22.
Mockingbird Canyon
Mockingbird Canyon is located in the city of Riverside in Riverside County, and its arroyo serves as a drainage tributary to the Santa Ana River. The riparian zone can be classified as a Salix gooddingii Woodland Alliance (Sawyer et al. 2009), with Fremont cottonwood as a co-dominant. However, the arroyo is also interspersed with red willow and arroyo willow. The dominant invasive plant in the riparian zone is perennial pepperweed with mustard being the dominant invasive in the adjacent upland zone.
Although the reservoir and basin are protected from development at this time, residential development continues throughout Mockingbird Canyon. Damage to the habitat and potential harm to nesting vireos occurs from residents extending their property into the arroyo. Most of the adjacent upland habitat will soon be lost and the arroyo is becoming more fragmented by culverts and bridges. The riparian habitat throughout the entire site is continually threatened by OHV’s, paintball activity, trash dumping, and other illegal activities. During the 2017 nesting season, riparian vegetation near Markham St. was bulldozed. SAWA manages an 11-acre easement in Mockingbird Canyon at Roosevelt St. and Markham St. and will continue to work with local property owners to enhance the canyon’s natural resources.
Incidental Sites
Incidental sites, for the purposes of this study, are those sites that were visited on one or two occasions and no nest monitoring occurred. Sites were visited in an attempt to obtain

LBVI AND SWFL REPORT 2017 SANTA ANA WATERSHED ASSOCIATION METHODS
12
number of territories, pairs, and fledglings. See Appendix A for a complete listing of GPS coordinates for all sites.
Vireo Monitoring
The primary purpose of surveys at monitored sites was to locate all vireos and willow flycatchers to determine accurate territory numbers, breeding status and to enhance breeding output through management. SAWA’s vireo management includes habitat restoration, protection and cowbird control. Potential habitats were carefully traversed along the edges and open trails. The vegetation communities in areas of detection, including dominant native and exotic vegetation species, were documented. All vireos encountered were noted as to location, behavior, and reproductive status on each visit or survey. GPS coordinates were taken in the approximate center of the territory, if known. Each point denotes a territory, not just a sighting. Nest locations were not marked. Territory size range was estimated for monitored sites. Attributes were associated with each vireo territory location and are as follows: unique ID, notes, survey location, surveyor name, agency, category (monitored/sampled/incidental), breeding status, GPS location, fledged (yes/no/unknown), number fledged, and parasitism (yes/no/unknown). A complete attribute table with detailed metadata was included in the shapefiles submitted to the USACE and USFWS. Banded vireos are reported annually to Barbara Kus of the U. S. Geological Survey (USGS) and the appropriate agencies. No playbacks of vireo vocalizations were used during surveys. Field biologists worked under the direction of the Principal Field Investigators and all surveys and nest visitations were performed under, and in compliance with, all terms and conditions of Federal Endangered Species Permit #TE-839480-4 and a Memorandum of Understanding with the CDFW. Biologist Florence Chan worked under her individual permit, #TE-22780B-0.
Surveys were conducted five days per week throughout the nesting season (March through August). Occasional visits to determine continued vireo presence occurred through September. Biologists watch for nesting behavior from a distance and do not approach nests during the nest-building stage. Subsequent nest visits were conducted from a greater distance with binoculars if possible. Otherwise, a telescopic mirror was used to observe nest contents. Extreme care was used to avoid leaving a trail to or scent near the nest. Nest searching or visitation was avoided if excessive scolding by an adult occurred or if predators were observed nearby (e.g. jays, crows, etc.). Nest monitoring was avoided if there was a chance of inducing premature fledging of nestlings, if approaching the nest would result in habitat destruction or trailing, and during extreme climatic factors that could cause disturbance to nesting birds. Nest visitation dates and times were variable depending on a pair’s reproductive stage. Nests were visited once every seven to eight days during incubation to check for cowbird eggs. If found,

LBVI AND SWFL REPORT 2017 SANTA ANA WATERSHED ASSOCIATION METHODS
13
cowbird eggs and nestlings were removed from nests (“manipulated”). If a parasitized nest had fewer than three remaining vireo eggs, a non-viable vireo egg was used to replace the cowbird egg.
Survey techniques and data analysis follow Pike et al. (1999). The following monitoring definitions were modified from Pike et al. (2005):
Adult: an after hatch year bird; Male: a singing individual; Female: a non-singing individual accompanied by a male. Breeding pair: only pairs for which nests were located, who were observed nest building, or were observed with at least one fledgling. Well-monitored pair: visited frequently enough to observe and document all successful nesting attempts and accurately quantify number of young fledged from pair. Unsuccessful nests may or may not be found. Pairs that are known not to have fledged young may also be considered well-monitored. Nesting attempt: any attempt by a well-monitored pair to build a nest. Includes carrying nesting material though never finding nest. Complete nest: a nest built by a pair; capable of receiving young. Well-tracked nest: a complete nest observed with a full clutch; nestlings observed at ≥ 8 days old. Successful nest: a nest that fledged at least one known young. Successful pair: a pair that produced at least one successful nest. Failed nest: a nest that had eggs or nestlings but produced no known fledged young. Presumed failure (nest): a complete nest that did not receive an egg; no powder from pin feathers seen in nest; adults seen without fledglings. Presumed successful (nest): a well-tracked nest with powder from pin feathers seen in the nest; nest intact. Depredation: the loss of all eggs or nestlings in a nest. Cowbird parasitism: classified as such only if a cowbird egg(s) or pieces, or nestling were found in, or below, the affected nest. Reproductive failure: classified as such when loss due to reasons other than depredation or parasitism (e.g. abandonment, etc.). Manipulated nest: cowbird egg or nestling removed from nest. Known fledged young: a fledgling seen out of the nest; nestlings from well-tracked nests, presumed fledged. Juvenile: a fledgling that has been out of the nest over 14 days. Productivity aka breeding success (population): the number of known fledglings (minimum) divided by the number of known breeding (nesting) pairs.
Migrant willow flycatchers were documented in conjunction with visual and auditory searches for vireos and other species. In addition to vireo data, special attention was paid to other sensitive species found on-site, which were reported to the appropriate agencies. A

LBVI AND SWFL REPORT 2017 SANTA ANA WATERSHED ASSOCIATION METHODS
14
complete list of wildlife species detected on-site is provided with sensitive species noted. GPS points were taken for all listed species and cowbirds detected in vireo habitat.
Brown-headed Cowbird Trapping
In 2017, thirty-seven cowbird traps were deployed in or near riparian habitat in drainages throughout the watershed in addition to six deployed at dairy farms, for a total of 43 traps (Figure 3). The USACE and the USFWS funded 29 habitat traps and six dairy traps. The SAWA/IERCD Reach 3B project funded six traps in San Timoteo Canyon and the remaining two traps were contracted. Most of the traps were opened by mid-March and closed by July 28.
Traps are designed after modified Australian crow traps. The trap is constructed of wood and covered in wire mesh, then fitted with shade cloth on the top to provide shade for the birds. Ideal trap locations are in accessible open areas near riparian habitat, or near feeding areas such as stables and dairies. Most traps are placed in areas inaccessible to the general public to protect the trap from vandalism. Traps were kept free from weeds and vegetation, and labeled with signs identifying the purpose of the trap as well as SAWA contact information. Consequences for tampering with the trap, according to the Migratory Bird Treaty Act, were also specified on these signs.
Trapping procedures followed the “Santa Ana Watershed Association and Orange County Water District Cowbird Trapping Protocol” (Tenant et al. 2008). Each trap contained a food bowl, one-gallon water dispenser, a large paint tray for use as a bath, and perches. Cowbirds were fed with a basic millet seed mixture. Field assistants were hired and trained by SAWA biologists to perform daily maintenance, safely handle birds, and properly identify and release non-target species. Non-target native species were released at the beginning of the check to minimize stress. Due to new permit conditions, dated August 8, 2014, SAWA is now required to dispatch all European Starlings (Sturnus vulgaris) and House Sparrows (Passer domesticus) caught in the traps. Since starlings require a different type of food and do not survive well in the traps, this permit condition required additional resources in supplies, time, and effort where these birds congregated and may hamper trapping of cowbirds. Due to these extenuating circumstances, some of these non-native species were released to avoid unnecessary distress to the birds.
Datasheets record non-target species, number of cowbirds in the trap (males, females, and juveniles), and number of cowbirds removed. Hatch-year birds were considered “juveniles” even as their adult coloring started to show. Traps were inspected daily for structural integrity. Assistants were in constant contact with their supervising biologist for quick resolution of any problems.

LBVI AND SWFL REPORT 2017 SANTA ANA WATERSHED ASSOCIATION METHODS
15
Traps were baited with male and female cowbirds that were captured over the fall and winter. The ratios used were two males to three females for smaller habitat traps, and two males to five females for larger habitat traps. Large traps placed on dairies were typically baited with five males to nine females. The flight feathers on each cowbird were trimmed so they were more likely to return to the trap if they escaped. A lock was placed on the trap to prevent unauthorized access. Removed cowbirds, starlings, and House Sparrows were transferred to a licensed falconer for dispatch or temporarily housed in a holding trap until the falconer could collect the birds. Holding traps contained extra food and water containers and were closed to entry by additional birds. If applicable, banded cowbirds were reported to the U.S. Bird Banding Laboratory, but only banded males were released. At the end of July, birds were removed from all of the traps and food and water was removed. Trap entry was closed and the door locked open to prevent unintended captures. SAWA’s field technicians removed traps from the field after they had been closed.
RESULTS
Vireo Abundance
In 2017, SAWA documented a total of 1,208 vireo territories, including 623 known pairs and 1,052 known fledglings at all monitored, sampled, and incidental sites. This represents a 13% (n=1,070) increase in territories from 2016, the highest number documented to date (Table 1). OCWD reported 549 territories in Prado Basin in 2017 (Bonnie Johnson, personal communication), and other agencies reported an additional 24 territories for a total of 1,781 vireo territories watershed-wide (Table 1). Monitoring efforts in 2017 were similar to 2016 in San Jacinto, San Timoteo, SAR - Upstream (Hidden Valley - North and South, and Goose Creek), Norco Bluffs, Chino Hills, and throughout the Santa Ana Canyon. In 2017, monitoring efforts increased in SAR - Upstream (Riverside Ave. to Van Buren Blvd.) and Temescal Canyon. The number of territories, pairs, and fledglings documented at each monitored site can be found in Table 2.
In 2017, all four sections of the upstream portion of SAR, Riverside Ave. to Van Buren Blvd., Hidden Valley - North, Hidden Valley - South, and Norco Goose Creek, were regularly monitored (>8 visits). Three-hundred eighty-seven territories were detected in 2017 within this section, an increase of 16% (n=333) from 2016. A majority of this increase was seen in Riverside Ave. to Van Buren Blvd. with 155 territories detected, an increase alone of 42% (n=109) from 2016 (Table 1). This increase may be partially attributed to the increased monitoring effort. Norco Goose Creek had 73 territories, an increase of 16% (n=63) from 2016, while Hidden Valley - South remained about the same, with 121 territories in 2016 compared to 123 territories in 2017. Hidden Valley - North showed a slight decrease of 11% (n=36) in 2017 from 40 territories

LBVI AND SWFL REPORT 2017 SANTA ANA WATERSHED ASSOCIATION RESULTS
16
in 2016. San Jacinto showed an increase of 22% (n=37) from 2016 to 45 territories in 2017. One hundred nine territories were detected in Temescal Canyon, up 17% (n=93) from 2016. This increase may be partially attributed to an increased survey effort. Chino Hills increased 39% (n=18) from 2016, with 25 territories detected in 2017. One hundred thirty-one territories were detected in the Santa Ana Canyon in 2017. This is a small increase of 7% (n=123) from 2016. Within SAC, the Green River Golf Club showed a greater increase of 27% (n=42) from 33 territories in 2016, along with Upper Canyon, which increased 15% (n=30) from 26 territories in 2016. Featherly Regional Park showed an 8% (n=64) decrease from 2016 with 59 territories detected in 2017. Norco Bluffs increased 10% (n=63) from 2016 to 69 territories in 2017, and Meridian Conservation Area showed a 14% (n=14) increase from 2016 to 16 territories in 2017. San Timoteo had a similar monitoring effort in 2017, and a similar number of territories (n=172) compared to 2016 (n=173; Table 1).
Most sites that were sampled in 2016 were also sampled in 2017. Two hundred forty-seven territories were detected at these sites in 2017, an overall increase of 19% (n=207) from 2016 (Table 1).
Chronology of Breeding Activity
Surveys at monitored and sampled sites began between March 13 and April 19. Surveys ended between July 11 and September 13. The first vireo detected on March 14 was at Hidden Valley - South. The earliest date for the arrival of 50% of the vireo at monitored sites was on March 29 at Norco Bluffs. The earliest date for 50% paired was April 10 at Hidden Valley - North. The first nests were found on March 27 at San Timoteo Canyon and Hidden Valley - South, and the last nest was found on July 12 at SAR – Upstream, Riverside Ave. to Van Buren Blvd. The first fledging occurred on April 26 at San Timoteo Canyon and the last fledglings occurred on July 20 at San Timoteo Canyon and the Meridian Conservation Area. The last date that vireo were detected in the habitat occurred on September 7 at SAR – Upstream, Riverside Ave. to Van Buren Blvd. and Hidden Valley - North (Table 3).
Nesting Site Preferences
Nesting site preferences followed parameters previously documented by other observers (Pike et al. 1999). Nests were found mostly in riparian vegetation, near water, along dirt trails or roads, and on edges of riparian habitat. Mulefat (24%) and arroyo willow (23%) were the primary plant species used for nest placement by vireos in 2017. Three other preferred species of willow were red willow (10%), Goodding’s black willow (9%), and narrowleaf willow (6%). Desert wild grape (Vitis girdiana), blue elderberry (Sambucus nigra caerulea) and Fremont cottonwood held

LBVI AND SWFL REPORT 2017 SANTA ANA WATERSHED ASSOCIATION RESULTS
17
another 7%, 4%, and 4% respectively. A complete list of plant species utilized by nesting vireos in 2017 can be found in Table 4.
Other vegetation used by vireos in the watershed include toyon (Heteromeles arbutifolia), laurel sumac (Malosma laurina), Southern California black walnut (Juglans californica), California wild rose (Rosa californica), golden currant (Ribes aureum), and poison oak (Toxicodendron diversilobum) (Appendix B-2). This suggests that Least Bell’s Vireo will use a variety of vegetation for nesting in otherwise suitable riparian or adjacent habitat. The use of non-traditional riparian vegetation for nesting by vireos supports the need for careful monitoring of all plants during the nesting season.
Reproductive Success
Reproductive success, as measured by productivity of well-monitored pairs, was 3.6 watershed-wide in 2017. This rate represents a substantial increase from 2.6 in 2016. Nesting success was 60% (167/279 well-tracked nests), an increase from 52% (93/180) in 2016. Average clutch size was 3.7 based on 256 complete clutches (Table 5). See Appendix C-3 for individual site data over time.
San Timoteo Canyon and SAC had similar monitoring efforts in both 2016 and 2017. San Timoteo nesting success increased from 51% in 2016 to 63% in 2017. This also represents an increase when compared to the overall nesting success of 57% for this site from 2001-2017. Nesting success in SAC was 59% overall, a substantial increase from 36% in 2016, and higher than the overall 55% nesting success for this site from 2001-2017 (Appendix C-3).
Predation Rates
Nests are assumed depredated if all eggs or unfledged young were destroyed or removed. In 2017, the overall depredation rate was 31% (86/279 well-tracked nests). Rates varied among sites. At sites with more than five well-tracked nests, depredation rates varied between 18% and 44% (Table 5). Historically, nest loss due to depredation is 33% watershed-wide (Appendix B-3). Most nest losses were due to unknown predators. In 2017, a female vireo was observed scolding a Greater Roadrunner (Geococcyx californianus) at SAR - Upstream (Hidden Valley – South) in the vicinity of a previously depredated nest. One brood of nestlings were found eaten by Argentine ants (Linepithema humile) in SAC. At the Goose Creek site, a Cooper’s Hawk was observed harassing a pair of vireo building a nest, causing them to scold. Two depredated nests, one in San Jacinto and one in SAC - Upper Canyon, were documented with holes in the side, though the predator in these instances is unknown. Other suspected nest predators include the California Scrub-Jay (Aphelocoma californica), American Crow (Corvus brachyrhynchos), Common Raven

LBVI AND SWFL REPORT 2017 SANTA ANA WATERSHED ASSOCIATION RESULTS
18
(Corvus corax), long-tailed weasel (Mustela frenata), raccoon (Procyon lotor), and snakes. These species occur at most sites throughout the watershed.
Feral pigs (Sus scrofa) are another potential predator. This species occurs in high numbers in San Timoteo Canyon and the upstream portion of the Santa Ana River. Isolated sightings have been made in other areas throughout the watershed. Feral pigs are extremely disruptive to habitat by creating wallows, possibly trampling or knocking over nests, and eating a wide range of vegetation and animals.
Brown-headed Cowbird Parasitism
In 2017, 4% (13/308) of all nests found were parasitized by cowbirds, following a 3% rate in 2016 (Appendix B-1). San Jacinto, San Timoteo Canyon, SAR - Upstream, and Temescal Canyon were sites in which parasitism was documented in 2017. The watershed - wide parasitism rate has ranged from 2% to 5% in the last eight years, and overall nest loss due to parasitism has ranged from 0% to 3% during that time (Appendix B-3). The low parasitism rates over the last eight years may be attributed to SAWA’s cowbird trapping program. The criteria for judging nest failure due to parasitism is the loss or abandonment of vireo eggs in the presence of a cowbird egg or nestling. Since SAWA began nest monitoring, 213 nests have been manipulated (cowbird egg or nestling removed), 96 of which successfully fledged 207 vireos (Appendix B-3).
Results and Discussion by Site
Monitored Sites
San Jacinto
In 2017, 45 vireo territories were documented in San Jacinto, 12 of which were in the San Jacinto Wildlife Area (SJWA) and the remaining 33 territories in the river. This is a 22% (n=37) increase from 2016 (Table 1). In previous years, this area has been monitored inconsistently due to funding and staff availability. Despite differential monitoring over the years, the population at these sites has increased over fifteen-fold from three territories in 2004 when SAWA began monitoring (Appendix D). This increase can likely be attributed to nest monitoring and cowbird management in the area. In 2017, estimated territory size of vireo in San Jacinto ranged between 0.87 to 9.93 acres.
Twenty-seven pairs and 48 fledglings were detected in 2017. Nesting success was 64% based on 11 well-tracked nests. Nest losses were primarily due to predation (18%); one nest (9%) was lost due to parasitism (Table 5). Eight well-monitored pairs had a 2.8 reproductive success rate and produced 22 fledglings. Nesting success is 52% over 13 years of monitoring (n=113 well-

LBVI AND SWFL REPORT 2017 SANTA ANA WATERSHED ASSOCIATION RESULTS
19
tracked nests), ranging from a low of 0% (n=1) in 2014 to a high of 100% in 2006 (n=2) and 2010 (n=3) (Appendix D). Depredation has been the major cause of nest loss in the last 13 years (36%). Reproductive success based on productivity of well-monitored pairs in the last 13 years is 2.7 (Appendix C-3-A) and has ranged from a low of 0.0 in 2004, 2005, and 2011 to a high of 4.5 in 2008 (Appendix D). Narrowleaf willow (47%) and mulefat (28%) have been the primary plant species used for nest placement in San Jacinto since 2003. Goodding’s black willow and coyote brush (Baccharis pilularis) held another 9% and 5%, respectively. Only three nests found from 2003 to 2017 were placed in non-native vegetation (Appendix C-2-A).
Cowbird trapping has occurred in San Jacinto since 2003 (excluding 2015) and a total of 22,587 cowbirds have been removed during this time, mostly from local dairies (Appendix C-1-A). Parasitism has occurred consistently over the years, including the 2017 breeding season. During 2017, only one well-tracked nest was parasitized by cowbirds. In addition to the parasitized vireo nest, many cowbirds were observed in the habitat throughout the breeding season. At least two cowbird fledglings were observed in the habitat, including one being fed by a vireo that was not well-monitored.
Current threats to the riparian habitat primarily involve human encroachment, including the use of OHV’s in the riverbed and trash dumping. In the San Jacinto River, adjacent to State Street and approximately 1.5 miles upstream, several homeless camps have been established, which has resulted in refuse in the habitat. Vegetation was also cleared to build the camps. Almost half of the vireo in this area hold territories among the homeless camps. Ongoing drought conditions have also impacted the habitat within the river, with many trees in the upstream portion showing severe stress. On June 3, 2017, a fire burned approximately 27 acres (Cabral 2017). This fire impacted five vireo territories, one of which could not be accounted for after the fire.
Several proposed commercial, residential, and infrastructure projects pose potential future impacts to the San Jacinto River and area adjacent the San Jacinto Wildlife Area. The indirect impacts associated with construction and future use of a 40-million-square-foot World Logistics Center (Esquivel 2015; Patch CA 2016), the San Jacinto Gateway (San Jacinto River Levee 2015), as well as 11,350 residential units (The Villages of Lakeview 2017) remain to be seen.
San Timoteo Canyon
In 2017, 172 vireo territories were documented in San Timoteo Canyon, down one from the 173 documented in 2016 (Table 1). However, the population in San Timoteo has experienced a greater than 30-fold increase in 17 years. This increase can be attributed to the removal of invasive species and subsequent restoration of native vegetation, nest monitoring, and cowbird

LBVI AND SWFL REPORT 2017 SANTA ANA WATERSHED ASSOCIATION RESULTS
20
management. In 2017, estimated territory size of the vireo in San Timoteo ranged between 0.4 to 2.0 acres.
One hundred-nine pairs and 272 fledglings were detected in 2017. Nesting success was 63%, up from 51% in 2016 (Appendix C-3-B). Nesting success is 57% over 17 years of monitoring (n=935 well-tracked nests), ranging from a low of 29% in 2004 (n=31 nests) to a high of 100% in 2001 (n=4 nests). Forty-eight well-monitored pairs had a 4.2 reproductive success rate, up from 3.1 in 2016. Overall reproductive success based on productivity of well-monitored pairs in the last 17 years is 3.0 and has ranged from a low in 2004 of 0.8 to a high of 4.2 in 2017. Nest losses in 2017 were primarily due to depredation (35%). Depredation has been the major cause of nest loss in the last 17 years (35%) (Appendix C-3-B). Mulefat (27%), arroyo willow (22%) and red willow (16%) have been the primary plant species used for nest placement in San Timoteo since 2001. Desert wild grape and Goodding’s black willow held another 8% and 7%, respectively. Only ten nests found from 2001-2017 were placed in non-native vegetation (n=1,018 total nests; Appendix C-2-B).
Cowbird trapping has occurred in San Timoteo Canyon since 2001, and a total of 2,568 cowbirds have been removed during this time (Appendix C-1-B). One nest was parasitized in 2017; however, no parasitism occurred in San Timoteo in 2016 or 2015. In 2014, five (6%) of 88 well-tracked nests were parasitized by cowbirds. These low rates remain a marked decrease from a high of 75% in 2001. Although parasitism by cowbirds still occurs, at a rate of 12% (115/938 nests) over 17 years, only 3% of nests have failed due to parasitism (Appendix C-3-B). This low failure rate is primarily a result of intensive nest monitoring efforts which include nest manipulation.
Although the riparian area is protected under existing laws, residential and utility development continues in San Timoteo Canyon. Current threats to the riparian habitat include removal of vegetation by landowners, human encroachment (e.g. paintball and all-terrain vehicle activities), and domestic sheep and cattle grazing. Feral pigs continue to disturb the habitat throughout the canyon.
Meridian Conservation Area (former March SKR Preserve)
In 2017, 16 territories, 9 pairs, and 23 fledglings were documented in the Meridian Conservation Area (Table 1). Five nests were discovered in 2017, all of which were successful and produced a total of 15 fledglings. Since SAWA began surveying this area in 2004, over 180 fledglings have been detected (Appendix C-3-C). In 2017, estimated territory size of vireo ranged between 0.5 and 2.0 acres.

LBVI AND SWFL REPORT 2017 SANTA ANA WATERSHED ASSOCIATION RESULTS
21
Two traps were deployed in 2017 and captured 18 cowbirds over 260 trap days. Cowbird trapping has occurred at this site since 2004, and a total of 237 cowbirds have been removed during this time (Appendix C-1-C). No parasitism has been documented in the Meridian Conservation Area since monitoring and trapping began.
Although the Meridian Conservation Area is protected from development at this time, development currently occurring in the adjacent upland habitat may severely limit foraging opportunities for vireo and other native birds. Other current threats to the habitat are human encroachment (recreational activities including OHV use, biking, and jogging) and homeless encampments.
Santa Ana River (SAR) - Upstream
Prior to 2015, data from the four sites grouped into the SAR - Upstream section were reported separately. In 2015, the upstream section did not include Goose Creek, Norco to I-15; however, data from all four sites is now incorporated in this overall summary for comparison. Individual site data is discussed below.
In 2017, 387 vireo territories were documented, up 16% from the 333 documented in 2016 (Appendix C-1). Vireo abundance has increased throughout the upstream section since monitoring began in 2000, and may be attributed to the removal of invasive vegetation, mowing in the Riverside Flood Control channel upstream, as well as vireo nest monitoring and cowbird management. In 2017, estimated territory size of vireo in SAR - Upstream ranged between 0.13 and 11.0 acres. Differential nest monitoring efforts have been undertaken since 2000. In 2017, nesting success for SAR - Upstream was 59% (n=91 well-tracked nests), similar to the overall of 65% from 2000-2017. Nest losses in 2017 were primarily due to depredation (30%). Nine (9%) nests were parasitized by cowbirds in 2017 (Table 2), five of which failed. The overall parasitism rate since 2000 is 8% (Appendix C-3).
Mulefat (31%) and arroyo willow (29%) have been the primary plant species used for nest placement in the upstream section of the Santa Ana River since 2000 (n= 808 nests). Goodding’s black willow held another 12%. Only nine nests found from 2000-2017 were placed in non-native vegetation, including combinations with at least one non-native species (Appendix C-2).
Cowbird trapping has occurred in SAR - Upstream since 2000 and total of 2,048 cowbirds have been removed during this time. In 2017, five traps were located in this section of the river and a total of 53 cowbirds were removed over 642 trap days (Appendix C-1). Observed disturbances are reported below for the four individual sites that comprise SAR - Upstream.

LBVI AND SWFL REPORT 2017 SANTA ANA WATERSHED ASSOCIATION RESULTS
22
SAR - Riverside Ave. to Van Buren Blvd.
In 2017, 155 vireo territories were documented along the Santa Ana River from Riverside Ave. to Van Buren Blvd., a 42% increase from the 109 detected in 2016 (Table 1). Increased effort at this site in 2017 can be attributed for some of this increase; however, since adding approximately 2.9 miles to the survey site in 2013 (n=77 territories), there has been an increase in vireo numbers. While efforts are made to count all territories and pairs, the dangers in some parts of the river (e.g. homeless camps) limit the number of areas that can be safely monitored. Prior to the start of the 2014 and 2016 nesting seasons, Riverside County Flood Control conducted routine mowing of vegetation from Riverside Ave. to Mission Blvd. While there was a decline in vireo territories in the immediate area of mowing those years, the overall survey site did not see a significant decrease in territories, suggesting they shifted to new areas downstream. In the years following mowing, monitoring efforts showed an increase in vireo territories. This suggests as the vireo move into different areas of the site immediately following mowing, the offspring, or possibly the breeding birds themselves, return to those newly inhabited territories, thus expanding the extent of habitat occupied. Research suggests vireo show strong natal-site fidelity, as well as strong site fidelity between different breeding seasons (Greaves 1990, Smith 2000). The occupancy and distribution observed at this site appears to support these conclusions.
Ninety-five pairs and 169 fledglings were detected in 2017 (Table 2). Nesting success was 59% (n=46) down from 83% (n=12) in 2016. Nest losses in 2017 were primarily due to depredation (26%) and 27 well-monitored pairs had a reproductive success rate of 2.9 (Appendix C-3-F). Mulefat (29%), arroyo willow (25%), and Goodding’s black willow (10%) have been the primary plant species used for nest placement in this section of the Santa Ana River since 2002 (n= 200 nests). Only three nests found from 2002-2017 have been placed in non-native vegetation (Appendix C-2-F).
Brown-headed Cowbird trapping at this site has occurred on public land, private business and residential properties since 2002, and 765 cowbirds have been removed during this time (Appendix C-1-F). Seven (six well-tracked) nests were parasitized in 2017 and although six were manipulated, none successfully fledged vireo young. Four of the manipulated nests failed due to parasitism and two failed due to predation. In 2017, 22 cowbirds were detected in the survey area.
Recreational use and human encroachment, such as homeless camps, continue to be a threat to the habitat. Recreational activity was particularly heavy at Martha McLean - Anza Narrows Park in the vireo occupied habitat near the railroad bridge. This area was used as a swimming hole and was inundated with garbage (especially food trash, alcohol containers and

LBVI AND SWFL REPORT 2017 SANTA ANA WATERSHED ASSOCIATION RESULTS
23
used diapers), off leash dogs, latrines from day users, and trails all the way to the main river corridor. A similar disturbance was observed near the Van Buren bridge, though not as widespread as Anza Narrows. Homeless camps are a greater threat to the site with observed clearing of understory or whole areas of vegetation, compaction of dirt, unleashed dogs, cats, chicken coops, chain-link or wooden fences, solar panels, generators, large scale latrines, small landfills and OHV’s in the habitat. While homeless camps have always been an issue at this site, the level of development observed is becoming quite detrimental to the habitat and vireo.
SAR - Hidden Valley - North (north side of river)
Thirty-six territories were documented in 2017, a decrease of 11% from 40 territories documented in 2016. Seventeen pairs and 34 fledglings were detected in 2017 (Table 2). Differential nest monitoring efforts have been undertaken at this site since 2010. In 2017, nesting success was 70% (n=10 well-tracked nests), an increase compared to the overall of 63% over four years of nest monitoring (2010, 2014, 2016, and 2017). Depredation (19%) and parasitism (15%) have been the major causes of nest loss for all years monitored. Overall reproductive success of 19 well-monitored pairs is 3.0 and has ranged from a low of 2.0 in 2014 to a high of 4.0 in 2017 (Appendix C-3-G). Mulefat (38%) has been the primary plant species used for nest placement in this section of the Santa Ana River. Arroyo willow and Fremont cottonwood held another 16% and 13%, respectively. None of the 32 nests found since 2010 have been placed in non-native vegetation (Appendix C-2-G).
Parasitism occurred at a rate of 18% (n=11 nests) in 2017, the same as the overall parasitism rate (n=28 nests) over four years of nest monitoring (Appendix C-1-G). There were no cowbird observations in the habitat during vireo monitoring season.
Current threats to the riparian habitat include human encroachment in the form of homeless encampments and recreational use. River access at Etiwanda Avenue was permanently closed by the Riverside County Regional Parks and Open Space District due to increased dumping of trash at this location; however, other river access points have become more accessible to the public. The City of Jurupa Valley built a parking lot at the Downey Street entrance to the river, where there had never been legal parking available in the past. This lot has allowed easy access to the river for recreational use including swimming, barbecuing, picnicking, and live bands. The result of these activities was an increase in refuse along the bank and in the river, as well as noise disturbance to the wildlife itself.

LBVI AND SWFL REPORT 2017 SANTA ANA WATERSHED ASSOCIATION RESULTS
24
SAR - Hidden Valley - South (south side of the river)
In 2017, 123 vireo territories were documented in Hidden Valley - South, the highest number recorded at this site. This represents an increase of 2% from the 121 vireos documented in 2016, and an overall increase of 779% since surveys began in 2000 (n=14 territories; Appendix D). Sixty-seven pairs and 87 fledglings were documented in 2017. Nesting success was 44% for 16 well-tracked nests (Table 5). Nest monitoring did not occur at this site in 2015 but nesting success has been 64% overall since monitoring began in 2000 (n=163 well-tracked nests). Since 2010, nesting success has ranged from a low of 41% (n=17) in 2010 to a high of 88% (n=8) in 2013. Nest losses in 2017 were primarily due to depredation (44%). Reproductive success based on productivity of well-monitored pairs over 14 years of monitoring is 2.7, and since 2010 has ranged from a low of 2.1 in 2010 to a high of 4.8 in 2017 (Appendix C-3-H). Arroyo willow (31%), mulefat (26%), and Goodding’s black willow (11%) have been the primary plant species used for nest placement (n= 197) in Hidden Valley - South since 2000. Red willow and desert wild grape held another 9% and 6% of nests, respectively (Appendix C-2-H).
Prior to 2015, SAWA had conducted cowbird trapping in Hidden Valley - South and removed a total of 708 cowbirds. Starting in 2015, the Riverside County Regional Parks and Open Space District began trapping cowbirds at this site. Parasitism at Hidden Valley - South is low, with an overall rate of 5% (n=165 nests) since 2000. Parasitism has not been documented at this site since 2011 when 20% (n=10) of nests were parasitized (Appendix C-1-H). Only one male cowbird was observed in the habitat during vireo monitoring in 2017.
Current threats to the riparian habitat primarily involve human encroachment, particularly recreational use. Equestrian trails are found throughout Hidden Valley, and are subject to maintenance activities such as vegetation trimming and tree cutting. In recent years these activities have been performed outside of nesting season, presenting minimal impact to nesting vireo. This year evidence of recreation use along the Santa Ana River was discovered. The north side of the river has been experiencing impacts from increased use of the beaches for recreational opportunities, especially during the hot summer months. This activity has now spread across the river to Hidden Valley - South, resulting in a refuse problem in the river and wildlife area.
SAR - Goose Creek, Norco to I-15
In 2017, 73 vireo territories were documented along the SAR - Goose Creek, an increase of 16% from the 63 vireos documented in 2016. Thirty-four pairs and 54 fledglings were also documented (Table 2). Nesting success for 19 well-tracked nests was 68%, an increase from 43% in 2016. Nest losses were due to depredation (32%). The reproductive success rate of well-

LBVI AND SWFL REPORT 2017 SANTA ANA WATERSHED ASSOCIATION RESULTS
25
monitored pairs was 2.9 in 2017 (Table 5). Since 2010, this rate has ranged from 2.3 in 2016 to 3.6 in 2012 (Appendix C-3-I). In 2017, nests were primarily placed in mulefat (37%) and arroyo willow (32%). Overall nest placement since 2000 has been similar, with 34% of nests being placed in mulefat and 31% in arroyo willow. Goodding’s black willow and desert wild grape held another 14% and 5% of nests, respectively (Appendix C-2-I).
Brown-headed Cowbird trapping has occurred in Goose Creek, Norco to I-15 since 2004 and data is reported as part of the SAR - Upstream route. Five hundred seventy-five cowbirds have been removed from this area in over 2,808 trap days (Appendix C-1-I). Parasitism has been documented on the site in seven out of 17 years surveyed; however, parasitism has only been documented in one of the last eight years (2013). Overall parasitism is low, with a rate of 5% (n=325 nests) since 2000 (Appendix C-3-I). No cowbirds were detected in the habitat and no nest parasitism was documented during the 2017 nesting season.
At this time, work is continuing on a residential development adjacent to the northern edge of the riparian habitat. Potential risks to the vireo habitat from this development are the unauthorized removal of vegetation for additional equestrian trails, dumping, noise and other human related disturbances. Continued active management of this area will maintain optimum conditions for its native species.
Norco Bluffs, I-15 to River Rd.
In 2017, a total of 69 vireo territories were detected in the area monitored by SAWA, a 10% increase from 63 in 2016. Thirty-one were known to be paired and 76 fledged young were documented (Table 2). A total of 25 nests were found, 22 of which were well-tracked. Nesting success of well-tracked tracked nests was 77% in 2017, an increase from the 58% in 2016 and 69% in 2015. The reproductive success rate also increased from 3.0 in 2016 to 3.5 in 2017, but was still lower than the 2015 rate of 3.7. Average clutch size was 3.6 compared to 3.4 in both 2016 and 2015. Of the 22 well-tracked nests, 18% (n=4) were lost due to depredation, compared to 33% (n=4) in 2016 and 15% (n=2) in 2015. A single nest failed due to reproductive failure in 2017 (5%) and 2016 (8%), compared to two (15%) in 2015. No tracked nests were lost due to parasitism (Appendix C-3-J). Size of vireo territories ranged from approximately 0.8 to 2.4 acres.
SAWA did not conduct cowbird trapping at this location; however, a contractor retained by USACE conducts trapping in this area. No cowbirds were detected in vireo habitat over the course of the season.
As in 2016, the primary sources of habitat degradation this past season were invasive plants and the continued negative impacts of the polyphagous shot hole borer (PSHB). This beetle

LBVI AND SWFL REPORT 2017 SANTA ANA WATERSHED ASSOCIATION RESULTS
26
drills into trees and brings with it a pathogenic fungus (Fusarium sp.) that can infect, and kill, many different tree species. Fortunately, the large-scale dieback of riparian habitat, as observed in the Tijuana River Valley (Boland 2016), from PSHB infestation has yet to occur; nonetheless, arroyo willow have been significantly impacted by PSHB in Norco Bluffs. The majority of arroyo willows show signs characteristic of heavy infestation, e.g. heavy staining and branch dieback, or are completely dead. The Goodding’s black willows infested with the beetle/fungus are declining in health as well, albeit at a slower rate. Over the long term, the loss of cover from these species may have a negative impact on the local vireo population as 60% (n=15/25 nests) were placed in these two species alone in 2017 (Table 4). Previous to the arrival of PSHB, the Norco Bluffs habitat was characterized as healthy where arundo had yet to become dominant, but some significantly large areas are completely dominated by arundo and provide little habitat value to native wildlife. In addition to arundo there is a relatively small, yet highly dense, stand of mature Mexican fan palm (Washingtonia robusta) that appears to have a rapid rate of recruitment. The understory within the stand of palms consists primarily of younger palms with no significant presence of native plant species. Much like arundo, the palms provide relatively low-quality habitat compared to the surrounding areas dominated by native plant species. Assuming not all of the trees are eventually killed by PSHB, removal of arundo and palms would allow for passive recruitment of native riparian plant species, thereby dramatically increasing the total area of functional habitat for vireo and other sensitive species.
Temescal Canyon
One hundred-nine territorial vireo males were detected in 2017, compared to 93 in 2016 and 123 in 2015. This count represents a 17% decrease from the count of 131 territorial vireos in 2013, which to date, was the peak year (Table 1). Fifty-nine pairs and 16 nests were found incidentally in 2017. Forty-eight fledglings were detected, a large increase from the five detected in 2016 (Table 5). The increase in 2017 is largely due to the increased number of visits by the seasonal contract biologist in comparison to the three surveys SAWA conducted in the 2014, 2015, and 2016 breeding seasons.
In 2017, three nests were parasitized by cowbirds: two south of Corona Lake and a third in the habitat located along the northwest corner of Lake Elsinore. In addition, a vireo was observed feeding a juvenile cowbird and an adult cowbird was also observed in the same area. The sixth detection was an adult cowbird in the habitat northwest of the intersection of Highway 74 and Baker Street. Five cowbird traps were open for the 2017 season in Temescal Canyon. Four traps were located adjacent to riparian habitat and the fifth at a small dairy near Lake Elsinore where the highest parasitism rates typically occur. The five traps caught a total of 240 cowbirds over 652 trap days. Cowbird trapping has occurred during the nesting season in Temescal Canyon

LBVI AND SWFL REPORT 2017 SANTA ANA WATERSHED ASSOCIATION RESULTS
27
since 2001 and a total of 3,800 cowbirds have been removed during this time (Appendix C-1-K). Even with on-site cowbird trapping, parasitism has been documented in Temescal in ten out of the 17 years it has been surveyed, reaching a peak rate of 42% (n=5/12 nests) in 2007 (Appendix D).
Despite above average rainfall in 2017, drought stress is still obvious throughout Temescal Wash, especially downstream of Dos Lagos Golf Course where effluent outflow by City of Corona Wastewater Treatment Plant #3 was suspended in 2013. In 2014, a SAWA biologist familiar with that area reported to CDFW massive vegetation die-off due to lack of water from the historical water treatment outflow. This die-off has been amplified by the ongoing drought conditions and habitat quality has continued to decline since the effluent outflow was halted. In addition to these stressors, the habitat in Temescal Canyon and Lake Elsinore is regularly impacted during the nesting season by off-road vehicle use, illegal vegetation removal, and understory clearing to deter homeless encampments around Lake Elsinore. Management recommendations for this area include removal of Tamarix spp., enforcement of illegal vegetation removal during avian nesting season, continued cowbird trapping including placement of additional traps near locations where juvenile cowbirds have been detected, and most importantly, re-establishing outflow to the creek near Dos Lagos Golf Course.
Chino Hills
In 2017, Chino Hills was not monitored extensively due to inaccessibility to all vireo locations. Even though fewer site visits were conducted and survey effort was reduced, 25 territories, seven pairs, and three fledglings were documented in 2017, representing a 39% (n=18) increase in territories from 2016 (Appendix C-1-L). However, no pairs or nests were closely monitored in 2017.
One cowbird trap was deployed in Chino Hills in 2017. The trap was located near the Chino Hills Community Center at English Channel and captured 22 cowbirds over 113 trap days (Appendix C-1-L). Compared to 2016, 53 cowbirds were removed over 261 trap days, utilizing two cowbird traps. Trapping has occurred in Chino Hills since 2008, and a total of 216 cowbirds have been removed during this time (Appendix C-1-L). Before 2017, parasitism ranged from 43% (3/7 nests) in 2004 to 60% (3/5 nests) in 2007 (Appendix D). No parasitism has been detected since 2008, when cowbird control began, excluding 2015 when one nest was parasitized. No nest monitoring was done at this site in 2017; however, no vireo were observed with cowbird fledglings. No cowbirds were detected in the habitat during monitoring in 2017. Parasitism, development, human activity, cattle grazing, and small fragmented habitat patches are factors that may threaten vireo and reduce productivity throughout the Chino Hills area.

LBVI AND SWFL REPORT 2017 SANTA ANA WATERSHED ASSOCIATION RESULTS
28
Santa Ana Canyon
These results are compiled from three sites (Upper Canyon, Green River Golf Club, and Featherly Park), collectively known as SAC. One hundred thirty-one vireo territories were detected in the Santa Ana Canyon in 2017, a slight increase from the 123 territories detected in 2016 (Table 1). Vireo territory size in SAC is estimated to be between 0.7 acre and 4.3 acres. In 2017, vireo mean clutch size was 3.7 (n=43), an increase of 0.7 from 2016. Nesting success for 44 well-tracked nests in SAC in 2017 was 59% overall, a substantial increase of 23% (n=28 nests) from 2016 and 4% above the overall 55% nesting success for this site from 2001 to 2017. In 2017, 16 of 44 (36%) well-tracked nests were lost to depredation and two (5%) were lost to reproductive failure. No tracked nests were lost due to parasitism. The reproductive success rate in SAC in 2017 was 3.7, a substantial increase from only 1.7 in 2016 (Appendix C-3). This rate had been decreasing annually in SAC since 2011 when the rate was 2.7 (calculated from raw data at Upper Canyon, Green River Golf Club and Featherly Regional Park). One hundred sixty-five fledglings were documented in 2017, more than double the number of fledglings (n=68) documented in 2016 with a similar survey effort. A total of 1,202 fledglings have been documented in SAC over the last 17 years (compiled from Appendix C-1). Vireo used a variety of plant species (n=13) for nest substrate in 2017. Of the 51 total nests found, the highest number of nests were found in mulefat (33%), laurel sumac (12%), Southern California black walnut (8%), Goodding’s black willow (8%), and blue elderberry (8%; Table 4). Two banded vireo were detected in SAC and reported to the original bander, Barbara Kus (USGS).
SAWA began cowbird trapping in SAC in 2001 when parasitism was documented in five of 19 nests (26%). Parasitism was again documented in one of 21 nests (5%) in 2009 after five years of no occurrences (Hoffman et al. 2013). SAWA deployed two traps within a mile of that location and no parasitism has been recorded since. In 2017, five traps were deployed and 38 cowbirds were removed over 560 trap days. Since 2001, a total of 2,244 cowbirds have been removed from the canyon over 12,419 trap days during the vireo’s breeding season (Appendix C-1). There were no cowbirds detected in vireo habitat in the Santa Ana Canyon in 2017.
During the 2016 nesting season, it appeared that many pairs exhibited signs of delayed nest building activities and reproductive distress, possibly linked to the ongoing severe drought in southern California. Avian nesting success has been shown to be reduced during drought years (Albright et al. 2010; Skagen and Yackel Adams 2012). Bolger et al. (2005) found nesting success had a near linear relationship to yearly precipitation in four native bird species in southern California. The authors surveyed local arthropod abundance during years of normal precipitation and drought, and compared nesting success of these bird species. They were able to show that the lack of suitable prey species was the primary cause of nest failure during drought years. This

LBVI AND SWFL REPORT 2017 SANTA ANA WATERSHED ASSOCIATION RESULTS
29
could be a driving factor in the vireo’s delayed nesting and low success rates in SAC in 2016. The Santa Ana River runs perennially through SAC. However, being located downstream of Prado Dam, SAC has a drier habitat adjacent to the river than Prado Basin (above the dam) and may have a lower rate of primary productivity, especially during drought conditions. The prolonged 2016/2017 wet, winter season, coupled with a mild spring seemed to produce an abundant amount of available insect prey for breeding vireo. As a result, reproductive success and productivity in SAC rebounded in 2017.
At this time, riparian habitat in the Santa Ana Canyon is becoming infested with arundo at all three sites. The restoration edges between the golf course and the homes have opened new areas for arundo to infest along the river, while the arundo patches in the Upper Canyon continue to spread. In the lower section (Featherly Regional Park) the arundo had been treated with Imazapyr, which damaged many of the surrounding native trees. Though much of the arundo at this location is dead, the biomass remains, hampering native regrowth.
The polyphagous shot-hole borer (PSHB) is known to have infested trees in the Canyon RV Park within Featherly Regional Park and several trees in the riparian zone appear to have been infested (unconfirmed). There is no significant native tree die-off caused by the invasive PSHB observed in SAC at this time. SAWA has deployed PSHB traps in this area to assist in a monitoring program coordinated with the University of California, Riverside (UCR). The County of Orange has implemented the Santa Ana River Canyon Habitat Management Plan and SAWA biologists sit on two subcommittees overseeing implementation of the plan, though no meetings have occurred in the last three years. Although both the USACE riverbank stabilization (Reach 9) project and the brine-line project are expected to continue for several years, as well as the Santa Ana River Trail project set to begin in 2017, we hope active management of the canyon will continue to maintain optimum conditions for the native species.
Upper Canyon
In 2017, 30 vireo territories were documented in Upper Canyon, four more than 2016. Twenty-one were known to be paired and 32 fledglings were documented (Table 2). Nesting success for five well-tracked nests was 40% (Table 5). The single well-monitored pair had one successful nest that produced only two fledglings. Overall success of well-tracked nests for this site from 2001 to 2017 is 67% and the overall reproductive success rate of well-monitored pairs during the same time is 2.6. A total of 336 fledglings have been documented over the last 17 years (Appendix C-3-M). No cowbirds were detected in the habitat in 2017.
Cowbird trapping has occurred in the Upper Canyon since 2001 when the first vireos were detected on-site. To date, 707 cowbirds have been removed from this area (Appendix C-1-M).

LBVI AND SWFL REPORT 2017 SANTA ANA WATERSHED ASSOCIATION RESULTS
30
Parasitism has only been documented two of the 17 years monitored and reached its highest rate in 2003 (18%). There has been no parasitism detected in the Upper Canyon since 2003 (Hoffman et al. 2013).
Construction activities relating to the Reach 9 project did not occur during the breeding season at this location. Reach 9 restoration activities were ongoing and did not appear to impact vireo nesting. Unfortunately, this site continues to be plagued by other human-related impacts including fishing, trash dumping and branch-cutting, as well as large areas of invasive species (e.g. arundo) infestation.
Green River Golf Club
In 2017, 42 territories were documented, an increase of 27% (n=33) from 2016 (Table 1). The vireo population at Green River Golf Club has more than quadrupled since monitoring began in 2001 when only ten vireos were detected (Hoffman et al. 2013). Of the 42 males found, 33 were known to be paired and 76 fledglings were documented in 2017 (Table 2). Nesting success for 17 well-tracked nests was 76%, a large increase from 31% in 2016. The four unsuccessful well-tracked nests were all lost to depredation (Appendix C-3-N). The highest number of nests were placed in mulefat (32%), Peruvian pepper tree (14%), Southern California black walnut (14%), laurel sumac (9%), Fremont cottonwood (9%), and Goodding’s black willow (9%; Table 4). Overall nesting success from 2001 to 2017 is 60%. The reproductive success rate in 2017 was 4.4, the highest documented, whereas the overall reproductive success rate from 2001-2017 of well-monitored pairs is 2.4. A total of 427 fledglings have been documented over the last 17 years (Appendix C-3-N). Two banded vireo were detected in this section in 2016. One of those birds was not detected in 2017, though an un-banded, paired male was in its territory.
Cowbird trapping has occurred at the golf club since 2001 when the first vireos were detected on-site and a total of 1,067 cowbirds have been removed from this area (Appendix C-1-N). When SAWA began monitoring this site, the parasitism rate was 44%. There has been no parasitism detected since 2001 when cowbird trapping was initiated (Aimar et al. 2016).
Management at the Green River Golf Club has continued its cooperative relationship with SAWA and is supportive of SAWA’s efforts to control cowbirds, manage vireo and other sensitive species, and enhance habitat.
Featherly Regional Park
In 2017, 59 territorial vireos were detected in Featherly Regional Park, five fewer than 2016. Thirty-six were known to be paired and 57 fledglings were detected. A total of 439 fledglings have been observed over the last 17 years (Appendix C-1-O). These numbers

LBVI AND SWFL REPORT 2017 SANTA ANA WATERSHED ASSOCIATION RESULTS
31
emphasize the vireo population recovery at this site over the last decade given that no vireos were detected in 2001, the first year of monitoring. The population’s first major increase came in 2004 when it quadrupled from six in 2003 to 24 the following year (Hoffman et al. 2013). However, productivity has greatly fluctuated at this site from a high of 3.7 in 2003 to a low of 0.9 in 2016 (Appendix C-3-O; Appendix D).
Nesting success for 22 well-tracked nests in 2017 was 50%, double last year’s 25% rate and higher than the overall nesting success from 2002 to 2017 of 43%. Nine of 22 tracked nests (41%) were lost to depredation. Eleven closely monitored pairs had a high 3.5 reproductive success rate in 2017. The overall reproductive success rate of well-monitored pairs over 17 years of monitoring is 1.9 (Appendix C-3-O). This site typically has high depredation rates, though this is one of the lowest on record. Of the 24 total nests found in 2017, all except one nest were placed in native vegetation, with the highest number of nests (42%) placed in mulefat (Table 4).
The California Scrub-Jay, a well-known avian nest-predator, occurs in large numbers throughout Featherly Regional Park. One such depredation was observed as a scrub-jay took three seven-day old nestlings from one nest in 2015. Another nest invader found in large numbers throughout the site is the Argentine ant. One nest was found with ants entering a small hole in the eggs on hatch day in 2015. A later visit found the eggs to be completely empty with only the same small hole in each egg. In 2016, ants were observed eating two Black-headed Grosbeak (Pheucticus melanocephalus) nestlings and one egg. In 2017, Argentine ants were observed preying on vireo nestlings in a well-tracked nest. There was no parasitism or reproductive failure documented at this site in 2017. One banded vireo that held the same territory from 2013 to 2016 was again detected in this section.
Cowbird trapping has occurred in Featherly Regional Park since 2001 when the first vireos were detected on-site and 470 cowbirds have been removed during this time. Parasitism has been documented three out of the 17 years surveyed, reaching its highest rate in 2002 (67%). No parasitism has been detected in Featherly Regional Park since 2009 (Appendix C-1-O).
The habitat at Featherly Regional Park had become extremely drought-stressed, with the exception of the area immediately adjacent to the riverbanks, until the abundant winter rains in 2016/2017. The dramatic increase in breeding success at this site is likely due to the decrease in drought stress. The polyphagus shot-hole borer has been detected within the park, though no large die-off has been observed. Other ongoing disturbances at this site include habitat destruction during nesting season by the orange grove lessee, illegal fishing, and homeless camps. Invasive plants are still a problem at this site. The highly invasive arundo began re-sprouting two weeks after the Freeway Complex Fire in 2008. In an effort to take advantage of

LBVI AND SWFL REPORT 2017 SANTA ANA WATERSHED ASSOCIATION RESULTS
32
the arundo biomass removed by the fire, Orange County Parks management were able to spray herbicide on the rapid arundo regrowth before the following nesting season, which helped control a large amount of regrowth. Unfortunately, many patches have re-established since that time and a large amount of dead arundo biomass remains, hampering native plant regeneration. Additionally, the subsequent use of Imazapyr on arundo was found to be damaging nearby native trees in 2013. Trees damaged by Imazapyr continue to suffer and many were found dead in 2016. The County of Orange is working to remedy the problem and strives toward restoration of the entire park, which should enhance the habitat for vireo and other native birds in the future. Future disturbance from the multiple construction projects slated to continue for several years may challenge future vireo recovery in the impact areas. However, proposed mitigation should expand and enhance vireo habitat in the post-construction years. Three different phases of the USACE Reach 9 project were active in Featherly Park in 2017. Of the ten territories removed for Phase 5b, only two of those males were detected in adjacent habitat. Another male was detected fighting with a paired male early in the season, but was not found on subsequent visits. The 8% decrease of territorial males at this site from 2016 (n=64) to 2017 (n=59) is likely due to the habitat loss during construction.
Sampled Sites
Forty-four sites were sampled in 2017 and 247 additional vireo territories were documented. No vireo were detected at 11 of the 44 sampled sites. Most sampled sites in 2017 reported an increase in vireo territories. Santiago Canyon (Irvine Park) was one of the exceptions, which declined 18% from 17 territories in 2016 to 14 territories in 2017. This is a continuing downward trend for this site, which held 29 territories in 2013 and has declined each year since, most likely due to decreased survey effort (Table 1).
Cowbirds were detected at seven of the 44 sites: Alessandro/Prenda Arroyo, Box Springs, City Creek, Clearwater Parkway at Glen Helen, Mead Valley, Poorman Reservoir, and Irvine Park. With the exception of Irvine Park, none of these sites have cowbird traps on site.
Mockingbird Canyon
In 2017, 29 vireo territories were detected in Mockingbird Canyon, a 16 % increase from the 25 territories in 2016. Fifteen pairs and 15 fledglings were detected (Table 2). Two nests were found, one of which was successful. Measures of reproductive success have varied over the years due in part to differential monitoring efforts. Since 2003, overall success rate of well-tracked nests is 53% (84/158) and 441 vireo fledglings have been documented during this time (Appendix C-3-E). Nest placement has primarily occurred in red willow (31%), Goodding’s black willow (17%), and blue elderberry (16%; Appendix C-2-E).

LBVI AND SWFL REPORT 2017 SANTA ANA WATERSHED ASSOCIATION RESULTS
33
In 2017, there was no documented nest parasitism or detection of cowbirds in the habitat. Prior to 2010, 12 out of 82 (15%) well-tracked nests were parasitized and six (50%) of those nests failed as a result (Appendix C-3-E). Beginning in 2003, an intensive cowbird management program was initiated. The parasitism rate decreased sharply after this program began. Parasitism continues to occur episodically, but seems to be controlled. Since 2003, a total of 2,051 cowbirds have been removed from Mockingbird Canyon (Appendix C-1-E).
Despite SAWA’s efforts within our easement, habitat destruction and disturbance still occurs at Mockingbird Canyon. In 2016, a huge portion of habitat was removed along the north strip of land behind the homes off Owl Tree Rd., just west of SAWA’s easement site. Although this area is not part of the easement, it has historically had vireo nesting activity. In 2017, another portion of riparian habitat was bulldozed at the Markham Street entrance to the site, adjacent to SAWA’s easement. These disturbances may have impacted or greatly stressed nesting birds that were on site. In addition, the possibility of Cal Fire beginning a fuel modification project on site may put the number of vireo territories in the area at risk.
Incidental Sites
In 2017, seven additional vireo territories were documented incidentally at five sites in which no formal surveys were scheduled to be conducted (Table 1). The GPS coordinates of these locations can be found in Appendix A.
BROWN-HEADED COWBIRD TRAPPING RESULTS
Brown-headed Cowbird Trapping, March-July 2017
Forty-three cowbird traps were deployed during the 2017 vireo season and 2,644 cowbirds were removed from all sites over 5,209 trap days. The sex and ages of the cowbirds removed in 2017 were: 1,633 adult males, 742 adult females, and 269 juveniles. SAWA biologists and field assistants spent 2,745 hours servicing traps during the vireo season, including installation and removal of traps from the field (Table 6).
In 2017, cowbird captures decreased 17% from 2016 (3,177). However, two more traps were deployed in 2016. Eleven percent fewer males, 35% fewer females, and 42% more juveniles were trapped during the 2017 breeding season. In 2017, the overall capture rate per day of cowbirds was 0.46, a decrease from 0.56 in 2016. Over 37,500 cowbirds have been removed from the watershed by SAWA during the breeding season since cowbird management began (Appendix B-1).

LBVI AND SWFL REPORT 2017 SANTA ANA WATERSHED ASSOCIATION BROWN-HEADED COWBIRD TRAPPING RESULTS
34
In 2017, vandalism occurred at two traps in the SAR – Upstream portion of the watershed. One trap received minor damage but remained open. The second trap had its door torn off and as a result, four male and three female cowbirds escaped. This trap was subsequently shut down a week prior to the typical end of the trapping season.
Non-Target Captures in Cowbird Traps, March-July 2017
Twenty-four non-target native species, consisting of 2,094 individual trapping occurrences, were captured in the 43 traps. It should be noted that many of these trapping occurrences are most likely the same individuals returning to the same traps. The most common species were California Towhee (Melozone crissalis), Red-winged Blackbird (Agelaius phoeniceus), and House Finch (Haemorhous mexicanus). The mortality of non-targets in 2017 averaged 3.3% (Table 7). Numbers of European Starlings, House Sparrows and other non-native species either removed or released from cowbird traps are also listed in Table 7.
Fall/Winter 2016-2017 Brown-headed Cowbird Trapping and Non-Target Captures
Cowbird trapping took place at seven dairies during the non-breeding season (fall/winter) of 2016-2017. Three traps were located at different dairies in San Jacinto, one at a dairy in Temescal Canyon (Lake Elsinore), and three at two different dairies in the Prado Basin.
A total of 6,259 cowbirds were removed (1,357 adult males, 2,322 adult females, and 2,580 juveniles) over 871 trap days (Table 8). In the fall/winter of 2015-16, 5,105 cowbirds were removed from six dairies over 846 trap days (Aimar et al. 2016). In 2016-2017, the capture rate per day was 7.2, an increase from 6.0 in 2015-16. Over 73,500 cowbirds have been removed from the watershed by SAWA during the fall/winter since cowbird management began.
Four non-target native species, consisting of 139 individual trapping occurrences, were captured in the seven dairy traps in 2016-2017. The most common species captured was the Red-winged Blackbird. Non-target mortality was 1.4%. Numbers of European Starlings, House Sparrows and other non-native species either removed or released from cowbird traps during this period are also reported (Table 9).
SIGHTINGS OF INTEREST – INCIDENTAL SPECIES OBSERVATIONS
Incidental species sightings were documented at monitored sites and sensitive species were documented at sampled sites during vireo monitoring. One hundred forty-eight avian, 23

LBVI AND SWFL REPORT 2017 SANTA ANA WATERSHED ASSOCIATION RESULTS
35
mammal, 23 herpetofauna and three fish species were observed at monitored and sampled sites. Sensitive species were documented by site and a combined total of 36 sensitive species were detected (Table 10). Sensitive species are defined as those listed as endangered, threatened, or a species of concern by the resource agencies, and those covered by the Western Riverside County Multiple Species Habitat Conservation Plan (MSHCP). Observations are verified detections and are considered presence at each location, and should not be considered as a complete species list for each site. For example, California Gnatcatcher (Polioptila californica) were detected at three sites adjacent to vireo habitat; however, other gnatcatchers likely occur in adjacent areas biologists do not frequent. Similarly, some species are difficult to detect, such as the long-tailed weasel (Mustela frenata), and may occur in locations other than those reported here. Sensitive species sightings are reported annually to the appropriate resource agencies.
Southwestern Willow Flycatcher
Southwestern Willow Flycatchers (SWFL) have been documented sporadically in Prado Basin since 1996, and a total of 37 nests have been discovered on site from 1996-2013 (Pike et al. 2015). There were no detections of SWFL in the Prado Basin this year (Bonnie Johnson personal communication, 11 September 2017). In past years, the highest number of detections in the Prado Basin occurred in 2003, with nine individuals present.
In 2017, SAWA biologists detected 17 individual migrant Willow Flycatchers (WIFL) within the watershed. No breeding pairs were detected. On 5/10, two countersinging males were detected at Hidden Valley - South. Three singing males were detected on 5/16, two at Kabian Park, and one at Hidden Valley - North. Three singing males were also detected on 5/17, two countersinging males were observed at Meridian and one was observed at Poorman Reservoir. On 5/18, two singing males were observed at Carbon Canyon Regional Park in Brea and one adult was observed at Talbert Park. On 5/19, four males were observed at Peters Canyon. On 6/2, two whitting and singing males were observed together along the Santa Ana River at Goose Creek. Migrant Willow Flycatchers have been observed periodically throughout the rest of the watershed over the years, however SAWA has not documented any breeding attempts at monitored or sampled sites. All migrant Willow Flycatcher sightings are reported electronically to USGS Riparian Birds Working Group and to the California Natural Diversity Database.
DISCUSSION
With the exception of a few years, vireo abundance has increased annually in the Santa Ana Watershed since monitoring began in 2000 (Figure 5). In 2017, 1,781 vireo territories were documented watershed-wide (including data from Prado Basin and other reporting agencies), a 10% (n=1,623) increase from 2016 and the highest recorded since monitoring began (Figure 5).

LBVI AND SWFL REPORT 2017 SANTA ANA WATERSHED ASSOCIATION MANAGEMENT RECOMMENDATIONS
36
The significant population increase over 18 seasons of monitoring at four sites is illustrated in Figure 6. The 1,208 vireo detected by SAWA biologists in 2017, up 13% from 2016 (n=1,070), can be partially attributed to increased survey efforts at some sites. For example, SAR – Upstream -Riverside Ave. to Van Buren Blvd. alone experienced a 42% increase in territories in 2017 (n=155) compared to 2016 (n=109). Another site where survey efforts were increased in 2017 was Temescal Canyon, which showed a 17% increase in territories (n=109) from 2016 (n=93). However, Temescal Canyon has experienced an overall decline of 17% since 2013 (n=131). This decline could be due to the elimination of treated effluent discharged by local water agencies, and exacerbated by drought conditions. The lack of water in most sections of Temescal Canyon has caused a massive riparian vegetation die-off. This is of particular concern at this time since several other water agencies are proposing to reduce or eliminate treated effluent discharge into the Santa Ana River as well. Temescal Canyon habitat may soon become unsuitable for vireo if the outflow is not reestablished.
Of the areas sampled during the nesting season, one site that has shown a dramatic decline in territory numbers with a similar survey effort is Chino Hills State Park (CHSP). Although there was a 33% increase in territories in 2017 (n=20) from 2016 (n=15), numbers in this area have declined 61% from the 51 territories detected in 2010. These declining numbers can likely be attributed to severe habitat degradation in the riparian areas of the park, caused mostly by extreme drought stress and additional stress due to illegal cattle grazing in Lower Aliso Canyon. Although this park was devastated by the Freeway Complex Fire in 2008, the riparian habitat recovered well and the vireo numbers appeared stable in 2010. However, the adjacent native upland habitat converted to primarily invasive plant species. Since vireo are known to use adjacent areas for foraging and nesting, especially when the riparian area is as narrow as it is in CHSP, there may be a fire-related relationship to explore.
Nesting success watershed-wide was 60% in 2017, an increase from 52% in 2016 but similar to the overall nesting success of 59% (n=2,613 well-tracked nests) in the last 17 years. In 2017, the overall reproductive success rate (average number of fledglings produced by well-monitored pairs) was 3.6, the highest number reported since monitoring began and above the 17-year average of 2.8. Depredation remains the primary cause of nest failure, with an overall 31% of nests lost to depredation in 2017, similar to the 33% watershed-wide spanning all years of monitoring (Appendix B-3). Overall nest loss from reproductive failure in 2017 was 4% (17-year average of 5%). Examples of nest loss due to reproductive failure are non-parasitized egg abandonment, failure of the entire clutch to hatch, or failure of the vegetation to support the nest to a successful fledging.

LBVI AND SWFL REPORT 2017 SANTA ANA WATERSHED ASSOCIATION MANAGEMENT RECOMMENDATIONS
37
Parasitism continues to be episodic throughout the watershed. Four percent of nests were parasitized in 2017. The watershed-wide parasitism rate has ranged from 2% to 5% in the last eight years (Appendix B-3) and these low rates can likely be attributed to SAWA’s cowbird trapping program. Kus and Whitfield (2005) showed that cowbird trapping reduces parasitism of vireo nests, thus enhancing productivity of nesting pairs and in turn increasing the population level. Figure 7 shows the increase in vireo territories in relation to the rate of cowbird parasitism in the Santa Ana Watershed from 2001-2017. A comparison of watershed-wide nesting success, predation, and parasitism rates from 2003-2017 are shown in Figure 8.
The two primary causes of vireo decline in the past, parasitism by the Brown-headed Cowbird and the loss of riparian habitat, are being successfully managed by SAWA through cowbird trapping and habitat restoration. SAWA and OCWD biologists have removed over 150,000 cowbirds from the watershed, including Prado Basin, in the last 17 years (Figure 9). SAWA has also removed over 4,600 acres of invasive arundo from the watershed, allowing for as many acres of riparian recovery.
The lack of documented nesting Southwestern Willow Flycatchers in the watershed in 2017 is not surprising given the dwindling numbers over the last decade. No breeding activity from this species has been documented in the watershed since 2014. The habitat in the higher elevations of the watershed has had willow flycatcher territories in the past, and should be surveyed to ascertain the status of this imperiled species in the mountains. Unfortunately, SAWA does not currently have the funding for such an endeavor.
MANAGEMENT RECOMMENDATIONS
Parasitism by Brown-headed Cowbirds continues to occur episodically throughout the watershed. Vireo monitoring and cowbird trapping should continue along with the removal of non-native vegetation. The removal of arundo and other invasive vegetation, in conjunction with cowbird management, have had a positive influence on vireo territory numbers in the watershed since 2000. With the removal of over 4,600 acres of arundo and other invasive plants, SAWA has had extraordinary success with riparian habitat restoration along the Santa Ana River and its tributaries. Since invasive plants like arundo cannot typically be eradicated within a five-year mitigation term, we recommend that long-term maintenance of invasive plant regrowth become a mitigation requirement much like cowbird trapping.
In addition to restoration, as well as maintenance and procurement of new land, there needs to be increased protection of lands for wildlife values. Specifically, enforcement of current

LBVI AND SWFL REPORT 2017 SANTA ANA WATERSHED ASSOCIATION MANAGEMENT RECOMMENDATIONS
38
laws that restrict illegal activities in sensitive riparian areas. Local landscapes are scarred with off-highway vehicle (OHV) tracks and the activity is damaging riparian habitat in areas such as Mockingbird Canyon, San Timoteo Canyon, the San Jacinto River, and the Santa Ana River. Additionally, laws meant to prevent other human disturbances such as streambed alteration, illegal fishing, and homeless encampments must be enforced. A positive development in this area is the County of Riverside’s code enforcement program that targets illegal dumping. Enforcement of these laws can protect riparian habitat from degradation. There is also increasing awareness of the need to control feral pigs throughout the watershed. Some multi-organizational planning attempts to control this destructive species have been publicized; however, a management plan has yet to be implemented. SAWA and OCWD are planning a pilot study to track feral pig populations in the Prado Basin.
Although existing laws are meant to protect these resources, even on private land, we must strive to invest the public in these resources and identify effective ways to ensure that floodplains are protected for future generations of humans and wildlife. We will attempt this through a combination of public education, public involvement through volunteerism, and partnerships with enforcement agencies and landowners. Priorities for SAWA’s vireo recovery program in the near future will continue to be based primarily on cowbird trapping, which we believe provides the most immediate support for the recovering vireo population, the availability of ample invasive-free riparian habitat notwithstanding. SAWA will continue to provide accurate annual data on vireo status, distribution and reproductive productivity as funding allows.
FUNDING ACKNOWLEDGEMENTS
SAWA gratefully acknowledges the U.S. Fish and Wildlife Service and U.S. Army Corps of Engineers who provided the majority of funding for vireo monitoring and cowbird management. Funding for vireo monitoring and cowbird trapping in San Timoteo Canyon is from an endowment provided by the USACE, held by SAWA, and managed through the IERCD. SAWA also thanks the IERCD who funded vireo monitoring within a small mitigation area in the vicinity of the Goose Creek Golf Club in Norco, and The Rivers and Lands Conservancy who provided funding for vireo monitoring and cowbird trapping at the Meridian Conservation Area in 2017.
ACKNOWLEDGEMENTS
We earnestly thank our field and cowbird assistants: Henry Armijo, Logan Cherland, Brittney Dantuono, Mackenzie Hays, Corina Jimenez, Melanie Levato, Joanna Mai, and Justin Wilbur. We would also like to thank our hard-working restoration technicians: Martin Almanza, Jacob

LBVI AND SWFL REPORT 2017 SANTA ANA WATERSHED ASSOCIATION ACKNOWLEDGEMENTS
39
Faucher, Arsenio Hernandez, Jonathan Keyes, Paul Lugo, Britton Porterfield, Nathaniel Trujillo, Albert Walters, biomonitor Cristina Juran, field supervisor Jesse Ortiz, and Habitat Restoration Services manager James Law. Additionally, we wish to thank Bonnie Johnson, Mandy Parkes, Aaron Echols, and Jim Pike for their dedication to natural resources and support of SAWA’s biological management program.
We would also like to thank the following individuals and agencies for their continued assistance: Christine Medak and Karin Cleary-Rose from the U.S. Fish and Wildlife Service, Chris Jones and Haley Lovan from the U.S. Army Corps of Engineers, California Department of Fish and Wildlife environmental scientists: Jeff Brandt, Kim Freeburn-Marquez, and Joanna Gibson, The Orange County Water District, Alissa Ing and Ken Kietzer of California Department of Parks and Recreation, Jack Easton from the Rivers and Lands Conservancy, Karen Riesz and the MSHCP monitoring program, The Regional Conservation Authority, Dustin McLain, Bureau Chief of Parks and Natural Resources, Robert Williams, Natural Resources Manager of the Riverside County Regional Parks and Open-space District, the staff at the Hidden Valley Wildlife Preserve, Orange County Flood Control, Orange County Park Rangers: Adam Martinez and Joanette Willert, San Jacinto Wildlife Area manager Scott Sewell, Theresa Sims and Brandy Wood of San Bernardino County Flood Control, Mike Dooley and the staff of Green River Golf Club, Hidden Valley Golf Club, Lori Askew and Robin Shepard of the City of Norco, Bicky Ross of the Silverlakes Equestrian and Sports Complex, Brian and Dana Busch and the staff at the Canyon RV Park, Dayna Whitaker, Area Manager for Riverside County Regional Parks and Open-Space District, City of Chino Hills Public Works Department, Scott Hansen, Herman DeJong and family at the DeJong Dairy, Viramontes Dairy, the Inland Empire Utilities Agency, Dan Ebert, Euclid Dairy, Ross Fisher and the staff of Goose Creek Golf Club, the staff at Fisherman’s Retreat, Bob Fontaine and John Gericke of Prado Regional Park, Gage Canal, Donna Hart, KB Home, Bob King, Roberta Reed and the 3M Company, R & J Dairy, Komy Ghods and Carol Thompson of Riverside County Flood Control, Lee Withers and Brad McGrew of the City of Riverside Parks and Recreation, Scott Brothers Dairy, the staff of the Elsinore Valley Municipal Water District, Kraig Williamson of the Temescal Canyon Rockery, Jeff Pape of Temescal Water District, Shaun Bowen of Brookfield Residential, John Trotter and the City of Chino Hills, Vanderwoude Dairy, and the Western Municipal Water District.
Special thanks go out to the following residents of Mockingbird Canyon and San Timoteo Canyon for their assistance in cowbird trap placement: Peggy Headlee, Gordon English, Chris Ungerer, and the Harned Family. Finally, a special thanks to Senior GIS Analyst, Linda Koki from the Orange County Water District.

LBVI AND SWFL REPORT 2017 SANTA ANA WATERSHED ASSOCIATION WORKS CITED
40
WORKS CITED Aimar, M., Hoffman, S., & Zembal, R. (2016). Status and management of the Least Bell's Vireo in the
Santa Ana Canyon, Riverside and Orange Counties - 2016 Interim Report. Prepared for the U.S. Fish and Wildlife Service and the U.S. Army Corps of Engineers.
Albright, T., Pigeon, A., Ruttenhouse, C., Clayton, M., Flather, C., Culbert, P., . . . Radeloff, V. (2010). Effects of drought on avian community structure. Global Change Biology 16, 2158-2170.
Boland. (2016). The impact of an invasive ambrosia beetle on the riparian habitats of the Tijuana River Valley, California . PeerJ 4:e2141; DOI 10.7717/peerj.2141.
Bolger, D. T., Patten, M., & Bostock, D. (2005). Avian reproductive failure in response to an extreme climatic event. Oecologia 142, 398-406.
Cabral, T. (2017, Jun 3). Incident Information Fact Sheet. Retrieved Sep 18, 2017, from Riverside County Fire Department: http://www.rvcfire.org/_Layouts/Incident%20Information/IncidentInfoDetail.aspx?3373
Esquivel, P. (2015, Nov 25). Moreno Valley leaders OK initiatives in favor of 40-million-square-foot warehouse project. Los Angeles Times.
Greaves, J. M. (1990). Maintaining site integrity for breeding Least Bell's Vireos. Gen. Tech. Rep. PSW-110, 544.
Hoffman, S., Zemal, R., Aimar, M., Arechavaleta, G., Barbee, T., Beckman, A., . . . Reeser, T. (2013). Status and Management of the Least Bell's Vireo and Southwestern Willow Flycatcher int he Santa Ana River Watershed, Archived Data 2000-2009. Santa Ana Watershed Association - archived data.
Hoffman, S., Zembal, R., Aimar, M., Archer, M., Beckman, A., Coumoutso, J., . . . Reeser, T. (2015). Status and Management of the Least Bell's Vireo and Southwestern Willow Flycatcher in the Santa Ana River Watershed. Riverside: Santa Ana Watershed Association.
Kus, B. E., & Whitfield, M. J. (2005). Parasitism, Productivity, and Population Growth: Response of Least Bell's Vireos (Vireo belli pusillus) and Southwestern Willow Flycatchers (Empidonax trailii extimus) to Cowbird (Molothrus spp.) Control. Ornithological Monographs, 57, 16-27.
Kus, B., Hopp, S. L., Johnson, R. R., & Brown, B. T. (2010). Bell's Vireo (Vireo bellii). Retrieved from The Birds of North America (P. G. Rodewald, Ed.). Ithaca: Cornell Lab of Ornithology: https://birdsna.org/Species-Account/bna/species/belvir
O'Loghlen, A. L. (1995). Delayed access to local songs prolongs vocal development in dialect populations of brown-headed cowbirds. Condor, 97, 402-414.

LBVI AND SWFL REPORT 2017 SANTA ANA WATERSHED ASSOCIATION WORKS CITED
41
O'Loghlen, A. L., & Rothstein, S. I. (1995). Culturally correct song dialects are correlated with male age and female song preferences in wild populations of brown headed cowbirds. Behavioral Ecology and Sociobiology, 36(4), 251-259.
Patch CA. (2016, Oct 21). State Reaches Settlement with World Logistics Center's Developer. Retrieved Sep 28, 2017, from Banning Patch: https://patch.com/california/banning-beaumont/state-reaches-settlement-world-logistics-centers-developer
Pike, J., Hays, L., & Zembal, R. (2015). Least Bell's Vireo and Southwestern Willow Flycatchers in Prado Basin of the Santa Ana River Watershed, CA. Fountain Valley, CA: Orange County Water District.
Pike, J., Pellegrini, D., Reynolds, S., & Hays, L. R. (1999). The status and management of the Least Bell's Vireo and Southwestern Willow Flycatcher within the Prado Basin, California, 1986-1999.
Pike, J., Pelligrini, D., Hays, L. R., & Zembal, R. (2005). Least Bell's Vireo and Southwestern Willow Flycatchers in Prado Basin of the Santa Ana River Watershed, CA.
(2015). San Jacinto River Levee, Stage 4 and River Corridor Expansion Project. Riverside, CA: Associates, Albert A. Webb.
Sawyer, J. O., Keeler-Wolf, T., & Evens, J. M. (2009). A Manual of California Vegetation (2nd ed.). Sacramento, CA: California Native Plant Society.
Skagen, S., & Yackel Adams, A. (2012). Weather effects on avian breeding performance and implications of climate change. Ecological Applications by the Ecological Society of America 22(4), 1131-1145.
Smith, J. N., Cook, T. L., Rothstein, S. I., Robinson, S. K., & Sealy, S. G. (2000). Ecology and management of cowbirds and their hosts: Studies in the conservation of North american passerine birds. Austin, TX: University of Texas Press.
Tenant, P., Zembal, R., Hoffman, S., & Nash, B. (Revised 2008). Santa Ana Watershed Association and Orange County Water District cowbird trapping protocol.
The Villages of Lakeview, Specific Plan #342. (2017, July). Revised Environmental Impact Report, 2(471), 1232.
USGS. (2016). California Drought. Retrieved Aug 17, 2016, from USGS: California Water Science Center: http://ca.water.usgs.gov/data/drought/
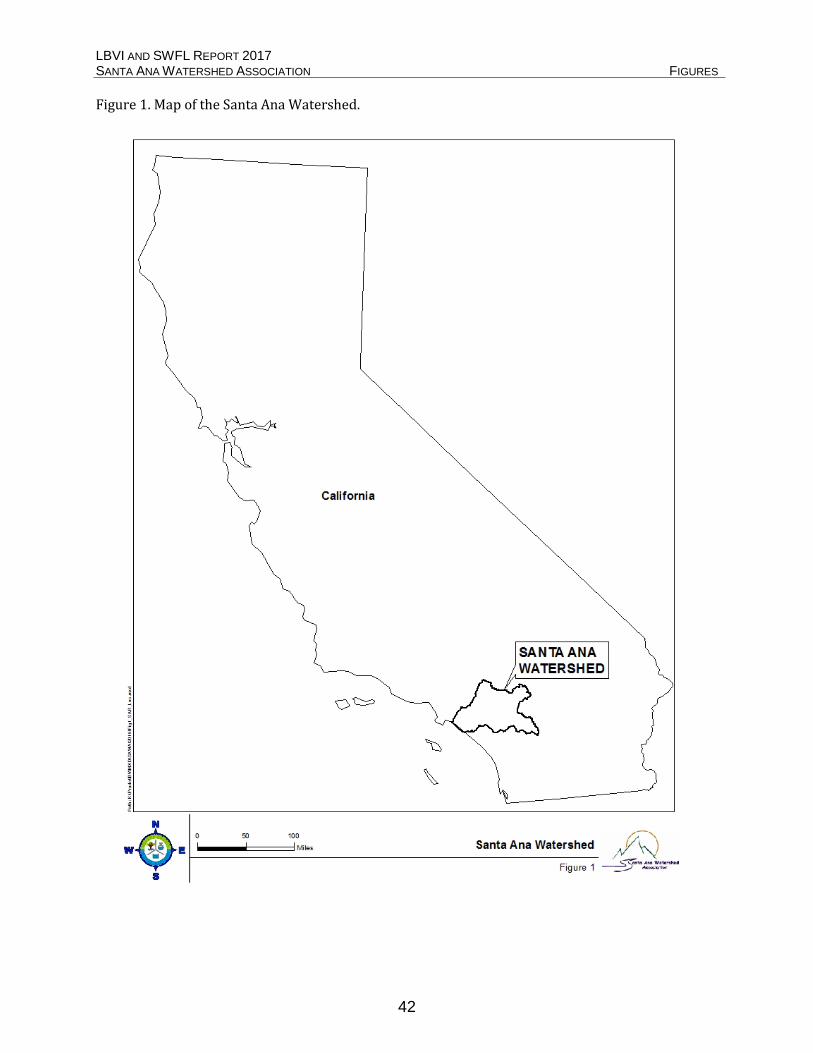
LBVI AND SWFL REPORT 2017 SANTA ANA WATERSHED ASSOCIATION FIGURES
42
Figure 1. Map of the Santa Ana Watershed.

LBVI AND SWFL REPORT 2017 SANTA ANA WATERSHED ASSOCIATION FIGURES
43
Figure 2. Least Bell’s Vireo survey sites in the Santa Ana Watershed, 2017.

LBVI AND SWFL REPORT 2017 SANTA ANA WATERSHED ASSOCIATION FIGURES
44
Figure 3. Brown-headed Cowbird trap locations in the Santa Ana Watershed, 2017.

LBVI AND SWFL REPORT 2017 SANTA ANA WATERSHED ASSOCIATION FIGURES
45
Figure 4. Norco Bluffs Vireo Survey Area.
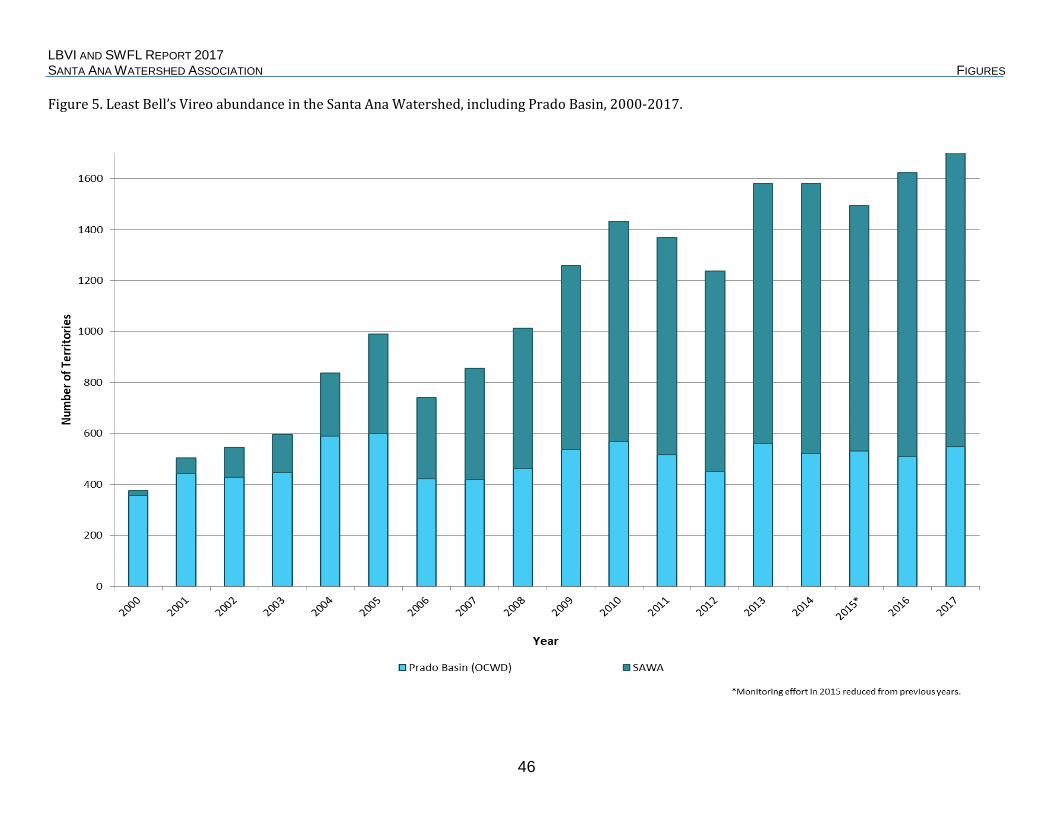
LBVI AND SWFL REPORT 2017 SANTA ANA WATERSHED ASSOCIATION FIGURES
46
Figure 5. Least Bell’s Vireo abundance in the Santa Ana Watershed, including Prado Basin, 2000-2017.
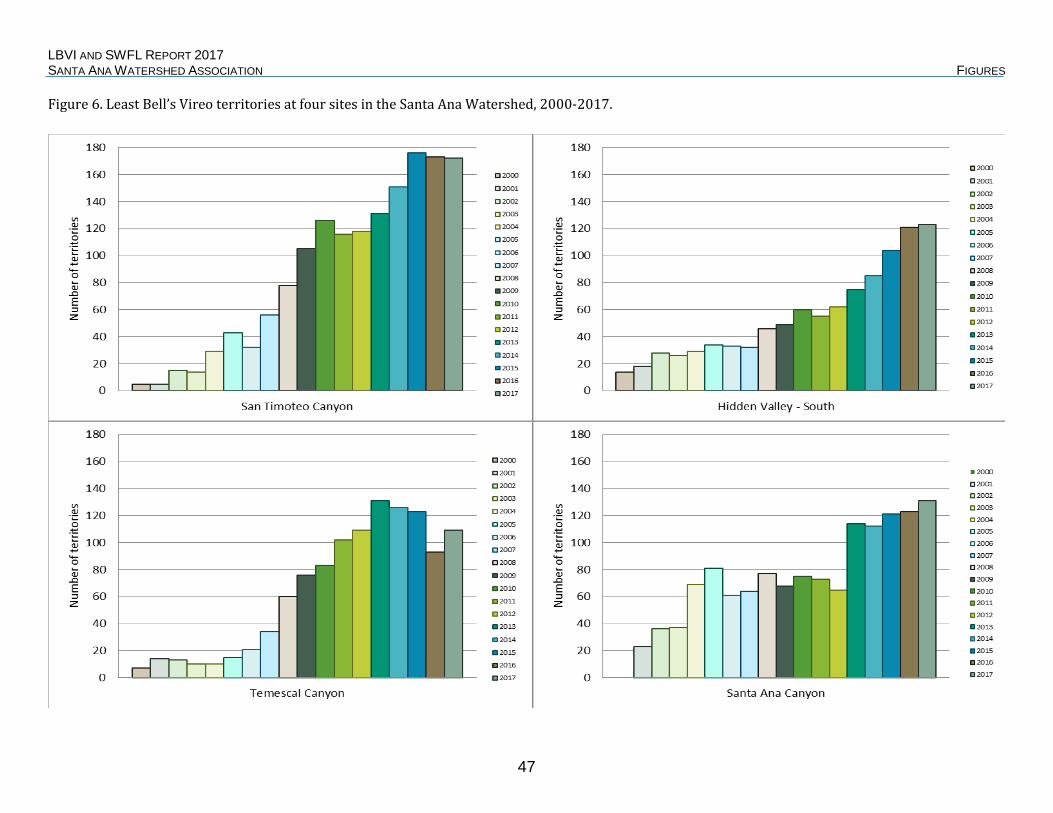
LBVI AND SWFL REPORT 2017 SANTA ANA WATERSHED ASSOCIATION FIGURES
47
Figure 6. Least Bell’s Vireo territories at four sites in the Santa Ana Watershed, 2000-2017.

LBVI AND SWFL REPORT 2017 SANTA ANA WATERSHED ASSOCIATION FIGURES
48
Figure 7. Vireo Territories vs. Parasitism Rates in the Santa Ana Watershed, 2001-2017.
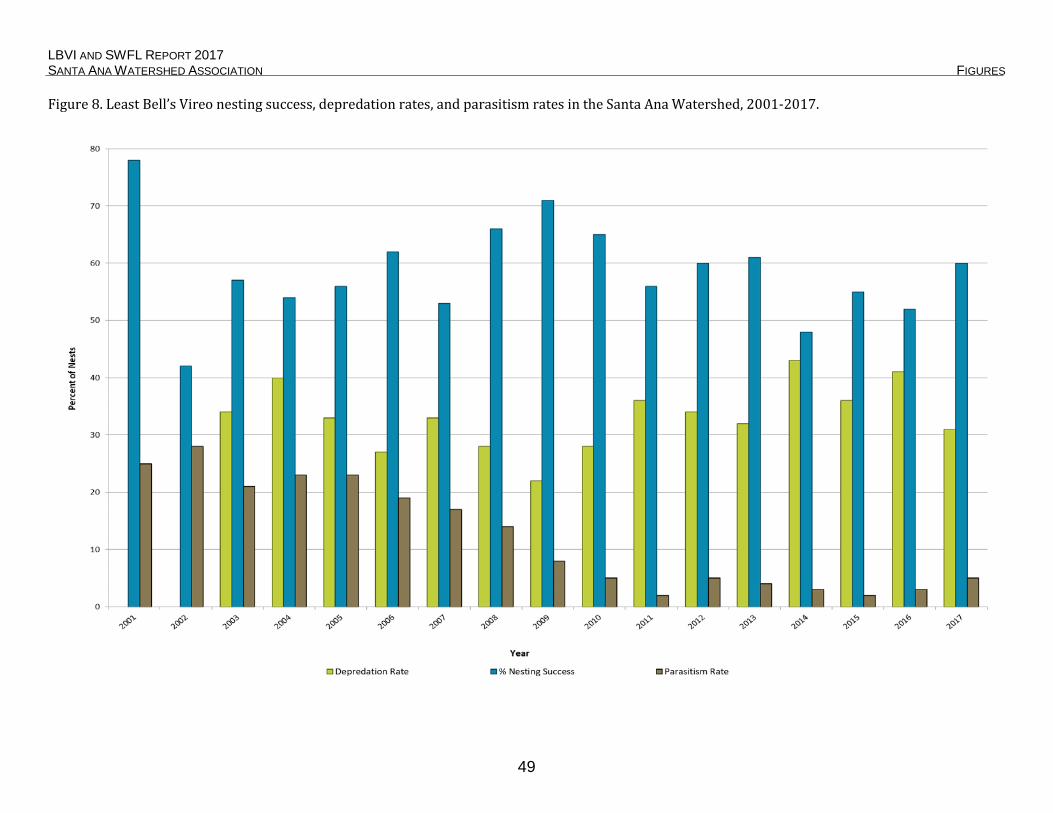
LBVI AND SWFL REPORT 2017 SANTA ANA WATERSHED ASSOCIATION FIGURES
49
Figure 8. Least Bell’s Vireo nesting success, depredation rates, and parasitism rates in the Santa Ana Watershed, 2001-2017.
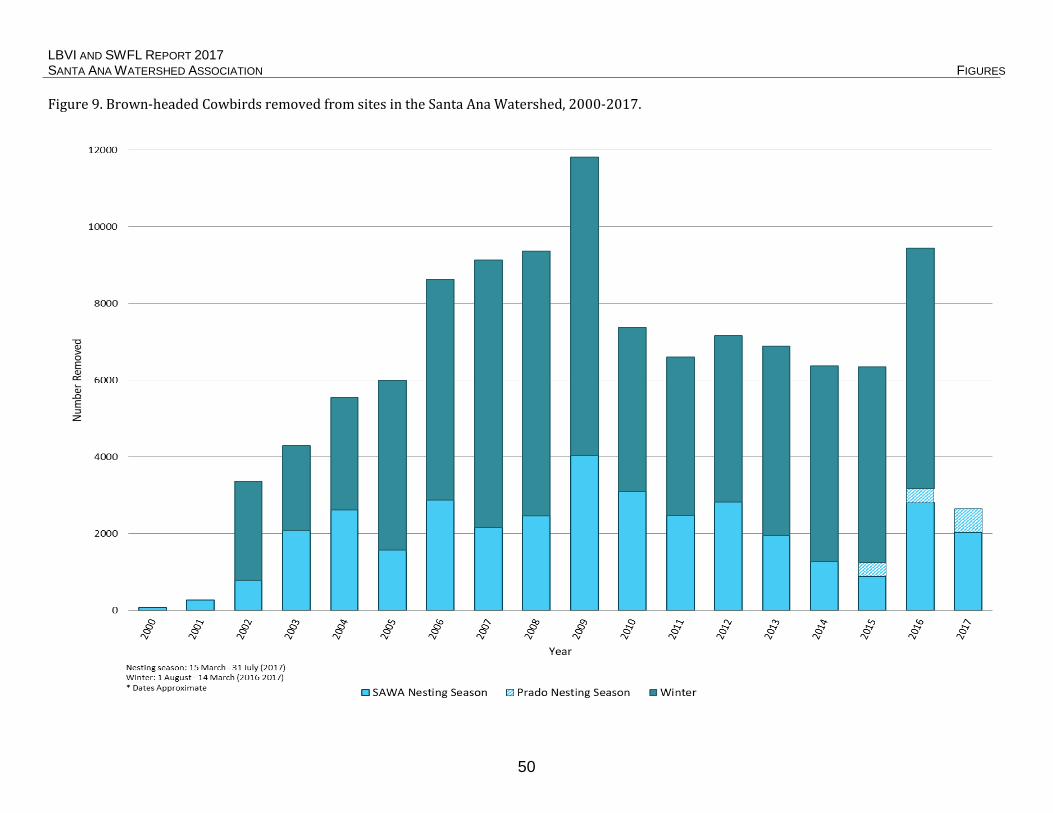
LBVI AND SWFL REPORT 2017 SANTA ANA WATERSHED ASSOCIATION FIGURES
50
Figure 9. Brown-headed Cowbirds removed from sites in the Santa Ana Watershed, 2000-2017.

LBVI AND SWFL REPORT 2017 SANTA ANA WATERSHED ASSOCIATION TABLES
51
Table 1. Least Bell’s Vireo abundance and distribution in the Santa Ana Watershed, 2013-2017. Numbers of territories, pairs, and fledglings detected.
Site Name 2013 2014 2015 2016 2017 Monitored Locations
San Jacinto 53 / 29 / 39 45 / 19 / 12 29 / 7 / 8 37 / 17 / 12 45 / 27 / 48
San Timoteo Canyon 131 / 80 / 179 151 / 135 / 206 176 / 141 / 287 173 / 124 / 222 172 / 109 / 272 Meridian Conservation Area (former March SKR Preserve) 14 / 12 / 16 21 / 16 / 23 7 / 3 / 3 14 / 5 / 6 16 / 9 / 23 Santa Ana River (SAR) - Upstream
Riverside Ave. to Van Buren Blvd. 77 / n/a / 7 66 / 19 / 15 109 / 37 / 33 109 / 43 / 62 155 / 95 / 169
Hidden Valley, north side of river 21 / 2 / 3 21 / 14 / 19 39 / 23 / 15 40 / 27 / 33 36 / 17 / 34
Hidden Valley, south side of river 75 / 42 / 66 85 / 32 / 28 104 / 27 / 22 121 / 66 / 97 123 / 67 / 87
Goose Creek, Norco to I-15 (includes Goose Creek mitigation funded by IERCD)1 108 / 52 / 109 110 / 32 / 36 71 / 36 / 63 63 / 31 / 45 73 / 34 / 54
Norco Bluffs (I-15 to River Rd., non-mitigation)1 n/a n/a 30 / 17 / 43 63 / 28 / 45 69 / 31 / 76
Temescal Canyon 131 / 50 / 48 126 / 24 / 17 123 / 21 / 22 93 / 9 / 5 109 / 59 / 48
Chino Hills 13 / 5 / 7 10 / 2 / 3 24 / 6 / 4 18 / 11 / 10 25 / 7 / 3
Santa Ana Canyon (SAC)
Upper Canyon 28 / 14 / 23 27 / 18 / 28 25 / 9 / 10 26 / 12 / 18 30 / 21 / 32
Green River Golf Club 22 / 19 / 19 26 / 19 / 29 31 / 23 / 35 33 / 26 / 27 42 / 33 / 76
Featherly Regional Park 64 / 45 / 55 59 / 39 / 35 65 / 38 / 37 64 / 39 / 23 59 / 36 / 57
Sampled Locations Santa Ana River & Tributaries:
Alessandro Arroyo/Prenda Arroyo 7 / 3 / 2 23 / 4 / 5 n/s 19 / 4 / 3 23 / 7 / 10
Arlington Falls 0 / 0 / 0 0 / 0 / 0 n/s n/s n/s
Box Springs n/s 3 / 2 / 1 n/s 4 / 3 / 4 7 / 1 / 0
Cajalco Creek 0 / 0 / 0 0 / 0 / 0 n/s See Temescal See Temescal
Cajon Wash 0 / 0 / 0 n/s n/s 0 / 0 / 0 n/s
Canyon Crest 0 / 0 / 0 1 / 1 / 0 n/s 1 / 0 / 0 0 / 0 / 0

LBVI AND SWFL REPORT 2017 SANTA ANA WATERSHED ASSOCIATION TABLES
52
Table 1 continued. Least Bell’s Vireo abundance and distribution in the Santa Ana Watershed, 2013-2017. Numbers of territories, pairs, and fledglings detected.
Site Name 2013 2014 2015 2016 2017
Carbon Canyon (Chino Hills Pkwy.) n/s n/s n/s 0 / 0 / 0 n/s
Carbon Canyon Regional Park 16 / 9 / 1 16 / 6 / 5 12 / 4 / 4 10 / 2 / 0 14 / 5 / 2
Castleview Park n/s n/s n/s n/s 0 / 0 / 0
Chino Hills (End of Eucalyptus) n/s n/s n/s n/s See Chino Hills
Chino Hills (Eucalyptus/Del Monte) 0 / 0 / 0 0 / 0 / 0 n/s n/s n/s
Chino Hills (Eucalyptus/Rancho Hills) 2 / 1 / 0 2 / 0 / 0 n/s See Chino Hills See Chino Hills
Chino Hills (Soquel Canyon/Pipeline) 3 / 2 / 0 4 / 2 / 3 n/s See Chino Hills See Chino Hills Chino Hills Community Park (Eucalyptus/Peyton) 7 / 0 / 0 4 / 0 / 0 n/s See Chino Hills See Chino Hills
Chino Hills State Park (CHSP) 36 / 15 / 6 21 / 6 / 4 n/s 15 / 4 / 4 20 / 4 / 4
City Creek (Highland) n/s 4 / 0 / 0 n/s 2 / 0 / 0 1 / 1 / 0
Clearwater Pkwy. @ Glen Helen 0 / 0 / 0 1 / 0 / 0 0 / 0 / 0 2 / 0 / 0 0 / 0 / 0
Corona Ave. at Gilmore 0 / 0 / 0 3 / 1 / 2 n/s 1 / 0 / 0 1 / 0 / 0
Fontana Power Plant 1 / 1 / 0 0 / 0 / 0 2 / 0 / 0 0 / 0 / 0 n/s
Fresno Canyon 1 / 1 / 0 2 / 0 / 0 2 / 0 / 0 2 / 1 / 0 2 / 0 / 0
Gavilan Hills 0 / 0 / 0 0 / 0 / 0 n/s n/s n/s
Goldenstar 0 / 0 / 0 2 / 1 / 0 0 / 0 / 0 1 / 0 / 0 2 / 1 / 2
Harrison Reservoir (aka McAllister Creek) 4 / 0 / 0 3 / 0 / 0 3 / 1 / 0 3 / 2 / 2 5 / 2 / 3
Hidden Valley Golf Club 6 / 3 / 1 8 / 1 / 0 5 / 2 / 2 7 / 2 / 0 9 / 1 / 0
La Sierra 4 / 2 / 3 5 / 1 / 1 n/s 3 / 0 / 0 5 / 2 / 1
Little Sand Basin n/s 0 / 0 / 0 n/s 0 / 0 / 0 n/s
Mead Valley (Cajalco/Aqueduct) 4 / 4 / 2 5 / 2 / 0 4 / 0 / 0 7 / 3 / 3 13 / 8 / 7
Mockingbird Canyon 31 / 24 / 40 23 / 7 / 7 37 / 23 / 19 25 / 7 / 11 29 / 15 / 15
Norco Hills Park Mitigation 0 / 0 / 0 0 / 0 / 0 n/s 0 / 0 / 0 0 / 0 / 0

LBVI AND SWFL REPORT 2017 SANTA ANA WATERSHED ASSOCIATION TABLES
53
Table 1 continued. Least Bell’s Vireo abundance and distribution in the Santa Ana Watershed, 2013-2017. Numbers of territories, pairs, and fledglings detected.
Site Name 2013 2014 2015 2016 2017
Plunge Creek n/s 3 / 1 / 0 n/s 1 / 1 / 2 2 / 0 / 0
Poorman Reservoir 2 / 0 / 0 6 / 3 / 2 n/s 8 / 2 / 1 9 / 4 / 5
Promenade 1 / 1 / 0 2 / 1 / 1 n/s n/s n/s
Pyrite Channel 0 / 0 / 0 0 / 0 / 0 n/s 1 / 0 / 0 0 / 0 / 0
Quail Run n/s 0 / 0 / 0 n/s 1 / 0 / 0 0 / 0 / 0
Riverwalk Park n/s 0 / 0 / 0 n/s n/s n/s
Ryan Bonaminio Park n/s n/s n/s n/s 0 / 0 / 0
Sun Canyon Park 1 / 0 / 0 n/s n/s 0 / 0 / 0 n/s
Sycamore Canyon 12 / 0 / 0 17 / 5 / 2 4 / 1 / 1 13 / 4 / 6 18 / 9 / 9
Talbert Park (Orange County) 3 / 1 / 0 5 / 1 / 0 1 / 0 / 0 7 / 1 / 0 8 / 0 / 0
Tequesquite Arroyo 0 / 0 / 0 0 / 0 / 0 n/s 0 / 0 / 0 0 / 0 / 0
Van Buren Blvd. (Bountiful) n/s 1 / 0 / 0 2 / 0 / 0 2 / 0 / 0 1 / 0 / 0
Van Buren Blvd. (Porter Rd.) n/s 0 / 0 / 0 n/s 0 / 0 / 0 0 / 0 / 0
Woodcrest 0 / 0 / 0 1 / 0 / 0 1 / 1 / 3 1 / 0 / 0 1 / 0 / 0
Wyle Labs (at El Paso Rd. only) 1 / 0 / 0 1 / 0 / 0 0 / 0 / 0 1 / 0 / 0 1 / 0 / 0
Yorba Linda (San Antonio Rd.) n/s 2 / 1 / 1 1 / 1 / 2 n/s 0 / 0 / 0
Yorba Linda (Starlight Dr.) 4 / 0 / 0 4 / 1 / 1 4 / 1 / 1 1 / 1 / 0 4 / 0 / 0
Yorba Linda Lakebed Park 1 / 0 / 0 1 / 0 / 0 0 / 0 / 0 1 / 0 / 0 0 / 0 / 0 San Jacinto River Sub-watershed:
Cottonwood Canyon 2 / 0 / 0 2 / 1 / 1 n/s 2 / 1 / 1 2 / 0 / 0
Kabian Park 3 / 3 / 0 7 / 4 / 3 n/s 9 / 4 / 3 8 / 3 / 3
Lake Perris 14 / 5 / 1 20 / 7 / 8 n/s n/s n/s
Menifee (Salt Creek) 8 / 2 / 3 10 / 4 / 4 6 / 1 / 1 9 / 3 / 3 9 / 4 / 3

LBVI AND SWFL REPORT 2017 SANTA ANA WATERSHED ASSOCIATION TABLES
54
Table 1 continued. Least Bell’s Vireo abundance and distribution in the Santa Ana Watershed, 2013-2017. Numbers of territories, pairs, and fledglings detected.
Site Name 2013 2014 2015 2016 2017 Santiago Creek Sub-watershed:
Irvine Trust Management Area 1 / 0 / 0 1 / 0 / 0 1 / 0 / 0 n/s 0 / 0 / 0
Limestone Canyon 3 / 1 / 2 4 / 4 / 4 n/s n/s 1 / 0 / 0
Peter's Canyon 16 / 2 / 2 15 / 11 / 7 18 / 4 / 6 25 / 11 / 6 27 / 8 / 9
Santiago Canyon (Irvine Park) 29 / 8 / 10 27 / 9 / 12 24 / 1 / 2 17 / 1 / 0 14 / 1 / 0
Santiago Creek (above Irvine Lake) 10 / 5 / 6 13 / 6 / 7 n/s 2 / 0 / 0 5 / 0 / 0
Santiago Creek (Cambridge Road) 0 / 0 / 0 0 / 0 / 0 0 / 0 / 0 0 / 0 / 0 1 / 0 / 0 Santiago Creek (Cannon Road, incl. Smith Basin) 2 / 2 / 0 2 / 0 / 0 2 / 1 / 0 4 / 0 / 0 4 / 1 / 0
Santiago Creek (Chapman Ave.) 0 / 0 / 0 0 / 0 / 0 0 / 0 / 0 0 / 0 / 0 0 / 0 / 0
Santiago Oaks Regional Park 0 / 0 / 0 0 / 0 / 0 n/s n/s 1 / 0 / 0
Silverado Canyon 0 / 0 / 0 0 / 0 / 0 n/s 0 / 0 / 0 n/s
Incidental Sightings
Burris Basin n/s n/s n/s 2 / 1 / 4 1 / 1 / 0
Chino Creek Wetlands Park 2 / 1 / 1 1 / 0 / 0 1 / 0 / 0 1 / 0 / 0 1 / 0 / 0 Colonies Crossroads Shopping Center Ponds 1 / 0 / 0 n/s n/s n/s n/s
Conrock Basin FHQ 0 / 0 / 0 0 / 0 / 0 0 / 0 / 0 1 / 0 / 0 0 / 0 / 0
Hwy. 71, OCWD Property 1 / 0 / 0 n/s n/s n/s n/s
Irvine Lake n/s n/s n/s 2 / 1 / 1 2 / 0 / 0
Rancho La Sierra West, Riverside 2 / 2 / 1 1 / 0 / 0 0 / 0 / 0 1 / 0 / 0 See Hidden Valley, south side of river
RLC Alessandro Arroyo - 1.52 ac n/s n/s n/s 1 / 0 / 0 n/s
Santiago Basin 1 / 0 / 0 1 / 0 / 0 1 / 0 / 0 1 / 0 / 0 3 / 0 / 0
UC Riverside n/s 0 / 0 / 0 n/s n/s n/s
SUBTOTAL 979 / 448 / 652 1,024 / 462 / 532 964 / 429 / 623 1,070 / 497 / 659 1,208 / 623 / 1,052
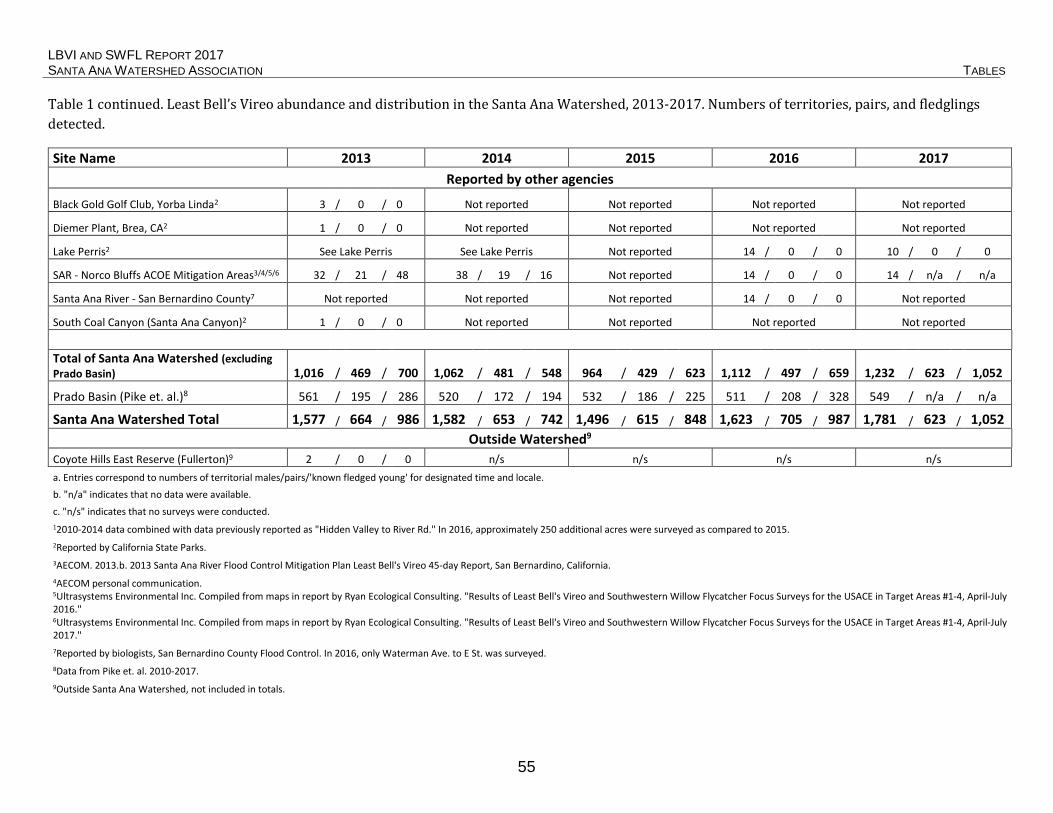
LBVI AND SWFL REPORT 2017 SANTA ANA WATERSHED ASSOCIATION TABLES
55
Table 1 continued. Least Bell’s Vireo abundance and distribution in the Santa Ana Watershed, 2013-2017. Numbers of territories, pairs, and fledglings detected.
Site Name 2013 2014 2015 2016 2017
Reported by other agencies
Black Gold Golf Club, Yorba Linda2 3 / 0 / 0 Not reported Not reported Not reported Not reported
Diemer Plant, Brea, CA2 1 / 0 / 0 Not reported Not reported Not reported Not reported
Lake Perris2 See Lake Perris See Lake Perris Not reported 14 / 0 / 0 10 / 0 / 0
SAR - Norco Bluffs ACOE Mitigation Areas3/4/5/6 32 / 21 / 48 38 / 19 / 16 Not reported 14 / 0 / 0 14 / n/a / n/a
Santa Ana River - San Bernardino County7 Not reported Not reported Not reported 14 / 0 / 0 Not reported
South Coal Canyon (Santa Ana Canyon)2 1 / 0 / 0 Not reported Not reported Not reported Not reported
Total of Santa Ana Watershed (excluding Prado Basin) 1,016 / 469 / 700 1,062 / 481 / 548 964 / 429 / 623 1,112 / 497 / 659 1,232 / 623 / 1,052
Prado Basin (Pike et. al.)8 561 / 195 / 286 520 / 172 / 194 532 / 186 / 225 511 / 208 / 328 549 / n/a / n/a
Santa Ana Watershed Total 1,577 / 664 / 986 1,582 / 653 / 742 1,496 / 615 / 848 1,623 / 705 / 987 1,781 / 623 / 1,052 Outside Watershed9
Coyote Hills East Reserve (Fullerton)9 2 / 0 / 0 n/s n/s n/s n/s a. Entries correspond to numbers of territorial males/pairs/'known fledged young' for designated time and locale.
b. "n/a" indicates that no data were available.
c. "n/s" indicates that no surveys were conducted. 12010-2014 data combined with data previously reported as "Hidden Valley to River Rd." In 2016, approximately 250 additional acres were surveyed as compared to 2015. 2Reported by California State Parks. 3AECOM. 2013.b. 2013 Santa Ana River Flood Control Mitigation Plan Least Bell's Vireo 45-day Report, San Bernardino, California. 4AECOM personal communication. 5Ultrasystems Environmental Inc. Compiled from maps in report by Ryan Ecological Consulting. "Results of Least Bell's Vireo and Southwestern Willow Flycatcher Focus Surveys for the USACE in Target Areas #1-4, April-July 2016." 6Ultrasystems Environmental Inc. Compiled from maps in report by Ryan Ecological Consulting. "Results of Least Bell's Vireo and Southwestern Willow Flycatcher Focus Surveys for the USACE in Target Areas #1-4, April-July 2017." 7Reported by biologists, San Bernardino County Flood Control. In 2016, only Waterman Ave. to E St. was surveyed. 8Data from Pike et. al. 2010-2017. 9Outside Santa Ana Watershed, not included in totals.
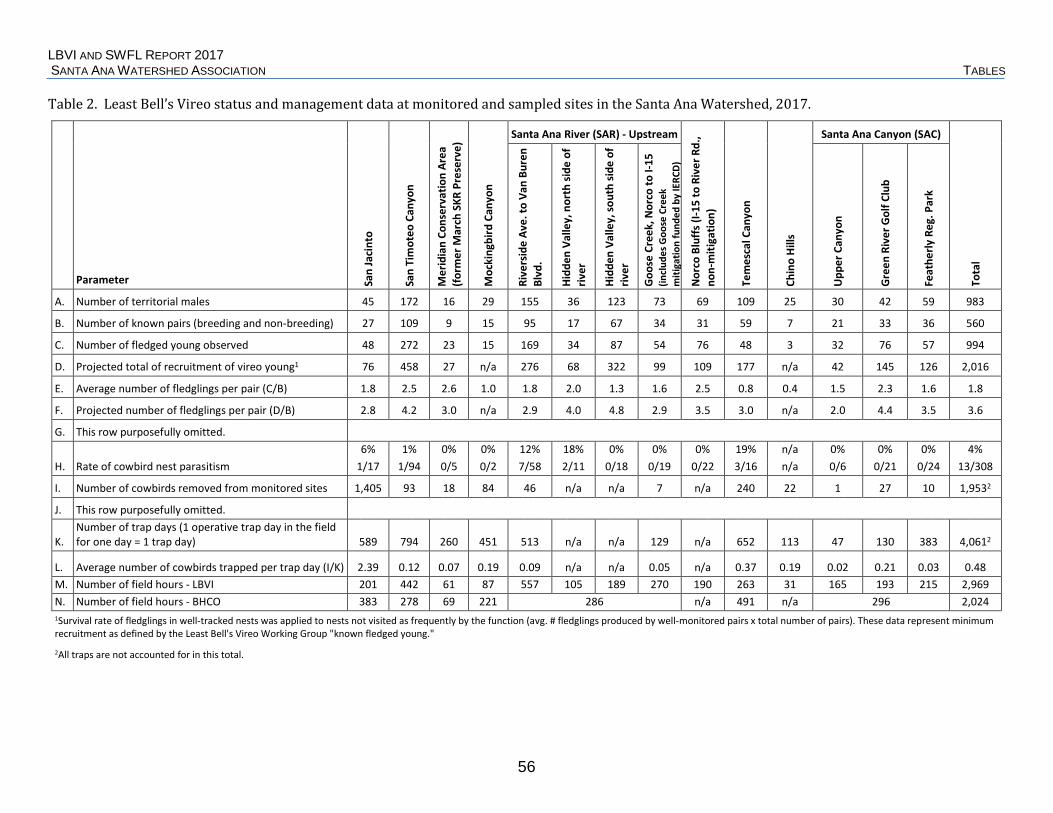
LBVI AND SWFL REPORT 2017 SANTA ANA WATERSHED ASSOCIATION TABLES
56
Table 2. Least Bell’s Vireo status and management data at monitored and sampled sites in the Santa Ana Watershed, 2017.
San
Jaci
nto
San
Tim
oteo
Can
yon
Mer
idia
n Co
nser
vatio
n Ar
ea
(form
er M
arch
SKR
Pre
serv
e)
Moc
king
bird
Can
yon
Santa Ana River (SAR) - Upstream
Nor
co B
luff
s (I-1
5 to
Riv
er R
d.,
non-
miti
gatio
n)
Tem
esca
l Can
yon
Chin
o H
ills
Santa Ana Canyon (SAC)
Tota
l
Parameter Rive
rsid
e Av
e. to
Van
Bur
en
Blvd
.
Hidd
en V
alle
y, n
orth
side
of
river
Hidd
en V
alle
y, so
uth
side
of
river
Goo
se C
reek
, Nor
co to
I-15
(in
clud
es G
oose
Cre
ek
miti
gatio
n fu
nded
by
IERC
D)
Upp
er C
anyo
n
Gre
en R
iver
Gol
f Clu
b
Feat
herly
Reg
. Par
k
A. Number of territorial males 45 172 16 29 155 36 123 73 69 109 25 30 42 59 983
B. Number of known pairs (breeding and non-breeding) 27 109 9 15 95 17 67 34 31 59 7 21 33 36 560
C. Number of fledged young observed 48 272 23 15 169 34 87 54 76 48 3 32 76 57 994
D. Projected total of recruitment of vireo young1 76 458 27 n/a 276 68 322 99 109 177 n/a 42 145 126 2,016
E. Average number of fledglings per pair (C/B) 1.8 2.5 2.6 1.0 1.8 2.0 1.3 1.6 2.5 0.8 0.4 1.5 2.3 1.6 1.8
F. Projected number of fledglings per pair (D/B) 2.8 4.2 3.0 n/a 2.9 4.0 4.8 2.9 3.5 3.0 n/a 2.0 4.4 3.5 3.6
G. This row purposefully omitted.
H. Rate of cowbird nest parasitism 6% 1% 0% 0% 12% 18% 0% 0% 0% 19% n/a 0% 0% 0% 4%
1/17 1/94 0/5 0/2 7/58 2/11 0/18 0/19 0/22 3/16 n/a 0/6 0/21 0/24 13/308
I. Number of cowbirds removed from monitored sites 1,405 93 18 84 46 n/a n/a 7 n/a 240 22 1 27 10 1,9532
J. This row purposefully omitted.
K. Number of trap days (1 operative trap day in the field for one day = 1 trap day) 589 794 260 451 513 n/a n/a 129 n/a 652 113 47 130 383 4,0612
L. Average number of cowbirds trapped per trap day (I/K) 2.39 0.12 0.07 0.19 0.09 n/a n/a 0.05 n/a 0.37 0.19 0.02 0.21 0.03 0.48 M. Number of field hours - LBVI 201 442 61 87 557 105 189 270 190 263 31 165 193 215 2,969 N. Number of field hours - BHCO 383 278 69 221 286 n/a 491 n/a 296 2,024 1Survival rate of fledglings in well-tracked nests was applied to nests not visited as frequently by the function (avg. # fledglings produced by well-monitored pairs x total number of pairs). These data represent minimum recruitment as defined by the Least Bell's Vireo Working Group "known fledged young."
2All traps are not accounted for in this total.

LBVI AND SWFL REPORT 2017 SANTA ANA WATERSHED ASSOCIATION TABLES
57
Table 3. Least Bell’s Vireo survey dates and breeding chronology, 2017.
San
Jaci
nto
San
Tim
oteo
Can
yon
Mer
idia
n Co
nser
vatio
n Ar
ea
(form
er M
arch
SKR
Pre
serv
e)
Moc
king
bird
Can
yon
Santa Ana River (SAR) - Upstream
Nor
co B
luff
s (I-1
5 to
Riv
er R
d.,
non-
miti
gatio
n)
Tem
esca
l Can
yon
Chin
o H
ills
Santa Ana Canyon (SAC)
Rive
rsid
e Av
e. to
Van
Bur
en
Blvd
.
Hidd
en V
alle
y, n
orth
side
of
river
Hidd
en V
alle
y, so
uth
side
of
river
Goo
se C
reek
, Nor
co to
I-15
(in
clud
es G
oose
Cre
ek
miti
gatio
n fu
nded
by
IERC
D)
Upp
er C
anyo
n
Gre
en R
iver
Gol
f Clu
b
Feat
herly
Reg
. Par
k
Survey Start Date1 24-Mar 16-Mar 19-Apr 28-Mar 15-Mar 22-Mar 14-Mar 16-Mar 13-Mar 21-Mar 5-Apr 22-Mar 21-Mar 13-Mar
Survey End Date 27-Jul 2-Aug 20-Jul 8-Aug 29-Aug 19-Jul 31-Jul 28-Jul 14-Aug 21-Jul 11-Jul 24-Jul 31-Jul 13-Sep
First Arrival Date 24-Mar 16-Mar 17-Mar 28-Mar 15-Mar 23-Mar 14-Mar 17-Mar 16-Mar 21-Mar 5-Apr 22-Mar 21-Mar 17-Mar
50% Arrived 4-Apr 31-Mar 19-Apr 17-Apr 6-Apr 6-Apr 3-Apr 4-Apr 29-Mar 7-Apr n/a n/a 7-Apr 31-Mar
50% Paired 12-Apr 14-Apr n/a n/a 25-Apr 10-Apr 24-Apr 17-Apr 21-Apr 28-Apr n/a n/a 17-Apr 25-Apr
First Nest Found 4-Apr 27-Mar 19-Apr 7-Apr 29-Mar 31-Mar 27-Mar 4-Apr 6-Apr 7-Apr n/a 24-Apr 4-Apr 5-Apr
Last Nest Found 26-Jun 29-Jun 22-Jun 12-Jun 12-Jul 28-Jun 28-Jun 13-Jun 19-Jun 29-Jun n/a 27-Jun 28-Jun 23-Jun
First Fledge Date 6-May 26-Apr 17-May n/a 7-May 3-May 7-May 30-Apr 28-Apr n/a n/a n/a 1-May 29-Apr
Last Fledge Date 18-Jul 20-Jul 20-Jul 12-Jul 13-Jul 30-Jun 7-Jul 24-Jun 17-Jul 19-Jul n/a 10-Jul 19-Jul 3-Jul
Date Last Detected2 27-Jul 2-Aug 20-Jul 8-Aug 7-Sep 7-Sep 31-Jul 28-Jul 2-Aug 21-Jul 11-Jul 24-Jul 31-Jul 26-Jul 1 First date of full survey specifically for Least Bell's Vireo 2 May vary from last survey date as an incidental sighting as opposed to a targeted survey.

LBVI AND SWFL REPORT 2017 SANTA ANA WATERSHED ASSOCIATION TABLES
58
Table 4. Least Bell’s Vireo nest placement preference at monitored and sampled sites in the Santa Ana Watershed, 2017.
San
Jaci
nto
San
Tim
oteo
Can
yon
Mer
idia
n Co
nser
vatio
n Ar
ea
(form
er M
arch
SKR
Pre
serv
e)
Moc
king
bird
Can
yon
Santa Ana River (SAR) - Upstream
Nor
co B
luff
s (I-1
5 to
Riv
er
Rd.,
non-
miti
gatio
n)
Tem
esca
l Can
yon
Chin
o H
ills
Santa Ana Canyon (SAC)
Host Plant Species (listed in taxonomic order) Ri
vers
ide
Ave.
to V
an B
uren
Bl
vd.
Hidd
en V
alle
y, n
orth
side
of
river
Hidd
en V
alle
y, so
uth
side
of
river
Goo
se C
reek
, Nor
co to
I-15
(in
clud
es G
oose
Cre
ek
miti
gatio
n fu
nded
by
IERC
D)
Upp
er C
anyo
n
Gre
en R
iver
Gol
f Clu
b
Feat
herly
Reg
. Par
k
Tota
l
Perc
enta
ge o
f Tot
al
Western Sycamore (Platanus racemosa) 3 3 1% Desert Wild Grape (Vitis girdiana) 13 4 1 2 1 21 7% Fremont Cottonwood (Populus fremontii) 3 4 3 1 1 2 14 4% Narrowleaf Willow (Salix exigua) 5 6 5 1 1 1 1 20 6% Goodding's Black Willow (Salix gooddingii) 3 3 7 2 5 4 1 2 1 28 9% Red Willow (Salix laevigata) 1 14 2 5 1 5 2 30 10% Arroyo Willow (Salix lasiolepis) 33 1 9 2 4 6 10 5 1 2 73 23% Dead Willow sp. (Salix sp.) 1 1 <1% Castorbeanie (Ricinus communis) 1 1 <1% Toyon (Heteromeles arbutifolia) 1 1 <1% California Blackberry (Rubus ursinus) 1 1 2 1% California Wild Rose (Rosa californica) 1 1 <1% Southern California Black Walnutr (Juglans californica) 1 3 1 5 2% White Alder (Alnus rhombifolia) 1 1 <1% Laurel Sumac (Malosma laurina) 2 4 6 2% Poison Oak (Toxicodendron diversilobum) 2 2 1%

LBVI AND SWFL REPORT 2017 SANTA ANA WATERSHED ASSOCIATION TABLES
59
Table 4 continued. Least Bell’s Vireo nest placement preference at monitored and sampled sites in the Santa Ana Watershed, 2017.
San
Jaci
nto
San
Tim
oteo
Can
yon
Mer
idia
n Co
nser
vatio
n Ar
ea
(form
er M
arch
SKR
Pre
serv
e)
Moc
king
bird
Can
yon
Santa Ana River (SAR) - Upstream
Nor
co B
luff
s (I-1
5 to
Riv
er R
d.,
non-
miti
gatio
n)
Tem
esca
l Can
yon
Chin
o H
ills
Santa Ana Canyon (SAC)
Tota
l
Perc
enta
ge o
f Tot
al
Host Plant Species (listed in taxonomic order) Ri
vers
ide
Ave.
to V
an B
uren
Bl
vd.
Hidd
en V
alle
y, n
orth
side
of
river
Hidd
en V
alle
y, so
uth
side
of
river
Goo
se C
reek
, Nor
co to
I-15
(in
clud
es G
oose
Cre
ek m
itiga
tion
fund
ed b
y IE
RCD)
Upp
er C
anyo
n
Gre
en R
iver
Gol
f Clu
b
Feat
herly
Reg
. Par
k
Peruvian Pepper Treeie (Schinus molle)
3 3 1%
Tamariskie (Tamarix ramosissima) 1 1 <1% Coyote Brush (Baccharis pilularis) 2 2 1% Mulefat (Baccharis salicifolia) 1 14 1 16 4 2 7 6 5 2 7 10 75 24% Dead Mulefat (Baccharis salicifolia) 1 1 <1% Arrowweed (Pluchea sericea) 1 1 <1% Blue Elderberry (Sambucus nigra ssp. caerulea) 5 2 1 1 1 1 2 13 4% Dead Blue Elderberry (Sambucus nigra ssp. caerulea) 1 1 <1% Desert Wild Grape (V. girdiana) and Mulefat (B. salicifolia) 1 1 <1% Red Willow (S. laevigata) and Wild Cucumber (Marah macrocarpa) 1 1 <1%
Unknown/No Data 3 1 4 1%
Total 16 94 5 0 58 11 18 19 25 16 0 4 22 24 312 100% i = invasive e = non-native r = endangered, threatened, or sensitive

LBVI AND SWFL REPORT 2017 SANTA ANA WATERSHED ASSOCIATION TABLES
60
Table 5. Least Bell’s Vireo reproductive success and breeding biology data at monitored and sampled sites in the Santa Ana Watershed, 2017.
Parameter San
Jaci
nto
San
Tim
oteo
Can
yon
Mer
idia
n Co
nser
vatio
n Ar
ea
(form
er M
arch
SKR
Pre
serv
e)
Moc
king
bird
Can
yon
Santa Ana River (SAR) - Upstream
Nor
co B
luff
s (I-1
5 to
Riv
er R
d.,
non-
miti
gatio
n)
Santa Ana Canyon (SAC)
Tota
ls
Rive
rsid
e Av
e. to
Van
Bur
en
Blvd
.
Hidd
en V
alle
y, n
orth
side
of
river
Hidd
en V
alle
y, so
uth
side
of
river
Goo
se C
reek
, Nor
co to
I-15
(in
clud
es G
oose
Cre
ek
miti
gatio
n fu
nded
by
IERC
D)
Tem
esca
l Can
yon
Chin
o H
ills
Upp
er C
anyo
n
Gre
en R
iver
Gol
f Clu
b
Feat
herly
Reg
. Par
k
A. Number of known pairs 27 109 9 15 95 17 67 34 31 59 7 21 33 36 560
B. Number of known breeding (nesting) pairs 25 99 8 13 87 16 54 32 30 39 3 18 30 32 486
C. Number of breeding pairs that were well-monitored throughout the breeding season 8 48 3 0 27 6 4 7 12 1 0 1 7 11 135
D. Number of 'known fledged young' OBSERVED 48 272 23 15 169 34 87 54 76 48 3 32 76 57 994
E.
Number of known fledged young produced by pairs monitored throughout the breeding season 22 202 9 n/a 78 24 19 20 42 3 n/a 2 31 38 490
F.
Average number of fledglings produced per breeding pair (minimum; D/B = 'productivity or breeding success') 1.9 2.7 2.9 1.2 1.9 2.1 1.6 1.7 2.5 1.2 1.0 1.8 2.5 1.8 2.0
G.
Average number of fledglings produced by well- monitored pairs (E/C = reproductive success) 2.8 4.2 3.0 n/a 2.9 4.0 4.8 2.9 3.5 3.0 n/a 2.0 4.4 3.5 3.6
H. Number of nests that were discovered 17 94 5 2 58 11 18 19 25 16 0 6 21 24 316
I. Number of nests that were regularly monitored or 'tracked' 11 91 5 2 46 10 16 19 22 13 n/a 5 17 22 279
J. Number of 'tracked' nests that were successful (% = J/I x 100)
64% 63% 100% 50% 59% 70% 44% 68% 77% 38% n/a 40% 76% 50% 60% 7/11 57/91 5/5 ½ 27/46 7/10 7/16 13/19 17/22 5/13 2/5 13/17 11/22 167/279
K. This row purposefully omitted
L. Number of 'tracked' nests that were parasitized by cowbirds (% = L/I x 100)
9% 1% 0% 0% 13% 20% 0% 0% 0% 23% n/a 0% 0% 0% 5% 1/11 1/91 0/5 0/2 6/46 2/10 0/16 0/19 0/22 3/13 0/5 0/17 0/22 13/279
M. A. Number of 'tracked' nests that failed as a result of reproductive failure
9% 2% 0% 0% 7% 0% 0% 0% 5% 15% n/a 0% 0% 9% 4% 1/11 2/91 0/5 0/2 3/46 0/10 0/16 0/19 1/22 2/13 0/5 0/17 2/22 11/279

LBVI AND SWFL REPORT 2017 SANTA ANA WATERSHED ASSOCIATION TABLES
61
Table 5 continued. Least Bell’s Vireo reproductive success and breeding biology data at monitored and sampled sites in the Santa Ana Watershed, 2017.
Parameter San
Jaci
nto
San
Tim
oteo
Can
yon
Mer
idia
n Co
nser
vatio
n Ar
ea
(form
er M
arch
SKR
Pre
serv
e)
Moc
king
bird
Can
yon
Santa Ana River (SAR) - Upstream
Nor
co B
luff
s (I-1
5 to
Riv
er R
d.,
non-
miti
gatio
n)
Tem
esca
l Can
yon
Chin
o H
ills
Santa Ana Canyon (SAC)
Tota
ls
Rive
rsid
e Av
e. to
Van
Bur
en
Blvd
.
Hidd
en V
alle
y, n
orth
side
of
river
Hidd
en V
alle
y, so
uth
side
of
river
Goo
se C
reek
, Nor
co to
I-15
(in
clud
es G
oose
Cre
ek
miti
gatio
n fu
nded
by
IERC
D)
Upp
er C
anyo
n
Gre
en R
iver
Gol
f Clu
b
Feat
herly
Reg
. Par
k
M.
B. Number of 'tracked' nests that failed as a result of parasitism
9% 0% 0% 0% 9% 10% 0% 0% 0% 0% n/a 0% 0% 0% 2% 1/11 0/91 0/5 0/2 4/46 1/10 0/16 0/19 0/22 0/13 0/5 0/17 0/22 6/279
C. Number of 'tracked' nests that failed as a result of predation
18% 35% 0% 50% 26% 20% 44% 32% 18% 31% n/a 60% 24% 41% 31% 2/11 32/91 0/5 ½ 12/46 2/10 7/16 6/19 4/22 4/13 3/5 4/17 9/22 86/279
D. Number of 'tracked' nests that failed for unknown reasons
0% 0% 0% 0% 0% 0% 13% 0% 0% 15% n/a 0% 0% 0% 1% 0/11 0/91 0/5 0/2 0/46 0/10 2/16 0/19 0/22 2/13 0/5 0/17 0/22 4/279
N.
Average clutch size 3.8 3.8 3.8 3.5 3.7 4 3.6 3.5 3.6 3.3 n/a 3.7 3.5 3.8 3.7
Number of eggs/Number of clutches 38/10 336/89 15/4 7/2 132/36 32/8 58/16 63/18 80/22 39/12 n/a 22/6 56/16 79/21 942/256
O. Number of cowbird eggs found in or near vireo nests 1 1 0 0 6 2 0 0 0 3 0 0 0 0 13
P. Number of cowbird nestlings removed from 'tracked' nests 0 0 0 0 0 0 0 0 0 0 0 0 0 0 0
Q. Number of cowbird young fledged by vireo 0 0 0 0 1 0 0 0 0 1 0 0 0 0 2
R. Number of 'manipulated' parasitized nests 0 1 n/a n/a 6 2 n/a n/a n/a 2 n/a n/a n/a n/a 11
S. Number of 'successful, manipulated' nests (% = S/R x 100)
n/a 0% n/a n/a 0% 50% n/a n/a n/a 0% n/a n/a n/a n/a 9% 0/1 0/6 1/2 0/2 1/11
T. Number of vireo fledged from 'manipulated' parasitized nests n/a 0 n/a n/a 0 3 n/a n/a n/a 0 n/a n/a n/a n/a 3
U. Number of repaired nests 0 1 0 0 0 0 0 1 0 0 0 0 0 1 3
V. % of successful repaired nests n/a 0% n/a
n/a n/a n/a n/a 100% n/a n/a n/a n/a n/a 0% 33%
0/1 1/1 0/1 1/3
W. Number of vireo fledged from repaired nests n/a 0 n/a n/a n/a n/a n/a 4 n/a n/a n/a n/a n/a 0 4

LBVI AND SWFL REPORT 2017 SANTA ANA WATERSHED ASSOCIATION TABLES
62
Table 6. Brown-headed Cowbird trapping results, March-July 2017 (grouped by funding source).
Site Name Trap/Location 2017 Dates of
Operation
Number of Trap
Days
Cowbirds Removed Daily Removed
Averages
Total Male Female Juveniles Adults All
USFWS/USACE/SARM Project
San Jacinto Wildlife Area SJWA A1 4/10-7/17 95 31 21 4 6 0.26 0.33
SJWA E1 4/12-7/17 95 53 20 24 9 0.46 0.56
Subtotal 190 84 41 28 15 0.36 0.44
Santa Ana River (upstream) Fairmount Park 3/21-7/24 123 12 11 1 0 0.10 0.10
Crestmore 3/13-7/21 128 0 -3 0 3 -0.02 0.00
Sunnyslope 3/13-7/24 131 17 9 7 1 0.12 0.13
Riverdale 3/13-7/24 131 17 10 6 1 0.12 0.13
Goose Creek 2 3/13-7/22 129 7 3 3 1 0.05 0.05
Subtotal 642 53 30 17 6 0.07 0.08
Mockingbird Canyon Reservoir 3/15-7/22 130 61 24 31 6 0.42 0.47
Estates 3/30-7/20 113 9 3 5 1 0.07 0.08
Ungerer 3/15-7/20 128 11 4 5 2 0.07 0.09
Markham 3/30-7/20 80 3 1 0 2 0.01 0.04
Subtotal 451 84 32 41 11 0.16 0.19
Prado/Chino Hills McCoy 3/23-7/24 113 22 6 6 10 0.11 0.19
IEUA 4/4-7/26 70 104 8 8 88 0.23 1.49
Regional Park 3/15-7/25 121 5 3 2 0 0.04 0.04
Olive Grove 3/20-7/24 117 4 0 4 0 0.03 0.03
Viramontes 3/16-7/24 100 -1 0 -1 0 -0.01 -0.01
Trailer 3/16-7/25 120 1 1 0 0 0.01 0.01
Subtotal 641 135 18 19 98 0.06 0.21
Temescal New Sump 3/13-7/26 130 2 1 1 0 0.02 0.02
Rockery 3/13-7/26 130 14 10 4 0 0.11 0.11
Baker 3/14-7/27 130 8 2 5 1 0.05 0.06

LBVI AND SWFL REPORT 2017 SANTA ANA WATERSHED ASSOCIATION TABLES
63
Table 6 continued. Brown-headed Cowbird trapping results, March-July 2017 (grouped by funding source).
Site Name Trap/Location 2017 Dates of
Operation
Number of Trap
Days
Cowbirds Removed Daily Removed Averages
Total Male Female Juveniles Adults All
Temescal (continued) Salt Creek 3/15-7/27 129 11 6 5 0 0.09 0.09
Subtotal 519 35 19 15 1 0.07 0.07
San Jacinto, Prado and Lake Elsinore Dairies Vanderwoude 2 3/13-7/27 133 408 274 106 28 2.86 3.07 Tuls 1 3/13-7/27 133 335 164 147 24 2.34 2.52
Scott Bros 3/13-7/27 133 578 406 144 28 4.14 4.35
Euclid 1 3/15-7/27 122 403 324 58 21 3.13 3.30
Euclid 2 3/15-7/28 119 69 41 14 14 0.46 0.58
Dejongs 3/13-7/28 133 205 122 76 7 1.49 1.54
Subtotal 773 1,998 1,331 545 122 2.43 2.58
Santa Ana Canyon Yorba Park 3/22-7/25 126 5 2 3 0 0.04 0.04
Savi Ranch 3/20-7/24 127 1 0 1 0 0.01 0.01
RV Park E 3/20-7/27 130 4 4 0 0 0.03 0.03
GR Golf W 3/20-7/27 130 27 12 13 2 0.19 0.21
GR Eq 3/20-5/5 47 1 0 1 0 0.02 0.02
Subtotal 560 38 18 18 2 0.06 0.07
Anaheim Santiago 3/23-7/26 126 19 12 5 2 0.13 0.15
Burris Basin 3/23-7/26 125 18 14 4 0 0.14 0.14
Conrock 3/22-7/28 128 69 40 21 8 0.48 0.54
Subtotal 379 106 66 30 10 0.25 0.28
TOTAL (USFWS/USACE/SARM) 4,155 2,533 1,555 713 265 0.55 0.61
IERCD
San Timoteo Bees 3/13-7/26 133 4 2 2 0 0.03 0.03
English 3/13-7/26 133 1 1 0 0 0.01 0.01
Headlee 3/13-7/26 133 31 22 8 1 0.23 0.23
Harned 3/13-7/25 132 17 14 3 0 0.13 0.13

LBVI AND SWFL REPORT 2017 SANTA ANA WATERSHED ASSOCIATION TABLES
64
Table 6 continued. Brown-headed Cowbird trapping results, March-July 2017 (grouped by funding source).
Site Name Trap/Location 2017 Dates of
Operation Number of Trap Days
Cowbirds Removed Daily Removed Averages
Total Male Female Juveniles Adults All
San Timoteo (continued) Fishermans 3/14-7/26 132 35 23 12 0 0.27 0.27
YL1 3/14-7/25 131 5 4 1 0 0.04 0.04
Subtotal 794 93 66 26 1 0.12 0.12
Rivers and Lands Conservancy (RLC)
Meridian C.A. (former March SKR Preserve)
Meridian 1 3/15-7/22 130 17 10 4 3 0.11 0.13
Meridian 2 3/15-7/22 130 1 2 -1 0 0.01 0.01
Subtotal 260 18 12 3 3 0.06 0.07
GRAND TOTAL 5,209 2,644 1,633 742 269 0.46 0.51
*TOTAL BHCO FIELD HOURS 2,745 *hours also include installation and removal of traps from field

LBVI AND SWFL REPORT 2017 SANTA ANA WATERSHED ASSOCIATION TABLES
65
Table 7. Non-target avian captures in Brown-headed Cowbird traps, March-July 2017.
2017 Native Non-target Species*
USFWS/USACE/SARM Project IERCD RLC
2017 Total Sa
n Ja
cint
o W
ildlif
e Ar
ea
Sant
a An
a Ri
ver
(ups
trea
m)
Moc
king
bird
Ca
nyon
Prad
o
Tem
esca
l
Prad
o, S
an
Jaci
nto,
and
Lak
e El
sino
re D
airie
s
Sant
a An
a Ca
nyon
Anah
eim
San
Tim
oteo
Mer
idia
n C.
A.
Common Name Scientific Name caug
ht
died
caug
ht
died
caug
ht
died
caug
ht
died
caug
ht
died
caug
ht
died
caug
ht
died
caug
ht
died
caug
ht
died
caug
ht
died
caug
ht
died
California Towhee Melozone crissalis 12 0 10 3 74 2 11 1 12 0 44 2 153 5 298 6 140 1 754 20
Red-winged Blackbird Agelaius phoeniceus 60 0 2 0 60 0 11 0 416 0 43 0 592 0
House Finch Haemorhous mexicanus 5 0 24 1 203 3 41 1 5 0 14 0 21 0 69 1 9 0 5 0 396 6
Northern Mockingbird Mimus polyglottos 30 2 1 0 3 0 1 0 11 5 11 2 1 0 58 9
Hooded Oriole Icterus cucullatus 15 2 2 0 1 0 3 1 4 0 8 2 9 2 3 0 45 7
House Wren Troglodytes aedon 3 0 25 9 1 1 8 4 1 1 38 15 Yellow-headed Blackbird
Xanthocephalus xanthocephalus 33 0 33 0
Song Sparrow Melospiza melodia 3 0 17 1 12 0 1 0 33 1
Brewer’s Blackbird Euphagus cyanocephalus 25 0 25 0 White-crowned Sparrow Zonotrichia leucophrys 23 1 1 0 24 1
Bullock's Oriole Icterus bullockii 6 3 1 0 3 0 4 0 5 0 3 1 22 4
Loggerhead Shrike Lanius ludovicianus 21 0 21 0
Bewick's Wren Thryomanes bewickii 1 1 11 3 2 0 2 1 16 5
Lark Sparrow Chondestes grammacus 1 0 1 0 3 0 7 0 12 0
Tri-colored Blackbird Agelaius tricolor 1 0 9 0 1 0 11 0
Say's Phoebe Sayornis saya 1 1 2 0 3 1
Black-headed Grosbeak Pheucticus melanocephalus 1 0 2 0 3 0
Cooper's Hawk Accipiter cooperii 1 0 1 0 2 0
Western Screech Owl Megascops kennicottii 1 0 1 0
Black Phoebe Sayornis nigricans 1 1 1 1
Bushtit Psaltriparus minimus 1 0 1 0

LBVI AND SWFL REPORT 2017 SANTA ANA WATERSHED ASSOCIATION TABLES
66
Table 7 continued. Non-target avian captures in Brown-headed Cowbird traps, March-July 2017.
2017 Native Non-target Species*
USFWS/USACE/SARM Project IERCD RLC
2017 Total Sa
n Ja
cint
o W
ildlif
e Ar
ea
Sant
a An
a Ri
ver
(ups
trea
m)
Moc
king
bird
Ca
nyon
Prad
o
Tem
esca
l
Prad
o, S
an
Jaci
nto,
and
Lak
e El
sino
re D
airie
s
Sant
a An
a Ca
nyon
Anah
eim
San
Tim
oteo
Mer
idia
n C.
A.
Common Name Scientific Name caug
ht
died
caug
ht
died
caug
ht
died
caug
ht
died
caug
ht
died
caug
ht
died
caug
ht
died
caug
ht
died
caug
ht
died
caug
ht
died
caug
ht
died
California Thrasher Toxostoma redivivum 1 0 1 0 Orange-crowned Warbler Oreothlypis celata 1 0 1 0
Blue Grosbeak Passerina caerulea 1 0 1 0
TOTAL 150 7 46 4 286 5 126 15 36 8 146 0 107 11 257 10 740 8 200 2 2,094 70
#/trap day 0.4 0.1 0.7 0.2 0.1 0.4 0.1 0.6 0.9 0.8 0.4
Mortality % 4.7% 8.7% 1.7% 11.9% 22.2% 0.0% 10.3% 3.9% 1.1% 1.0% 3.3% 2017 Non-native Species** Common Name Scientific Name rel1 rem2 rel1 rem2 rel1 rem2 rel1 rem2 rel1 rem2 rel1 rem2 rel1 rem2 rel1 rem2 rel1 rem2 rel1 rem2 rel1 rem2
European Starling Sturnus vulgaris 3 44 1 7 0 15 0 107 46 1147 24 48 12 45 1 0 87 1,413
House Sparrow Passer domesticus 0 6 7 69 33 29 0 1 31 140 3 2 8 196 13 4 95 447
Scaly-breasted Munia Lonchura punctulata 1 0 1 0
Orange Bishop Euplectes franciscanus 1 0 1 0
Zebra Finch Taeniopygia guttata 1 0 1 0
Budgerigar*** Melopsittacus undulatus 0 1 0 1
TOTAL 3 50 8 76 0 16 33 29 0 108 78 1,287 27 50 22 241 14 4 0 0 185 1,861 *Number of dead non-targets included in number caught **Non-natives removed under CDFW authorization to control Brown-headed Cowbirds ***Budgeriar removed from trap and re-homed 1Number of birds released. 2Number of birds removed and taken into captivity or disposed of.

LBVI AND SWFL REPORT 2017 SANTA ANA WATERSHED ASSOCIATION TABLES
67
Table 8. Brown-headed Cowbird trapping results, fall/winter 2016-2017.
Site Name Trap/Location Dates of
Operation Number of Trap Days
Cowbirds Removed Daily Removed Averages
Total Male Female Juveniles Adults All
San Jacinto Vanderwoude 2 8/1-9/16/16 34 620 43 85 492 3.8 18.2
Tuls 1 8/1-9/16/16 34 204 20 31 153 1.5 6.0
Scott Bros 8/1-9/16/16 34 513 79 72 362 4.4 15.1
Subtotal 102 1,337 142 188 1,007 3.2 13.1
Temescal Dejong's Dairy 8/1/16-3/10/17 194 890 373 325 192 3.6 4.6
Prado Euclid Dairy 8/1/16-3/9/17 191 1,645 411 663 571 5.6 8.6
Weststeyn 1 Dairy 8/1/16-3/10/17 192 1,547 290 815 442 5.8 8.1
Weststeyn 2 Dairy 8/1/16-3/10/17 192 840 141 331 368 2.5 4.4
Subtotal 575 4,032 842 1,809 1,381 4.6 7.0
TOTAL 871 6,259 1,357 2,322 2,580 4.2 7.2

LBVI AND SWFL REPORT 2017 SANTA ANA WATERSHED ASSOCIATION TABLES
68
Table 9. Non-target avian captures in Brown-headed Cowbird traps, fall/winter, 2016-2017.
2016-2017 Winter Native Non-target Species San Jacinto Temescal Prado TOTAL Common Name Scientific Name caught died caught died caught died caught died
Red-winged Blackbird Agelaius phoeniceus 23 0 62 2 37 0 122 2
Great-tailed Grackle Quiscalus mexicanus 1 0 8 0 9 0
Yellow-headed Blackbird Xanthocephalus xanthocephalus 2 0 4 0 6 0
Brewer's Blackbird Euphagus cyanocephalus 2 0 2 0
TOTAL 24 0 64 2 51 0 139 2
#/trap day 0.2 0.3 0.1 0.2
Mortality % 0.0% 3.1% 0.0% 1.4%
Non-native Captures in Brown-headed Cowbird Traps, Winter 2016-17
2016-2017 Winter Non-native Species San Jacinto Temescal Prado TOTAL
Common Name Scientific Name released removed released removed released removed released removed
European Starling Sturnus vulgaris 0 39 3 600 11 984 14 1,623
House Sparrow Passer domesticus 0 2 0 34 0 36
Eurasian Collared Dove Streptopelia decaocto 1 0 1 0
TOTAL 1 39 3 602 11 1,018 15 1,659 *Number of dead non-targets included in number caught **Non-natives removed under CDFW authorization to control Brown-headed Cowbirds

LBVI AND SWFL REPORT 2017 SANTA ANA WATERSHED ASSOCIATION TABLES
69
Table 10. Observations of all species by location, 2017.
San
Jaci
nto
San
Tim
oteo
Can
yon
Mer
idia
n CA
(for
mer
M
arch
SKR
Pre
serv
e)
Sant
a An
a Ri
ver
(SAR
) - U
pstr
eam
Nor
co B
luff
s (I-1
5 to
Ri
ver R
d, n
on-
miti
gatio
n)
Tem
esca
l Can
yon
Sant
a An
a Ca
nyon
(S
AC)
Oth
er1
Avian
Canada Goose Branta canadensis X
Mandarin Ducki Aix galericulata X
Wood Duck Aix sponsa X
Blue-winged Teal Spatula discors X
Cinnamon Teal Spatula cyanoptera X X X
Northern Shoveler Spatula clypeata X X
Gadwall Mareca strepera X X X
American Wigeon Mareca americana X
Mallard Anas platyrhynchos X X X X X X X
Green-winged Teal Anas crecca X
Lesser Scaup Aythya affinis X
Bufflehead Bucephala albeola X
Common Merganser Mergus merganser X
Ruddy Duck Oxyura jamaicensis X X
California Quail Callipepla californica X X X X X
Pied-billed Grebe Podilymbus podiceps X X X
Eared Grebe Podiceps nigricollis X
Western Grebe Aechmophorus occidentalis X
Rock Pigeoni Columba livia X X
Band-tailed Pigeon Patagioenas fasciata X X
Eurasian Collared-Dovei Streptopelia decaocto X X X X
Common Ground-Dove Columbina passerina X X X X
Mourning Dove Zenaida macroura X X X X X X X

LBVI AND SWFL REPORT 2017 SANTA ANA WATERSHED ASSOCIATION TABLES
70
Table 10 continued. Observations of all species by location, 2017.
San
Jaci
nto
San
Tim
oteo
Can
yon
Mer
idia
n CA
(for
mer
M
arch
SKR
Pre
serv
e)
Sant
a An
a Ri
ver
(SAR
) - U
pstr
eam
Nor
co B
luff
s (I-1
5 to
Ri
ver R
d, n
on-
miti
gatio
n)
Tem
esca
l Can
yon
Sant
a An
a Ca
nyon
(S
AC)
Oth
er1
Avian
Greater Roadrunner Geococcyx californianus X X X X X X X
Vaux's Swift Chaetura vauxi X
White-throated Swift Aeronautes saxatalis X X X X X
Black-chinned Hummingbird Archilochus alexandri X X X X X
Anna's Hummingbird Calypte anna X X X X X X X
Costa's Hummingbird Calypte costae X X X X X
Rufous Hummingbird Selasphorus rufus X
Allen's Hummingbird Selasphorus sasin X X X X X
Sora Porzana carolina X X
American Coot Fulica americana X X X X X
Black-necked Stilt Himantopus mexicanus X X X
American Avocet Recurvirostra americana X X
Killdeer Charadrius vociferus X X X X X X X
Least Sandpiper Calidris minutilla X
Spotted Sandpiper Actitis macularius X X X
Greater Yellowlegs Tringa melanoleuca X X X
Gull spp. Larus spp. X X
Forster's Tern Sterna forsteri X
Double-crested Cormorantr Phalacrocorax auritus X X
American White Pelican Pelecanus erythrorhynchos X
American Bitternr Botaurus lentiginosus X
Great Blue Heronr Ardea herodias X X X
Great Egret Ardea alba X X X X X X

LBVI AND SWFL REPORT 2017 SANTA ANA WATERSHED ASSOCIATION TABLES
71
Table 10 continued. Observations of all species by location, 2017.
San
Jaci
nto
San
Tim
oteo
Can
yon
Mer
idia
n CA
(for
mer
M
arch
SKR
Pre
serv
e)
Sant
a An
a Ri
ver
(SAR
) - U
pstr
eam
Nor
co B
luff
s (I-1
5 to
Ri
ver R
d, n
on-
miti
gatio
n)
Tem
esca
l Can
yon
Sant
a An
a Ca
nyon
(S
AC)
Oth
er1
Avian
Snowy Egret Egretta thula X X X X
Green Heron Butorides virescens X X X X
Black-crowned Night-Heronr Nycticorax nycticorax X X X X
White-faced Ibisr Plegadis chihi X X X
Turkey Vulturer Cathartes aura X X X X X
Osprey Pandion haliaetus X X X
White-tailed Kiter Elanus leucurus X X
Sharp-shinned Hawkr Accipiter striatus X X
Cooper's Hawkr Accipiter cooperii X X X X X X X X
Red-shouldered Hawk Buteo lineatus X X X X X X
Red-tailed Hawk Buteo jamaicensis X X X X X X X
Barn Owl Tyto alba X X X X X
Great Horned Owl Bubo virginianus X X X X X
Belted Kingfisher Megaceryle alcyon X X X
Acorn Woodpecker Melanerpes formicivorus X X X
Nuttall's Woodpecker Picoides nuttallii X X X X X X X
Downy Woodpeckerr Picoides pubescens X X X X X X X
Northern Flicker Colaptes auratus X X X X X X
American Kestrel Falco sparverius X X X X X X
Merlin Falco columbarius X
Peregrine Falcon Falco peregrinus X
Western Wood-Pewee Contopus sordidulus X X X X
Willow Flycatcherr Empidonax traillii X X X

LBVI AND SWFL REPORT 2017 SANTA ANA WATERSHED ASSOCIATION TABLES
72
Table 10 continued. Observations of all species by location, 2017.
San
Jaci
nto
San
Tim
oteo
Can
yon
Mer
idia
n CA
(for
mer
M
arch
SKR
Pre
serv
e)
Sant
a An
a Ri
ver
(SAR
) - U
pstr
eam
Nor
co B
luff
s (I-1
5 to
Ri
ver R
d, n
on-
miti
gatio
n)
Tem
esca
l Can
yon
Sant
a An
a Ca
nyon
(S
AC)
Oth
er1
Avian
Pacific-slope Flycatcher Empidonax difficilis X X X X X X
Black Phoebe Sayornis nigricans X X X X X X X
Say's Phoebe Sayornis saya X X X X X X X
Vermilion Flycatcher Pyrocephalus rubinus X
Ash-throated Flycatcher Myiarchus cinerascens X X X X X X
Cassin's Kingbird Tyrannus vociferans X X X X X
Western Kingbird Tyrannus verticalis X X X X X X
Loggerhead Shriker Lanius ludovicianus X X
Hutton's Vireo Vireo huttoni X X X X X
Cassin's Vireo Vireo cassinii X
Warbling Vireo Vireo gilvus X X X
California Scrub-Jay Aphelocoma californica X X X X X X
American Crow Corvus brachyrhynchos X X X X X X X
Common Raven Corvus corax X X X X X X
Horned Larkr Eremophila alpestris X X X X
Tree Swallowr Tachycineta bicolor X X X X X X
Northern Rough-winged Swallow Stelgidopteryx serripennis X X X X X X X
Cliff Swallow Petrochelidon pyrrhonota X X X X X
Barn Swallow Hirundo rustica X X X
Oak Titmouse Baeolophus inornatus X X X X
Bushtit Psaltriparus minimus X X X X X X X
Rock Wren Salpinctes obsoletus X X
Canyon Wren Catherpes mexicanus X

LBVI AND SWFL REPORT 2017 SANTA ANA WATERSHED ASSOCIATION TABLES
73
Table 10 continued. Observations of all species by location, 2017.
San
Jaci
nto
San
Tim
oteo
Can
yon
Mer
idia
n CA
(for
mer
M
arch
SKR
Pre
serv
e)
Sant
a An
a Ri
ver
(SAR
) - U
pstr
eam
Nor
co B
luff
s (I-1
5 to
Ri
ver R
d, n
on-
miti
gatio
n)
Tem
esca
l Can
yon
Sant
a An
a Ca
nyon
(S
AC)
Oth
er1
Avian
House Wren Troglodytes aedon X X X X X X X
Marsh Wren Cistothorus palustris X X
Bewick's Wren Thryomanes bewickii X X X X X X X
Coastal Cactus Wrenr Campylorhynchus brunneicapillus X
Blue-gray Gnatcatcher Polioptila caerulea X X X X X X
California Gnatcatcherr Polioptila californica X X X
Ruby-crowned Kinglet Regulus calendula X X X X X X
Wrentit Chamaea fasciata X X X X X
Western Bluebird Sialia mexicana X X X X X X
Swainson's Thrush Catharus ustulatus X X
Hermit Thrush Catharus guttatus X X X
American Robin Turdus migratorius X X
California Thrasher Toxostoma redivivum X X X X X X X
Northern Mockingbird Mimus polyglottos X X X X X X X
European Starlingi Sturnus vulgaris X X X X X X
Cedar Waxwing Bombycilla cedrorum X
Phainopepla Phainopepla nitens X X X X X X
Pin-tailed Whydahi Vidua macroura X
Scaly-breasted Muniai Lonchura punctulata X X X
House Sparrowi Passer domesticus X X X
American Pipit Anthus rubescens X X X
House Finch Haemorhous mexicanus X X X X X X X
Lesser Goldfinch Spinus psaltria X X X X X X X

LBVI AND SWFL REPORT 2017 SANTA ANA WATERSHED ASSOCIATION TABLES
74
Table 10 continued. Observations of all species by location, 2017.
San
Jaci
nto
San
Tim
oteo
Can
yon
Mer
idia
n CA
(for
mer
M
arch
SKR
Pre
serv
e)
Sant
a An
a Ri
ver
(SAR
) - U
pstr
eam
Nor
co B
luff
s (I-1
5 to
Ri
ver R
d, n
on-
miti
gatio
n)
Tem
esca
l Can
yon
Sant
a An
a Ca
nyon
(S
AC)
Oth
er1
Avian
Lawrence's Goldfinch Spinus lawrencei X X X X X X
American Goldfinch Spinus tristis X X X X X X
Spotted Towhee Pipilo maculatus X X X X X X X
Rufous-crowned Sparrowr Aimophila ruficeps canescens X X
California Towhee Melozone crissalis X X X X X X X
Lark Sparrow Chondestes grammacus X X X X X
Savannah Sparrow Passerculus sandwichensis X X
Grasshopper Sparrow Ammodramus savannarum X
Song Sparrow Melospiza melodia X X X X X X X
Lincoln's Sparrowr Melospiza lincolnii X X
White-crowned Sparrow Zonotrichia leucophrys X X X X X X X
Golden-crowned Sparrow Zonotrichia atricapilla X
Yellow-breasted Chatr Icteria virens X X X X X X X
Yellow-headed Blackbirdr Xanthocephalus xanthocephalus X X
Western Meadowlark Sturnella neglecta X X X X X
Hooded Oriole Icterus cucullatus X X X X X X X
Bullock's Oriole Icterus bullockii X X X X X
Red-winged Blackbird Agelaius phoeniceus X X X X X X
Tricolored Blackbirdr Agelaius tricolor X X X
Brown-headed Cowbirdi Molothrus ater X X X X X
Brewer's Blackbird Euphagus cyanocephalus X X
Great-tailed Grackle Quiscalus mexicanus X X X
Orange-crowned Warbler Oreothlypis celata X X X X

LBVI AND SWFL REPORT 2017 SANTA ANA WATERSHED ASSOCIATION TABLES
75
Table 10 continued. Observations of all species by location, 2017.
San
Jaci
nto
San
Tim
oteo
Can
yon
Mer
idia
n CA
(for
mer
M
arch
SKR
Pre
serv
e)
Sant
a An
a Ri
ver
(SAR
) - U
pstr
eam
Nor
co B
luff
s (I-1
5 to
Ri
ver R
d, n
on-
miti
gatio
n)
Tem
esca
l Can
yon
Sant
a An
a Ca
nyon
(S
AC)
Oth
er1
Avian
Common Yellowthroat Geothlypis trichas X X X X X X X
Yellow Warblerr Setophaga petechia X X X X X X X X
Yellow-rumped Warbler Setophaga coronata X X X X X X
Townsend's Warbler Setophaga townsendi X
Hermit Warbler Setophaga occidentalis X
Wilson's Warblerr Cardellina pusilla X X X X X X
Western Tanager Piranga ludoviciana X X X
Black-headed Grosbeak Pheucticus melanocephalus X X X X X X X
Blue Grosbeak Passerina caerulea X X X X
Lazuli Bunting Passerina amoena X X X X
Mammals (tracks/other evidence used)
Virginia Opossumi Didelphis virginiana X X X X X
Eastern Fox Squirreli Sciurus niger X X X
California Ground Squirrel Otospermophilus beecheyi X X X X X X X
Kangaroo Rat sp. (tracks) Dipodomys sp. X X
Botta's Pocket Gopher Thomomys bottae X X X X
California Meadow Vole Microtus californicus X X
Woodrat sp. (nest) Neotoma sp. X X
Big-eared Woodrat (nest) Neotoma macrotis X X X X
Western Harvest Mouse Reithrodontomys megalotis X
House Mousei Mus musculus X
Roof Rati Rattus rattus X
San Diego Black-tailed Jackrabbitr Lepus californicus bennettii X X X X

LBVI AND SWFL REPORT 2017 SANTA ANA WATERSHED ASSOCIATION TABLES
76
Table 10 continued. Observations of all species by location, 2017.
San
Jaci
nto
San
Tim
oteo
Can
yon
Mer
idia
n CA
(for
mer
M
arch
SKR
Pre
serv
e)
Sant
a An
a Ri
ver
(SAR
) - U
pstr
eam
Nor
co B
luff
s (I-1
5 to
Ri
ver R
d, n
on-
miti
gatio
n)
Tem
esca
l Can
yon
Sant
a An
a Ca
nyon
(S
AC)
Oth
er1
Mammals (tracks/other evidence used)
Desert Cottontail Sylvilagus audubonii X X X X X X X
Broad-footed Mole Scapanus latimanus X
Bobcatr Lynx rufus X X X X X
Coyoter Canis latrans X X X X X X X
Long-tailed Weaselr Mustela frenata X X
American Badgerr Taxidea taxus X
Striped Skunk Mephitis mephitis X X X X X
Raccoon Procyon lotor X X X X X
Feral Pigi Sus scrofa X X X
Mule Deer Odocoileus hemionus X
Unknown Livestocki n/a X
Herpetofauna
Western Toad Anaxyrus boreas X X X X X
American Bullfrogi Lithobates catesbeianus X X X X X
Baja California Treefrog Pseudacris hypochondriaca X X X X X X X
Orange-throated Whiptailr Aspidoscelis hyperythra beldingi X X X
Tiger Whiptailr Aspidoscelis tigris X X X X X
Zebra-tailed Lizard Callisaurus draconoides X
Southern Alligator Lizard Elgaria multicarinata X X X X X
Blainville's Horned Lizardr Phrynosoma blainvillii X
Western Skink Plestiodon skiltonianus X
Western Fence Lizard Sceloporus occidentalis X X X X X X X
Granite Spiny Lizardr Sceloporus orcutti X X X

LBVI AND SWFL REPORT 2017 SANTA ANA WATERSHED ASSOCIATION TABLES
77
Table 10 continued. Observations of all species by location, 2017.
San
Jaci
nto
San
Tim
oteo
Can
yon
Mer
idia
n CA
(for
mer
M
arch
SKR
Pre
serv
e)
Sant
a An
a Ri
ver
(SAR
) - U
pstr
eam
Nor
co B
luff
s (I-1
5 to
Ri
ver R
d, n
on-
miti
gatio
n)
Tem
esca
l Can
yon
Sant
a An
a Ca
nyon
(S
AC)
Oth
er1
Herpetofauna
Side-blotched Lizard Uta stansburiana X X X X X X X
Red Racer/Coachwhip Coluber flagellum X X X X X X
California Striped Racer Coluber lateralis lateralis X
Southern Pacific Rattlesnake Crotalus oreganus helleri X X
Red Diamond Rattlesnaker Crotalus ruber X
California Kingsnake Lampropeltis californiae X X X X
San Diego Gopher Snake Pituophis catenifer annectens X X X X
Garter snake sp. Thamnophis sp. X
Southern Western Pond Turtler Actinemys pallida X
Texas Spiny Softshelli Apalone spinifera emoryi X
Common Snapping Turtlei Chelydra serpentina X
Red-eared Slideri Trachemys scripta elegans X X X
Fish
Lepomis sp.i Lepomis sp. X
Santa Ana Suckerr Catostomus santaanae X
Arroyo Chubr Gila orcuttii X 1 - Includes detections of sensitive species at sampled and incidental locations. Observations have been reported to CNDDB. i = invasive or non-native r = endangered, threatened, or sensitive: are those that are listed as endangered, threatened, or species of concern by the resource agencies and those that are covered by the Western Riverside County Multiple Species Habitat Conservation Plan (MSHCP).
Note: This list is not intended as a complete species list for these sites. This is a list of species observed in the riparian zone and adjacent habitat, caught in cowbird traps, or otherwise observed during the vireo monitoring from March 15, 2017 to September 7, 2017.

LBVI AND SWFL REPORT 2017 SANTA ANA WATERSHED ASSOCIATION APPENDIX A
A-1
APPENDIX A: SURVEY SITES, STARTING AND ENDING COORDINATES
[All coordinates – NAD83 (Zone 11S) except where noted otherwise]
Monitored Locations
Survey Site Starting Coordinates Ending Coordinates San Jacinto 506079, 3738423 502412, 3742274 487941, 3745198 490979, 3750919 San Timoteo Canyon: -Riverside County 484812, 3762433 499659, 3753988 -San Bernardino County 481628, 3764975 484406, 3762944 Meridian CA (former March SKR Preserve) 472984, 3752903 472161, 3749257 Santa Ana River (SAR): -Riverside Ave. to Van Buren Blvd. 466416, 3765008 455523, 3757886 -Hidden Valley, north side of river 456941, 3758360 451564, 3758587 -Hidden Valley, south side of river 455765, 3758220 451093, 3757549 -Hidden Valley to River Rd.ˡ -SAR-Goose Creek, Norco to I-15 451560, 3758574 448816, 3756435 -Goose Creek Mitigation, Norco 451091, 3757964 450042, 3757480 -Norco Bluffs (I-15 to River Rd, non-mitigation) 448907, 3756725 444876, 3753717
Temescal Canyon 471486, 3720612 450724, 3746925 Chino Hills 438794, 3754812 429061, 3759386 Santa Ana Canyon (SAC): -Upper Canyon 440787, 3749931 438609, 3749795 -Green River Golf Club 438609, 3749795 436613, 3748409 -Featherly Park 436604, 3748585 430713, 3748516
Sampled Locations and Incidental Sighting Locations
Survey Site Starting Coordinates Ending Coordinates Santa Ana River & Tributaries: Alessandro Arroyo/Prenda Arroyo 465993, 3754419 470391, 3751168 465354, 3752493 468066, 3751913 Arlington Falls² 453856, 3748925 454753, 3748301 Box Springs 472592, 3756430 471538, 3757620 Burris Basin3 419850, 3743943 419150, 3742378 Cajalco Creek² 453805, 3742988 453767, 3743230 Cajon Wash2 456784, 3796197 457285, 3791752 Canyon Crest 468329, 3757116 468644, 3756933 Carbon Canyon (Chino Hills Pkwy)2 431500, 3760294 431143, 3759777 Carbon Canyon (Western Hills Golf Club)² 429466, 3758320 429755, 3758496 Carbon Canyon Regional Park 422957, 3752929 425648, 3754031 Castleview Park 467826, 3755173 468565, 3754997 Chino Creek Wetlands Park 437620, 3758246 437395, 3758840 Chino Hills (Bayberry Dr.)² 432335, 3758297 431780, 3758507

LBVI AND SWFL REPORT 2017 SANTA ANA WATERSHED ASSOCIATION APPENDIX A
A-2
Chino Hills (End of Eucalyptus)2 428612, 3759298 428291, 3759409 Incidental Sighting Locations (cont.)
Survey Site Starting Coordinates Ending Coordinates Chino Hills Community Park (Euc/Peyton)2 432645, 3761036 430652, 3761849 Chino Hills State Park (Bane Cyn) 435061, 3757365 435376, 3753499 Chino Hills State Park (Easy Street Trail)² 427838, 3752393 427876, 3752942 Chino Hills State Park (Lower Aliso Cyn) 435288, 3753302 438033, 3749528 Chino Hills State Park (Telegraph Cyn) 434818, 3753694 424101, 3753165 Chino Hills State Park (Upper Aliso Cyn) 435114, 3753304 433810, 3754990 City Creek (Highland) 482136, 3775290 482454, 3777612 Clearwater Pkwy @ Glen Helen 462009, 3784622 461556, 3783760 Conrock Basin (FHQ)3 423314, 3746089 423465, 3746370 Corona Ave. at Gilmore 448093, 3750572 448406, 3750398 Fontana Power Plant2 463472, 3779349 463819, 3779791 Fresno Canyon 439703, 3749067 440954, 3749370 Gavilan Hills² 466730, 3741552 466846, 3740837 Golden Star 465359, 3751458 467227, 3750525 Harrison Reservoir (aka McAllister Creek) 460113, 3749435 460002, 3747712 Hidden Valley Golf Club 451635, 3752238 451557, 3754114 La Sierra 457824, 3747117 457284, 3749003 Little Sand Basin2 478157, 3779714 478805, 3780527 Mead Valley (Cajalco/aqueduct) 471842, 3744687 469980, 3743887 Menifee-Haun Rd² 483716, 3725045 483706, 3724364 Menifee-Paloma H. S.² 482515, 3725307 481557, 3724847 Mockingbird Canyon 464545, 3747457 468132, 3746353 Motte Rimrock Preserve² 475973, 3740183 475893, 3739398 Norco Hills Park Mitigation 449570, 3751384 449818, 3751233 Oak Glen Preserve² 505148, 3766841 505153, 3766838 Plunge Creek 486486, 3774528 486987, 3775572 Poorman Reservoir 476434, 3758610 477243, 3757320 Promenade² 451350, 3749618 451336, 3749919 Pyrite Channel 456489, 3762199 455222, 3760761 Quail Run 471038, 3757541 469907, 3757374 Riverwalk Park² 454365, 3751010 454281, 3752276 Ryan Bonaminio Park 463782, 3759521 463195, 3759424 Santa Rosa Mine Road² 471840, 3737819 471012, 3738146 Steele Valley² 471322, 3736485 471266, 3735608 Sun Canyon Park2 454614, 3749211 454788, 3749119 Sycamore Canyon 470209, 3757079 473225, 3753435 Talbert Park (Orange County) 411746, 3722974 411911, 3723740 Tequesquite Arroyo 467671, 3756303 468003, 3757103 Van Buren Blvd. (Bountiful) 469933, 3750024 469693, 3750007 Van Buren (Porter Road) 467009, 3749689 466421, 3750042 Wardlow Wash² 443306, 3747252 441873, 3749262 Woodcrest 465362, 3751501 465419, 3751271 Wyle Labs (at El Paso only) 450068, 3751818 450126, 3751839 Yorba Linda (Mud Canyon)² 431693, 3750752 431200, 3750802

LBVI AND SWFL REPORT 2017 SANTA ANA WATERSHED ASSOCIATION APPENDIX A
A-3
Yorba Linda (San Antonio Rd) 429199, 3750653 429494, 3751473 Incidental Sighting Locations (cont.)
Yorba Linda (Starlight Dr.) 431015, 3749685 430989, 3750218 Yorba Linda Lakebed Park 424747, 3748248 424886, 3748817 San Jacinto River Sub-watershed: Cottonwood Canyon 475633, 3725415 477503, 3724023 Kabian Park 477916, 3733876 475590, 3730678 Lake Perris² 483092, 3744484 485461, 3748329 Menifee (Salt Creek) 478164, 3726524 479548, 3727246 Santiago Creek Sub-watershed: Irvine Lake3 432717, 3736629 433854, 3736885 Irvine Trust Management Area 429806, 3738346 429896, 3738306 Limestone Canyon 434012, 3736548 434897, 3735784 Peter’s Canyon 429752, 3738563 428604, 3735584 Santiago Basin3 425344, 3740796 424678, 3740612 Santiago Canyon (Irvine Park) 430063, 3740268 428977, 3741769 Santiago Creek (above Irvine Lake) 437041, 3736718 435376, 3737521 Santiago Canyon Rd² 434949, 3735740 431995, 3736775 Santiago Creek (Cambridge Road) 421800, 3737876 421425, 3737985 Santiago Creek (Cannon Road, incl. Smith Basin) 425828, 3741421 428079, 3742770 Santiago Creek (Chapman Ave.) 423094, 3738524 423740, 3739316 Santiago Oaks Regional Park 428103, 3742766 429133, 3742111 Silverado Canyon2 437692, 3734768 438878, 3734047
Miscellaneous Locations Survey Site Starting Coordinates Ending Coordinates East Coyote Hills Preserve² 415417, 3750601 417337, 3751214 Etiwanda Preserve² 451769, 3780654 451186, 3787544 Mount Baldy (Shinn Rd)² 437794, 3781816 437765, 3782398 Murrieta Creek² 476609, 3716171 476299, 3715809 Rancho La Sierra West4 453521, 3757910 453547, 3757077 University of California, Riverside² 470131, 3759262 470131, 3759262 ˡ In 2015, Hidden Valley to River Rd. was divided into separate sites due to funding constraints. These sites are SAR-Goose Creek, Norco to I-15, which also includes Goose Creek Mitigation (funded by IERCD), and Norco Bluffs (I-15 to River Rd, non-mitigation), which as of 2016 includes an additional 250 acres that was not surveyed by SAWA in 2015. ² Denotes sites that were not surveyed this year. 3 Incidental observation of LBVI at this site. 4 In 2017, Rancho La Sierra West was added to SAR – Upstream, Hidden Valley south side of river. .
LBVI AND SWFL REPORT 2017 SANTA ANA WATERSHED ASSOCIATION APPENDIX B
B-1
APPENDIX B: WATERSHED-WIDE ANNUAL RESULTS, 2010-2017

LBVI AND SWFL REPORT 2017 SANTA ANA WATERSHED ASSOCIATION APPENDIX B
B-2
Appendix B-1. Least Bell’s Vireo status and management and Brown-headed Cowbird management data at closely monitored and sampled sites in the Santa Ana Watershed, 2000-2017.
Parameter 2000
-20
09
2010
2011
2012
2013
2014
2015
2016
2017
Tota
l
A. Number of territorial males n/a 654 641 599 769 814 834 865 983 n/a
B. Number of known pairs (breeding and non-breeding) 1,748 450 407 380 374 390 401 440 560 5,150
C. Number of fledged young observed 3,210 613 626 494 611 472 590 610 994 8,220
D. Projected total of recruitment of vireo young1 4,720 1,215 1,180 1,064 1,122 858 1,123 1,144 2,016 14,420
E. Average number of fledglings per pair (C/B) 1.8 1.4 1.5 1.3 1.6 1.2 1.5 1.4 1.8 1.6
F. Projected number of fledglings per pair (D/B) 2.7 2.7 2.9 2.8 3.0 2.2 2.8 2.6 3.6 2.8
G. Rate of missing eggs/chicks from nests (successful and unsuccessful nests)
39% 43% 40% 39% 40% 54% n/a n/a n/a 41%
467/1,185 60/138 82/204 48/123 67/167 80/149 804/1,966
H. Rate of cowbird nest parasitism 17% 5% 2% 5% 4% 5% 2% 3% 4% 10%
204/1,185 7/138 5/204 6/123 7/167 8/149 4/188 6/180 13/308 260/2,642
I. Numbers of cowbirds removed from monitored sites 18,590 3,093 2,444 2,823 1,945 1,271 1,245 3,177 1,953 36,5412
J. This row purposefully omitted.
K. Number of trap days (1 operative trap day in the field for one day = 1 trap day) 41,691 6,992 6,333 5,190 6,355 5,290 4,252 5,707 4,061 85,8712
L. Average number of cowbirds trapped per trap day (I/K) 0.45 0.44 0.39 0.54 0.31 0.24 0.29 0.56 0.48 0.43
M. Number of field hours - LBVI 39,014
2,589 2,738 2,364 2,942 1,952 2,192 2,444 2,969 80,404
N. Number of field hours - BHCO 3,239 3,281 2,838 2,879 2,724 2,052 2,163 2,024 1Survival rate of fledglings in well-tracked nests was applied to nests not visited as frequently by the function (avg. # fledglings produced by well- monitored pairs x total number of pairs). These data represent minimum recruitment as defined by the Least Bell's VIreo Working Group "known fledged young." 2All traps are not accounted for in this total.

LBVI AND SWFL REPORT 2017 SANTA ANA WATERSHED ASSOCIATION APPENDIX B
B-3
Appendix B-2. Least Bell’s Vireo nest placement preferences at monitored and sampled sites in the Santa Ana Watershed, 2000-2017.
Host Plant Species (listed in taxonomic order) 20
00-2
009
2010
2011
2012
2013
2014
2015
2016
2017
Tota
l
Perc
enta
ge
of T
otal
Giant Reedie (Arundo donax) 1 1 <1% Coulter's Matilija Poppyr (Romneya coulteri) 1 1 <1% Western Sycamore (Platanus racemosa) 2 1 3 3 9 <1% Golden Currant (Ribes aureum) 1 2 1 1 5 <1% Desert Wild Grape (Vitis girdiana) 38 8 17 4 7 21 17 14 21 147 5% Fremont Cottonwood (Populus fremontii) 49 6 12 6 7 9 15 6 14 124 4% Dead Fremont Cottonwood (Populus fremontii) 1 1 2 <1% Black Cottonwood (Populus balsamifera ssp. trichocarpa) 1 1 2 <1% Narrowleaf Willow (Salix exigua) 56 3 12 11 13 8 5 4 20 132 4% Dead Narrowleaf Willow (Salix exigua) 1 1 <1% Goodding's Black Willow (Salix gooddingii) 224 12 20 10 11 3 20 19 28 347 11% Dead Goodding's Black Willlow (Salix gooddingii) 1 1 <1% Dead Goodding's Black Willow covered with living Goodding's Black Willow (Salix gooddingii) 1 1 <1% Red Willow (Salix laevigata) 118 22 39 19 23 8 26 25 30 310 10% Arroyo Willow (Salix lasiolepis) 291 27 39 31 35 28 30 46 73 600 20% Dead Arroyo Willow (Salix lasiolepis) 1 1 <1% Pacific Willow (Salix lasiandra) 8 1 2 2 1 2 3 19 1%

LBVI AND SWFL REPORT 2017 SANTA ANA WATERSHED ASSOCIATION APPENDIX B
B-4
Appendix B-2 continued. Least Bell’s Vireo nest placement and preferences at monitored and sampled sites in the Santa Ana Watershed, 2000-2017.
Host Plant Species (listed in taxonomic order) 20
00-2
009
2010
2011
2012
2013
2014
2015
2016
2017
Tota
l
Perc
enta
ge
of T
otal
Willow sp. (Salix sp.) 6 2 8 <1% Dead Willow sp. (Salix sp.) 2 1 1 1 5 <1% Castorbeanie (Ricinus communis) 1 1 2 <1% Western False Indigo (Amorpha fruticosa) 1 1 <1% Bank Catclawe (Acacia redolens) 1 1 <1% Toyon (Heteromeles arbutifolia) 17 1 1 1 4 3 1 28 1% California Blackberry (Rubus ursinus) 1 2 3 <1% California Wild Rose (Rosa californica) 5 2 1 8 <1% Hollyleaf Cherry (Prunus ilicifolia) 1 1 <1% Chinese Elme (Ulmus parvifolia) 1 1 <1% White Mulberrye (Morus alba) 1 1 <1% Fig sp.ie
(Ficus sp.) 1 1 <1% Stinging Nettle (Urtica dioica) 1 1 <1% Coast Live Oak (Quercus agrifolia) 1 1 2 <1% Scrub Oak (Quercus berberidifolia) 4 2 6 <1% Oak sp. (Quercus sp.) 1 1 <1% Southern California Black Walnutr (Juglans californica) 5 2 4 1 5 17 1%

LBVI AND SWFL REPORT 2017 SANTA ANA WATERSHED ASSOCIATION APPENDIX B
B-5
Appendix B-2 continued. Least Bell’s Vireo nest placement and preferences at monitored and sampled sites in the Santa Ana Watershed, 2000-2017.
Host Plant Species (listed in taxonomic order) 20
00-2
009
2010
2011
2012
2013
2014
2015
2016
2017
Tota
l
Perc
enta
ge
of T
otal
White Alder (Alnus rhombifolia) 1 1 2 <1% Laurel Sumac (Malosma laurina) 6 3 2 1 2 6 20 1% Sugar Sumac (Rhus ovata) 1 1 2 <1% Fragrant Sumac (Rhus aromatica) 1 1 <1% Poison Oak (Toxicodendron diversilobum) 9 4 2 3 4 2 24 1% Peruvian Pepper Treeie (Schinus molle) 5 3 1 1 2 3 15 <1% Brazilian Pepper Treeie (Schinus terebinthifolius) 1 1 <1% Boxelder (Acer negundo) 1 1 2 <1% Tree of Heavenie (Ailanthus altissima) 1 1 <1% Orange Treee (Citrus sinensis) 1 1 1 3 <1% Black Mustardie
(Brassica nigra) 3 1 1 5 <1% Mustard sp.ie (Brassica sp.) 5 1 1 7 <1% Perennial Pepperweedie (Lepidium latifolium) 4 1 1 6 <1% Dead Perennial Pepperweedie (Lepidium latifolium) 1 1 <1% Tamariskie (Tamarix ramosissima) 3 1 1 3 1 1 10 <1% Cape Leadworte (Plumbago auriculata) 1 1 2 <1% Fourwing Saltbush (Atriplex canescens) 1 1 2 <1%

LBVI AND SWFL REPORT 2017 SANTA ANA WATERSHED ASSOCIATION APPENDIX B
B-6
Appendix B-2 continued. Least Bell’s Vireo nest placement and preferences at monitored and sampled sites in the Santa Ana Watershed, 2000-2017.
Host Plant Species (listed in taxonomic order) 20
00-2
009
2010
2011
2012
2013
2014
2015
2016
2017
Tota
l
Perc
enta
ge
of T
otal
Ash sp. (Fraxinus sp.) 1 1 <1% Privet sp.e (Ligustrum sp.) 1 1 <1% Lollypop Treeie (Myoporum laetum) 1 1 <1% Black Sage (Salvia mellifera) 1 1 <1% Tree Tobaccoie (Nicotiana glauca) 1 1 <1% Brittlebush (Encelia farinosa) 1 1 <1% Milk Thistleie (Silybum marianum) 1 1 <1% Yellowspine Thistleie (Cirsium ochrocentrum) 2 2 <1% California Sagebrush (Artemisia californica) 1 1 <1% Douglas' Sagewort (Artemisia douglasiana) 18 1 1 1 2 1 24 1% Coyote Brush (Baccharis pilularis) 5 2 1 3 2 13 <1% Mulefat (Baccharis salicifolia) 418 66 56 29 51 57 49 55 75 856 28% Dead Mulefat (Baccharis salicifolia) 5 2 1 8 <1% Willow Baccharis (Baccharis salicina) 3 3 <1% Desertbroom Baccharis (Baccharis sarothroides) 1 1 <1% Sunflower (Helianthus annuus) 1 1 <1% Arrowweed (Pluchea sericea) 1 1 1 1 4 <1%

LBVI AND SWFL REPORT 2017 SANTA ANA WATERSHED ASSOCIATION APPENDIX B
B-7
Appendix B-2 continued. Least Bell’s Vireo nest placement and preferences at monitored and sampled sites in the Santa Ana Watershed, 2000-2017.
Host Plant Species (listed in taxonomic order) 20
00-2
009
2010
2011
2012
2013
2014
2015
2016
2017
Tota
l
Perc
enta
ge
of T
otal
Rough Cockelburr (Xanthium strumarium) 2 2 <1% Garden Celerye (Apium graveolens) 1 1 <1% Poison Hemlockie (Conium maculatum) 10 1 11 <1% Blue Elderberry (Sambucus nigra ssp. caerulea) 67 12 17 11 14 15 18 8 13 175 6% Dead Blue Elderberry (Sambucus nigra ssp. caerulea) 1 1 <1% Fiddleneck sp. (Amsinckia sp.) 1 1 <1% Thickleaf Yerba Santa (Eriodictyon crassifolium) 1 2 3 <1% Yerba Santa sp. (Eriodictyon sp.) 1 1 <1% Desert Wild Grape (V. girdiana) and Goodding's Black Willow (S. gooddingii) 1 1 <1% Desert Wild Grape (V. girdiana) and Arroyo Willow (S. lasiolepis) 1 1 <1% Desert Wild Grape (V. girdiana) and California Wild Rose (R. californica) 1 1 <1% Desert Wild Grape (V. girdiana) and Peruvian Pepper Treeie (S. molle) 1 1 <1% Desert Wild Grape (V. girdiana) and Mulefat (B. salicifolia) 2 1 1 1 5 <1% Desert Wild Grape (V. girdiana) and Blue Elderberry (S. n. caerulea) 1 1 <1% Goodding's Black Willow (S. gooddingii) and Perennial Pepperweedie (L. latifolium) 1 1 <1% Goodding's Black Willow (S. gooddingii) and Poison Hemlockie (C. maculatum) 1 1 <1% Goodding's Black Willow (S. gooddingii) and Blue Elderberry (S. n. caerulea) 1 1 <1%

LBVI AND SWFL REPORT 2017 SANTA ANA WATERSHED ASSOCIATION APPENDIX B
B-8
Appendix B-2 continued. Least Bell’s Vireo nest placement and preferences at monitored and sampled sites in the Santa Ana Watershed, 2000-2017.
Host Plant Species (listed in taxonomic order) 20
00-2
009
2010
2011
2012
2013
2014
2015
2016
2017
Tota
l
Perc
enta
ge
of T
otal
Dead Goodding's Black Willow (S. gooddingii) and Stinging Nettle (U. dioica) 1 1 <1% Red Willow (S. laevigata) and dead Stinging Nettle (U. dioica) 1 1 <1% Red Willow (S. laevigata) and Wild Cucumber (Marah macrocarpa) 1 1 <1%
Red Willow (S. laevigata) and Unknown 1 1 <1% Arroyo Willow (S. lasiolepis) and Black Mustardie (B. nigra) 1 1 <1% Arroyo Willow (S. lasiolepis) and Sweet Fenneli (Foeniculum vulgare) 1 1 <1% Willow sp. (Salix sp.) and California Blackberry (Rubus ursinus) 1 1 <1% Willow sp. (Salix sp.) and Perennial Pepperweedie (L. latifolium) 1 1 <1% Castorbeanie (R. communis) and Mulefat (B. salicifolia) 1 1 <1% Black Mustardie (B. nigra) and Mulefat (B. salicifolia) 1 1 <1% Coyote Brush (B. pilularis) and Mulefat (B. salicifolia) 1 1 <1% Mulefat (B. salicifolia) and Poison Hemlockie (C. maculatum) 1 1 <1%
Deadfall 2 1 1 1 5 <1%
Unknown/No data 5 3 4 3 8 4 27 1%
Total 1,430 168 234 140 192 174 210 206 312 3,066 100% i = invasive e = non-native r = endangered, threatened, or sensitive

LBVI AND SWFL REPORT 2017 SANTA ANA WATERSHED ASSOCIATION APPENDIX B
B-9
Appendix B-3. Least Bell’s Vireo reproductive success and breeding biology data at monitored and sampled sites in the Santa Ana Watershed, 2000-2017.
Parameter 2000
-200
9
2010
2011
2012
2013
2014
2015
2016
2017
Tota
l
A. Number of known pairs 1,748 450 407 380 374 390 401 440 560 5,150
B. Number of known breeding (nesting) pairs 1,567 361 345 287 324 301 322 353 486 4,346
C.
Number of breeding pairs that were well-monitored throughout the breeding season 702 87 105 74 92 81 93 95 135 1,464
D. Number of 'known fledged young' OBSERVED 3,210 613 626 494 611 472 590 610 994 8,220
E.
Number of known fledged young produced by pairs monitored throughout the breeding season 1,895 239 308 207 277 178 256 248 490 4,098
F.
Average number of fledglings produced per breeding pair (minimum; D/B = 'productivity or breeding success') 2.0 1.7 1.8 1.7 1.9 1.6 1.8 1.7 2.0 1.9
G.
Average number of fledglings produced by well- monitored pairs(E/C = reproductive success) 2.7 2.7 2.9 2.8 3.0 2.2 2.8 2.6 3.6 2.8
H. Number of nests that were discovered 1,447 184 240 142 196 178 220 206 316 3,129
I. Number of nests that were regularly monitored or 'tracked' 1,185 138 204 123 167 149 188 180 279 2,613
J. Number of 'tracked' nests that were successful (% = J/I x 100)
61% 65% 56% 60% 61% 48% 55% 52% 60% 59% 720/1,185 90/138 115/204 74/123 102/167 72/149 103/188 93/180 167/279 1,536/2,613
K.
Rate of missing eggs/chicks from nests (includes successful and unsuccessful nests)
39% 43% 40% 39% 40% 54% n/a n/a n/a 41%
467/1,185 60/138 82/204 48/123 67/167 80/149 804/1,966
L. Number of 'tracked' nests that were parasitized by cowbirds (% = L/I x 100)
17% 5% 2% 5% 4% 5% 2% 3% 5% 10% 204/1,185 7/138 5/204 6/123 7/167 8/149 4/188 6/180 13/279 260/2,613
M.
A. Number of 'tracked' nests that failed as a result of reproductive failure
4% 4% 5% 3% 5% 5% 10% 6% 4% 5% 45/1,185 6/138 10/204 4/123 9/167 7/149 18/188 10/180 11/279 120/2,613
B. Number of 'tracked' nests that failed as a result of parasitism
5% 3% 1% 2% 0% 3% 0% 1% 2% 3% 61/1,185 4/138 3/204 3/123 0/167 5/149 0/188 1/180 6/279 83/2,613
C. Number of 'tracked' nests that failed as a result of predation
30% 28% 36% 34% 32% 43% 36% 41% 31% 33% 358/1,185 39/138 74/204 42/123 54/167 64/149 67/188 74/180 86/279 858/2,613
D. Number of 'tracked' nests that failed for unknown reasons
<1% 0% 1% 0% 1% 1% 0% 1% 1% <1% 1/1,185 0/138 2/204 0/123 2/167 1/149 0/188 2/180 4/279 12/2,613

LBVI AND SWFL REPORT 2017 SANTA ANA WATERSHED ASSOCIATION APPENDIX B
B-10
Appendix B-3 continued. Least Bell’s Vireo reproductive success and breeding biology data at monitored and sampled sites in the Santa Ana Watershed, 2000-2017.
Parameter 2000
-200
9
2010
2011
2012
2013
2014
2015
2016
2017
Tota
l
N. Average clutch size n/a n/a 3.6 3.4 3.4 1.5 3.3 3.4 3.7 n/a
O. Number of cowbird eggs found in or near vireo nests 248 11 6 9 7 8 4 8 13 314
P. Number of cowbird nestlings removed from 'tracked' nests 15 0 0 0 0 1 0 0 0 16
Q. Number of cowbird young fledged by vireo 8 1 1 0 2 2 1 0 2 17
R. Number of 'manipulated' parasitized nests 169 5 3 4 6 5 4 6 11 213
S. Number of 'successful, manipulated' nests (% = S/R x 100)
45% 60% 67% 100% 83% 40% 25% 33% 9% 45% 76/169 3/5 2/3 4/4 5/6 2/5 1/4 2/6 1/11 96/213
T. Number of vireo fledged from 'manipulated' parasitized nests 158 8 4 10 11 5 2 6 3 207
U. Number of repaired nests 19 2 7 2 1 3 0 0 3 37
V. % of successful repaired nests 72% 50% 86% 100% 100% 67% n/a n/a 33% 72%
13/18 1/2 6/7 2/2 1/1 2/3 1/3 26/36
W. Number of vireo fledged from repaired nests 37 2 16 6 4 5 n/a n/a 4 74

LBVI AND SWFL REPORT 2017 SANTA ANA WATERSHED ASSOCIATION APPENDIX C
C-1
APPENDIX C: SUMMARY TABLES BY MANAGED SITE, 2000-2017

LBVI AND SWFL REPORT 2017 SANTA ANA WATERSHED ASSOCIATION APPENDIX C
C-2
Appendix C-1-A. Least Bell’s Vireo status and management and Brown-headed Cowbird management data at survey sites in the Santa Ana Watershed, 2000-2017.
SAN JACINTO
Parameter 2000
-20
09
2010
2011
2012
2013
2014
2015
2016
2017
Tota
l
A. Number of territorial males n/a 22 41 42 53 45 29 37 45 n/a
B. Number of known pairs (breeding and non-breeding) 43 18 25 36 29 19 7 17 27 221
C. Number of fledged young observed 104 28 18 49 39 12 8 12 48 318
D. Projected total of recruitment of vireo younga 122 n/a n/a 104 38 n/a n/a 20 76 360
(n = 4yrs)
E. Average number of fledglings per pair (C/B) 2.4 1.6 0.7 1.4 1.3 0.6 1.1 0.7 1.8 1.4
F. Projected number of fledglings per pair (D/B) 2.8 n/a n/a 2.9 1.3 n/a n/a 1.2 2.8 1.6
G. Rate of missing eggs/chicks from nests (successful and unsuccessful nests)
33% 0% 80% 31% 69% 0% n/a n/a n/a n/a 18 / 54 0 / 3 8 / 10 4 / 13 9 / 13 0 / 1
H. Rate of cowbird nest parasitism 11% 0% 10% 8% 0% 100% n/a 75% 6% 13%
6 / 54 0 / 3 1 / 10 1 / 13 0 / 13 1 / 1 6 / 8 1 / 17 16 / 119
I. Numbers of cowbirds removed from monitored sites 11,622 2,136 1,797 1,728 1,085 713 n/a 2,101 1,405 22,5871
J. This row purposefully omitted.
K. Number of trap days (1 operative trap day in the field for one day = 1 trap day) 6,405 993 982 984 1,058 945 n/a 390 589 12,3461
L. Average number of cowbirds trapped per trap day (I/K) 1.81 2.15 1.83 1.76 1.03 0.75 n/a 5.39 2.39 1.83
M. Number of field hours - LBVI 4,425
79 129 161 155 72 n/a 83 201 8,649
N. Number of field hours - BHCO 525 544 711 496 462 n/a 223 383 aSurvival rate of fledglings in well-tracked nests was applied to nests not visited as frequently by the function (avg. # fledglings produced by well-monitored pairs x total number of pairs). These data represent minimum recruitment as defined by the Least Bell's Vireo Working Group "known fledged young." 1All traps are not accounted for in this total.

LBVI AND SWFL REPORT 2017 SANTA ANA WATERSHED ASSOCIATION APPENDIX C
C-3
Appendix C-1-B. Least Bell’s Vireo status and management and Brown-headed Cowbird management data at survey sites in the Santa Ana Watershed, 2000-2017.
SAN TIMOTEO CANYON
Parameter 2000
-20
09
2010
2011
2012
2013
2014
2015
2016
2017
Tota
l
A. Number of territorial males n/a 126 116 118 131 151 176 173 172 n/a
B. Number of known pairs (breeding and non-breeding) 323 95 101 102 80 135 141 124 109 1,210
C. Number of fledged young observed 635 137 196 153 179 206 287 222 272 2,287
D. Projected total of recruitment of vireo younga 918 266 343 286 288 338 451 384 458 3,732
(n = 9yrs)
E. Average number of fledglings per pair (C/B) 2.0 1.4 1.9 1.5 2.2 1.5 2.0 1.8 2.5 1.9
F. Projected number of fledglings per pair (D/B) 2.8 2.8 3.4 2.8 3.6 2.5 3.2 3.1 4.2 3.1
G. Rate of missing eggs/chicks from nests (successful and unsuccessful nests)
44% 65% 30% 42% 41% 52% n/a n/a n/a n/a 150 / 338 24 / 37 22 / 73 19 / 45 31 / 76 46 / 88
H. Rate of cowbird nest parasitism 31% 8% 0% 2% 3% 6% 0% 0% 1% 12%
103 / 338 3 / 37 0 / 73 1 / 45 2 / 76 5 / 88 0 / 114 0 / 73 1 / 94 115 / 938
I. Numbers of cowbirds removed from monitored sites 1,487 173 109 143 164 143 169 87 93 2,5681
J. This row purposefully omitted.
K. Number of trap days (1 operative trap day in the field for one day = 1 trap day) 6,463 1,113 1,191 982 1,198 1,058 996 832 794 14,6271
L. Average number of cowbirds trapped per trap day (I/K) 0.23 0.16 0.09 0.15 0.14 0.14 0.17 0.10 0.12 0.18
M. Number of field hours - LBVI 6,525
505 587 407 481 442 750 415 442 13,982
N. Number of field hours - BHCO 503 564 326 525 504 399 329 278 aSurvival rate of fledglings in well-tracked nests was applied to nests not visited as frequently by the function (avg. # fledglings produced by well-monitored pairs x total number of pairs). These data represent minimum recruitment as defined by the Least Bell's Vireo Working Group "known fledged young." 1All traps are not accounted for in this total.

LBVI AND SWFL REPORT 2017 SANTA ANA WATERSHED ASSOCIATION APPENDIX C
C-4
Appendix C-1-C. Least Bell’s Vireo status and management and Brown-headed Cowbird management data at survey sites in the Santa Ana Watershed, 2000-2017.
MERIDIAN CONSERVATION AREA*
Parameter 2000
-20
09
2010
2011
2012
2013
2014
2015
2016
2017
Tota
l
A. Number of territorial males n/a 14 16 13 14 21 7 14 16 n/a
B. Number of known pairs (breeding and non-breeding) 33 12 9 11 12 16 3 5 9 110
C. Number of fledged young observed 75 25 7 8 16 23 3 6 23 186
D. Projected total of recruitment of vireo younga 121 76 n/a n/a n/a 48 n/a n/a 27 272
(n = 4yrs)
E. Average number of fledglings per pair (C/B) 2.3 2.1 0.8 0.7 1.3 1.4 1.0 1.2 2.6 1.7
F. Projected number of fledglings per pair (D/B) 4.6 6.3 n/a n/a n/a 3.0 n/a n/a 3.0 2.5
G. Rate of missing eggs/chicks from nests (successful and unsuccessful nests)
38% 0% n/a n/a n/a 67% n/a n/a n/a n/a 6 / 16 0 / 6 2 / 3
H. Rate of cowbird nest parasitism 0% 0% n/a n/a n/a 0% n/a n/a 0% 0%
0 / 16 0 / 6 0 / 3 0 / 5 0 / 30
I. Numbers of cowbirds removed from monitored sites 151 13 12 16 15 1 8 3 18 2371
J. This row purposefully omitted.
K. Number of trap days (1 operative trap day in the field for one day = 1 trap day) 1,203 280 200 235 250 178 260 248 260 3,1141
L. Average number of cowbirds trapped per trap day (I/K) 0.13 0.05 0.06 0.07 0.06 0.01 0.03 0.01 0.07 0.08
M. Number of field hours - LBVI 457 62 55 22 60 81 n/a 29 61 827
N. Number of field hours - BHCO 504 153 45 60 85 68 123 87 69 1,194 aSurvival rate of fledglings in well-tracked nests was applied to nests not visited as frequently by the function (avg. # fledglings produced by well-monitored pairs x total number of pairs). These data represent minimum recruitment as defined by the Least Bell's Vireo Working Group "known fledged young." 1All traps are not accounted for in this total.
*Former March SKR Preserve

LBVI AND SWFL REPORT 2017 SANTA ANA WATERSHED ASSOCIATION APPENDIX C
C-5
Appendix C-1-D. Least Bell’s Vireo status and management and Brown-headed Cowbird management data at survey sites in the Santa Ana Watershed, 2000-2017.
SYCAMORE CANYON
Parameter 2000
-20
09
2010
2011
2012
2013
2014
2015
2016
2017
Tota
l
A. Number of territorial males n/a 12 9 7 12 17 4 13 18 n/a
B. Number of known pairs (breeding and non-breeding) 35 8 5 7 0 5 1 4 9 74
C. Number of fledged young observed 40 11 4 5 0 2 1 6 10 79
D. Projected total of recruitment of vireo younga 40 n/a n/a n/a n/a n/a n/a n/a n/a 40
(n = 4yrs)
E. Average number of fledglings per pair (C/B) 1.1 1.4 0.8 0.7 n/a 0.4 1.0 1.5 1.1 1.1
F. Projected number of fledglings per pair (D/B) 1.1 n/a n/a n/a n/a n/a n/a n/a n/a 0.5
G. Rate of missing eggs/chicks from nests (successful and unsuccessful nests)
33% n/a n/a n/a n/a 100% n/a n/a n/a n/a 3 / 9 4 / 4
H. Rate of cowbird nest parasitism 22% n/a n/a n/a n/a 50% n/a n/a n/a 31%
2 / 9 2 / 4 4 / 13
I. Numbers of cowbirds removed from monitored sites 81 n/a n/a n/a n/a 9 n/a n/a n/a 901
J. This row purposefully omitted.
K. Number of trap days (1 operative trap day in the field for one day = 1 trap day) 635 n/a n/a n/a n/a 75 n/a n/a n/a 7101
L. Average number of cowbirds trapped per trap day (I/K) 0.13 n/a n/a n/a n/a 0.12 n/a n/a n/a 0.13 M. Number of field hours - LBVI 474 54 46 22 n/a 43 n/a 15 15 669
N. Number of field hours - BHCO 469 n/a n/a n/a n/a 31 n/a n/a n/a 500 aSurvival rate of fledglings in well-tracked nests was applied to nests not visited as frequently by the function (avg. # fledglings produced by well-monitored pairs x total number of pairs). These data represent minimum recruitment as defined by the Least Bell's Vireo Working Group "known fledged young." 1All traps are not accounted for in this total.

LBVI AND SWFL REPORT 2017 SANTA ANA WATERSHED ASSOCIATION APPENDIX C
C-6
Appendix C-1-E. Least Bell’s Vireo status and management and Brown-headed Cowbird management data at survey sites in the Santa Ana Watershed, 2000-2017.
MOCKINGBIRD CANYON
Parameter 2000
-20
09
2010
2011
2012
2013
2014
2015
2016
2017
Tota
l
A. Number of territorial males n/a 43 37 28 31 23 37 25 29 n/a
B. Number of known pairs (breeding and non-breeding) 120 34 32 26 24 7 23 7 15 288
C. Number of fledged young observed 218 25 67 39 40 7 19 11 15 441
D. Projected total of recruitment of vireo younga 418 n/a 93 78 79 n/a n/a 21 n/a 689
(n = 7yrs)
E. Average number of fledglings per pair (C/B) 1.8 0.7 2.1 1.5 1.7 1.0 0.8 1.6 1.0 1.5
F. Projected number of fledglings per pair (D/B) 3.5 n/a 2.9 3.0 3.3 n/a n/a 3.0 n/a 2.4
G. Rate of missing eggs/chicks from nests (successful and unsuccessful nests)
38% n/a 60% 53% 47% 50% n/a n/a n/a n/a 31 / 82 18 / 30 9 / 17 8 / 17 1 / 2
H. Rate of cowbird nest parasitism 15% n/a 0% 6% 18% 0% 0% 0% 0% 10%
12 / 82 0 / 30 1 / 17 3 / 17 0 / 2 0 / 5 0 / 3 0 / 2 16 / 158
I. Numbers of cowbirds removed from monitored sites 1,258 149 111 140 123 71 63 52 84 2,0511
J. This row purposefully omitted.
K. Number of trap days (1 operative trap day in the field for one day = 1 trap day) 5,395 1,028 908 495 772 603 256 385 451 10,2931
L. Average number of cowbirds trapped per trap day (I/K) 0.23 0.14 0.12 0.28 0.16 0.12 0.25 0.14 0.19 0.20
M. Number of field hours - LBVI 3,661
96 302 203 389 62 77 157 87 6,898
N. Number of field hours - BHCO 312 176 215 323 307 117 193 221 aSurvival rate of fledglings in well-tracked nests was applied to nests not visited as frequently by the function (avg. # fledglings produced by well-monitored pairs x total number of pairs). These data represent minimum recruitment as defined by the Least Bell's Vireo Working Group "known fledged young." 1All traps are not accounted for in this total.

LBVI AND SWFL REPORT 2017 SANTA ANA WATERSHED ASSOCIATION APPENDIX C
C-7
Appendix C-1-F. Least Bell’s Vireo status and management and Brown-headed Cowbird management data at survey sites in the Santa Ana Watershed, 2000-2017.
SANTA ANA RIVER (SAR) - UPSTREAM - RIVERSIDE AVE. TO VAN BUREN BLVD.
Parameter 2000
-20
09
2010
2011
2012
2013
2014
2015
2016
2017
Tota
l
A. Number of territorial males n/a 68 49 43 77 66 109 109 155 n/a
B. Number of known pairs (breeding and non-breeding) 167 50 22 11 n/a 19 37 43 95 444
C. Number of fledged young observed 283 58 32 7 7 15 33 62 169 666
D. Projected total of recruitment of vireo younga 329 100 71 n/a n/a 23 n/a 172 276 971
(n = 5yrs)
E. Average number of fledglings per pair (C/B) 1.7 1.2 1.5 0.6 n/a 0.8 0.9 1.4 1.8 1.5
F. Projected number of fledglings per pair (D/B) 2.7 2.0 3.2 n/a n/a 1.2 n/a 4.0 2.9 2.2
G. Rate of missing eggs/chicks from nests (successful and unsuccessful nests)
32% 36% 30% n/a n/a 67% n/a n/a n/a n/a 24 / 75 4 / 11 3 / 10 2 / 3
H. Rate of cowbird nest parasitism 16% 0% 10% n/a n/a 0% 100% 0% 12% 13%
12 / 75 0 / 11 1 / 10 0 / 3 3 / 3 0 / 12 7 / 58 23 / 172
I. Numbers of cowbirds removed from monitored sites 461 58 30 37 21 17 30 65 46 7651
J. This row purposefully omitted.
K. Number of trap days (1 operative trap day in the field for one day = 1 trap day) 3,734 530 515 468 540 256 302 534 513 7,3921
L. Average number of cowbirds trapped per trap day (I/K) 0.12 0.11 0.06 0.08 0.04 0.07 0.10 0.12 0.09 0.10
M. Number of field hours - LBVI 2,333
335 239 144 167 123 175 439 557 6,526
N. Number of field hours - BHCO 277 315 234 230 188 104 380 286 aSurvival rate of fledglings in well-tracked nests was applied to nests not visited as frequently by the function (avg. # fledglings produced by well-monitored pairs x total number of pairs). These data represent minimum recruitment as defined by the Least Bell's Vireo Working Group "known fledged young." 1All traps are not accounted for in this total.
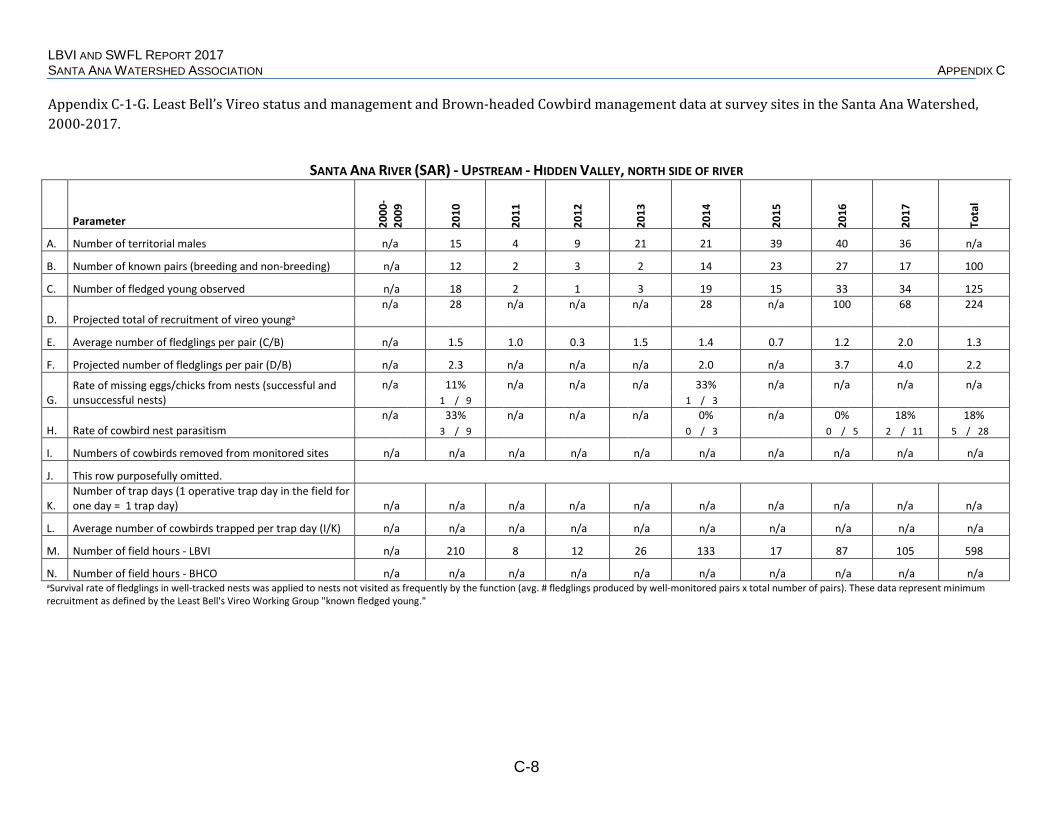
LBVI AND SWFL REPORT 2017 SANTA ANA WATERSHED ASSOCIATION APPENDIX C
C-8
Appendix C-1-G. Least Bell’s Vireo status and management and Brown-headed Cowbird management data at survey sites in the Santa Ana Watershed, 2000-2017.
SANTA ANA RIVER (SAR) - UPSTREAM - HIDDEN VALLEY, NORTH SIDE OF RIVER
Parameter 2000
-20
09
2010
2011
2012
2013
2014
2015
2016
2017
Tota
l
A. Number of territorial males n/a 15 4 9 21 21 39 40 36 n/a
B. Number of known pairs (breeding and non-breeding) n/a 12 2 3 2 14 23 27 17 100
C. Number of fledged young observed n/a 18 2 1 3 19 15 33 34 125
D. Projected total of recruitment of vireo younga n/a 28 n/a n/a n/a 28 n/a 100 68 224
E. Average number of fledglings per pair (C/B) n/a 1.5 1.0 0.3 1.5 1.4 0.7 1.2 2.0 1.3
F. Projected number of fledglings per pair (D/B) n/a 2.3 n/a n/a n/a 2.0 n/a 3.7 4.0 2.2
G. Rate of missing eggs/chicks from nests (successful and unsuccessful nests)
n/a 11% n/a n/a n/a 33% n/a n/a n/a n/a 1 / 9 1 / 3
H. Rate of cowbird nest parasitism n/a 33% n/a n/a n/a 0% n/a 0% 18% 18% 3 / 9 0 / 3 0 / 5 2 / 11 5 / 28
I. Numbers of cowbirds removed from monitored sites n/a n/a n/a n/a n/a n/a n/a n/a n/a n/a
J. This row purposefully omitted.
K. Number of trap days (1 operative trap day in the field for one day = 1 trap day) n/a n/a n/a n/a n/a n/a n/a n/a n/a n/a
L. Average number of cowbirds trapped per trap day (I/K) n/a n/a n/a n/a n/a n/a n/a n/a n/a n/a
M. Number of field hours - LBVI n/a 210 8 12 26 133 17 87 105 598
N. Number of field hours - BHCO n/a n/a n/a n/a n/a n/a n/a n/a n/a n/a aSurvival rate of fledglings in well-tracked nests was applied to nests not visited as frequently by the function (avg. # fledglings produced by well-monitored pairs x total number of pairs). These data represent minimum recruitment as defined by the Least Bell's Vireo Working Group "known fledged young."

LBVI AND SWFL REPORT 2017 SANTA ANA WATERSHED ASSOCIATION APPENDIX C
C-9
Appendix C-1-H. Least Bell’s Vireo status and management and Brown-headed Cowbird management data at survey sites in the Santa Ana Watershed, 2000-2017.
SANTA ANA RIVER (SAR) - UPSTREAM - HIDDEN VALLEY, SOUTH SIDE OF RIVER*
Parameter 2000
-20
09
2010
2011
2012
2013
2014
2015
2016
2017
Tota
l
A. Number of territorial males n/a 60 55 62 75 85 104 121 123 n/a
B. Number of known pairs (breeding and non-breeding) 230 43 36 37 42 32 27 66 67 580
C. Number of fledged young observed 407 53 41 45 66 28 22 97 87 846
D. Projected total of recruitment of vireo younga 512 90 122 104 109 n/a n/a 198 322 1,457
(n = 10yrs)
E. Average number of fledglings per pair (C/B) 1.8 1.2 1.1 1.2 1.6 0.9 0.8 1.5 1.3 1.5
F. Projected number of fledglings per pair (D/B) 2.4 2.1 3.4 2.8 2.6 n/a n/a 3.0 4.8 2.5
G. Rate of missing eggs/chicks from nests (successful and unsuccessful nests)
36% 65% 30% 50% 25% 67% n/a n/a n/a n/a 31 / 85 11 / 17 3 / 10 4 / 8 2 / 8 2 / 3
H. Rate of cowbird nest parasitism 7% 6% 20% 0% 0% 0% n/a 0% 0% 5%
6 / 85 1 / 17 2 / 10 0 / 8 0 / 8 0 / 3 0 / 16 0 / 18 9 / 165
I. Numbers of cowbirds removed from monitored sites 637 24 12 24 8 3 n/a n/a n/a 7081
J. This row purposefully omitted.
K. Number of trap days (1 operative trap day in the field for one day = 1 trap day) 4,298 252 257 348 362 252 n/a n/a n/a 5,7691
L. Average number of cowbirds trapped per trap day (I/K) 0.15 0.10 0.05 0.07 0.02 0.01 n/a n/a n/a 0.12
M. Number of field hours - LBVI 4,157
330 193 261 305 225 133 234 189 6,816
N. Number of field hours - BHCO 196 228 129 136 100 n/a n/a n/a aSurvival rate of fledglings in well-tracked nests was applied to nests not visited as frequently by the function (avg. # fledglings produced by well-tracked pairs x total number of pairs). These data represent minimum recruitment as defined by the Least Bell's Vireo Working Group "known fledged young." 1All traps are not accounted for in this total.
*As of 2010, reported as south side of the river.

LBVI AND SWFL REPORT 2017 SANTA ANA WATERSHED ASSOCIATION APPENDIX C
C-10
Appendix C-1-I. Least Bell’s Vireo status and management and Brown-headed Cowbird management data at survey sites in the Santa Ana Watershed, 2000-2017.
SANTA ANA RIVER (SAR) - UPSTREAM - GOOSE CREEK, NORCO TO I-15
Parameter 2000
-20
09
2010
2011
2012
2013
2014
2015
*
2016
**
2017
Tota
l
A. Number of territorial males n/a 101 105 95 108 110 71 63 73 n/a
B. Number of known pairs (breeding and non-breeding) 233 64 59 51 52 32 36 31 34 592
C. Number of fledged young observed 489 113 91 86 109 36 63 45 54 1,086
D. Projected total of recruitment of vireo younga 696 211 177 184 177 n/a 90 71 99 1,705
(n = 9yrs)
E. Average number of fledglings per pair (C/B) 2.1 1.8 1.5 1.7 2.1 1.1 1.8 1.5 1.6 1.8
F. Projected number of fledglings per pair (D/B) 2.7 3.3 3.0 3.6 3.4 n/a 2.5 2.3 2.9 2.9
G. Rate of missing eggs/chicks from nests (successful and unsuccessful nests)
41% 28% 45% 0% 28% 56% n/a n/a n/a n/a 73 / 177 5 / 18 10 / 22 0 / 17 8 / 29 5 / 9
H. Rate of cowbird nest parasitism 9% 0% 0% 0% 7% 0% 0% 0% 0% 5%
14 / 177 0 / 18 0 / 22 0 / 17 2 / 29 0 / 9 0 / 13 0 / 22 0 / 19 16 / 326
I. Numbers of cowbirds removed from monitored sites 382 49 35 34 23 4 29 12 7 5751
J. This row purposefully omitted.
K. Number of trap days (1 operative trap day in the field for one day = 1 trap day) 1,102 269 228 230 270 218 226 136 129 2,8081
L. Average number of cowbirds trapped per trap day (I/K) 0.35 0.18 0.15 0.15 0.09 0.02 0.13 0.09 0.05 0.20
M. Number of field hours - LBVI 2,337 183 197 232 256 204 352 234 270 4,265
N. Number of field hours - BHCO 624 252 n/a 230 135 100 118 n/a n/a n/a aSurvival rate of fledglings in well-tracked nests was applied to nests not visited as frequently by the function (avg. # fledglings produced by well-tracked pairs x total number of pairs). These data represent minimum recruitment as defined by the Least Bell's Vireo Working Group "known fledged young." 1All traps are not accounted for in this total.
*Starting in 2015 Goose Creek Golf Club to I-15 only. Formerly monitored as Goose Creek Golf Club to River Rd. **Includes Goose Creek mitigation funded by IERCD

LBVI AND SWFL REPORT 2017 SANTA ANA WATERSHED ASSOCIATION APPENDIX C
C-11
Appendix C-1-J. Least Bell’s Vireo status and management and Brown-headed Cowbird management data at survey sites in the Santa Ana Watershed, 2000-2017.
NORCO BLUFFS (I-15 TO RIVER RD., NON-MITIGATION)*
Parameter 2000
-20
09
2010
2011
2012
2013
2014
2015
2016
2017
Tota
l
A. Number of territorial males n/a n/a n/a n/a n/a n/a 30 63 69 n/a
B. Number of known pairs (breeding and non-breeding) n/a n/a n/a n/a n/a n/a 17 28 31 76
C. Number of fledged young observed n/a n/a n/a n/a n/a n/a 43 45 76 164
D. Projected total of recruitment of vireo younga n/a n/a n/a n/a n/a n/a 63 84 109 256
E. Average number of fledglings per pair (C/B) n/a n/a n/a n/a n/a n/a 2.5 1.6 2.5 2.2
F. Projected number of fledglings per pair (D/B) n/a n/a n/a n/a n/a n/a 3.7 3.0 3.5 3.4
G. Rate of missing eggs/chicks from nests (successful and unsuccessful nests)
n/a n/a n/a n/a n/a n/a n/a n/a n/a n/a
H. Rate of cowbird nest parasitism n/a n/a n/a n/a n/a n/a 0% 0% 0% 0%
0 / 13 0 / 12 0 / 22 0 / 47
I. Numbers of cowbirds removed from monitored sites n/a n/a n/a n/a n/a n/a n/a n/a n/a n/a
J. This row purposefully omitted.
K. Number of trap days (1 operative trap day in the field for one day = 1 trap day) n/a n/a n/a n/a n/a n/a n/a n/a n/a n/a
L. Average number of cowbirds trapped per trap day (I/K) n/a n/a n/a n/a n/a n/a n/a n/a n/a n/a
M. Number of field hours - LBVI n/a n/a n/a n/a n/a n/a 124 180 190 494
N. Number of field hours - BHCO n/a n/a n/a n/a n/a n/a n/a n/a n/a n/a aSurvival rate of fledglings in well-tracked nests was applied to nests not visited as frequently by the function (avg. # fledglings produced by well-tracked pairs x total number of pairs). These data represent minimum recruitment as defined by the Least Bell's Vireo Working Group "known fledged young."
*Prior to 2015, monitored as part of Goose Creek Golf Club to River Rd.

LBVI AND SWFL REPORT 2017 SANTA ANA WATERSHED ASSOCIATION APPENDIX C
C-12
Appendix C-1-K. Least Bell’s Vireo status and management and Brown-headed Cowbird management data at survey sites in the Santa Ana Watershed, 2000-2017.
TEMESCAL CANYON
Parameter 2000
-20
09
2010
2011
2012
2013
2014
2015
2016
2017
Tota
l
A. Number of territorial males n/a 83 102 109 131 126 123 93 109 n/a
B. Number of known pairs (breeding and non-breeding) 164 49 65 63 50 24 21 9 59 504
C. Number of fledged young observed 339 73 113 71 48 17 22 5 48 736
D. Projected total of recruitment of vireo younga 448 152 189 189 n/a n/a n/a n/a 177 1,155
(n = 8yrs)
E. Average number of fledglings per pair (C/B) 2.1 1.5 1.7 1.1 1.0 0.7 1.0 0.6 0.8 1.5
F. Projected number of fledglings per pair (D/B) 2.7 3.1 2.9 3.0 n/a n/a n/a n/a 3.0 2.3
G. Rate of missing eggs/chicks from nests (successful and unsuccessful nests)
39% 20% 34% 0% n/a n/a n/a n/a n/a n/a
52 / 133 3 / 15 11 / 32 0 / 12
H. Rate of cowbird nest parasitism
20% 0% 3% 25% n/a n/a n/a n/a 19% 16%
27 / 133 0 / 15 1 / 32 3 / 12 3 / 16 34 / 208
I. Numbers of cowbirds removed from monitored sites 1,350 134 204 566 380 194 435 297 240 3,8001
J. This row purposefully omitted.
K. Number of trap days (1 operative trap day in the field for one day = 1 trap day) 5,812 1,191 1,245 851 1,246 1,077 93 644 652 12,8111
L. Average number of cowbirds trapped per trap day (I/K) 0.23 0.11 0.16 0.67 0.30 0.18 4.68 0.46 0.37 0.30
M. Number of field hours - LBVI 5,690
335 557 531 420 90 96 146 263 11,727
N. Number of field hours - BHCO 467 685 377 544 550 n/a 485 491 aSurvival rate of fledglings in well-tracked nests was applied to nests not visited as frequently by the function (avg. # fledglings produced by well-tracked pairs x total number of pairs). These data represent minimum recruitment as defined by the Least Bell's Vireo Working Group "known fledged young." 1All traps are not accounted for in this total.

LBVI AND SWFL REPORT 2017 SANTA ANA WATERSHED ASSOCIATION APPENDIX C
C-13
Appendix C-1-L. Least Bell’s Vireo status and management and Brown-headed Cowbird management data at survey sites in the Santa Ana Watershed, 2000-2017.
CHINO HILLS
Parameter 2000
-20
09
2010
2011
2012
2013
2014
2015
2016
*
2017
Tota
l
A. Number of territorial males n/a 11 8 8 13 10 24 18 25 n/a
B. Number of known pairs (breeding and non-breeding) 45 7 3 2 5 2 6 11 7 88
C. Number of fledged young observed 54 7 1 1 7 3 4 10 3 90
D. Projected total of recruitment of vireo younga 53 12 n/a n/a 20 n/a 8 n/a n/a 93
(n = 4yrs)
E. Average number of fledglings per pair (C/B) 1.2 1.0 0.3 0.5 1.4 1.5 0.7 0.9 0.4 1.0
F. Projected number of fledglings per pair (D/B) 1.8 1.7 n/a n/a 4.0 n/a 1.3 n/a n/a 1.1
G. Rate of missing eggs/chicks from nests (successful and unsuccessful nests)
63% 67% n/a 100% n/a n/a n/a n/a n/a n/a 12 / 19 2 / 3 1 / 1
H. Rate of cowbird nest parasitism 32% 0% n/a 0% n/a n/a 20% 0% n/a 23%
6 / 19 0 / 3 0 / 1 1 / 5 0 / 2 7 / 30
I. Numbers of cowbirds removed from monitored sites 11 16 16 6 12 4 76 53 22 2161
J. This row purposefully omitted.
K. Number of trap days (1 operative trap day in the field for one day = 1 trap day) 214 129 115 124 132 119 219 262 113 1,4271
L. Average number of cowbirds trapped per trap day (I/K) 0.05 0.12 0.14 0.05 0.09 0.03 0.35 0.20 0.19 0.15
M. Number of field hours - LBVI 388 59 54 44 36 24 60 83 31 779
N. Number of field hours - BHCO 179 129 115 124 83 75 95 128 n/a 928 aSurvival rate of fledglings in well-tracked nests was applied to nests not visited as frequently by the function (avg. # fledglings produced by well-tracked pairs x total number of pairs). These data represent minimum recruitment as defined by the Least Bell's Vireo Working Group "known fledged young." 1All traps are not accounted for in this total.
*Beginning 2016, includes former assessment sites

LBVI AND SWFL REPORT 2017 SANTA ANA WATERSHED ASSOCIATION APPENDIX C
C-14
Appendix C-1-M. Least Bell’s Vireo status and management and Brown-headed Cowbird management data at survey sites in the Santa Ana Watershed, 2000-2017.
SANTA ANA CANYON (SAC) - UPPER CANYON
Parameter 2000
-20
09
2010
2011
2012
2013
2014
2015
2016
2017
Tota
l
A. Number of territorial males n/a 11 14 10 28 27 25 26 30 n/a
B. Number of known pairs (breeding and non-breeding) 126 4 5 4 14 18 9 12 21 213
C. Number of fledged young observed 208 6 5 6 23 28 10 18 32 336
D. Projected total of recruitment of vireo younga 309 n/a n/a 12 42 54 18 28 42 505
(n = 8yrs)
E. Average number of fledglings per pair (C/B) 1.7 1.5 1.0 1.5 1.6 1.6 1.1 1.5 1.5 1.6
F. Projected number of fledglings per pair (D/B) 2.7 n/a n/a 3.0 3.0 3.0 2.0 2.3 2.0 2.4
G. Rate of missing eggs/chicks from nests (successful and unsuccessful nests)
41% 0% n/a 0% 40% 33% n/a n/a n/a n/a 26 / 64 0 / 1 0 / 1 2 / 5 2 / 6
H. Rate of cowbird nest parasitism 6% 0% n/a 0% 0% 0% 0% 0% 0% 5%
4 / 64 0 / 1 0 / 1 0 / 5 0 / 6 0 / 1 0 / 3 0 / 6 4 / 87
I. Numbers of cowbirds removed from monitored sites 301 165 48 62 32 56 14 28 1 7071
J. This row purposefully omitted.
K. Number of trap days (1 operative trap day in the field for one day = 1 trap day) 2,112 286 238 105 133 137 129 134 47 3,3211
L. Average number of cowbirds trapped per trap day (I/K) 0.14 0.58 0.20 0.59 0.24 0.41 0.11 0.21 0.02 0.21
M. Number of field hours - LBVI 6,793
324 350 325 396 365 408 386 573 13,301
N. Number of field hours - BHCO 425 608 432 377 339 479 425 296 aSurvival rate of fledglings in well-tracked nests was applied to nests not visited as frequently by the function (avg. # fledglings produced by well-tracked pairs x total number of pairs). These data represent minimum recruitment as defined by the Least Bell's Vireo Working Group "known fledged young." 1All traps are not accounted for in this total.

LBVI AND SWFL REPORT 2017 SANTA ANA WATERSHED ASSOCIATION APPENDIX C
C-15
Appendix C-1-N. Least Bell’s Vireo status and management and Brown-headed Cowbird management data at survey sites in the Santa Ana Watershed, 2000-2017.
SANTA ANA CANYON (SAC) - GREEN RIVER GOLF CLUB
Parameter 2000
-20
09
2010
2011
2012
2013
2014
2015
2016
2017
Tota
l
A. Number of territorial males n/a 24 26 19 22 26 31 33 42 n/a
B. Number of known pairs (breeding and non-breeding) 101 17 14 11 19 19 23 26 33 263
C. Number of fledged young observed 192 19 19 11 19 29 35 27 76 427
D. Projected total of recruitment of vireo younga 279 31 29 25 n/a 44 37 29 145 619
(n = 9yrs)
E. Average number of fledglings per pair (C/B) 1.9 1.1 1.4 1.0 1.0 1.5 1.5 1.0 2.3 1.6
F. Projected number of fledglings per pair (D/B) 2.8 1.8 2.1 2.3 n/a 2.3 1.6 1.1 4.4 2.4
G. Rate of missing eggs/chicks from nests (successful and unsuccessful nests)
26% 71% 55% 20% 50% 25% n/a n/a n/a n/a 16 / 61 5 / 7 6 / 11 1 / 5 2 / 4 2 / 8
H. Rate of cowbird nest parasitism 7% 0% 0% 0% 0% 0% 0% 0% 0% 3%
4 / 61 0 / 7 0 / 11 0 / 5 0 / 4 0 / 8 0 / 15 0 / 13 0 / 21 4 / 145
I. Numbers of cowbirds removed from monitored sites 802 58 26 37 34 15 32 36 27 1,0671
J. This row purposefully omitted.
K. Number of trap days (1 operative trap day in the field for one day = 1 trap day) 3,101 407 119 124 130 131 237 260 130 4,6391
L. Average number of cowbirds trapped per trap day (I/K) 0.26 0.14 0.22 0.30 0.26 0.11 0.14 0.14 0.21 0.23
M. Number of field hours - LBVI
*See Upper Canyon Summary Sheet for all Santa Ana Canyon hours N. Number of field hours - BHCO aSurvival rate of fledglings in well-tracked nests was applied to nests not visited as frequently by the function (avg. # fledglings produced by well-tracked pairs x total number of pairs). These data represent minimum recruitment as defined by the Least Bell's Vireo Working Group "known fledged young." 1All traps are not accounted for in this total.

LBVI AND SWFL REPORT 2017 SANTA ANA WATERSHED ASSOCIATION APPENDIX C
C-16
Appendix C-1-O. Least Bell’s Vireo status and management and Brown-headed Cowbird management data at survey sites in the Santa Ana Watershed, 2000-2017.
SANTA ANA CANYON (SAC) - FEATHERLY REGIONAL PARK
Parameter 2000
-20
09
2010
2011
2012
2013
2014
2015
2016
2017
Tota
l
A. Number of territorial males n/a 40 33 36 64 59 65 64 59 n/a
B. Number of known pairs (breeding and non-breeding) 131 23 19 16 45 39 38 39 36 386
C. Number of fledged young observed 175 22 23 12 55 35 37 23 57 439
D. Projected total of recruitment of vireo younga 307 46 38 n/a 77 43 49 39 126 725
(n = 7yrs)
E. Average number of fledglings per pair (C/B) 1.3 1.0 1.2 0.8 1.2 0.9 1.0 0.6 1.6 1.1
F. Projected number of fledglings per pair (D/B) 2.3 2.0 2.0 n/a 1.7 1.1 1.3 1.0 3.5 1.9
G. Rate of missing eggs/chicks from nests (successful and unsuccessful nests)
48% 71% 20% 100% 50% 64% n/a n/a n/a n/a 31 / 65 5 / 7 1 / 5 4 / 4 7 / 14 9 / 14
H. Rate of cowbird nest parasitism 8% 0% 0% 0% 0% 0% 0% 0% 0% 3%
5 / 65 0 / 7 0 / 5 0 / 4 0 / 14 0 / 14 0 / 19 0 / 14 0 / 24 5 / 166
I. Numbers of cowbirds removed from monitored sites 127 118 44 30 48 41 44 8 10 4701
J. This row purposefully omitted.
K. Number of trap days (1 operative trap day in the field for one day = 1 trap day) 1,591 514 335 244 258 241 495 398 383 4,4591
L. Average number of cowbirds trapped per trap day (I/K) 0.08 0.23 0.13 0.12 0.19 0.17 0.09 0.02 0.03 0.11
M. Number of field hours - LBVI
*See Upper Canyon Summary Sheet for all Santa Ana Canyon hours N. Number of field hours - BHCO aSurvival rate of fledglings in well-tracked nests was applied to nests not visited as frequently by the function (avg. # fledglings produced by well-tracked pairs x total number of pairs). These data represent minimum recruitment as defined by the Least Bell's Vireo Working Group "known fledged young." 1All traps are not accounted for in this total.

LBVI AND SWFL REPORT 2017 SANTA ANA WATERSHED ASSOCIATION APPENDIX C
C-17
Appendix C-1-P. Least Bell’s Vireo status and management and Brown-headed Cowbird management data at survey sites in the Santa Ana Watershed, 2000-2017.
SANTIAGO CANYON (IRVINE PARK)
Parameter 2000
-20
09
2010
2011
2012
2013
2014
2015
2016
2017
Tota
l
A. Number of territorial males n/a 24 26 29 29 27 24 17 14 n/a
B. Number of known pairs (breeding and non-breeding) n/a 14 9 5 8 9 1 1 1 48
C. Number of fledged young observed n/a 18 7 5 10 12 2 0 0 54
D. Projected total of recruitment of vireo younga n/a 52 18 n/a n/a 14 n/a n/a n/a 84
E. Average number of fledglings per pair (C/B) n/a 1.3 0.8 1.0 1.3 1.3 2.0 0.0 0.0 1.1
F. Projected number of fledglings per pair (D/B) n/a 3.7 2.0 n/a n/a 1.6 n/a n/a n/a 1.8
G. Rate of missing eggs/chicks from nests (successful and unsuccessful nests)
n/a 25% n/a n/a n/a 80% n/a n/a n/a n/a 1 / 4 4 / 5
H. Rate of cowbird nest parasitism n/a 0% n/a n/a n/a 0% n/a n/a n/a 0%
0 / 4 0 / 6 0 / 10
I. Numbers of cowbirds removed from monitored sites n/a n/a n/a n/a n/a n/a n/a n/a n/a n/a
J. This row purposefully omitted.
K. Number of trap days (1 operative trap day in the field for one day = 1 trap day) n/a n/a n/a n/a n/a n/a n/a n/a n/a n/a
L. Average number of cowbirds trapped per trap day (I/K) n/a n/a n/a n/a n/a n/a n/a n/a n/a n/a
M. Number of field hours - LBVI n/a 25 21 9.5 n/a 89 n/a 7 8 159
N. Number of field hours - BHCO n/a n/a n/a n/a n/a n/a n/a n/a n/a n/a aSurvival rate of fledglings in well-tracked nests was applied to nests not visited as frequently by the function (avg. # fledglings produced by well-tracked pairs x total number of pairs). These data represent minimum recruitment as defined by the Least Bell's Vireo Working Group "known fledged young."

LBVI AND SWFL REPORT 2017 SANTA ANA WATERSHED ASSOCIATION APPENDIX C
C-18
Appendix C-2-A. Least Bell’s Vireo nest placement preferences at survey sites in the Santa Ana Watershed, 2000-2017.
SAN JACINTO
Host Plant Species (listed in taxonomic order) 20
00-2
009
2010
2011
2012
2013
2014
2015
2016
2017
Tota
l
Perc
enta
ge
of T
otal
Narrowleaf Willow (Salix exigua) 26 2 8 10 9 1 5 61 47%
Dead Narrowleaf Willow (Salix exigua) 1 1 1%
Goodding's Black Willow (Salix gooddingii) 5 4 3 12 9%
Red Willow (Salix laevigata) 2 1 3 2%
Black Mustardie
(Brassica nigra) 1 1 1%
Tamariskie (Tamarix ramosissima) 1 1 2 2%
Coyote Brush (Baccharis pilularis) 1 3 2 6 5%
Mulefat (Baccharis salicifolia) 26 4 1 3 1 1 36 28%
Arrowweed (Pluchea sericea) 1 1 1%
Unknown/No data 3 1 3 7 5%
Total 59 7 9 13 13 2 0 11 16 130 100% i = invasive e = non-native r = endangered, threatened, or sensitive

LBVI AND SWFL REPORT 2017 SANTA ANA WATERSHED ASSOCIATION APPENDIX C
C-19
Appendix C-2-B. Least Bell’s Vireo nest placement preferences at survey sites in the Santa Ana Watershed, 2000-2017.
SAN TIMOTEO CANYON
Host Plant Species (listed in taxonomic order) 20
00-2
009
2010
2011
2012
2013
2014
2015
2016
2017
Tota
l
Perc
enta
ge
of T
otal
Western Sycamore (Platanus racemosa) 1 1 <1%
Golden Currant (Ribes aureum) 1 2 1 1 5 <1%
Desert Wild Grape (Vitis girdiana) 10 5 10 1 2 18 10 8 13 77 8%
Fremont Cottonwood (Populus fremontii) 16 1 4 3 5 8 3 3 43 4%
Dead Fremont Cottonwood (Populus fremontii) 1 1 <1%
Narrowleaf Willow (Salix exigua) 13 1 2 4 2 1 6 29 3%
Goodding's Black Willow (Salix gooddingii) 52 4 1 1 4 2 5 4 3 76 7%
Red Willow (Salix laevigata) 64 8 13 6 17 6 20 16 14 164 16%
Arroyo Willow (Salix lasiolepis) 76 4 17 17 16 20 24 22 33 229 22%
Pacific Willow (Salix lasiandra) 3 2 2 1 1 3 12 1%
Willow sp. (Salix sp.) 1 1 <1%
Dead Willow sp. (Salix sp.) 1 1 <1%
Toyon (Heteromeles arbutifolia) 8 1 1 4 3 1 18 2%
White Mulberrye (Morus alba) 1 1 <1%

LBVI AND SWFL REPORT 2017 SANTA ANA WATERSHED ASSOCIATION APPENDIX C
C-20
Appendix C-2-B continued. Least Bell’s Vireo nest placement preferences at survey sites in the Santa Ana Watershed, 2000-2017.
SAN TIMOTEO CANYON
Host Plant Species (listed in taxonomic order) 20
00-2
009
2010
2011
2012
2013
2014
2015
2016
2017
Tota
l
Perc
enta
ge
of T
otal
Scrub Oak (Quercus berberidifolia) 1 1 <1%
Oak sp. (Quercus sp.) 1 1 <1%
California Wild Rose (Rubus californica) 1 1 <1%
Southern California Black Walnutr (Juglans californica) 1 1 2 <1%
Fragrant Sumac (Rhus aromatica) 1 1 <1%
Boxelder (Acer negundo) 1 1 2 <1%
Tree of Heavenie (Ailanthus altissima) 1 1 <1%
Black Mustardie
(Brassica nigra) 1 1 <1%
Mustard sp.ie (Brassica sp.) 3 1 4 <1%
Perennial Pepperweedie (Lepidium latifolium) 1 1 <1%
Tamariskie (Tamarix ramosissima) 1 1 2 <1%
Fourwing Saltbush (Atriplex canescens) 1 1 <1%
Douglas' Sagewort (Artemisia douglasiana) 14 1 1 1 1 1 19 2%
Mulefat (Baccharis salicifolia) 101 15 25 12 26 26 34 19 14 272 27%

LBVI AND SWFL REPORT 2017 SANTA ANA WATERSHED ASSOCIATION APPENDIX C
C-21
Appendix C-2-B continued. Least Bell’s Vireo nest placement preferences at survey sites in the Santa Ana Watershed, 2000-2017.
SAN TIMOTEO CANYON
Host Plant Species (listed in taxonomic order) 20
00-2
009
2010
2011
2012
2013
2014
2015
2016
2017
Tota
l
Perc
enta
ge
of T
otal
Willow Baccharis (Baccharis salicina) 1 1 <1%
Blue Elderberry (Sambucus nigra ssp. caerulea) 12 2 3 5 3 4 9 1 5 44 4%
Desert Wild Grape (V. girdiana) and Arroyo Willow (S. lasiolepis) 1 1 <1%
Arroyo Willow (S. lasiolepis) and Sweet Fenneli (Foeniculum vulgare) 1 1 <1%
Deadfall 1 1 2 <1%
Unknown/No data 2 2 <1%
Total 379 40 80 47 80 94 126 78 94 1,018 100% i = invasive e = non-native r = endangered, threatened, or sensitive

LBVI AND SWFL REPORT 2017 SANTA ANA WATERSHED ASSOCIATION APPENDIX C
C-22
Appendix C-2-C. Least Bell’s Vireo nest placement preferences at survey sites in the Santa Ana Watershed, 2000-2017.
MERIDIAN CONSERVATION AREA*
Host Plant Species (listed in taxonomic order) 20
00-2
009
2010
2011
2012
2013
2014
2015
2016
2017
Tota
l
Perc
enta
ge
of T
otal
Goodding's Black Willow (Salix gooddingii) 9 1 10 32%
Red Willow (Salix laevigata) 3 3 1 2 9 29%
Arroyo Willow (Salix lasiolepis) 5 1 2 1 9 29%
Dead Willow sp. (Salix sp.) 1 1 3%
Mulefat (Baccharis salicifolia) 1 1 2 6%
Total 17 6 0 0 0 3 0 0 5 31 100% i = invasive e = non-native r = endangered, threatened, or sensitive *Former March SKR Preserve

LBVI AND SWFL REPORT 2017 SANTA ANA WATERSHED ASSOCIATION APPENDIX C
C-23
Appendix C-2-D. Least Bell’s Vireo nest placement preferences at survey sites in the Santa Ana Watershed, 2000-2017.
SYCAMORE CANYON
Host Plant Species (listed in taxonomic order) 20
00-2
009
2010
2011
2012
2013
2014
2015
2016
2017
Tota
l
Perc
enta
ge
of T
otal
Fremont Cottonwood (Populus fremontii) 1 1 7%
Goodding's Black Willow (Salix gooddingii) 9 9 64%
Arroyo Willow (Salix lasiolepis) 1 1 7%
Blue Elderberry (Sambucus nigra ssp. caerulea) 1 2 3 21%
Total 10 0 0 0 0 4 0 0 0 14 100% i = invasive e = non-native r = endangered, threatened, or sensitive

LBVI AND SWFL REPORT 2017 SANTA ANA WATERSHED ASSOCIATION APPENDIX C
C-24
Appendix C-2-E. Least Bell’s Vireo nest placement preferences at survey sites in the Santa Ana Watershed, 2000-2017.
MOCKINGBIRD CANYON
Host Plant Species (listed in taxonomic order) 20
00-2
009
2010
2011
2012
2013
2014
2015
2016
2017
Tota
l
Perc
enta
ge
of T
otal
Western Sycamore (Platanus racemosa) 1 1 1%
Desert Wild Grape (Vitis girdiana) 6 1 7 4%
Fremont Cottonwood (Populus fremontii) 1 1 2 1%
Narrowleaf Willow (Salix exigua) 1 1 1%
Goodding's Black Willow (Salix gooddingii) 26 3 1 1 31 17%
Red Willow (Salix laevigata) 30 2 13 7 2 2 56 31%
Arroyo Willow (Salix lasiolepis) 2 6 3 4 1 16 9%
Willow sp. (Salix sp.) 1 1 1%
Dead Willow sp. (Salix sp.) 1 1 1%
Hollyleaf Cherry (Prunus ilicifolia) 1 1 1%
Southern California Black Walnutr (Juglans californica) 1 1 1%
Peruvian Pepper Treeie (Schinus molle) 2 1 1 4 2%
Perennial Pepperweedie (Lepidium latifolium) 3 1 4 2%
Dead Perennial Pepperweedie (Lepidium latifolium) 1 1 1%

LBVI AND SWFL REPORT 2017 SANTA ANA WATERSHED ASSOCIATION APPENDIX C
C-25
Appendix C-2-E continued. Least Bell’s Vireo nest placement preferences at survey sites in the Santa Ana Watershed, 2000-2017.
MOCKINGBIRD CANYON
Host Plant Species (listed in taxonomic order) 20
00-2
009
2010
2011
2012
2013
2014
2015
2016
2017
Tota
l
Perc
enta
ge
of T
otal
Fourwing Saltbush (Atriplex canescens) 1 1 1%
Mulefat (Baccharis salicifolia) 5 1 2 3 4 15 8%
Willow Baccharis (Baccharis salicina) 2 2 1%
Arrowweed (Pluchea sericea) 1 1 1%
Garden Celerye (Apium graveolens) 1 1 1%
Blue Elderberry (Sambucus nigra ssp. caerulea) 13 3 2 6 1 2 2 29 16%
Desert Wild Grape (V. girdiana) and Goodding's Black Willow (S. gooddingii) 1 1 1%
Goodding's Black Willow (S. gooddingii) and Perennial Pepperweedie (L. latifolium) 1 1 1%
Willow sp. (Salix sp.) and Perennial Pepperweedie (L. latifolium) 1 1 1%
Coyote Brush (B. pilularis) and Mulefat (B. salicifolia) 1 1 1%
Unknown/No data 2 2 1%
Total 98 3 31 19 20 3 5 3 0 182 100% i = invasive e = non-native r = endangered, threatened, or sensitive
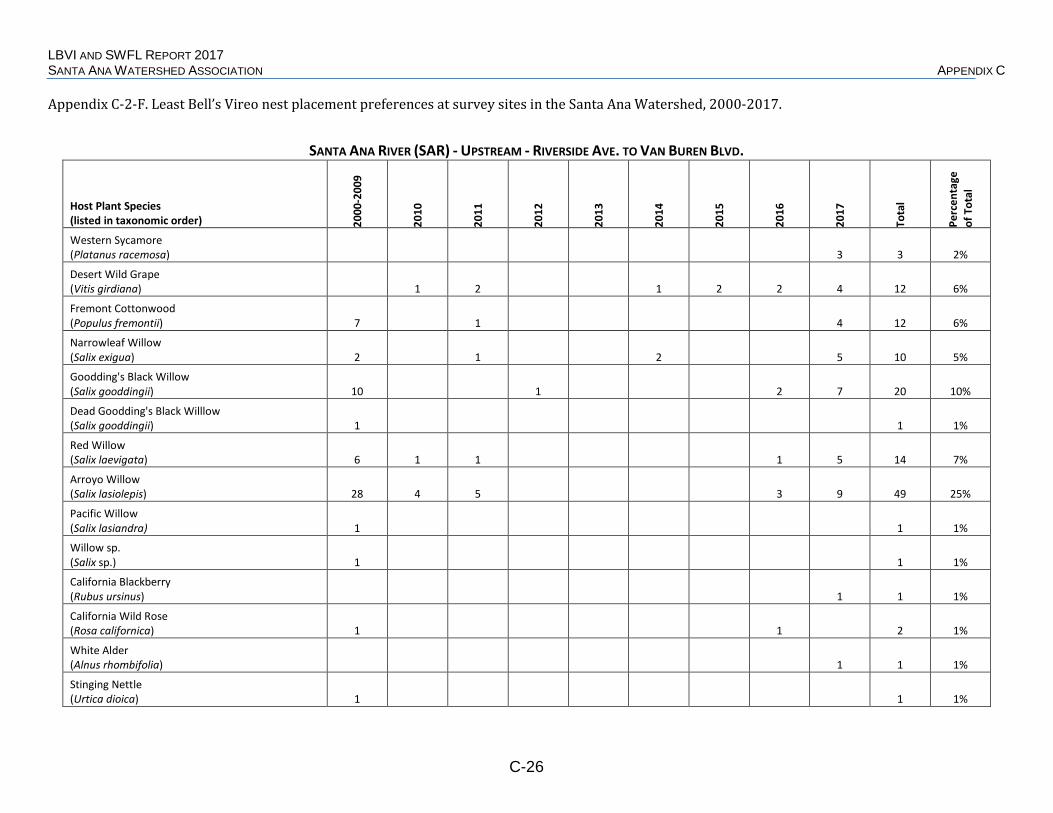
LBVI AND SWFL REPORT 2017 SANTA ANA WATERSHED ASSOCIATION APPENDIX C
C-26
Appendix C-2-F. Least Bell’s Vireo nest placement preferences at survey sites in the Santa Ana Watershed, 2000-2017.
SANTA ANA RIVER (SAR) - UPSTREAM - RIVERSIDE AVE. TO VAN BUREN BLVD.
Host Plant Species (listed in taxonomic order) 20
00-2
009
2010
2011
2012
2013
2014
2015
2016
2017
Tota
l
Perc
enta
ge
of T
otal
Western Sycamore (Platanus racemosa) 3 3 2%
Desert Wild Grape (Vitis girdiana) 1 2 1 2 2 4 12 6%
Fremont Cottonwood (Populus fremontii) 7 1 4 12 6%
Narrowleaf Willow (Salix exigua) 2 1 2 5 10 5%
Goodding's Black Willow (Salix gooddingii) 10 1 2 7 20 10%
Dead Goodding's Black Willlow (Salix gooddingii) 1 1 1%
Red Willow (Salix laevigata) 6 1 1 1 5 14 7%
Arroyo Willow (Salix lasiolepis) 28 4 5 3 9 49 25%
Pacific Willow (Salix lasiandra) 1 1 1%
Willow sp. (Salix sp.) 1 1 1%
California Blackberry (Rubus ursinus) 1 1 1%
California Wild Rose (Rosa californica) 1 1 2 1%
White Alder (Alnus rhombifolia) 1 1 1%
Stinging Nettle (Urtica dioica) 1 1 1%

LBVI AND SWFL REPORT 2017 SANTA ANA WATERSHED ASSOCIATION APPENDIX C
C-27
Appendix C-2-F continued. Least Bell’s Vireo nest placement preferences at survey sites in the Santa Ana Watershed, 2000-2017.
SANTA ANA RIVER (SAR) - UPSTREAM - RIVERSIDE AVE. TO VAN BUREN BLVD.
Host Plant Species (listed in taxonomic order) 20
00-2
009
2010
2011
2012
2013
2014
2015
2016
2017
Tota
l
Perc
enta
ge
of T
otal
Scrub Oak (Quercus berberidifolia) 2 2 1%
Poison Oak (Toxicodendron diversilobum) 1 1 1%
Tamariskie (Tamarix ramosissima) 1 1 2 1%
Tree Tobaccoie (Nicotiana glauca) 1 1 1%
Mulefat (Baccharis salicifolia) 26 7 1 1 2 5 16 58 29%
Blue Elderberry (Sambucus nigra ssp. caerulea) 3 1 1 2 7 4%
Dead Goodding's Black Willow (S. gooddingii) and Stinging Nettle (U. dioica) 1 1 1%
Total 91 13 13 2 0 5 2 16 58 200 100% i = invasive e = non-native r = endangered, threatened, or sensitive

LBVI AND SWFL REPORT 2017 SANTA ANA WATERSHED ASSOCIATION APPENDIX C
C-28
Appendix C-2-G. Least Bell’s Vireo nest placement preferences at survey sites in the Santa Ana Watershed, 2000-2017.
SANTA ANA RIVER (SAR) - UPSTREAM - HIDDEN VALLEY, NORTH SIDE OF RIVER
Host Plant Species (listed in taxonomic order) 20
00-2
009
2010
2011
2012
2013
2014
2015
2016
2017
Tota
l
Perc
enta
ge
of T
otal
Desert Wild Grape (Vitis girdiana) 2 1 3 9%
Fremont Cottonwood (Populus fremontii) 1 3 4 13%
Narrowleaf Willow (Salix exigua) 1 1 3%
Red Willow (Salix laevigata) 2 1 3 9%
Arroyo Willow (Salix lasiolepis) 1 2 2 5 16%
California Blackberry (Rubus ursinus) 1 1 3%
Mulefat (Baccharis salicifolia) 4 2 2 4 12 38%
Blue Elderberry (Sambucus nigra ssp. caerulea) 2 1 3 9%
Total 0 10 2 0 0 4 0 5 11 32 100% i = invasive e = non-native r = endangered, threatened, or sensitive

LBVI AND SWFL REPORT 2017 SANTA ANA WATERSHED ASSOCIATION APPENDIX C
C-29
Appendix C-2-H. Least Bell’s Vireo nest placement preferences at survey sites in the Santa Ana Watershed, 2000-2017.
SANTA ANA RIVER (SAR) - UPSTREAM - HIDDEN VALLEY, SOUTH SIDE OF RIVER*
Host Plant Species (listed in taxonomic order) 20
00-2
009
2010
2011
2012
2013
2014
2015
2016
2017
Tota
l
Perc
enta
ge
of T
otal
Desert Wild Grape (Vitis girdiana) 6 2 2 1 1 12 6%
Fremont Cottonwood (Populus fremontii) 1 1 1%
Narrowleaf Willow (Salix exigua) 1 1 1 1 4 2%
Goodding's Black Willow (Salix gooddingii) 15 1 2 1 2 21 11%
Red Willow (Salix laevigata) 4 1 2 2 1 3 5 18 9%
Arroyo Willow (Salix lasiolepis) 43 6 2 1 2 2 2 4 62 31%
Pacific Willow (Salix lasiandra) 1 1 1%
Willow sp. (Salix sp.) 2 2 1%
California Wild Rose (Rosa californica) 1 1 1%
Poison Oak (Toxicodendron diversilobum) 1 1 1%
Coyote Brush (Baccharis pilularis) 1 1 1%
Mulefat (Baccharis salicifolia) 29 9 3 2 3 4 2 52 26%
Dead Mulefat (Baccharis salicifolia) 1 1 1%
Blue Elderberry (Sambucus nigra ssp. caerulea) 3 1 1 5 3%

LBVI AND SWFL REPORT 2017 SANTA ANA WATERSHED ASSOCIATION APPENDIX C
C-30
Appendix C-2-H continued. Least Bell’s Vireo nest placement preferences at survey sites in the Santa Ana Watershed, 2000-2017.
SANTA ANA RIVER (SAR) - UPSTREAM - HIDDEN VALLEY, SOUTH SIDE OF RIVER*
Host Plant Species (listed in taxonomic order) 20
00-2
009
2010
2011
2012
2013
2014
2015
2016
2017
Tota
l
Perc
enta
ge
of T
otal
Dead Blue Elderberry (Sambucus nigra ssp. caerulea) 1 1 1%
Desert Wild Grape (V. girdiana) and California Wild Rose (R. californica) 1 1 1%
Red Willow (S. laevigata) and Wild Cucumber (Marah macrocarpa) 1 1 1%
Red Willow (S. laevigata) and Unknown 1 1 1%
Willow sp. (Salix sp.) and California Blackberry (Rubus ursinus) 1 1 1%
Mulefat (B. salicifolia) and Poison Hemlockie (C. maculatum) 1 1 1%
Unknown/No data 2 6 1 9 5%
Total 109 17 11 7 10 4 0 21 18 197 100% i = invasive e = non-native r = endangered, threatened, or sensitive *As of 2010, reported as south side of the river

LBVI AND SWFL REPORT 2017 SANTA ANA WATERSHED ASSOCIATION APPENDIX C
C-31
Appendix C-2-I. Least Bell’s Vireo nest placement preferences at survey sites in the Santa Ana Watershed, 2000-2017.
SANTA ANA RIVER (SAR) - UPSTREAM - GOOSE CREEK, NORCO TO I-15
Host Plant Species (listed in taxonomic order) 20
00-2
009
2010
2011
2012
2013
2014
2015
2016
2017
Tota
l
Perc
enta
ge
of T
otal
Desert Wild Grape (Vitis girdiana) 9 1 5 4 1 20 5%
Fremont Cottonwood (Populus fremontii) 11 1 1 1 1 15 4%
Dead Fremont Cottonwood (Populus fremontii) 1 1 <1%
Narrowleaf Willow (Salix exigua) 8 1 1 1 1 1 13 3%
Goodding's Black Willow (Salix gooddingii) 39 1 5 2 4 2 53 14%
Red Willow (Salix laevigata) 2 2 3 1 2 10 3%
Arroyo Willow (Salix lasiolepis) 70 5 5 9 11 1 9 6 116 31%
Dead Arroyo Willow (Salix lasiolepis) 1 1 <1%
Pacific Willow (Salix lasiandra) 1 1 <1%
Willow sp. (Salix sp.) 1 1 <1%
Dead Willow sp. (Salix sp.) 1 1 <1%
Southern California Black Walnutr (Juglans californica) 1 1 <1%
Ash sp. (Fraxinus sp.) 1 1 <1%
Mulefat (Baccharis salicifolia) 63 13 10 4 10 10 4 8 7 129 34%

LBVI AND SWFL REPORT 2017 SANTA ANA WATERSHED ASSOCIATION APPENDIX C
C-32
Appendix C-2-I continued. Least Bell’s Vireo nest placement preferences at survey sites in the Santa Ana Watershed, 2000-2017.
SANTA ANA RIVER (SAR) - UPSTREAM - GOOSE CREEK, NORCO TO I-15
Host Plant Species (listed in taxonomic order) 20
00-2
009
2010
2011
2012
2013
2014
2015
2016
2017
Tota
l
Perc
enta
ge
of T
otal
Dead Mulefat (Baccharis salicifolia) 2 2 4 1%
Poison Hemlockie (Conium maculatum) 4 4 1%
Blue Elderberry (Sambucus nigra ssp. caerulea) 2 1 1 4 1%
Goodding's Black Willow (S. gooddingii) and Poison Hemlockie (C. maculatum) 1 1 <1%
Unknown/No data 3 3 1%
Total 210 22 25 19 31 13 18 22 19 379 100% i = invasive e = non-native r = endangered, threatened, or sensitive *Starting in 2015 Goose Creek Golf Club to 1-15 only. Formerly monitored as Goose Creek Golf Club to River Rd. **Includes Goose Creek mitigation funded by IERCD
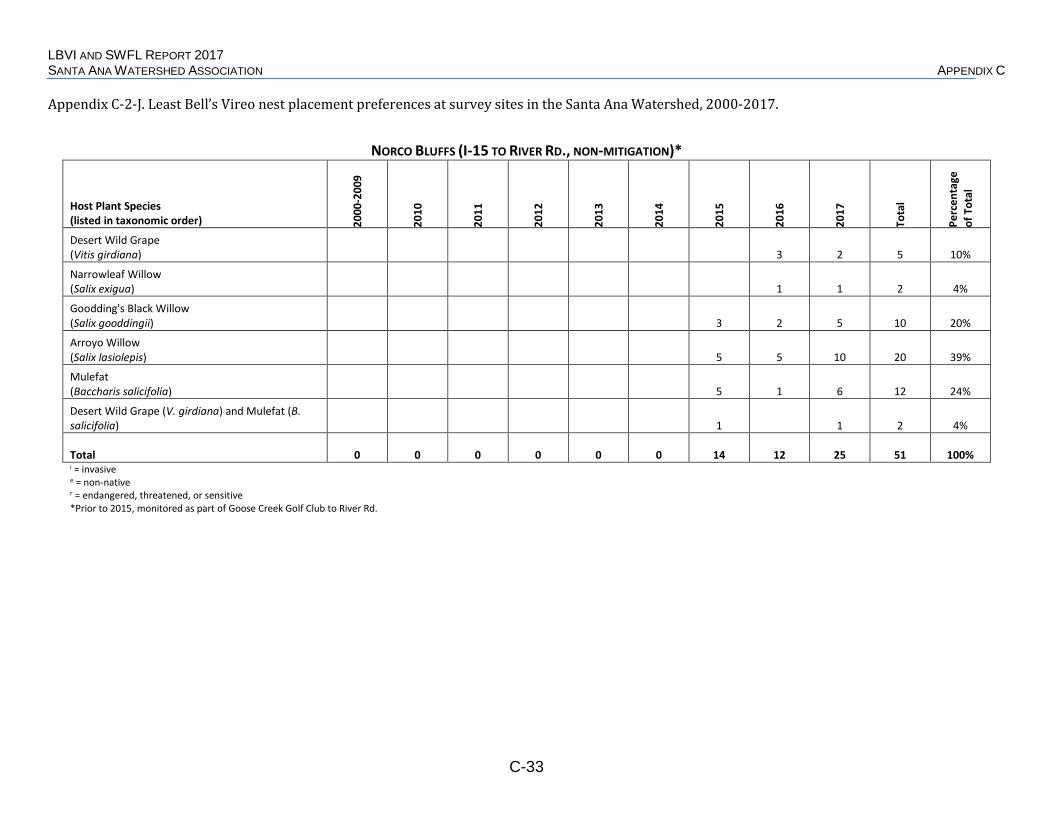
LBVI AND SWFL REPORT 2017 SANTA ANA WATERSHED ASSOCIATION APPENDIX C
C-33
Appendix C-2-J. Least Bell’s Vireo nest placement preferences at survey sites in the Santa Ana Watershed, 2000-2017.
NORCO BLUFFS (I-15 TO RIVER RD., NON-MITIGATION)*
Host Plant Species (listed in taxonomic order) 20
00-2
009
2010
2011
2012
2013
2014
2015
2016
2017
Tota
l
Perc
enta
ge
of T
otal
Desert Wild Grape (Vitis girdiana) 3 2 5 10%
Narrowleaf Willow (Salix exigua) 1 1 2 4%
Goodding's Black Willow (Salix gooddingii) 3 2 5 10 20%
Arroyo Willow (Salix lasiolepis) 5 5 10 20 39%
Mulefat (Baccharis salicifolia) 5 1 6 12 24%
Desert Wild Grape (V. girdiana) and Mulefat (B. salicifolia) 1 1 2 4%
Total 0 0 0 0 0 0 14 12 25 51 100% i = invasive e = non-native r = endangered, threatened, or sensitive *Prior to 2015, monitored as part of Goose Creek Golf Club to River Rd.

LBVI AND SWFL REPORT 2017 SANTA ANA WATERSHED ASSOCIATION APPENDIX C
C-34
Appendix C-2-K. Least Bell’s Vireo nest placement preferences at survey sites in the Santa Ana Watershed, 2000-2017.
TEMESCAL CANYON
Host Plant Species (listed in taxonomic order) 20
00-2
009
2010
2011
2012
2013
2014
2015
2016
2017
Tota
l
Perc
enta
ge
of T
otal
Western Sycamore (Platanus racemosa) 1 1 <1%
Fremont Cottonwood (Populus fremontii) 2 2 1 5 2%
Narrowleaf Willow (Salix exigua) 1 1 2 1%
Goodding's Black Willow (Salix gooddingii) 18 2 7 2 1 1 4 35 14%
Red Willow (Salix laevigata) 1 10 3 14 5%
Arroyo Willow (Salix lasiolepis) 61 7 2 1 1 5 77 30%
Pacific Willow (Salix lasiandra) 3 1 4 2%
Dead Willow sp. (Salix sp.) 1 1 <1%
Toyon (Heteromeles arbutifolia) 1 1 <1%
California Blackberry (Rubus ursinus) 1 1 <1%
Sugar Sumac (Rhus ovata) 1 1 2 1%
Poison Oak (Toxicodendron diversilobum) 1 1 <1%
Mustard sp.ie (Brassica sp.) 1 1 <1%
Perennial Pepperweedie (Lepidium latifolium) 1 1 <1%

LBVI AND SWFL REPORT 2017 SANTA ANA WATERSHED ASSOCIATION APPENDIX C
C-35
Appendix C-2-K continued. Least Bell’s Vireo nest placement preferences at survey sites in the Santa Ana Watershed, 2000-2017.
TEMESCAL CANYON
Host Plant Species (listed in taxonomic order) 20
00-2
009
2010
2011
2012
2013
2014
2015
2016
2017
Tota
l
Perc
enta
ge
of T
otal
Tamariskie (Tamarix ramosissima) 1 1 2 4 2%
Brittlebush (Encelia farinosa) 1 1 <1%
Douglas' Sagewort (Artemisia douglasiana) 1 1 <1%
Coyote Brush (Baccharis pilularis) 1 1 2 1%
Mulefat (Baccharis salicifolia) 65 6 7 2 1 5 86 33%
Dead Mulefat (Baccharis salicifolia) 3 3 1%
Sunflower (Helianthus annuus) 1 1 <1%
Arrowweed (Pluchea sericea) 1 1 2 1%
Blue Elderberry (Sambucus nigra ssp. caerulea) 1 3 3 1 8 3%
Red Willow (S. laevigata) and dead Stinging Nettle (U. dioica) 1 1 <1%
Deadfall 2 1 3 1%
Total 166 22 35 15 3 0 0 1 16 258 100% i = invasive e = non-native r = endangered, threatened, or sensitive

LBVI AND SWFL REPORT 2017 SANTA ANA WATERSHED ASSOCIATION APPENDIX C
C-36
Appendix C-2-L. Least Bell’s Vireo nest placement preferences at survey sites in the Santa Ana Watershed, 2000-2017.
CHINO HILLS
Host Plant Species (listed in taxonomic order) 20
00-2
009
2010
2011
2012
2013
2014
2015
2016
2017
Tota
l
Perc
enta
ge
of T
otal
Desert Wild Grape (Vitis girdiana) 1 1 3%
Goodding's Black Willow (Salix gooddingii) 9 5 1 15 38%
Red Willow (Salix laevigata) 3 2 1 1 7 18%
Arroyo Willow (Salix lasiolepis) 1 1 3%
Bank Catclawe (Acacia redolens) 1 1 3%
Toyon (Heteromeles arbutifolia) 1 1 3%
Chinese Elme (Ulmus parvifolia) 1 1 3%
Coast Live Oak (Quercus agrifolia) 1 1 3%
Scrub Oak (Quercus berberidifolia) 1 1 3%
Douglas' Sagewort (Artemisia douglasiana) 3 3 8%
Mulefat (Baccharis salicifolia) 4 1 1 6 15%
Blue Elderberry (Sambucus nigra ssp. caerulea) 2 2 5%
Total 24 3 0 1 1 0 7 4 0 40 100% i = invasive e = non-native r = endangered, threatened, or sensitive
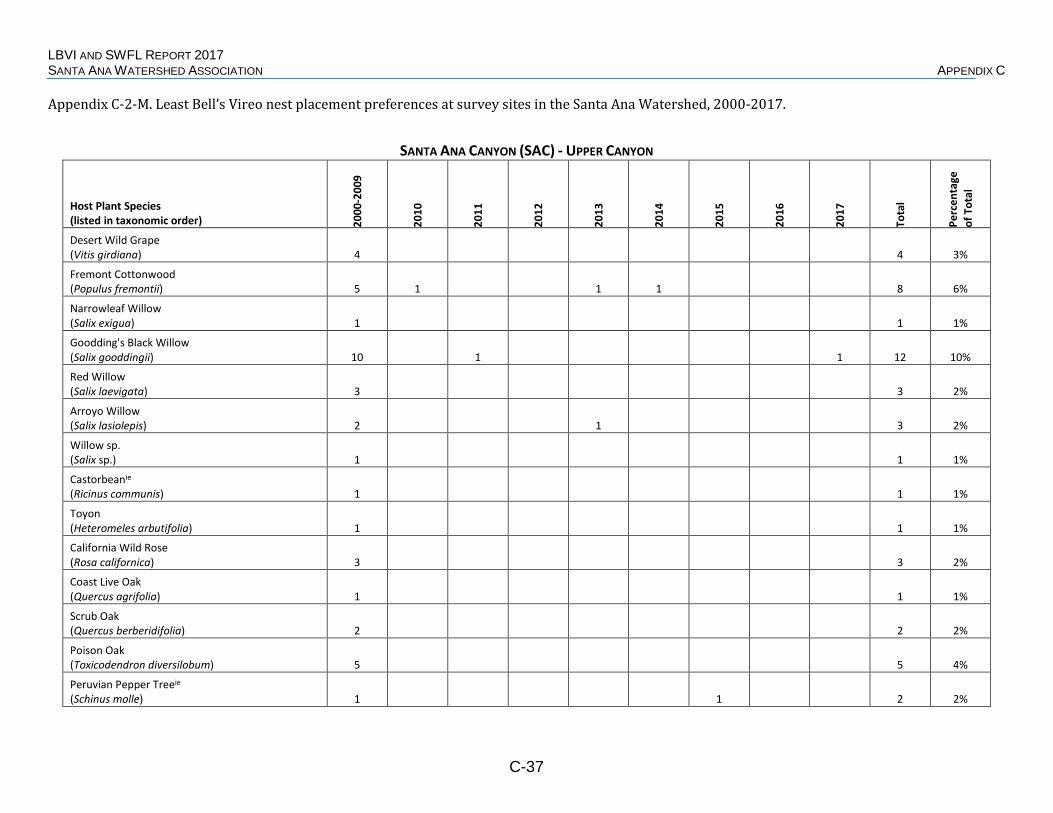
LBVI AND SWFL REPORT 2017 SANTA ANA WATERSHED ASSOCIATION APPENDIX C
C-37
Appendix C-2-M. Least Bell’s Vireo nest placement preferences at survey sites in the Santa Ana Watershed, 2000-2017.
SANTA ANA CANYON (SAC) - UPPER CANYON
Host Plant Species (listed in taxonomic order) 20
00-2
009
2010
2011
2012
2013
2014
2015
2016
2017
Tota
l
Perc
enta
ge
of T
otal
Desert Wild Grape (Vitis girdiana) 4 4 3%
Fremont Cottonwood (Populus fremontii) 5 1 1 1 8 6%
Narrowleaf Willow (Salix exigua) 1 1 1%
Goodding's Black Willow (Salix gooddingii) 10 1 1 12 10%
Red Willow (Salix laevigata) 3 3 2%
Arroyo Willow (Salix lasiolepis) 2 1 3 2%
Willow sp. (Salix sp.) 1 1 1%
Castorbeanie (Ricinus communis) 1 1 1%
Toyon (Heteromeles arbutifolia) 1 1 1%
California Wild Rose (Rosa californica) 3 3 2%
Coast Live Oak (Quercus agrifolia) 1 1 1%
Scrub Oak (Quercus berberidifolia) 2 2 2%
Poison Oak (Toxicodendron diversilobum) 5 5 4%
Peruvian Pepper Treeie (Schinus molle) 1 1 2 2%

LBVI AND SWFL REPORT 2017 SANTA ANA WATERSHED ASSOCIATION APPENDIX C
C-38
Appendix C-2-M continued. Least Bell’s Vireo nest placement preferences at survey sites in the Santa Ana Watershed, 2000-2017.
SANTA ANA CANYON (SAC) - UPPER CANYON
Host Plant Species (listed in taxonomic order) 20
00-2
009
2010
2011
2012
2013
2014
2015
2016
2017
Tota
l
Perc
enta
ge
of T
otal
Mustard sp.ie (Brassica sp.) 2 2 2%
Milk Thistleie (Silybum marianum) 1 1 1%
Coyote Brush (Baccharis pilularis) 1 1 1%
Mulefat (Baccharis salicifolia) 33 3 7 2 2 47 38%
Desertbroom Baccharis (Baccharis sarothroides) 1 1 1%
Rough Cockelburr (Xanthium strumarium) 1 1 1%
Poison Hemlockie (Conium maculatum) 2 2 2%
Blue Elderberry (Sambucus nigra ssp. caerulea) 14 1 1 1 1 1 1 20 16%
Desert Wild Grape (V. girdiana) and Mulefat (B. salicifolia) 1 1 1%
Goodding's Black Willow (S. gooddingii) and Poison Hemlockie (C. maculatum) 1 1 1%
Total 96 2 2 2 6 8 1 3 4 124 100% i = invasive e = non-native r = endangered, threatened, or sensitive

LBVI AND SWFL REPORT 2017 SANTA ANA WATERSHED ASSOCIATION APPENDIX C
C-39
Appendix C-2-N. Least Bell’s Vireo nest placement preferences at survey sites in the Santa Ana Watershed, 2000-2017.
SANTA ANA CANYON (SAC) - GREEN RIVER GOLF CLUB
Host Plant Species (listed in taxonomic order) 20
00-2
009
2010
2011
2012
2013
2014
2015
2016
2017
Tota
l
Perc
enta
ge
of T
otal
Giant Reedie (Arundo donax) 1 1 1%
Desert Wild Grape (Vitis girdiana) 1 1 1 1 4 2%
Fremont Cottonwood (Populus fremontii) 4 1 2 2 9 5%
Narrowleaf Willow (Salix exigua) 1 1 2 1%
Goodding's Black Willow (Salix gooddingii) 5 2 1 3 2 1 2 16 10%
Red Willow (Salix laevigata) 4 1 1 6 4%
Arroyo Willow (Salix lasiolepis) 2 2 1 1 6 4%
Toyon (Heteromeles arbutifolia) 1 1 2 1%
Southern California Black Walnutr (Juglans californica) 1 3 4 2%
Laurel Sumac (Malosma laurina) 3 2 2 7 4%
Poison Oak (Toxicodendron diversilobum) 1 1 1 2 5 3%
Peruvian Pepper Treeie (Schinus molle) 2 3 1 3 9 5%
Brazilian Pepper Treeie (Schinus terebinthifolius) 1 1 1%
Cape Leadworte (Plumbago auriculata) 1 1 2 1%

LBVI AND SWFL REPORT 2017 SANTA ANA WATERSHED ASSOCIATION APPENDIX C
C-40
Appendix C-2-N continued. Least Bell’s Vireo nest placement preferences at survey sites in the Santa Ana Watershed, 2000-2017.
SANTA ANA CANYON (SAC) - GREEN RIVER GOLF CLUB
Host Plant Species (listed in taxonomic order) 20
00-2
009
2010
2011
2012
2013
2014
2015
2016
2017
Tota
l
Perc
enta
ge
of T
otal
Privet sp.e (Ligustrum sp.) 1 1 1% Lollypop Treeie (Myoporum laetum) 1 1 1% California Sagebrush (Artemisia californica) 1 1 1% Douglas' Sagewort (Artemisia douglasiana) 1 1 1% Coyote Brush (Baccharis pilularis) 2 1 3 2% Mulefat (Baccharis salicifolia) 35 1 5 2 1 2 4 5 7 62 37% Poison Hemlockie (Conium maculatum) 2 2 1% Blue Elderberry (Sambucus nigra ssp. caerulea) 4 2 2 2 3 2 1 16 10% Yerba Santa sp. (Eriodictyon sp.) 1 1 1%
Desert Wild Grape (V. girdiana) and Peruvian Pepper Treeie (S. molle) 1 1 1%
Desert Wild Grape (V. girdiana) and Blue Elderberry (S. n. caerulea) 1 1 1%
Goodding's Black Willow (S. gooddingii) and Blue Elderberry (S. n. caerulea) 1 1 1%
Unknown/No data 1 1 1%
Total 72 7 13 7 5 10 16 14 22 166 100% i = invasive e = non-native r = endangered, threatened, or sensitive

LBVI AND SWFL REPORT 2017 SANTA ANA WATERSHED ASSOCIATION APPENDIX C
C-41
Appendix C-2-O. Least Bell’s Vireo nest placement preferences at survey sites in the Santa Ana Watershed, 2000-2017.
SANTA ANA CANYON (SAC) - FEATHERLY REGIONAL PARK
Host Plant Species (listed in taxonomic order) 20
00-2
009
2010
2011
2012
2013
2014
2015
2016
2017
Tota
l
Perc
enta
ge
of T
otal
Coulter's Matilija Poppyr (Romneya coulteri) 1 1
<1%
Western Sycamore (Platanus racemosa) 3 3 1%
Desert Wild Grape (Vitis girdiana) 1 1 <1%
Fremont Cottonwood (Populus fremontii) 4 3 4 4 2 1 5 1 24 11%
Black Cottonwood (Populus balsamifera ssp. trichocarpa) 1 1 1 3 1%
Narrowleaf Willow (Salix exigua) 4 1 1 6 3%
Goodding's Black Willow (Salix gooddingii) 13 1 2 3 1 1 1 22 10% Dead Goodding's Black Willow covered with living Goodding's Black Willow (Salix gooddingii) 1 1 <1%
Red Willow (Salix laevigata) 2 2 4 2%
Arroyo Willow (Salix lasiolepis) 3 1 1 1 2 8 4%
Willow sp. (Salix sp.) 1 1 <1%
Castorbeanie (Ricinus communis) 1 1 <1%
Toyon (Heteromeles arbutifolia) 1 1 <1%
Southern California Black Walnutr (Juglans californica) 4 3 1 1 9 4%

LBVI AND SWFL REPORT 2017 SANTA ANA WATERSHED ASSOCIATION APPENDIX C
C-42
Appendix C-2-O continued. Least Bell’s Vireo nest placement preferences at survey sites in the Santa Ana Watershed, 2000-2017.
SANTA ANA CANYON (SAC) - FEATHERLY REGIONAL PARK
Host Plant Species (listed in taxonomic order) 20
00-2
009
2010
2011
2012
2013
2014
2015
2016
2017
Tota
l
Perc
enta
ge
of T
otal
White Alder (Alnus rhombifolia) 1 1 <1%
Laurel Sumac (Malosma laurina) 3 3 2 1 4 13 6%
Poison Oak (Toxicodendron diversilobum) 1 4 1 2 1 2 11 5%
Orange Treee (Citrus sinensis) 1 1 1 3 1%
Black Mustardie
(Brassica nigra) 1 1 1 2 5 2%
Black Sage (Salvia mellifera) 1 1 <1%
Yellowspine Thistleie (Cirsium ochrocentrum) 2 2 1%
Mulefat (Baccharis salicifolia) 23 1 2 3 4 1 8 8 50 23%
Rough Cockelburr (Xanthium strumarium) 1 1 <1%
Poison Hemlockie (Conium maculatum) 2 1 3 1%
Blue Elderberry (Sambucus nigra ssp. caerulea) 11 3 2 2 2 5 4 2 31 14%
Fiddleneck sp. (Amsinckia sp.) 1 1 <1%
Thickleaf Yerba Santa (Eriodictyon crassifolium) 1 2 3 1%
Desert Wild Grape (V. girdiana) and Mulefat (B. salicifolia) 2 2 1%

LBVI AND SWFL REPORT 2017 SANTA ANA WATERSHED ASSOCIATION APPENDIX C
C-43
Appendix C-2-O continued. Least Bell’s Vireo nest placement preferences at survey sites in the Santa Ana Watershed, 2000-2017.
SANTA ANA CANYON (SAC) - FEATHERLY REGIONAL PARK
Host Plant Species (listed in taxonomic order) 20
00-2
009
2010
2011
2012
2013
2014
2015
2016
2017
Tota
l
Perc
enta
ge
of T
otal
Arroyo Willow (S. lasiolepis) and Black Mustardie (B. nigra) 1 1 <1%
Castorbeanie (R. communis) and Mulefat (B. salicifolia) 1 1 <1%
Unknown/No data 1 2 3 1%
Total 83 11 12 8 23 18 22 16 24 217 100% i = invasive e = non-native r = endangered, threatened, or sensitive

LBVI AND SWFL REPORT 2017 SANTA ANA WATERSHED ASSOCIATION APPENDIX C
C-44
Appendix C-2-P. Least Bell’s Vireo nest placement preferences at survey sites in the Santa Ana Watershed, 2000-2017.
SANTIAGO CANYON (IRVINE PARK)
Host Plant Species (listed in taxonomic order) 20
00-2
009
2010
2011
2012
2013
2014
2015
2016
2017
Tota
l
Perc
enta
ge
of T
otal
Desert Wild Grape (Vitis girdiana) 1 1 8%
Goodding's Black Willow (Salix gooddingii) 1 1 8%
Western False Indigo (Amorpha fruticosa) 1 1 8%
Mulefat (Baccharis salicifolia) 3 4 7 58%
Blue Elderberry (Sambucus nigra ssp. caerulea) 1 1 2 17%
Total 0 5 1 0 0 6 0 0 0 12 100% i = invasive e = non-native r = endangered, threatened, or sensitive

LBVI AND SWFL REPORT 2017 SANTA ANA WATERSHED ASSOCIATION APPENDIX C
C-45
Appendix C-3-A. Least Bell’s Vireo reproductive success and breeding biology data at survey sites in the Santa Ana Watershed, 2000-2017.
SAN JACINTO
Parameter 2000
-20
09
2010
2011
2012
2013
2014
2015
2016
2017
Tota
ls
A. Number of known pairs 43 18 25 36 29 19 7 17 27 221
B. Number of known breeding (nesting) pairs 39 15 20 22 28 15 7 10 25 181
C. Number of breeding pairs that were well-monitored throughout the breeding season 29 0 1 9 6 0 0 5 8 58
D. Number of 'known fledged young' OBSERVED 104 28 18 49 39 12 8 12 48 318
E. Number of known fledged young produced by pairs monitored throughout the breeding season 93 n/a 0 26 8 n/a n/a 6 22 155
F. Average number of fledglings produced per breeding pair (minimum; D/B = 'productivity or breeding success') 2.7 1.9 0.9 2.2 1.4 0.8 1.1 1.2 1.9 1.8
G. Average number of fledglings produced by well- monitored pairs (E/C = reproductive success) 3.2 n/a 0.0 2.9 1.3 n/a n/a 1.2 2.8 2.7
H. Number of nests that were discovered 59 7 14 13 17 2 0 11 17 140
I. Number of nests that were regularly monitored or 'tracked' 54 3 10 13 13 1 n/a 8 11 113
J. Number of 'tracked' nests that were successful (% = J/I x 100)
59% 100% 10% 69% 38% 0% n/a 25% 64% 52% 32/54 3/3 1/10 9/13 5/13 0/1 2/8 7/11 59/113
K. Rate of missing eggs/chicks from nests (includes successful and unsuccessful nests)
33% 0% 80% 31% 69% 0% n/a n/a n/a 41% 18/54 0/3 8/10 4/13 9/13 0/1 39/94
L. Number of 'tracked' nests that were parasitized by cowbirds (% = L/I x 100)
11% 0% 10% 8% 0% 100% n/a 75% 9% 14% 6/54 0/3 1/10 1/13 0/13 1/1 6/8 1/11 16/113
M.
A. Number of 'tracked' nests that failed as a result of reproductive failure
6%* 0% 0% 0% 8% 0% n/a 0% 9% 4% 3/54 0/3 0/10 0/13 1/13 0/1 0/8 1/11 5/113
B. Number of 'tracked' nests that failed as a result of parasitism
6-7% 0% 10% 0% 0% 0% n/a 13% 9% 5-6% 3-4/54 0/3 1/10 0/13 0/13 0/1 1/8 1/11 6-7/113
C. Number of 'tracked' nests that failed as a result of predation
28% 0% 80% 31% 54% 0% n/a 63% 18% 36% 15/54 0/3 8/10 4/13 7/13 0/1 5/8 2/11 41/113
D. Number of 'tracked' nests that failed for unknown reasons
0% 0% 0% 0% 0% 0% n/a 0% 0% 0% 0/54 0/3 0/10 0/13 0/13 0/1 0/8 0/11 0/113
N. Average clutch size n/a 3.3 3.7 3.3 3.5 3.0 n/a 4.0 3.8 n/a

LBVI AND SWFL REPORT 2017 SANTA ANA WATERSHED ASSOCIATION APPENDIX C
C-46
Appendix C-3-A continued. Least Bell’s Vireo reproductive success and breeding biology data at survey sites in the Santa Ana Watershed, 2000-2017.
SAN JACINTO
Parameter 2000
-20
09
2010
2011
2012
2013
2014
2015
2016
2017
Tota
ls
O. Number of cowbird eggs found in or near vireo nests 9 0 1 1 0 1 n/a 8 1 21
P. Number of cowbird nestlings removed from 'tracked' nests 0 0 0 0 0 0 n/a 0 0 0
Q. Number of cowbird young fledged by vireo 2 0 1 0 2 2 n/a 0 0 7
R. Number of 'manipulated' parasitized nests 5 0 0 1 0 0 n/a 6 0 12
S. Number of 'successful, manipulated' nests (% = S/R x 100) 40% n/a n/a 100% n/a n/a n/a 33% n/a 42% 2/5 1/1 2/6 5/12
T. Number of vireo fledged from 'manipulated' parasitized nests 4 n/a n/a 3 n/a n/a n/a 6 n/a 13
U. Number of repaired nests 2 0 0 1 0 0 n/a 0 0 3
V. % of successful repaired nests 100% n/a n/a 100% n/a n/a n/a n/a n/a 100% 2/2 1/1 3/3
W. Number of vireo fledged from repaired nests 6 n/a n/a 4 n/a n/a n/a n/a n/a 10 *corrected from Appendix D

LBVI AND SWFL REPORT 2017 SANTA ANA WATERSHED ASSOCIATION APPENDIX C
C-47
Appendix C-3-B. Least Bell’s Vireo reproductive success and breeding biology data at survey sites in the Santa Ana Watershed, 2000-2017.
SAN TIMOTEO CANYON
Parameter 2000
-20
09
2010
2011
2012
2013
2014
2015
2016
2017
Tota
ls
A. Number of known pairs 323 95 101 102 80 135 141 124 109 1,210
B. Number of known breeding (nesting) pairs 287 76 78 73 67 114 126 107 99 1,027
C. Number of breeding pairs that were well-monitored throughout the breeding season 183 24 31 32 35 48 56 39 48 496
D. Number of 'known fledged young' OBSERVED 635 137 196 153 179 206 287 222 272 2,287
E. Number of known fledged young produced by pairs monitored throughout the breeding season 497 67 104 90 127 121 181 119 202 1,508
F. Average number of fledglings produced per breeding pair (minimum; D/B = 'productivity or breeding success') 2.2 1.8 2.5 2.1 2.7 1.8 2.3 2.1 2.7 2.2
G. Average number of fledglings produced by well- monitored pairs (E/C = reproductive success) 2.7 2.8 3.4 2.8 3.6 2.5 3.2 3.1 4.2 3.0
H. Number of nests that were discovered 388 55 80 47 80 94 126 78 94 1,042
I. Number of nests that were regularly monitored or 'tracked' 338 37 73 45 76 88 114 73 91 935
J. Number of 'tracked' nests that were successful (% = J/I x 100)
57% 62% 60% 64% 57% 48% 58% 51% 63% 57% 192/338 23/37 44/73 29/45 43/76 42/88 66/114 37/73 57/91 533/935
K. Rate of missing eggs/chicks from nests (includes successful and unsuccessful nests)
44% 65% 30% 42% 41% 52% n/a n/a n/a 44% 150/338 24/37 22/73 19/45 31/76 46/88 292/657
L. Number of 'tracked' nests that were parasitized by cowbirds (% = L/I x 100)
30% 8% 0% 2% 3% 6% 0% 0% 1% 12% 103/338 3/37 0/73 1/45 2/76 5/88 0/114 0/73 1/91 115/935
M.
A. Number of 'tracked' nests that failed as a result of reproductive failure
2% 11% 8% 0% 5% 6% 10% 7% 2% 5% 7/338 4/37 6/73 0/45 4/76 5/88 11/114 5/73 2/91 44/935
B. Number of 'tracked' nests that failed as a result of parasitism
7% 0% 0% 2% 0% 2% 0% 0% 0% 3% 25/338 0/37 0/73 1/45 0/76 2/88 0/114 0/73 0/91 28/935
C. Number of 'tracked' nests that failed as a result of predation
34% 27% 30% 33% 36% 44% 32% 42% 35% 35% 114/338 10/37 22/73 15/45 27/76 39/88 37/114 31/73 32/91 327/935
D. Number of 'tracked' nests that failed for unknown reasons
0% 0% 1% 0% 3% 0% 0% 0% 0% <1% 0/338 0/37 1/73 0/45 2/76 0/88 0/114 0/73 0/91 3/935
N. Average clutch size n/a 3.4 3.5 3.3 3.4 3.2 3.3 3.5 3.8 n/a

LBVI AND SWFL REPORT 2017 SANTA ANA WATERSHED ASSOCIATION APPENDIX C
C-48
Appendix C-3-B continued. Least Bell’s Vireo reproductive success and breeding biology data at survey sites in the Santa Ana Watershed, 2000-2017.
SAN TIMOTEO CANYON
Parameter 2000
-20
09
2010
2011
2012
2013
2014
2015
2016
2017
Tota
ls
O. Number of cowbird eggs found in or near vireo nests 118 3 0 1 2 4 0 0 1 129
P. Number of cowbird nestlings removed from 'tracked' nests 6 0 0 0 0 1 0 0 0 7
Q. Number of cowbird young fledged by vireo 2 0 0 0 0 0 0 0 0 2
R. Number of 'manipulated' parasitized nests 84 3 n/a 0 2 4 n/a n/a 1 94
S. Number of 'successful, manipulated' nests (% = S/R x 100) 49% 100% n/a n/a 50% 50% n/a n/a 0% 50%
41/84 3/3 1/2 2/4 0/1 47/94
T. Number of vireo fledged from 'manipulated' parasitized nests 88 8 n/a n/a 1 5 n/a n/a 0 102
U. Number of repaired nests 3 1 2 1 1 0 0 0 1 9
V. % of successful repaired nests 67% 0% 100% 100% 100% n/a n/a n/a 0% 67% 2/3 0/1 2/2 1/1 1/1 0/1 6/9
W. Number of vireo fledged from repaired nests 5 0 7 2 4 n/a n/a n/a 0 18

LBVI AND SWFL REPORT 2017 SANTA ANA WATERSHED ASSOCIATION APPENDIX C
C-49
Appendix C-3-C. Least Bell’s Vireo reproductive success and breeding biology data at survey sites in the Santa Ana Watershed, 2000-2017.
MERIDIAN CONSERVATION AREA*
Parameter 2000
-20
09**
2010
2011
2012
2013
2014
2015
2016
2017
Tota
ls
A. Number of known pairs 34 12 9 11 12 16 3 5 9 111
B. Number of known breeding (nesting) pairs 30 8 5 6 9 16 3 1 8 86
C. Number of breeding pairs that were well-monitored throughout the breeding season 9 3 0 0 0 1 0 0 3 16
D. Number of 'known fledged young' OBSERVED 75 25 7 8 16 23 3 6 23 186
E. Number of known fledged young produced by pairs monitored throughout the breeding season 38 19 n/a n/a n/a 3 n/a n/a 9 69
F. Average number of fledglings produced per breeding pair (minimum; D/B = 'productivity or breeding success') 2.5 3.1 1.4 1.3 1.8 1.4 1.0 6.0 2.9 2.2
G. Average number of fledglings produced by well- monitored pairs (E/C = reproductive success) 4.2 6.3 n/a n/a n/a 3.0 n/a n/a 3.0 4.3
H. Number of nests that were discovered 17 6 0 0 0 3 0 1 5 32
I. Number of nests that were regularly monitored or 'tracked' 16 6 n/a n/a n/a 3 n/a 0 5 30
J. Number of 'tracked' nests that were successful (% = J/I x 100)
69% 100% n/a n/a n/a 33% n/a n/a 100% 77% 11/16 6/6 1/3 5/5 23/30
K. Rate of missing eggs/chicks from nests (includes successful and unsuccessful nests)
38% 0% n/a n/a n/a 67% n/a n/a n/a 32% 6/16 0/6 2/3 8/25
L. Number of 'tracked' nests that were parasitized by cowbirds (% = L/I x 100)
0% 0% n/a n/a n/a 0% n/a n/a 0% 0% 0/16 0/6 0/3 0/5 0/30
M.
A. Number of 'tracked' nests that failed as a result of reproductive failure
0% 0% n/a n/a n/a 0% n/a n/a 0% 0% 0/16 0/6 0/3 0/5 0/30
B. Number of 'tracked' nests that failed as a result of parasitism
0% 0% n/a n/a n/a 0% n/a n/a 0% 0% 0/16 0/6 0/3 0/5 0/30
C. Number of 'tracked' nests that failed as a result of predation
31% 0% n/a n/a n/a 67% n/a n/a 0% 23% 5/16 0/6 2/3 0/5 7/30
D. Number of 'tracked' nests that failed for unknown reasons
0% 0% n/a n/a n/a 0% n/a n/a 0% 0% 0/16 0/6 0/3 0/5 0/30
N. Average clutch size n/a 3.5 n/a n/a n/a 3.3 n/a 4 3.8 n/a

LBVI AND SWFL REPORT 2017 SANTA ANA WATERSHED ASSOCIATION APPENDIX C
C-50
Appendix C-3-C continued. Least Bell’s Vireo reproductive success and breeding biology data at survey sites in the Santa Ana Watershed, 2000-2017.
MERIDIAN CONSERVATION AREA*
Parameter 2000
-20
09**
2010
2011
2012
2013
2014
2015
2016
2017
Tota
ls
O. Number of cowbird eggs found in or near vireo nests 0 1 n/a n/a n/a 0 n/a 0 0 1
P. Number of cowbird nestlings removed from 'tracked' nests 0 0 n/a n/a n/a 0 n/a 0 0 0
Q. Number of cowbird young fledged by vireo 0 0 n/a n/a n/a 0 n/a n/a 0 0
R. Number of 'manipulated' parasitized nests 0 0 n/a n/a n/a n/a n/a n/a n/a 0
S. Number of 'successful, manipulated' nests (% = S/R x 100) n/a n/a n/a n/a n/a n/a n/a n/a n/a n/a
T. Number of vireo fledged from 'manipulated' parasitized nests n/a n/a n/a n/a n/a n/a n/a n/a n/a n/a
U. Number of repaired nests 0 0 n/a n/a n/a 0 n/a 0 0 0
V. % of successful repaired nests n/a n/a n/a n/a n/a n/a n/a n/a n/a n/a
W. Number of vireo fledged from repaired nests n/a n/a n/a n/a n/a n/a n/a n/a n/a n/a *Former March SKR Preserve
**n = 4 years monitored

LBVI AND SWFL REPORT 2017 SANTA ANA WATERSHED ASSOCIATION APPENDIX C
C-51
Appendix C-3-D. Least Bell’s Vireo reproductive success and breeding biology data at survey sites in the Santa Ana Watershed, 2000-2017.
SYCAMORE CANYON
Parameter 2000
-20
09
2010
2011
2012
2013
2014
2015
2016
2017
Tota
ls
A. Number of known pairs 35 8 5 7 0 5 1 4 9 74
B. Number of known breeding (nesting) pairs 19 6 3 4 n/a 3 1 0 6 42
C. Number of breeding pairs that were well-monitored throughout the breeding season 6 0 0 0 n/a 0 0 0 0 6
D. Number of 'known fledged young' OBSERVED 40 11 4 5 n/a 2 1 6 10 79
E. Number of known fledged young produced by pairs monitored throughout the breeding season 12 n/a n/a n/a n/a n/a n/a n/a n/a 12
F. Average number of fledglings produced per breeding pair (minimum; D/B = 'productivity or breeding success') 2.1 1.8 1.3 1.3 n/a 0.7 1.0 n/a 1.7 1.9
G. Average number of fledglings produced by well- monitored pairs (E/C = reproductive success) 2.0 n/a n/a n/a n/a n/a n/a n/a n/a 2.0
H. Number of nests that were discovered 10 0 0 0 n/a 4 0 0 0 14
I. Number of nests that were regularly monitored or 'tracked' 9 n/a n/a n/a n/a 4 n/a n/a n/a 13
J. Number of 'tracked' nests that were successful (% = J/I x 100)
67% n/a n/a n/a n/a 25% n/a n/a n/a 54% 6/9 1/4 7/13
K. Rate of missing eggs/chicks from nests (includes successful and unsuccessful nests)
33% n/a n/a n/a n/a 100% n/a n/a n/a 54% 3/9 4/4 7/13
L. Number of 'tracked' nests that were parasitized by cowbirds (% = L/I x 100)
22% n/a n/a n/a n/a 50% n/a n/a n/a 31% 2/9 2/4 4/13
M.
A. Number of 'tracked' nests that failed as a result of reproductive failure
0% n/a n/a n/a n/a 0% n/a n/a n/a 0% 0/9 0/4 0/13
B. Number of 'tracked' nests that failed as a result of parasitism
11% n/a n/a n/a n/a 50% n/a n/a n/a 23% 1/9 2/4 3/13
C. Number of 'tracked' nests that failed as a result of predation
22% n/a n/a n/a n/a 25% n/a n/a n/a 23% 2/9 1/4 3/13
D. Number of 'tracked' nests that failed for unknown reasons
0% n/a n/a n/a n/a 0% n/a n/a n/a 0% 0/9 0/4 0/13
N. Average clutch size n/a n/a n/a n/a n/a 3.3 n/a n/a n/a n/a

LBVI AND SWFL REPORT 2017 SANTA ANA WATERSHED ASSOCIATION APPENDIX C
C-52
Appendix C-3-D continued. Least Bell’s Vireo reproductive success and breeding biology data at survey sites in the Santa Ana Watershed, 2000-2017.
SYCAMORE CANYON
Parameter 2000
-20
09
2010
2011
2012
2013
2014
2015
2016
2017
Tota
ls
O. Number of cowbird eggs found in or near vireo nests 2 n/a n/a n/a n/a 3 n/a n/a n/a 5
P. Number of cowbird nestlings removed from 'tracked' nests 0 n/a n/a n/a n/a 0 n/a n/a n/a 0
Q. Number of cowbird young fledged by vireo 0 n/a n/a n/a n/a 0 n/a n/a n/a 0
R. Number of 'manipulated' parasitized nests 1 n/a n/a n/a n/a 1 n/a n/a n/a 2
S. Number of 'successful, manipulated' nests (% = S/R x 100) 100% n/a n/a n/a n/a 0% n/a n/a n/a 50% 1/1 0/1 1/2
T. Number of vireo fledged from 'manipulated' parasitized nests 1 n/a n/a n/a n/a 0 n/a n/a n/a 1
U. Number of repaired nests 0 n/a n/a n/a n/a 0 n/a n/a n/a 0
V. % of successful repaired nests n/a n/a n/a n/a n/a n/a n/a n/a n/a n/a
W. Number of vireo fledged from repaired nests n/a n/a n/a n/a n/a n/a n/a n/a n/a n/a

LBVI AND SWFL REPORT 2017 SANTA ANA WATERSHED ASSOCIATION APPENDIX C
C-53
Appendix C-3-E. Least Bell’s Vireo reproductive success and breeding biology data at survey sites in the Santa Ana Watershed, 2000-2017.
MOCKINGBIRD CANYON
Parameter 2000
-20
09
2010
2011
2012
2013
2014
2015
2016
2017
Tota
ls
A. Number of known pairs 120 34 32 26 24 7 23 7 15 288
B. Number of known breeding (nesting) pairs 110 26 31 21 22 4 16 4 13 247
C. Number of breeding pairs that were well-monitored throughout the breeding season 37 0 16 5 6 0 0 1 0 65
D. Number of 'known fledged young' OBSERVED 218 25 67 39 40 7 19 11 15 441
E. Number of known fledged young produced by pairs monitored throughout the breeding season 113 n/a 46 15 20 n/a n/a 3 n/a 197
F. Average number of fledglings produced per breeding pair (minimum; D/B = 'productivity or breeding success') 2.0 1.0 2.2 1.9 1.8 1.8 1.2 2.8 1.2 1.8
G. Average number of fledglings produced by well- monitored pairs (E/C = reproductive success) 3.0 n/a 2.9 3.0 3.3 n/a n/a 3.0 n/a 3.0
H. Number of nests that were discovered 99 3 31 19 20 3 5 3 2 185
I. Number of nests that were regularly monitored or 'tracked' 82 0 30 17 17 2 5 3 2 158
J. Number of 'tracked' nests that were successful (% = J/I x 100)
55% n/a 50% 47% 59% 50% 40% 67% 50% 53% 45/82 15/30 8/17 10/17 1/2 2/5 2/3 1/2 84/158
K. Rate of missing eggs/chicks from nests (includes successful and unsuccessful nests)
38% n/a 60% 53% 47% 50% n/a n/a n/a 45% 31/82 18/30 9/17 8/17 1/2 67/148
L. Number of 'tracked' nests that were parasitized by cowbirds (% = L/I x 100)
15% n/a 0% 6% 18% 0% 0% 0% 0% 10% 12/82 0/30 1/17 3/17 0/2 0/5 0/3 0/2 16/158
M.
A. Number of 'tracked' nests that failed as a result of reproductive failure
9% n/a 3% 6% 6% 0% 20% 0% 0% 7% 7/82 1/30 1/17 1/17 0/2 1/5 0/3 0/2 11/158
B. Number of 'tracked' nests that failed as a result of parasitism
7% n/a 0% 0% 0% 0% 0% 0% 0% 4% 6/82 0/30 0/17 0/17 0/2 0/5 0/3 0/2 6/158
C. Number of 'tracked' nests that failed as a result of predation
29% n/a 43% 47% 35% 0% 40% 33% 50% 35% 24/82 13/30 8/17 6/17 0/2 2/5 1/3 1/2 55/158
D. Number of 'tracked' nests that failed for unknown reasons
0% n/a 3% 0% 0% 50% 0% 0% 0% 1% 0/9 1/30 0/17 0/17 1/2 0/5 0/3 0/2 2/158
N. Average clutch size n/a 3.0 3.6 3.5 2.9 3.0 3.4 3.3 3.5 n/a

LBVI AND SWFL REPORT 2017 SANTA ANA WATERSHED ASSOCIATION APPENDIX C
C-54
Appendix C-3-E continued. Least Bell’s Vireo reproductive success and breeding biology data at survey sites in the Santa Ana Watershed, 2000-2017.
MOCKINGBIRD CANYON
Parameter 2000
-20
09
2010
2011
2012
2013
2014
2015
2016
2017
Tota
ls
O. Number of cowbird eggs found in or near vireo nests 22 1 0 1 3 0 0 0 0 27
P. Number of cowbird nestlings removed from 'tracked' nests 2 n/a 0 0 0 0 0 0 0 2
Q. Number of cowbird young fledged by vireo 1 n/a 0 0 0 0 0 0 0 1
R. Number of 'manipulated' parasitized nests 10 0 n/a 1 2 n/a n/a n/a n/a 13
S. Number of 'successful, manipulated' nests (% = S/R x 100) 10% n/a n/a 100% 100% n/a n/a n/a n/a 31% 1/10 1/1 2/2 4/13
T. Number of vireo fledged from 'manipulated' parasitized nests 2 n/a n/a 1 5 n/a n/a n/a n/a 8
U. Number of repaired nests 1 0 2 0 0 0 0 0 0 3
V. % of successful repaired nests 100% n/a 100% n/a n/a n/a n/a n/a n/a 100% 1/1 2/2 3/3
W. Number of vireo fledged from repaired nests 1 n/a 6 n/a n/a n/a n/a n/a n/a 7

LBVI AND SWFL REPORT 2017 SANTA ANA WATERSHED ASSOCIATION APPENDIX C
C-55
Appendix C-3-F. Least Bell’s Vireo reproductive success and breeding biology data at survey sites in the Santa Ana Watershed, 2000-2017.
SANTA ANA RIVER (SAR) - UPSTREAM - RIVERSIDE AVE. TO VAN BUREN BLVD.
Parameter 2000
-20
09
2010
2011
2012
2013
2014
2015
2016
2017
Tota
ls
A. Number of known pairs 167 50 23 11 n/a 19 37 43 95 445
B. Number of known breeding (nesting) pairs 149 39 19 7 n/a 10 27 29 87 367
C. Number of breeding pairs that were well-monitored throughout the breeding season 51 9 7 0 0 5 0 7 27 106
D. Number of 'known fledged young' OBSERVED 283 58 30 7 7 15 33 62 169 664
E. Number of known fledged young produced by pairs monitored throughout the breeding season 133 18 22 n/a n/a 6 n/a 28 78 285
F. Average number of fledglings produced per breeding pair (minimum; D/B = 'productivity or breeding success') 1.9 1.5 1.6 1.0 n/a 1.5 1.2 2.1 1.9 1.8
G. Average number of fledglings produced by well- monitored pairs (E/C = reproductive success) 2.6 2.0 3.1 n/a n/a 1.2 n/a 4.0 2.9 2.7
H. Number of nests that were discovered 94 13 14 2 n/a 6 11 16 58 214
I. Number of nests that were regularly monitored or 'tracked' 75 11 10 0 n/a 3 3 12 46 160
J. Number of 'tracked' nests that were successful (% = J/I x 100)
68% 55% 60% n/a n/a 67% 33% 83% 59% 64% 51/75 6/11 6/10 2/3 1/3 10/12 27/46 103/160
K. Rate of missing eggs/chicks from nests (includes successful and unsuccessful nests)
32% 36% 30% n/a n/a 67% n/a n/a n/a 33% 24/75 4/11 3/10 2/3 33/99
L. Number of 'tracked' nests that were parasitized by cowbirds (% = L/I x 100)
16% 0% 10% n/a n/a 0% 100% 0% 13% 14% 12/75 0/11 1/10 0/3 3/3 0/12 6/46 22/160
M.
A. Number of 'tracked' nests that failed as a result of reproductive failure
3% 9% 0% n/a n/a 0% 0% 0% 7% 4% 2/75 1/11 0/10 0/3 0/3 0/12 3/46 6/160
B. Number of 'tracked' nests that failed as a result of parasitism
8% 0% 10% n/a n/a 0% 0% 0% 9% 7% 6/75 0/11 1/10 0/3 0/3 0/12 4/46 11/160
C. Number of 'tracked' nests that failed as a result of predation
21% 36% 30% n/a n/a 33% 67% 17% 26% 25% 16/75 4/11 3/10 1/3 2/3 2/12 12/46 40/160
D. Number of 'tracked' nests that failed for unknown reasons
0% 0% 0% n/a n/a 0% 0% 0% 0% 0% 0/75 0/11 0/10 0/3 0/3 0/12 0/46 0/160
N. Average clutch size n/a 3.2 3.5 3.0 n/a 3.5 3.7 3.9 3.7 n/a

LBVI AND SWFL REPORT 2017 SANTA ANA WATERSHED ASSOCIATION APPENDIX C
C-56
Appendix C-3-F continued. Least Bell’s Vireo reproductive success and breeding biology data at survey sites in the Santa Ana Watershed, 2000-2017.
SANTA ANA RIVER (SAR) - UPSTREAM - RIVERSIDE AVE. TO VAN BUREN BLVD.
Parameter 2000
-20
09
2010
2011
2012
2013
2014
2015
2016
2017
Tota
ls
O. Number of cowbird eggs found in or near vireo nests 15 0 2 1 n/a 0 3 0 6 27
P. Number of cowbird nestlings removed from 'tracked' nests 0 0 0 n/a n/a 0 0 0 0 0
Q. Number of cowbird young fledged by vireo 1 1 0 n/a n/a 0 1 0 1 4
R. Number of 'manipulated' parasitized nests 10 n/a 1 n/a n/a n/a 3 n/a 6 20
S. Number of 'successful, manipulated' nests (% = S/R x 100) 20% n/a 0% n/a n/a n/a 33% n/a 0% 15% 2/10 0/1 1/3 0/6 3/20
T. Number of vireo fledged from 'manipulated' parasitized nests 5 n/a 0 n/a n/a n/a 2 n/a 0 7
U. Number of repaired nests 1 0 0 0 n/a 0 0 0 0 1
V. % of successful repaired nests n/a n/a n/a n/a n/a n/a n/a n/a n/a n/a
W. Number of vireo fledged from repaired nests n/a n/a n/a n/a n/a n/a n/a n/a n/a n/a

LBVI AND SWFL REPORT 2017 SANTA ANA WATERSHED ASSOCIATION APPENDIX C
C-57
Appendix C-3-G. Least Bell’s Vireo reproductive success and breeding biology data at survey sites in the Santa Ana Watershed, 2000-2017.
SANTA ANA RIVER (SAR) - UPSTREAM -HIDDEN VALLEY, NORTH SIDE OF RIVER
Parameter 2000
-20
09
2010
2011
2012
2013
2014
2015
2016
2017
Tota
ls
A. Number of known pairs n/a 12 2 3 2 14 23 27 17 100
B. Number of known breeding (nesting) pairs n/a 9 2 2 2 10 11 20 16 72
C. Number of breeding pairs that were well-monitored throughout the breeding season n/a 6 0 0 0 4 0 3 6 19
D. Number of 'known fledged young' OBSERVED n/a 18 2 1 3 19 15 33 34 125
E. Number of known fledged young produced by pairs monitored throughout the breeding season n/a 14 n/a n/a n/a 8 n/a 11 24 57
F. Average number of fledglings produced per breeding pair (minimum; D/B = 'productivity or breeding success') n/a 2.0 1.0 0.5 1.5 1.9 1.4 1.7 2.1 1.7
G. Average number of fledglings produced by well- monitored pairs (E/C = reproductive success) n/a 2.3 n/a n/a n/a 2.0 n/a 3.7 4.0 3.0
H. Number of nests that were discovered n/a 10 2 0 0 4 0 5 11 32
I. Number of nests that were regularly monitored or 'tracked' n/a 9 0 0 n/a 3 n/a 5 10 27
J. Number of 'tracked' nests that were successful (% = J/I x 100)
n/a 56% n/a n/a n/a 67% n/a 60% 70% 63% 5/9 2/3 3/5 7/10 17/27
K. Rate of missing eggs/chicks from nests (includes successful and unsuccessful nests)
n/a 11% n/a n/a n/a 33% n/a n/a n/a 17% 1/9 1/3 2/12
L. Number of 'tracked' nests that were parasitized by cowbirds (% = L/I x 100)
n/a 33% n/a n/a n/a 0% n/a 0% 20% 19% 3/9 0/3 0/5 2/10 5/27
M.
A. Number of 'tracked' nests that failed as a result of reproductive failure
n/a 0% n/a n/a n/a 0% n/a 0% 0% 0% 0/9 0/3 0/5 0/10 0/27
B. Number of 'tracked' nests that failed as a result of parasitism
n/a 33% n/a n/a n/a 0% n/a 0% 10% 15% 3/9 0/3 0/5 1/10 4/27
C. Number of 'tracked' nests that failed as a result of predation
n/a 11% n/a n/a n/a 33% n/a 20% 20% 19% 1/9 1/3 1/5 2/10 5/27
D. Number of 'tracked' nests that failed for unknown reasons
n/a 0% n/a n/a n/a 0% n/a 20% 0% 4% 0/9 0/3 1/5 0/10 1/27
N. Average clutch size n/a 3.5 n/a n/a n/a 4.0 n/a 3.4 4 n/a

LBVI AND SWFL REPORT 2017 SANTA ANA WATERSHED ASSOCIATION APPENDIX C
C-58
Appendix C-3-G continued. Least Bell’s Vireo reproductive success and breeding biology data at survey sites in the Santa Ana Watershed, 2000-2017.
SANTA ANA RIVER (SAR) - UPSTREAM -HIDDEN VALLEY, NORTH SIDE OF RIVER
Parameter 2000
-20
09
2010
2011
2012
2013
2014
2015
2016
2017
Tota
ls
O. Number of cowbird eggs found in or near vireo nests n/a 4 0 n/a n/a 0 n/a 0 2 6
P. Number of cowbird nestlings removed from 'tracked' nests n/a 0 n/a n/a n/a 0 n/a 0 0 0
Q. Number of cowbird young fledged by vireo n/a 0 0 n/a n/a 0 n/a 0 0 0
R. Number of 'manipulated' parasitized nests n/a 2 n/a n/a n/a n/a n/a n/a 2 4
S. Number of 'successful, manipulated' nests (% = S/R x 100)
n/a 0% n/a n/a n/a n/a n/a n/a 50% 25%
0/2 1/2 1/4
T. Number of vireo fledged from 'manipulated' parasitized nests n/a 0 n/a n/a n/a n/a n/a n/a 3 3
U. Number of repaired nests n/a 0 0 n/a n/a 0 n/a 0 0 0
V. % of successful repaired nests n/a n/a n/a n/a n/a n/a n/a n/a n/a n/a
W. Number of vireo fledged from repaired nests n/a n/a n/a n/a n/a n/a n/a n/a n/a n/a

LBVI AND SWFL REPORT 2017 SANTA ANA WATERSHED ASSOCIATION APPENDIX C
C-59
Appendix C-3-H. Least Bell’s Vireo reproductive success and breeding biology data at survey sites in the Santa Ana Watershed, 2000-2017.
SANTA ANA RIVER (SAR) - UPSTREAM -HIDDEN VALLEY, SOUTH SIDE OF RIVER
Parameter 2000
-20
09
2010
2011
2012
2013
2014
2015
2016
2017
Tota
ls
A. Number of known pairs 230 43 36 37 42 32 27 66 67 580
B. Number of known breeding (nesting) pairs 212 36 33 31 37 25 18 57 54 503
C. Number of breeding pairs that were well-monitored throughout the breeding season 56 9 5 4 8 0 0 7 4 93
D. Number of 'known fledged young' OBSERVED 407 53 41 45 66 28 22 97 87 846
E. Number of known fledged young produced by pairs monitored throughout the breeding season 142 19 17 11 21 n/a n/a 21 19 250
F. Average number of fledglings produced per breeding pair (minimum; D/B = 'productivity or breeding success') 1.9 1.5 1.2 1.5 1.8 1.1 1.2 1.7 1.6 1.7
G. Average number of fledglings produced by well- monitored pairs (E/C = reproductive success) 2.5 2.1 3.4 2.8 2.6 n/a n/a 3.0 4.8 2.7
H. Number of nests that were discovered 114 18 11 8 10 4 0 21 18 204
I. Number of nests that were regularly monitored or 'tracked' 85 17 10 8 8 3 n/a 16 16 163
J. Number of 'tracked' nests that were successful (% = J/I x 100)
68% 41% 60% 63% 88% 67% n/a 75% 44% 64% 58/85 7/17 6/10 5/8 7/8 2/3 12/16 7/16 104/163
K. Rate of missing eggs/chicks from nests (includes successful and unsuccessful nests)
36% 65% 30% 0% 25% 67% n/a n/a n/a 37% 31/85 11/17 3/10 0/8 2/8 2/3 49/131
L. Number of 'tracked' nests that were parasitized by cowbirds (% = L/I x 100)
7% 6% 20% 0% 0% 0% n/a 0% 0% 6% 6/85 1/17 2/10 0/8 0/8 0/3 0/16 0/16 9/163
M.
A. Number of 'tracked' nests that failed as a result of reproductive failure
4% 0% 0% 0% 0% 0% n/a 0% 0% 2% 3/85 0/17 0/10 0/8 0/8 0/3 0/16 0/16 3/163
B. Number of 'tracked' nests that failed as a result of parasitism
5% 6% 10% 0% 0% 0% n/a 0% 0% 4% 4/85 1/17 1/10 0/8 0/8 0/3 0/16 0/16 6/163
C. Number of 'tracked' nests that failed as a result of predation
24% 53% 30% 38% 13% 33% n/a 25% 44% 29% 20/85 9/17 3/10 3/8 1/8 1/3 4/16 7/16 48/163
D. Number of 'tracked' nests that failed for unknown reasons
0% 0% 0% 0% 0% 0% n/a 0% 13% 1% 0/85 0/17 0/10 0/8 0/8 0/3 0/16 2/16 2/163
N. Average clutch size n/a 3.4 3.1 3.2 3.3 3.0 n/a 3.5 3.6 n/a

LBVI AND SWFL REPORT 2017 SANTA ANA WATERSHED ASSOCIATION APPENDIX C
C-60
Appendix C-3-H continued. Least Bell’s Vireo reproductive success and breeding biology data at survey sites in the Santa Ana Watershed, 2000-2017.
SANTA ANA RIVER (SAR) - UPSTREAM -HIDDEN VALLEY, SOUTH SIDE OF RIVER
Parameter 2000
-20
09
2010
2011
2012
2013
2014
2015
2016
2017
Tota
ls
O. Number of cowbird eggs found in or near vireo nests 4 2 2 0 0 0 n/a 0 0 8
P. Number of cowbird nestlings removed from 'tracked' nests 2 0 0 0 0 0 n/a 0 0 2
Q. Number of cowbird young fledged by vireo 0 0 0 0 0 0 n/a 0 0 0
R. Number of 'manipulated' parasitized nests 2 0 1 n/a n/a n/a n/a n/a n/a 3
S. Number of 'successful, manipulated' nests (% = S/R x 100) 100% n/a 100% n/a n/a n/a n/a n/a n/a 100% 2/2 1/1 3/3
T. Number of vireo fledged from 'manipulated' parasitized nests 6 n/a 2 n/a n/a n/a n/a n/a n/a 8
U. Number of repaired nests 0 0 0 0 0 0 n/a 0 0 0
V. % of successful repaired nests n/a n/a n/a n/a n/a n/a n/a n/a n/a n/a
W. Number of vireo fledged from repaired nests n/a n/a n/a n/a n/a n/a n/a n/a n/a n/a
*As of 2010, reported as south side of the river

LBVI AND SWFL REPORT 2017 SANTA ANA WATERSHED ASSOCIATION APPENDIX C
C-61
Appendix C-3-I. Least Bell’s Vireo reproductive success and breeding biology data at survey sites in the Santa Ana Watershed, 2000-2017.
SANTA ANA RIVER (SAR) - UPSTREAM -GOOSE CREEK, NORCO TO I-15
Parameter 2000
-20
09
2010
2011
2012
2013
2014
2015
*
2016
**
2017
Tota
ls
A. Number of known pairs 233 64 59 51 52 32 36 31 34 592
B. Number of known breeding (nesting) pairs 224 60 56 48 50 28 29 28 32 555
C. Number of breeding pairs that were well-monitored throughout the breeding season 105 12 12 8 20 0 13 9 7 186
D. Number of 'known fledged young' OBSERVED 489 113 91 86 109 36 63 45 54 1,086
E. Number of known fledged young produced by pairs monitored throughout the breeding season 315 39 36 29 68 n/a 33 21 20 561
F. Average number of fledglings produced per breeding pair (minimum; D/B = 'productivity or breeding success') 2.2 1.9 1.6 1.8 2.2 1.3 2.2 1.6 1.7 2.0
G. Average number of fledglings produced by well- monitored pairs (E/C = reproductive success) 3.0 3.3 3.0 3.6 3.4 n/a 2.5 2.3 2.9 3.0
H. Number of nests that were discovered 212 22 25 19 31 13 18 22 19 381
I. Number of nests that were regularly monitored or 'tracked' 177 18 22 17 29 9 13 21 19 325
J. Number of 'tracked' nests that were successful (% = J/I x 100)
65% 89% 45% 71% 83% 44% 77% 43% 68% 66% 115/177 16/18 10/22 12/17 24/29 4/9 10/13 9/21 13/19 213/325
K. Rate of missing eggs/chicks from nests (includes successful and unsuccessful nests)
41% 28% 45% 0% 28% 56% n/a n/a n/a 37% 73/177 5/18 10/22 0/17 8/29 5/9 101/272
L. Number of 'tracked' nests that were parasitized by cowbirds (% = L/I x 100)
9% 0% 0% 0% 7% 0% 0% 0% 0% 5% 15/177 0/18 0/22 0/17 2/29 0/9 0/13 0/21 0/19 17/325
M.
A. Number of 'tracked' nests that failed as a result of reproductive failure
3% 0% 14% 12% 0% 0% 8% 0% 0% 4% 6/177 0/18 3/22 2/17 0/29 0/9 1/13 0/21 0/19 12/325
B. Number of 'tracked' nests that failed as a result of parasitism
2% 0% 0% 0% 0% 0% 0% 0% 0% 1% 4/177 0/13 0/22 0/17 0/29 0/9 0/13 0/21 0/19 4/325
C. Number of 'tracked' nests that failed as a result of predation
29% 11% 41% 18% 14% 56% 15% 52% 32% 29% 51/177 2/18 9/22 3/17 4/29 5/9 2/13 11/21 6/19 93/325
D. Number of 'tracked' nests that failed for unknown reasons
1% 0% 0% 0% 3% 0% 0% 5% 0% 1% 1/177 0/18 0/22 0/17 1/29 0/9 0/13 1/21 0/19 3/325
N. Average clutch size n/a 3.7 3.8 3.6 3.7 3.3 3.5 3.4 3.5 n/a

LBVI AND SWFL REPORT 2017 SANTA ANA WATERSHED ASSOCIATION APPENDIX C
C-62
Appendix C-3-I. Least Bell’s Vireo reproductive success and breeding biology data at survey sites in the Santa Ana Watershed, 2000-2017.
SANTA ANA RIVER (SAR) - UPSTREAM -GOOSE CREEK, NORCO TO I-15
Parameter 2000
-20
09
2010
2011
2012
2013
2014
2015
*
2016
**
2017
Tota
ls
O. Number of cowbird eggs found in or near vireo nests 20 0 0 0 2 0 0 0 0 22
P. Number of cowbird nestlings removed from 'tracked' nests 1 0 0 0 0 0 0 0 0 1
Q. Number of cowbird young fledged by vireo 0 0 0 0 0 0 0 0 0 0
R. Number of 'manipulated' parasitized nests 14 n/a n/a n/a 2 n/a n/a n/a n/a 16
S. Number of 'successful, manipulated' nests (% = S/R x 100) 64% n/a n/a n/a 100% n/a n/a n/a n/a 69% 9/14 2/2 11/16
T. Number of vireo fledged from 'manipulated' parasitized nests 13 n/a n/a n/a 5 n/a n/a n/a n/a 18
U. Number of repaired nests 2 0 0 0 0 0 0 0 1 3
V. % of successful repaired nests 50% n/a n/a n/a n/a n/a n/a n/a 100% 67% 1/2 1/1 2/3
W. Number of vireo fledged from repaired nests 4 n/a n/a n/a n/a n/a n/a n/a 4 8 *Starting in 2015 Goose Creek Golf Club to I-15 only. Formerly monitored as Goose Creek Golf Club to River Rd. **Includes Goose Creek mitigation funded by IERCD

LBVI AND SWFL REPORT 2017 SANTA ANA WATERSHED ASSOCIATION APPENDIX C
C-63
Appendix C-3-J. Least Bell’s Vireo reproductive success and breeding biology data at survey sites in the Santa Ana Watershed, 2000-2017.
NORCO BLUFFS (I-15 TO RIVER RD., NON-MITIGATION)*
Parameter 2000
-20
09
2010
2011
2012
2013
2014
2015
2016
2017
Tota
ls
A. Number of known pairs n/a n/a n/a n/a n/a n/a 17 28 31 76
B. Number of known breeding (nesting) pairs n/a n/a n/a n/a n/a n/a 17 28 30 75
C. Number of breeding pairs that were well-monitored throughout the breeding season n/a n/a n/a n/a n/a n/a 3 5 12 20
D. Number of 'known fledged young' OBSERVED n/a n/a n/a n/a n/a n/a 43 45 76 164
E. Number of known fledged young produced by pairs monitored throughout the breeding season n/a n/a n/a n/a n/a n/a 11 15 42 68
F. Average number of fledglings produced per breeding pair (minimum; D/B = 'productivity or breeding success') n/a n/a n/a n/a n/a n/a 2.5 1.6 2.5 2.2
G. Average number of fledglings produced by well- monitored pairs (E/C = reproductive success) n/a n/a n/a n/a n/a n/a 3.7 3.0 3.5 3.4
H. Number of nests that were discovered n/a n/a n/a n/a n/a n/a 14 12 25 51
I. Number of nests that were regularly monitored or 'tracked' n/a n/a n/a n/a n/a n/a 13 12 22 47
J. Number of 'tracked' nests that were successful (% = J/I x 100)
n/a n/a n/a n/a n/a n/a 69% 58% 77% 70% 9/13 7/12 17/22 33/47
K. Rate of missing eggs/chicks from nests (includes successful and unsuccessful nests) n/a n/a n/a n/a n/a n/a n/a n/a n/a n/a
L. Number of 'tracked' nests that were parasitized by cowbirds (% = L/I x 100)
n/a n/a n/a n/a n/a n/a 0% 0% 0% 0% 0/13 0/12 0/22 0/47
M.
A. Number of 'tracked' nests that failed as a result of reproductive failure
n/a n/a n/a n/a n/a n/a 15% 8% 5% 9% 2/13 1/12 1/22 4/47
B. Number of 'tracked' nests that failed as a result of parasitism
n/a n/a n/a n/a n/a n/a 0% 0% 0% 0% 0/13 0/12 0/22 0/47
C. Number of 'tracked' nests that failed as a result of predation
n/a n/a n/a n/a n/a n/a 15% 33% 18% 21%
2/13 4/12 4/22 10/47 D. Number of 'tracked' nests that failed for unknown reasons
n/a n/a n/a n/a n/a n/a 0% 0% 0% 0% 0/13 0/12 0/22 0/47
N. Average clutch size n/a n/a n/a n/a n/a n/a 3.4 3.4 3.6 n/a

LBVI AND SWFL REPORT 2017 SANTA ANA WATERSHED ASSOCIATION APPENDIX C
C-64
Appendix C-3-J. Least Bell’s Vireo reproductive success and breeding biology data at survey sites in the Santa Ana Watershed, 2000-2017.
NORCO BLUFFS (I-15 TO RIVER RD., NON-MITIGATION)*
Parameter 2000
-20
09
2010
2011
2012
2013
2014
2015
2016
2017
Tota
ls
O. Number of cowbird eggs found in or near vireo nests n/a n/a n/a n/a n/a n/a 0 0 0 0
P. Number of cowbird nestlings removed from 'tracked' nests n/a n/a n/a n/a n/a n/a 0 0 0 0
Q. Number of cowbird young fledged by vireo n/a n/a n/a n/a n/a n/a 0 0 0 0
R. Number of 'manipulated' parasitized nests n/a n/a n/a n/a n/a n/a 0 0 n/a 0
S. Number of 'successful, manipulated' nests (% = S/R x 100) n/a n/a n/a n/a n/a n/a n/a n/a n/a n/a
T. Number of vireo fledged from 'manipulated' parasitized nests n/a n/a n/a n/a n/a n/a n/a n/a n/a n/a
U. Number of repaired nests n/a n/a n/a n/a n/a n/a 0 0 0 0
V. % of successful repaired nests n/a n/a n/a n/a n/a n/a n/a n/a n/a n/a
W. Number of vireo fledged from repaired nests n/a n/a n/a n/a n/a n/a n/a n/a n/a n/a *Formerly monitored as part of Goose Creek Golf Club to River Rd.

LBVI AND SWFL REPORT 2017 SANTA ANA WATERSHED ASSOCIATION APPENDIX C
C-65
Appendix C-3-K. Least Bell’s Vireo reproductive success and breeding biology data at survey sites in the Santa Ana Watershed, 2000-2017.
TEMESCAL CANYON
Parameter 2000
-20
09
2010
2011
2012
2013
2014
2015
2016
2017
Tota
ls
A. Number of known pairs 164 49 65 63 50 24 21 9 59 504
B. Number of known breeding (nesting) pairs 146 38 57 48 42 n/a 20 4 39 394
C. Number of breeding pairs that were well-monitored throughout the breeding season 81 11 18 8 0 n/a 0 0 1 119
D. Number of 'known fledged young' OBSERVED 339 73 113 71 48 17 22 5 48 736
E. Number of known fledged young produced by pairs monitored throughout the breeding season 217 34 52 24 n/a n/a n/a n/a 3 330
F. Average number of fledglings produced per breeding pair (minimum; D/B = 'productivity or breeding success') 2.3 1.9 2.0 1.5 1.1 n/a 1.1 1.3 1.2 1.9
G. Average number of fledglings produced by well- monitored pairs (E/C = reproductive success) 2.7 3.1 2.9 3.0 n/a n/a n/a n/a 3.0 2.8
H. Number of nests that were discovered 166 22 35 16 3 3 0 1 16 262
I. Number of nests that were regularly monitored or 'tracked' 133 15 32 12 0 0 n/a 0 13 205
J. Number of 'tracked' nests that were successful (% = J/I x 100)
62% 87% 69% 58% n/a n/a n/a n/a 38% 63% 82/133 13/15 22/32 7/12 5/13 129/205
K. Rate of missing eggs/chicks from nests (includes successful and unsuccessful nests)
39% 20% 34% 0% n/a n/a n/a n/a n/a 34% 52/133 3/15 11/32 0/12 66/192
L. Number of 'tracked' nests that were parasitized by cowbirds (% = L/I x 100)
20% 0% 3% 25% n/a n/a n/a n/a 23% 17% 27/133 0/15 1/32 3/12 3/13 34/205
M.
A. Number of 'tracked' nests that failed as a result of reproductive failure
4% 0% 0% 0% n/a n/a n/a n/a 15% 3% 5/133 0/15 0/32 0/12 2/13 7/205
B. Number of 'tracked' nests that failed as a result of parasitism
3% 0% 0% 17% n/a n/a n/a n/a 0% 3% 4/133 0/15 0/32 2/12 0/13 6/205
C. Number of 'tracked' nests that failed as a result of predation
32% 13% 31% 25% n/a n/a n/a n/a 31% 30% 42/133 2/15 10/32 3/12 4/13 61/205
D. Number of 'tracked' nests that failed for unknown reasons
0% 0% 0% 0% n/a n/a n/a n/a 15% 1% 0/133 0/15 0/32 0/12 2/13 2/205
N. Average clutch size n/a 3.7 3.5 3.5 3.7 n/a n/a 4.0 3.3 n/a

LBVI AND SWFL REPORT 2017 SANTA ANA WATERSHED ASSOCIATION APPENDIX C
C-66
Appendix C-3-K. Least Bell’s Vireo reproductive success and breeding biology data at survey sites in the Santa Ana Watershed, 2000-2017.
TEMESCAL CANYON
Parameter 2000
-20
09
2010
2011
2012
2013
2014
2015
2016
2017
Tota
ls
O. Number of cowbird eggs found in or near vireo nests 33 0 1 5 0 0 n/a 0 3 42
P. Number of cowbird nestlings removed from 'tracked' nests 2 0 0 0 n/a n/a n/a n/a 0 2
Q. Number of cowbird young fledged by vireo 2 0 0 0 n/a n/a n/a n/a 1 3
R. Number of 'manipulated' parasitized nests 29 n/a 1 2 n/a n/a n/a n/a 2 34
S. Number of 'successful, manipulated' nests (% = S/R x 100) 41% n/a 100% 100% n/a n/a n/a n/a 0% 44%
12/29 1/1 2/2 0/2 15/34
T. Number of vireo fledged from 'manipulated' parasitized nests 26 n/a 2 6 n/a n/a n/a n/a 0 34
U. Number of repaired nests 0 0 3 0 0 0 n/a 0 0 3
V. % of successful repaired nests n/a n/a 67% n/a n/a n/a n/a n/a n/a 67%
2/3 2/3
W. Number of vireo fledged from repaired nests n/a n/a 3 n/a n/a n/a n/a n/a n/a 3

LBVI AND SWFL REPORT 2017 SANTA ANA WATERSHED ASSOCIATION APPENDIX C
C-67
Appendix C-3-L. Least Bell’s Vireo reproductive success and breeding biology data at survey sites in the Santa Ana Watershed, 2000-2017.
CHINO HILLS
Parameter 2000
-20
09
2010
2011
2012
2013
2014
2015
2016
*
2017
Tota
ls
A. Number of known pairs 45 7 3 2 5 2 6 11 7 88
B. Number of known breeding (nesting) pairs 37 4 1 2 4 0 3 8 3 62
C. Number of breeding pairs that were well-monitored throughout the breeding season 15 3 0 1 1 0 3 0 0 23
D. Number of 'known fledged young' OBSERVED 54 7 1 1 7 3 4 10 3 90
E. Number of known fledged young produced by pairs monitored throughout the breeding season 19 5 n/a 0 4 n/a 4 n/a n/a 32
F. Average number of fledglings produced per breeding pair (minimum; D/B = 'productivity or breeding success') 1.5 1.8 1.0 0.5 1.8 n/a 1.3 1.3 1.0 1.5
G. Average number of fledglings produced by well- monitored pairs (E/C = reproductive success) 1.3 1.7 n/a 0.0 4.0 n/a 1.3 n/a n/a 1.4
H. Number of nests that were discovered 24 3 0 1 1 n/a 7 4 0 40
I. Number of nests that were regularly monitored or 'tracked' 19 3 n/a 1 1 n/a 5 2 n/a 31
J. Number of 'tracked' nests that were successful (% = J/I x 100)
32% 67% n/a 0% 100% n/a 20% 50% n/a 35% 6/19 2/3 0/1 1/1 1/5 1/2 11/31
K. Rate of missing eggs/chicks from nests (includes successful and unsuccessful nests)
63% 33% n/a 100% 0% n/a n/a n/a n/a 58% 12/19 1/3 1/1 0/1 14/24
L. Number of 'tracked' nests that were parasitized by cowbirds (% = L/I x 100)
32% 0% n/a 0% 0% n/a 20% 0% n/a 23% 6/19 0/3 0/1 0/1 1/5 0/2 7/31
M.
A. Number of 'tracked' nests that failed as a result of reproductive failure
5% 0% n/a 0% 0% n/a 20% 50% n/a 10% 1/19 0/3 0/1 0/1 1/5 1/2 3/31
B. Number of 'tracked' nests that failed as a result of parasitism
11% 0% n/a 0% 0% n/a 0% 0% n/a 6% 2/19 0/3 0/1 0/1 0/5 0/2 2/31
C. Number of 'tracked' nests that failed as a result of predation
53% 33% n/a 100% 0% n/a 60% 0% n/a 48% 10/19 1/3 1/1 0/1 3/5 0/2 15/31
D. Number of 'tracked' nests that failed for unknown reasons
0% 0% n/a 0% 0% n/a 0% 0% n/a 0% 0/19 0/3 0/1 0/1 0/5 0/2 0/31
N. Average clutch size n/a 3.7 n/a 3.0 4.0 n/a 3.4 3.0 n/a n/a

LBVI AND SWFL REPORT 2017 SANTA ANA WATERSHED ASSOCIATION APPENDIX C
C-68
Appendix C-3-L. Least Bell’s Vireo reproductive success and breeding biology data at survey sites in the Santa Ana Watershed, 2000-2017.
CHINO HILLS
Parameter 2000
-20
09
2010
2011
2012
2013
2014
2015
2016
*
2017
Tota
ls
O. Number of cowbird eggs found in or near vireo nests 9 0 n/a 0 0 n/a 1 0 0 10
P. Number of cowbird nestlings removed from 'tracked' nests 0 0 n/a 0 0 n/a 0 0 0 0
Q. Number of cowbird young fledged by vireo 0 0 n/a 0 0 n/a 0 0 0 0
R. Number of 'manipulated' parasitized nests 6 n/a n/a n/a n/a n/a 1 n/a n/a 7
S. Number of 'successful, manipulated' nests (% = S/R x 100) 0% n/a n/a n/a n/a n/a 0% n/a n/a 0% 0/6 0/1 0/7
T. Number of vireo fledged from 'manipulated' parasitized nests 0 n/a n/a n/a n/a n/a 0 n/a n/a 0
U. Number of repaired nests 0 0 n/a 0 0 n/a 0 0 0 0
V. % of successful repaired nests n/a n/a n/a n/a n/a n/a n/a n/a n/a n/a
W. Number of vireo fledged from repaired nests n/a n/a n/a n/a n/a n/a n/a n/a n/a n/a *Beginning 2016, includes former assessment sites

LBVI AND SWFL REPORT 2017 SANTA ANA WATERSHED ASSOCIATION APPENDIX C
C-69
Appendix C-3-M. Least Bell’s Vireo reproductive success and breeding biology data at survey sites in the Santa Ana Watershed, 2000-2017.
SANTA ANA CANYON (SAC) - UPPER CANYON
Parameter 2000
-20
09
2010
2011
2012
2013
2014
2015
2016
2017
Tota
ls
A. Number of known pairs 126 4 5 4 14 18 9 12 21 213
B. Number of known breeding (nesting) pairs 110 3 5 4 12 16 6 11 18 185
C. Number of breeding pairs that were well-monitored throughout the breeding season 46 0 0 1 4 4 1 3 1 60
D. Number of 'known fledged young' OBSERVED 208 6 5 6 23 28 10 18 32 336
E. Number of known fledged young produced by pairs monitored throughout the breeding season 118 n/a n/a 3 12 12 2 7 2 156
F. Average number of fledglings produced per breeding pair (minimum; D/B = 'productivity or breeding success') 1.9 2.0 1.0 1.5 1.9 1.8 1.7 1.6 1.8 1.8
G. Average number of fledglings produced by well- monitored pairs (E/C = reproductive success) 2.6 n/a n/a 3.0 3.0 3.0 2.0 2.3 2.0 2.6
H. Number of nests that were discovered 97 2 2 2 6 8 1 3 6 127
I. Number of nests that were regularly monitored or 'tracked' 64 1 0 1 5 6 1 3 5 86
J. Number of 'tracked' nests that were successful (% = J/I x 100)
64% 100% n/a 100% 80% 83% 100% 100% 40% 67% 41/64 1/1 1/1 4/5 5/6 1/1 3/3 2/5 58/86
K. Rate of missing eggs/chicks from nests (includes successful and unsuccessful nests)
41% 0% n/a 0% 40% 33% n/a n/a n/a 39% 26/64 0/1 0/1 2/5 2/6 30/77
L. Number of 'tracked' nests that were parasitized by cowbirds (% = L/I x 100)
6% 0% n/a 0% 0% 0% 0% 0% 0% 5% 4/64 0/1 0/1 0/5 0/6 0/1 0/3 0/5 4/86
M.
A. Number of 'tracked' nests that failed as a result of reproductive failure
5% 0% n/a 0% 0% 0% 0% 0% 0% 3% 3/64 0/1 0/1 0/5 0/6 0/1 0/3 0/5 3/86
B. Number of 'tracked' nests that failed as a result of parasitism
3% 0% n/a 0% 0% 0% 0% 0% 0% 2% 2/64 0/1 0/1 0/5 0/6 0/1 0/3 0/5 2/86
C. Number of 'tracked' nests that failed as a result of predation
28% 0% n/a 0% 20% 17% 0% 0% 60% 27% 18/64 0/1 0/1 1/5 1/6 0/1 0/3 3/5 23/86
D. Number of 'tracked' nests that failed for unknown reasons
0% 0% n/a 0% 0% 0% 0% 0% 0% 0% 0/64 0/1 0/1 0/5 0/6 0/1 0/3 0/5 0/86
N. Average clutch size n/a 4.0 4.0 3.0 3.5 3.2 4.0 3.3 3.7 n/a

LBVI AND SWFL REPORT 2017 SANTA ANA WATERSHED ASSOCIATION APPENDIX C
C-70
Appendix C-3-M. Least Bell’s Vireo reproductive success and breeding biology data at survey sites in the Santa Ana Watershed, 2000-2017.
SANTA ANA CANYON (SAC) - UPPER CANYON
Parameter 2000
-20
09
2010
2011
2012
2013
2014
2015
2016
2017
Tota
ls
O. Number of cowbird eggs found in or near vireo nests 3 0 0 0 0 0 0 0 0 3
P. Number of cowbird nestlings removed from 'tracked' nests 1 0 n/a 0 0 0 0 0 0 1
Q. Number of cowbird young fledged by vireo 0 0 n/a 0 0 0 0 0 0 0
R. Number of 'manipulated' parasitized nests 1 n/a n/a n/a n/a n/a n/a n/a n/a 1
S. Number of 'successful, manipulated' nests (% = S/R x 100) 100% n/a n/a n/a n/a n/a n/a n/a n/a 100% 1/1 1/1
T. Number of vireo fledged from 'manipulated' parasitized nests 1 n/a n/a n/a n/a n/a n/a n/a n/a 1
U. Number of repaired nests 2 0 0 0 0 0 0 0 0 2
V. % of successful repaired nests 0% n/a n/a n/a n/a n/a n/a n/a n/a 0% 0/2 0/2
W. Number of vireo fledged from repaired nests 0 n/a n/a n/a n/a n/a n/a n/a n/a 0

LBVI AND SWFL REPORT 2017 SANTA ANA WATERSHED ASSOCIATION APPENDIX C
C-71
Appendix C-3-N. Least Bell’s Vireo reproductive success and breeding biology data at survey sites in the Santa Ana Watershed, 2000-2017.
SANTA ANA CANYON (SAC) - GREEN RIVER GOLF CLUB
Parameter 2000
-20
09
2010
2011
2012
2013
2014
2015
2016
2017
Tota
ls
A. Number of known pairs 101 17 14 11 19 19 23 26 33 263
B. Number of known breeding (nesting) pairs 92 14 12 8 15 18 19 22 30 230
C. Number of breeding pairs that were well-monitored throughout the breeding season 44 4 7 4 2 4 8 8 7 88
D. Number of 'known fledged young' OBSERVED 192 19 19 11 19 29 35 27 76 427
E. Number of known fledged young produced by pairs monitored throughout the breeding season 118 7 15 9 0 9 13 9 31 211
F. Average number of fledglings produced per breeding pair (minimum; D/B = 'productivity or breeding success') 2.1 1.4 1.6 1.4 1.3 1.6 1.8 1.2 2.5 1.9
G. Average number of fledglings produced by well- monitored pairs (E/C = reproductive success) 2.7 1.8 2.1 2.3 0.0 2.3 1.6 1.1 4.4 2.4
H. Number of nests that were discovered 73 7 13 7 5 10 16 14 21 166
I. Number of nests that were regularly monitored or 'tracked' 61 7 11 5 4 8 15 13 17 141
J. Number of 'tracked' nests that were successful (% = J/I x 100)
72% 43% 45% 60% 25% 63% 47% 31% 76% 60% 44/61 3/7 5/11 3/5 1/4 5/8 7/15 4/13 13/17 85/141
K. Rate of missing eggs/chicks from nests (includes successful and unsuccessful nests)
26% 71% 55% 20% 50% 25% n/a n/a n/a 33% 16/61 5/7 6/11 1/5 2/4 2/8 32/96
L. Number of 'tracked' nests that were parasitized by cowbirds (% = L/I x 100)
7% 0% 0% 0% 0% 0% 0% 0% 0% 3% 4/61 0/7 0/11 0/5 0/4 0/8 0/15 0/13 0/17 4/141
M.
A. Number of 'tracked' nests that failed as a result of reproductive failure
7% 0% 0% 20% 0% 13% 7% 23% 0% 7% 4/61 0/7 0/11 1/5 0/4 1/8 1/15 3/13 0/17 10/141
B. Number of 'tracked' nests that failed as a result of parasitism
2% 0% 0% 0% 0% 0% 0% 0% 0% 1% 1/61 0/7 0/11 0/5 0/4 0/8 0/15 0/13 0/17 1/141
C. Number of 'tracked' nests that failed as a result of predation
20% 57% 55% 20% 75% 25% 47% 46% 24% 32% 12/61 4/7 6/11 1/5 3/4 2/8 7/15 6/13 4/17 45/141
D. Number of 'tracked' nests that failed for unknown reasons
0% 0% 0% 0% 0% 0% 0% 0% 0% 0% 0/61 0/7 0/11 0/5 0/4 0/8 0/15 0/13 0/17 0/141
N. Average clutch size n/a 4.0 3.4 3.2 3.0 3.0 2.8 2.7 3.5 n/a

LBVI AND SWFL REPORT 2017 SANTA ANA WATERSHED ASSOCIATION APPENDIX C
C-72
Appendix C-3-N. Least Bell’s Vireo reproductive success and breeding biology data at survey sites in the Santa Ana Watershed, 2000-2017.
SANTA ANA CANYON (SAC) - GREEN RIVER GOLF CLUB
Parameter 2000
-20
09
2010
2011
2012
2013
2014
2015
2016
2017
Tota
ls
O. Number of cowbird eggs found in or near vireo nests 4 0 0 0 0 0 0 0 0 4
P. Number of cowbird nestlings removed from 'tracked' nests 0 0 0 0 0 0 0 0 0 0
Q. Number of cowbird young fledged by vireo 0 0 0 0 0 0 0 0 0 0
R. Number of 'manipulated' parasitized nests 2 n/a n/a n/a n/a n/a n/a n/a n/a 2
S. Number of 'successful, manipulated' nests (% = S/R x 100) 100% n/a n/a n/a n/a n/a n/a n/a n/a 100% 2/2 2/2
T. Number of vireo fledged from 'manipulated' parasitized nests 6 n/a n/a n/a n/a n/a n/a n/a n/a 6
U. Number of repaired nests 4 0 0 0 0 1 0 0 0 5
V. % of successful repaired nests 75% n/a n/a n/a n/a 100% n/a n/a n/a 80% 3/4 1/1 4/5
W. Number of vireo fledged from repaired nests 7 n/a n/a n/a n/a 3 n/a n/a n/a 10

LBVI AND SWFL REPORT 2017 SANTA ANA WATERSHED ASSOCIATION APPENDIX C
C-73
Appendix C-3-O. Least Bell’s Vireo reproductive success and breeding biology data at survey sites in the Santa Ana Watershed, 2000-2017.
SANTA ANA CANYON (SAC) - FEATHERLY REGIONAL PARK
Parameter 2000
-20
09
2010
2011
2012
2013
2014
2015
2016
2017
Tota
ls
A. Number of known pairs 131 23 19 16 45 39 38 39 36 386
B. Number of known breeding (nesting) pairs 109 18 18 11 37 34 30 25 32 314
C. Number of breeding pairs that were well-monitored throughout the breeding season 36 3 7 2 10 10 9 8 11 96
D. Number of 'known fledged young' OBSERVED 175 22 23 12 55 35 37 23 57 439
E. Number of known fledged young produced by pairs monitored throughout the breeding season 73 6 14 0 17 11 12 8 38 179
F. Average number of fledglings produced per breeding pair (minimum; D/B = 'productivity or breeding success') 1.6 1.2 1.3 1.1 1.5 1.0 1.2 0.9 1.8 1.4
G. Average number of fledglings produced by well- monitored pairs (E/C = reproductive success) 2.0 2.0 2.0 0.0 1.7 1.1 1.3 1.0 3.5 1.9
H. Number of nests that were discovered 83 11 12 8 23 18 22 16 24 217
I. Number of nests that were regularly monitored or 'tracked' 65 7 5 4 14 14 19 12 22 162
J. Number of 'tracked' nests that were successful (% = J/I x 100)
49% 29% 100% 0% 50% 29% 32% 25% 50% 43% 32/65 2/7 5/5 0/4 7/14 4/14 6/19 3/12 11/22 70/162
K. Rate of missing eggs/chicks from nests (includes successful and unsuccessful nests)
48% 71% 20% 100% 50% 64% n/a n/a n/a 52% 31/65 5/7 1/5 4/4 7/14 9/14 57/109
L. Number of 'tracked' nests that were parasitized by cowbirds (% = L/I x 100)
8% 0% 0% 0% 0% 0% 0% 0% 0% 3% 5/65 0/7 0/5 0/4 0/14 0/14 0/19 0/12 0/22 5/162
M.
A. Number of 'tracked' nests that failed as a result of reproductive failure
5% 0% 0% 0% 7% 7% 5% 0% 9% 5% 3/65 0/7 0/5 0/4 1/14 1/14 1/19 0/12 2/22 8/162
B. Number of 'tracked' nests that failed as a result of parasitism
3% 0% 0% 0% 0% 0% 0% 0% 0% 1% 2/65 0/7 0/5 0/4 0/14 0/14 0/19 0/12 0/22 2/162
C. Number of 'tracked' nests that failed as a result of predation
43% 71% 0% 100% 43% 64% 63% 75% 41% 51% 28/65 5/7 0/5 4/4 6/14 9/14 12/19 9/12 9/22 82/162
D. Number of 'tracked' nests that failed for unknown reasons
0% 0% 0% 0% 0% 0% 0% 0% 0% 0% 0/65 0/7 0/5 0/4 0/14 0/14 0/19 0/12 0/22 0/162
N. Average clutch size n/a 4.0 3.6 4.0 3.4 3.1 3.2 3.2 3.8 n/a

LBVI AND SWFL REPORT 2017 SANTA ANA WATERSHED ASSOCIATION APPENDIX C
C-74
Appendix C-3-O. Least Bell’s Vireo reproductive success and breeding biology data at survey sites in the Santa Ana Watershed, 2000-2017.
SANTA ANA CANYON (SAC) - FEATHERLY REGIONAL PARK
Parameter 2000
-20
09
2010
2011
2012
2013
2014
2015
2016
2017
Tota
ls
O. Number of cowbird eggs found in or near vireo nests 4 0 0 0 0 0 0 0 0 4
P. Number of cowbird nestlings removed from 'tracked' nests 1 0 0 0 0 0 0 0 0 1
Q. Number of cowbird young fledged by vireo 0 0 0 0 0 0 0 0 0 0
R. Number of 'manipulated' parasitized nests 3 n/a n/a n/a n/a n/a n/a n/a n/a 3
S. Number of 'successful, manipulated' nests (% = S/R x 100) 33% n/a n/a n/a n/a n/a n/a n/a n/a 33% 1/3 1/3
T. Number of vireo fledged from 'manipulated' parasitized nests 2 n/a n/a n/a n/a n/a n/a n/a n/a 2
U. Number of repaired nests 4 1 0 0 0 2 0 0 1 8
V. % of successful repaired nests 100% 100% n/a n/a n/a 50% n/a n/a 0% 75% 4/4 1/1 ½ 0/1 6/8
W. Number of vireo fledged from repaired nests 14 2 n/a n/a n/a 2 n/a n/a 0 18

LBVI AND SWFL REPORT 2017 SANTA ANA WATERSHED ASSOCIATION APPENDIX C
C-75
Appendix C-3-P. Least Bell’s Vireo reproductive success and breeding biology data at survey sites in the Santa Ana Watershed, 2000-2017.
SANTIAGO CANYON (IRVINE PARK)
Parameter 2000
-20
09
2010
2011
2012
2013
2014
2015
2016
2017
Tota
ls
A. Number of known pairs n/a 14 9 5 8 9 24 1 1 71
B. Number of known breeding (nesting) pairs n/a 9 5 5 6 8 1 0 0 34
C. Number of breeding pairs that were well-monitored throughout the breeding season n/a 3 1 0 n/a 5 0 0 n/a 9
D. Number of 'known fledged young' OBSERVED n/a 18 7 5 10 12 2 0 0 54
E. Number of known fledged young produced by pairs monitored throughout the breeding season n/a 11 2 n/a n/a 8 n/a n/a n/a 21
F. Average number of fledglings produced per breeding pair (minimum; D/B = 'productivity or breeding success') n/a 2.0 1.4 1.0 1.7 1.5 2.0 n/a n/a 1.6
G. Average number of fledglings produced by well- monitored pairs (E/C = reproductive success) n/a 3.7 2.0 n/a n/a 1.6 n/a n/a n/a 2.3
H. Number of nests that were discovered n/a 5 1 0 n/a 6 0 0 0 12
I. Number of nests that were regularly monitored or 'tracked' n/a 4 1 n/a n/a 5 n/a n/a n/a 10
J. Number of 'tracked' nests that were successful (% = J/I x 100)
n/a 75% 100% n/a n/a 60% n/a n/a n/a 70% 3/4 1/1 3/5 7/10
K. Rate of missing eggs/chicks from nests (includes successful and unsuccessful nests)
n/a 25% n/a n/a n/a 80% n/a n/a n/a 56% 1/4 4/5 5/9
L. Number of 'tracked' nests that were parasitized by cowbirds (% = L/I x 100)
n/a 0% 0% n/a n/a 0% n/a n/a n/a 0% 0/4 0/1 0/5 0/10
M.
A. Number of 'tracked' nests that failed as a result of reproductive failure
n/a 0% 0% n/a n/a 0% n/a n/a n/a 0% 0/4 0/1 0/5 0/10
B. Number of 'tracked' nests that failed as a result of parasitism
n/a 0% 0% n/a n/a 0% n/a n/a n/a 0% 0/4 0/1 0/5 0/10
C. Number of 'tracked' nests that failed as a result of predation
n/a 25% 0% n/a n/a 40% n/a n/a n/a 30% 1/4 0/1 2/5 3/10
D. Number of 'tracked' nests that failed for unknown reasons
n/a 0% 0% n/a n/a 0% n/a n/a n/a 0% 0/4 0/1 0/5 0/10
N. Average clutch size n/a 3.5 2 n/a n/a 3.2 n/a n/a n/a n/a

LBVI AND SWFL REPORT 2017 SANTA ANA WATERSHED ASSOCIATION APPENDIX C
C-76
Appendix C-3-P. Least Bell’s Vireo reproductive success and breeding biology data at survey sites in the Santa Ana Watershed, 2000-2017.
SANTIAGO CANYON (IRVINE PARK)
Parameter 2000
-20
09
2010
2011
2012
2013
2014
2015
2016
2017
Tota
ls
O. Number of cowbird eggs found in or near vireo nests n/a 4 0 n/a n/a 0 n/a n/a n/a 4
P. Number of cowbird nestlings removed from 'tracked' nests n/a 0 0 n/a n/a 0 n/a n/a n/a 0
Q. Number of cowbird young fledged by vireo n/a 0 0 n/a n/a 0 n/a n/a n/a 0
R. Number of 'manipulated' parasitized nests n/a n/a n/a n/a n/a n/a n/a n/a n/a 0
S. Number of 'successful, manipulated' nests (% = S/R x 100) n/a n/a n/a n/a n/a n/a n/a n/a n/a n/a
T. Number of vireo fledged from 'manipulated' parasitized nests n/a n/a n/a n/a n/a n/a n/a n/a n/a n/a
U. Number of repaired nests n/a 0 0 n/a n/a 0 n/a n/a n/a 0
V. % of successful repaired nests n/a n/a n/a n/a n/a n/a n/a n/a n/a n/a
W. Number of vireo fledged from repaired nests n/a n/a n/a n/a n/a n/a n/a n/a n/a n/a

LBVI AND SWFL REPORT 2017 SANTA ANA WATERSHED ASSOCIATION APPENDIX D
D-1
APPENDIX D: SUMMARY TABLES BY MANAGED SITE, 2000-2009
Available by request under separate cover.