STATUS AND MANAGEMENT OF LOBSTER AND SqUID...
3
1 Oceana Group Limited Scientific reports (Status and management of lobster and squid fishery 2012) WEST COAST ROCK LOBSTER: STATUS, TAC, PROSPECTS The west coast rock lobster resource is managed by means of an Operational Management Procedure (OMP) for the determination of a global TAC. Key inputs into the OMP each year are the commercial catch-per-unit-of-fishing effort (CPUE) for both hoop net and trap fishing, the Fisheries Independent Monitoring Survey (FIMS) index, and the somatic growth rates. The global TAC is divided amongst different sectors of the fishery (nearshore, offshore, interim relief, recreational), each of which is further divided and allocated to the following super-areas: Areas 1 and 2 (Port Nolloth and Hondeklipbaai); Areas 3 and 4 (Lambert’s Bay and Elandsbaai); Areas 5 and 6 (Saldanha Bay Area); Area 7 (Dassen Island); and Area 8 (Cape Point). OMPs are revised every four years. Work on the revision of the OMP was carried out in 2010 and 2011. During 2011, prior to the start of the 2011/2012 fishing season, the scientific working group (SWG) reviewed a number of alternate OMPs. The OMP eventually submitted to management was designed to achieve a 35% biomass recovery by 2021. This is a higher level of recovery than was built into the previous OMP, a consequence of greater risk aversion towards the management of the resource, due partly to the fact that under previous OMPs the desired level of rebuilding was not achieved, as well as biological concerns about the high level of depletion the resource is estimated to have sustained over the course of the fishery. Management modified this OMP so that the long-term recovery level of 35% was unaffected, but the 2011/2012 allocation to the offshore sector was set at the level associated with a 30% recovery target (1 540,65 tons), a variant for which calculations had been carried out. There was also a request from the interim relief sector that the minimum legal carapace length for their sector be reduced from the current 80 mm to 75 mm as for the other commercial sectors, and this was granted. The final OMP, which commenced with the 2011/2012 fishing season, accommodates these changes. Following this, there was a further request, given excellent fishing performance in Areas 5 and 6 and concerns about the biological status of Area 7, to transfer 40 tons from Area 7 to Areas 5 and 6 and this modification has also been incorporated into the OMP. The result for 2011/2012 is a global TAC of 2 426 MT, which represents an increase on the 2010/2011 TAC of 2 286 (kilogram whole weight) of 6,1%. This is probably only a short-term increase since forward projections indicate that the TAC will most likely decline in the medium term. This benefit is, however, not without cost. The new OMP contains two important provisions, which cover some risks that have the potential to influence the TAC negatively, should the resource perform below par. These are: 1) TAC reduction constraint rule: The previous OMP limited TAC reductions to 10%. The new OMP makes provision for as much as a 30% reduction under certain circumstances. 2) The low abundance rule: There is a ‘bale-out clause’ known as an ‘Exceptional Circumstances rule’ that provides for the closure of all fishing in a super-area should that super-area underperform to a sufficient degree. Following this, the SWG would have to convene and reconsider the OMP with a view to the possible transfer of the TAC to other super-areas. The TAC for the 2012/2013 fishing season will be determined by the new OMP formula, which has been finalised subject to the modifications outlined above. As mentioned, all calculations submitted to the SWG suggested that there would be declines in the TAC in 2012/2013 compared to 2011/2012. The jury is still out on this matter, since despite these calculations, which were based on hypothetical resource performance, the final TAC depends on the actual performance of the CPUE, the FIMs and the somatic growth rates. The most recent CPUE has shown declines at Port Nolloth, although the medium-term trend is still upwards. Notably, CPUE has been poor at Dassen Island in the 2011/2012 fishing season. Other areas show stable or increasing CPUE trends which is encouraging. Lobster moult increments have also been stable, except for the Port Nolloth area. Independent surveys show stability in general, except for Dassen Island where there is either an availability or catchability downturn, or abundance has declined. 4 000 3 500 3 000 2 500 2 000 1 500 1 000 500 0 TAC (MT) Year WEST COAST ROCK LOBSTER TACs 1988 1989 1990 1991 1992 1993 1994 1995 1996 1997 1998 1999 2000 2001 2002 2003 2004 2005 2006 2007 2008 2009 2010 2011 2012 2013 SOUTH COAST ROCK LOBSTER: STATUS, TAC, PROSPECTS The south coast rock lobster (SCRL) fishery is managed via a combination of output controls in the form of a TAC and input controls in the form of a Total Allowable Effort (TAE). The TAC is the primary control measure. The TAE, based on a fishing day allocation, is a secondary measure and will seldom be an active constraint, i.e. the probability that the number of fishing days will be insufficient is slight. The following data are used in the management of the resource: STATUS AND MANAGEMENT OF LOBSTER AND SQUID FISHERY Prepared by Mike Bergh of OLRAC (Ocean and Land Resource Assessment Consultants) for Oceana
Transcript of STATUS AND MANAGEMENT OF LOBSTER AND SqUID...
1 Oceana Group Limited Scientific reports (Status and management of lobster and squid fishery 2012)
West Coast roCk lobster: status, taC, ProsPeCts
The west coast rock lobster resource is managed by means of an Operational Management Procedure (OMP) for the determination of a global TAC. Key inputs into the OMP each year are the commercial catch-per-unit-of-fishing effort (CPUE) for both hoop net and trap fishing, the Fisheries Independent Monitoring Survey (FIMS) index, and the somatic growth rates. The global TAC is divided amongst different sectors of the fishery (nearshore, offshore, interim relief, recreational), each of which is further divided and allocated to the following super-areas:
Areas 1 and 2 (Port Nolloth and Hondeklipbaai);
Areas 3 and 4 (Lambert’s Bay and Elandsbaai);
Areas 5 and 6 (Saldanha Bay Area);
Area 7 (Dassen Island); and
Area 8 (Cape Point).
OMPs are revised every four years. Work on the revision of the OMP was carried out in 2010 and 2011. During 2011, prior to the start of the 2011/2012 fishing season, the scientific working group (SWG) reviewed a number of alternate OMPs. The OMP eventually submitted to management was designed to achieve a 35% biomass recovery by 2021. This is a higher level of recovery than was built into the previous OMP, a consequence of greater risk aversion towards the management of the resource, due partly to the fact that under previous OMPs the desired level of rebuilding was not achieved, as well as biological concerns about the high level of depletion the resource is estimated to have sustained over the course of the fishery. Management modified this OMP so that the long-term recovery level of 35% was unaffected, but the 2011/2012 allocation to the offshore sector was set at the level associated with a 30% recovery target (1 540,65 tons), a variant for which calculations had been carried out. There was also a request from the interim relief sector that the minimum legal carapace length for their sector be reduced from the current 80 mm to 75 mm as for the other commercial sectors, and this was granted. The final OMP, which commenced with the 2011/2012 fishing season, accommodates these changes. Following this, there was a further request, given excellent fishing performance in Areas 5 and 6 and concerns about the biological status of Area 7, to transfer 40 tons from Area 7 to Areas 5 and 6 and this modification has also been incorporated into the OMP.
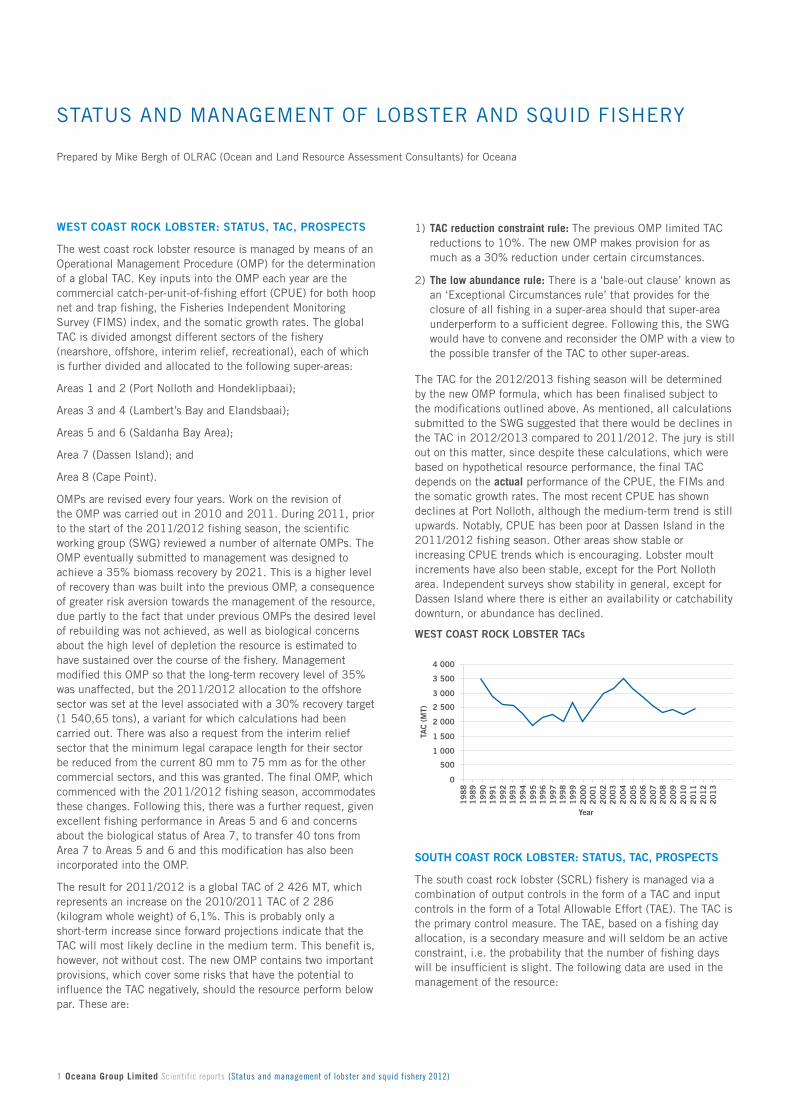
The result for 2011/2012 is a global TAC of 2 426 MT, which represents an increase on the 2010/2011 TAC of 2 286 (kilogram whole weight) of 6,1%. This is probably only a short-term increase since forward projections indicate that the TAC will most likely decline in the medium term. This benefit is, however, not without cost. The new OMP contains two important provisions, which cover some risks that have the potential to influence the TAC negatively, should the resource perform below par. These are:
1) TAC reduction constraint rule: The previous OMP limited TAC reductions to 10%. The new OMP makes provision for as much as a 30% reduction under certain circumstances.
2) The low abundance rule: There is a ‘bale-out clause’ known as an ‘Exceptional Circumstances rule’ that provides for the closure of all fishing in a super-area should that super-area underperform to a sufficient degree. Following this, the SWG would have to convene and reconsider the OMP with a view to the possible transfer of the TAC to other super-areas.
The TAC for the 2012/2013 fishing season will be determined by the new OMP formula, which has been finalised subject to the modifications outlined above. As mentioned, all calculations submitted to the SWG suggested that there would be declines in the TAC in 2012/2013 compared to 2011/2012. The jury is still out on this matter, since despite these calculations, which were based on hypothetical resource performance, the final TAC depends on the actual performance of the CPUE, the FIMs and the somatic growth rates. The most recent CPUE has shown declines at Port Nolloth, although the medium-term trend is still upwards. Notably, CPUE has been poor at Dassen Island in the 2011/2012 fishing season. Other areas show stable or increasing CPUE trends which is encouraging. Lobster moult increments have also been stable, except for the Port Nolloth area. Independent surveys show stability in general, except for Dassen Island where there is either an availability or catchability downturn, or abundance has declined.
4 000
3 500
3 000
2 500
2 000
1 500
1 000
500
0
taC
(M
t)
Year
West Coast roCk lobster taCs
19
88
19
89
19
90
19
91
19
92
19
93
19
94
19
95
19
96
19
97
19
98
19
99
20
00
20
01
20
02
20
03
20
04
20
05
20
06
20
07
20
08
20
09
20
10
20
11
20
12
20
13
south Coast roCk lobster: status, taC, ProsPeCts
The south coast rock lobster (SCRL) fishery is managed via a combination of output controls in the form of a TAC and input controls in the form of a Total Allowable Effort (TAE). The TAC is the primary control measure. The TAE, based on a fishing day allocation, is a secondary measure and will seldom be an active constraint, i.e. the probability that the number of fishing days will be insufficient is slight. The following data are used in the management of the resource:
STATUS AND MANAGEMENT OF LOBSTER AND SqUID FISHERy
Prepared by Mike Bergh of OLRAC (Ocean and Land Resource Assessment Consultants) for Oceana
2 Oceana Group Limited Scientific reports (Status and management of lobster and squid fishery 2012)
• Catch-per-unit-effort–measuredaskilogramtailspertrapset
• Catch-at-lengthdata
• Taggingdata
An OMP is in effect for the determination of the TAC. This OMP is based on an interpretation and calculation of trends in CPUE in recent years, separately for each of three areas, where Area 1 is the easternmost fishing area, Area 3 is the westernmost area on the west side of the Agulhas Bank, and Area 2 is a central area between Mossel Bay and the Tsitsikamma area.
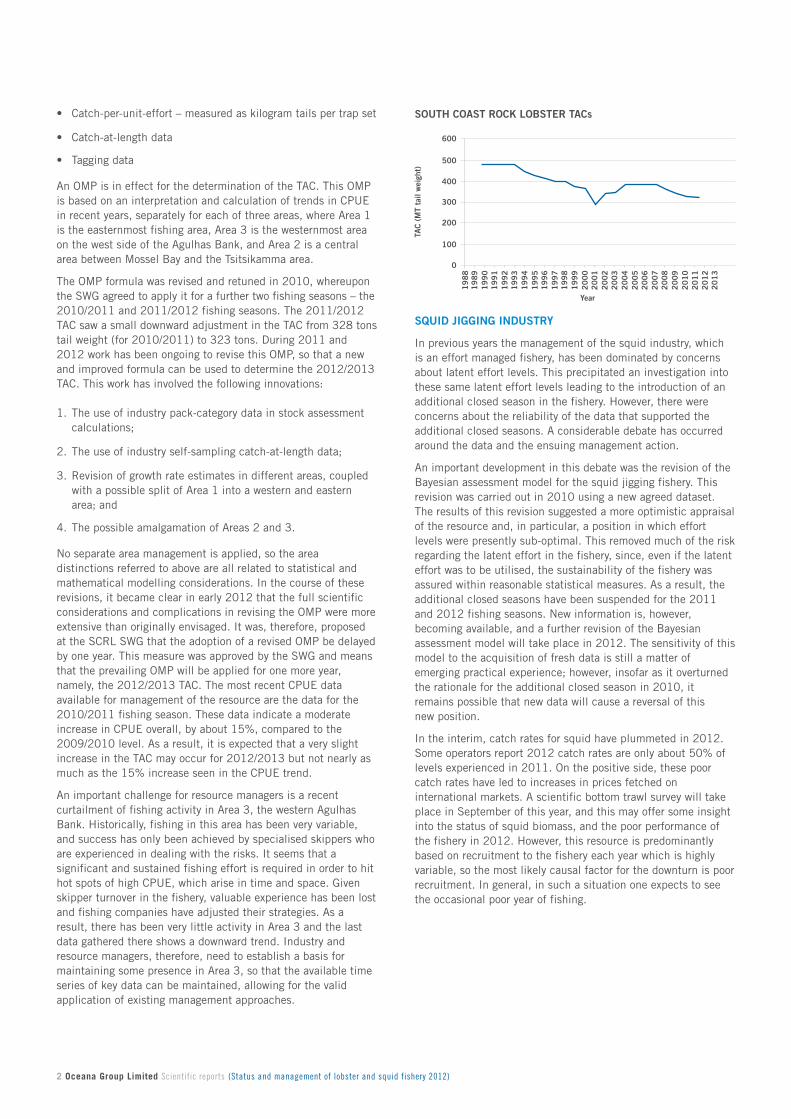
The OMP formula was revised and retuned in 2010, whereupon theSWGagreedtoapplyitforafurthertwofishingseasons–the2010/2011 and 2011/2012 fishing seasons. The 2011/2012 TAC saw a small downward adjustment in the TAC from 328 tons tail weight (for 2010/2011) to 323 tons. During 2011 and 2012 work has been ongoing to revise this OMP, so that a new and improved formula can be used to determine the 2012/2013 TAC. This work has involved the following innovations:
1. The use of industry pack-category data in stock assessment calculations;
2. The use of industry self-sampling catch-at-length data;
3. Revision of growth rate estimates in different areas, coupled with a possible split of Area 1 into a western and eastern area; and
4. The possible amalgamation of Areas 2 and 3.
No separate area management is applied, so the area distinctions referred to above are all related to statistical and mathematical modelling considerations. In the course of these revisions, it became clear in early 2012 that the full scientific considerations and complications in revising the OMP were more extensive than originally envisaged. It was, therefore, proposed at the SCRL SWG that the adoption of a revised OMP be delayed by one year. This measure was approved by the SWG and means that the prevailing OMP will be applied for one more year, namely, the 2012/2013 TAC. The most recent CPUE data available for management of the resource are the data for the 2010/2011 fishing season. These data indicate a moderate increase in CPUE overall, by about 15%, compared to the 2009/2010 level. As a result, it is expected that a very slight increase in the TAC may occur for 2012/2013 but not nearly as much as the 15% increase seen in the CPUE trend.
An important challenge for resource managers is a recent curtailment of fishing activity in Area 3, the western Agulhas Bank. Historically, fishing in this area has been very variable, and success has only been achieved by specialised skippers who are experienced in dealing with the risks. It seems that a significant and sustained fishing effort is required in order to hit hot spots of high CPUE, which arise in time and space. Given skipper turnover in the fishery, valuable experience has been lost and fishing companies have adjusted their strategies. As a result, there has been very little activity in Area 3 and the last data gathered there shows a downward trend. Industry and resource managers, therefore, need to establish a basis for maintaining some presence in Area 3, so that the available time series of key data can be maintained, allowing for the valid application of existing management approaches.
600
500
400
300
200
100
0
taC
(M
t ta
il w
eigh
t)
south Coast roCk lobster taCs
Year
19
88
19
89
19
90
19
91
19
92
19
93
19
94
19
95
19
96
19
97
19
98
19
99
20
00
20
01
20
02
20
03
20
04
20
05
20
06
20
07
20
08
20
09
20
10
20
11
20
12
20
13
squid jigging industrY
In previous years the management of the squid industry, which is an effort managed fishery, has been dominated by concerns about latent effort levels. This precipitated an investigation into these same latent effort levels leading to the introduction of an additional closed season in the fishery. However, there were concerns about the reliability of the data that supported the additional closed seasons. A considerable debate has occurred around the data and the ensuing management action.
An important development in this debate was the revision of the Bayesian assessment model for the squid jigging fishery. This revision was carried out in 2010 using a new agreed dataset. The results of this revision suggested a more optimistic appraisal of the resource and, in particular, a position in which effort levels were presently sub-optimal. This removed much of the risk regarding the latent effort in the fishery, since, even if the latent effort was to be utilised, the sustainability of the fishery was assured within reasonable statistical measures. As a result, the additional closed seasons have been suspended for the 2011 and 2012 fishing seasons. New information is, however, becoming available, and a further revision of the Bayesian assessment model will take place in 2012. The sensitivity of this model to the acquisition of fresh data is still a matter of emerging practical experience; however, insofar as it overturned the rationale for the additional closed season in 2010, it remains possible that new data will cause a reversal of this new position.
In the interim, catch rates for squid have plummeted in 2012. Some operators report 2012 catch rates are only about 50% of levels experienced in 2011. On the positive side, these poor catch rates have led to increases in prices fetched on international markets. A scientific bottom trawl survey will take place in September of this year, and this may offer some insight into the status of squid biomass, and the poor performance of the fishery in 2012. However, this resource is predominantly based on recruitment to the fishery each year which is highly variable, so the most likely causal factor for the downturn is poor recruitment. In general, in such a situation one expects to see the occasional poor year of fishing.
3 Oceana Group Limited Scientific reports (Status and management of lobster and squid fishery 2012)
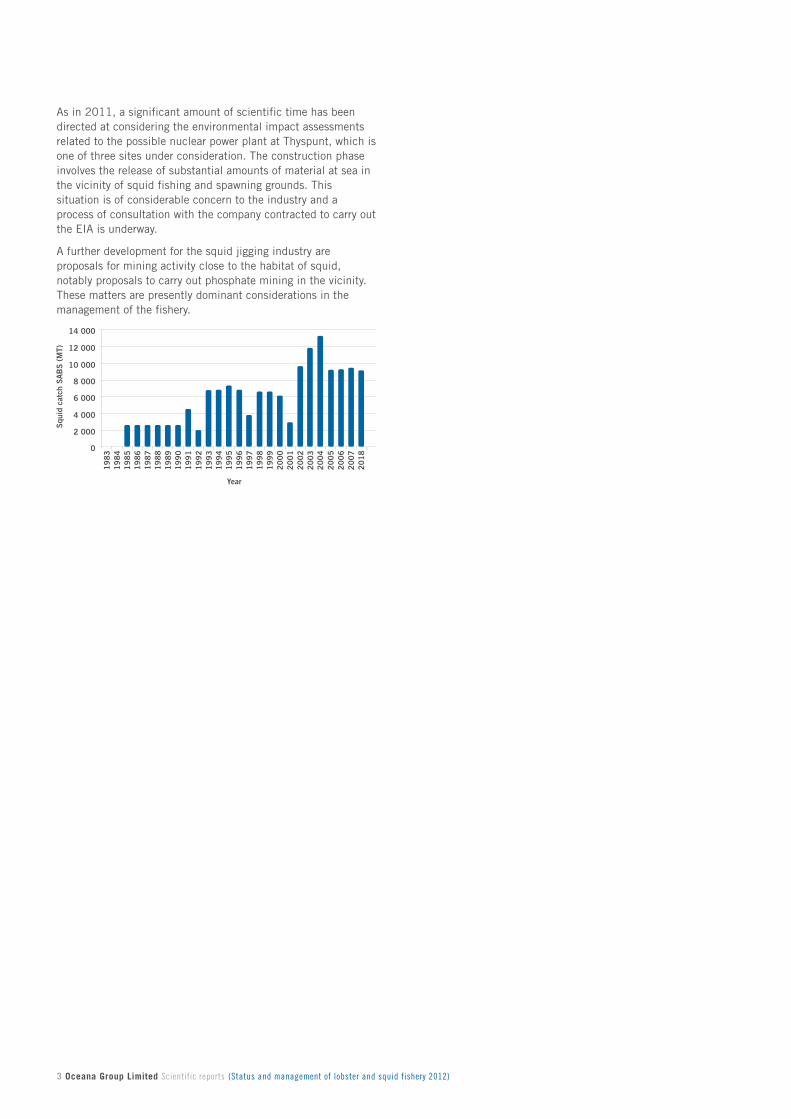
As in 2011, a significant amount of scientific time has been directed at considering the environmental impact assessments related to the possible nuclear power plant at Thyspunt, which is one of three sites under consideration. The construction phase involves the release of substantial amounts of material at sea in the vicinity of squid fishing and spawning grounds. This situation is of considerable concern to the industry and a process of consultation with the company contracted to carry out the EIA is underway.
A further development for the squid jigging industry are proposals for mining activity close to the habitat of squid, notably proposals to carry out phosphate mining in the vicinity. These matters are presently dominant considerations in the management of the fishery.
14 000
12 000
10 000
8 000
6 000
4 000
2 000
0
squ
id c
atch
sa
bs
(M
t)
Year
19
83
19
84
19
85
19
86
19
87
19
88
19
89
19
90
19
91
19
92
19
93
19
94
19
95
19
96
19
97
19
98
19
99
20
00
20
01
20
02
20
03
20
04
20
05
20
06
20
07
20
18