Status and Ecology of the Red-shouldered Hawk in Northern ... · Red-shouldered Hawk in Northern...
27
Status and Ecology of the Red-shouldered Hawk in Northern Michigan David Cuthrell, Christopher Weber, Helen Enander, and Joshua Cohen, Michigan Natural Features Inventory
Transcript of Status and Ecology of the Red-shouldered Hawk in Northern ... · Red-shouldered Hawk in Northern...

Status and Ecology of the Red-shouldered Hawk in Northern Michigan
David Cuthrell, Christopher Weber, Helen Enander, and Joshua Cohen, Michigan Natural Features Inventory

Red-shouldered Hawk (Buteo lineatus)

What is this plan?
• systematic surveys on state forest lands
• reconfirmation of historic nest sites
• monitoring of productivity at nest sites in each state forest area.

Objectives• Identify core areas of nest site
concentrations on state forest lands
• Identify areas that support long-term viable populations
• Evaluate the appropriate status of the hawk
• Facilitate development of management guidelines
• Begin to assess the impacts of forest management on habitat use and nest productivity

RSH Nest Search Methods


Nests by Stand Type (n = 524)
A66% P6
1%Q62%M5M7
2%B62%
M648%
M926%
E62%
W91%
M52%
O91%
E91%
E51%
A91%
C61%W71%R7O41%
A51%O80%O60%R90%R60%Q90%
W8M60%M8M50%
R8O70%
Relatively mature deciduousor mixed forest with associatedwetland habitat, ie., M6 or M9 in close proximity to a C6 or emergent marsh
Nesting Habitat
Forest stands with a closedcanopy (> 75%) and suitablesized trees with the right structure
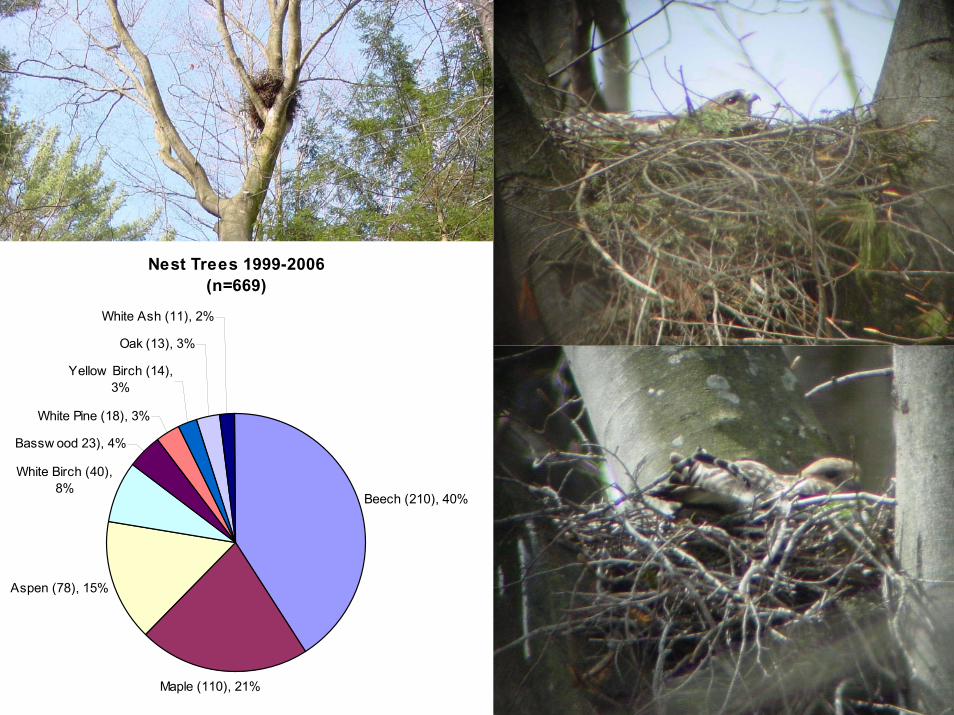
Nest Trees 1999-2006(n=669)
Beech (210), 40%
Maple (110), 21%
Aspen (78), 15%
White Birch (40), 8%
Bassw ood 23), 4%
White Pine (18), 3%
Yellow Birch (14), 3%
Oak (13), 3%
White Ash (11), 2%

Nest height 47.2 feet + 4 Distance to wetland 362m + 97Distance to upland opening 181m + 46

– Nest predation was confirmed (e.g., claw marks on trees, den tree nearby, nests torn apart, remains of adult hawk, etc.) for 10% of occupied nests between 1998 – 2006

Red-shouldered hawk prey-base

2001 Prey Items (n = 132)
Mammals50%
Birds1%
Herps14%
Invertebrates21%
Unknown14%
2002 Prey Items (n = 81)
Unknown 20%
Mammals 35%Birds 9%
Herps 30%
Invertebrates 6%

Results– The fate of over 500 active Red-shouldered Hawk
nests were followed over the course of this study
– The overall re-occupancy rate of territories during successive years of the study was high at 78% (range of 75% - 81%)
– Nest productivity among northern Michigan forest areas surveyed averaged 65% successful but was quite variable (range of 55 – 82)
– Average brood size (young per successful nest) from nest site data combined for all forest areas between the years of 1999 - 2006 was 2.05
– Average number of young per active nest between the years of 1999 - 2006 was 1.33

Red-shouldered Hawk Productivity in Northern Michigan 1999-2006
0.00
0.50
1.00
1.50
2.00
2.50
3.00
1999 2000 2001 2002 2003 2004 2005 2006
yng/successfulyng/active

Red-shouldered Hawk Productivity in Northern Michigan 1999-2006
0.00
0.50
1.00
1.50
2.00
2.50
3.00
1999 2000 2001 2002 2003 2004 2005 2006
yng/successfulyng/activeLinear (yng/active)Linear (yng/successful)
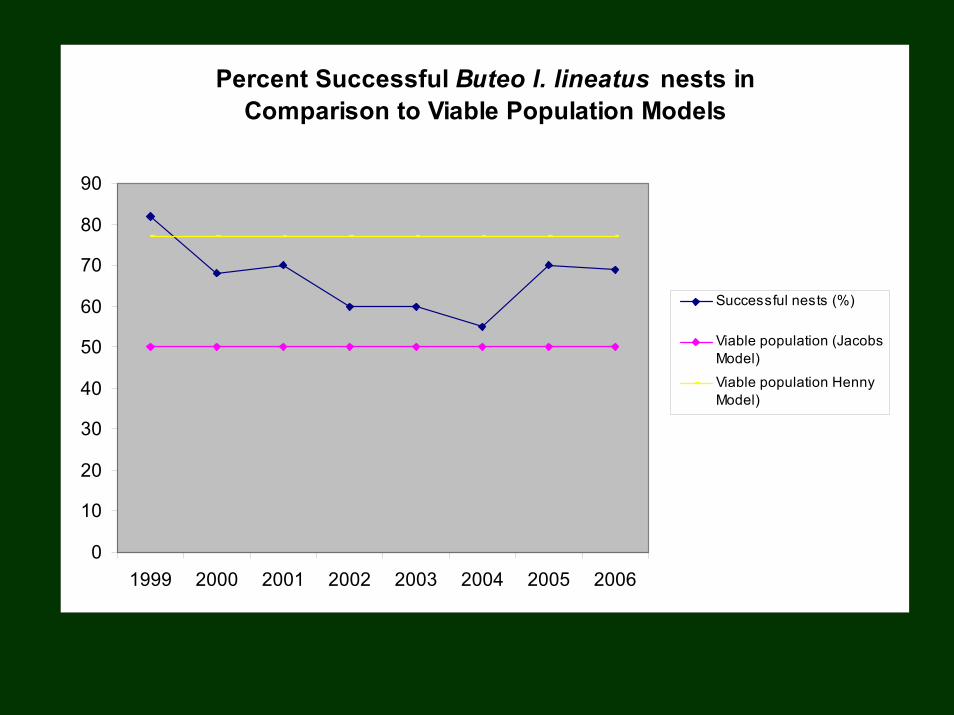
Percent Successful Buteo l. lineatus nests in Comparison to Viable Population Models
0
10
20
30
40
50
60
70
80
90
1999 2000 2001 2002 2003 2004 2005 2006
Successful nests (%)
Viable population (JacobsModel)
Viable population HennyModel)

Red-shouldered Hawk Productivity 1999-2006 in Comparison to Viable Population Models
0.00
0.50
1.00
1.50
2.00
2.50
1999 2000 2001 2002 2003 2004 2005 2006
yng/active
Viable Population(Jacobs Model)Viable Population (HennyModel)

Active Buteo l. lineatusTerritories vs Percentage of Successful Nests in the NLP of Michigan
0
20
40
60
80
100
120
1999
2000
2001
2002
2003
2004
2005
2006
Active territories
Successful nests(%)Predation Rates (%)

RSH Productivity by Tree Species - Young per Active Nest (n = 522)
00.20.40.60.8
11.21.41.61.8
Beech
(210
)Map
le (110
)Asp
en (78
)White
Birc
h (40)
Bassw
ood 23
)White
Pine (
18)
Yellow
Birc
h (14)
Oak (1
3)White
Ash
(11)

8169 67
61 6456
50
33
0102030405060708090
EasternUP
IndianRiver
Gladwin Gaylord TraverseCity
PigeonRiver
Atlanta Escanaba
Percent nest success by FA

1.61
1.36 1.331.25 1.19 1.12
1.04
0.50
0.000.200.400.600.801.001.201.401.601.80
Easter
n UP
Indian
Rive
r
Gladwin
Gaylor
dTrave
rse C
ityPige
on R
iver
Atlanta
Escan
aba
youn
g/ac
tive
nest

GIS Model
Suitable habitat in green24.6%
Unsuitable habitat in white75.4%
Used method 4 for LP andmethod 2 for the UP

Model was tested
Captured:
75% of the occurrencesin the UP
79% in the NLP
86% in SLP

Some things to consider:
• Minimize disturbance during the nesting season
• Manage large ecological units of hardwoods & associated wetlands
• Certain timber management practices are better than othersretain large trees for nesting habitatleave suitable structure around nestmaintain at least 70% canopy coverage abundance of prey species

Recommendations
• Maintain the Integrity of Large Tract Forests
• Implement Small-scale Clearcuts (less than 30 acres) to Maintain a Sustainable Forest
• Perform Logging Operations From mid-September through February to Avoid Disturbing Nesting RSH
• Continue Monitoring RSH Nesting Activity and Reproductive Success within Each FMU

Joe Jarecki, Rick McDonald, Kendal Phillips, Randy Heinze, Bill O’Neill, Steve Milford,
Tim Paulus, Tim Greco, Don Stacks, Shannon Harig,Tom Stone, Greg Gatsey, Kim Lentz, Rich Barta, Don Middlestat, Scott Lint, Ernie Houghton, Bob
Walters, Jim Bielecki, Cory Luoto, Amy Douglass, Matthew Edison, Jason Tokar, Karen Rodock, Brian
Woodring, Tim Gallagher, Tim Webb, and Steven Nyhoff
This project was funded by the MDNR, Forest, Minerals, and Fire Management (FMFM)
and Wildlife's Natural Heritage Small Grants Program
Many FMFM staff contributed significantly to the project

Many thanks to all the folks who helped out with field surveys:
Jeff Cooper, Arch Reeves, Yu Man Lee, Daria Hyde, Jennifer Olson, John Paskus,Josh Cohen, Seth Gallagher, Rebecca Rogers, Michael Fashoway, Michael Boranski,Lori Sargent, Coburn Currier, Matt Smar, Michael Sanders, Pete Badra, Sherry MacKinnon, Erin Victory, Kevin Gardiner, Judy Jarecki, Doug Mummert, Mark Ennis, Jackie andMark Schuler, Brian Mastenbrook, Michael Monfils, Michael Sanders, Kim Borland,Kerry Fitzpatrick, and Matt Herbert