StatKey: Online Tools for Bootstrap Intervals and Randomization Tests
20
StatKey: Online Tools for Bootstrap Intervals and Randomization Tests Kari Lock Morgan Department of Statistical Science Duke University Joint work with Robin Lock, Patti Frazer Lock, Eric Lock, Dennis Lock ICOTS 7/17/14
-
Upload
acton-cummings -
Category
Documents
-
view
57 -
download
0
description
StatKey: Online Tools for Bootstrap Intervals and Randomization Tests. Kari Lock Morgan Department of Statistical Science Duke University Joint work with Robin Lock, Patti Frazer Lock, Eric Lock, Dennis Lock ICOTS 7 /17/14. StatKey. - PowerPoint PPT Presentation
Transcript of StatKey: Online Tools for Bootstrap Intervals and Randomization Tests
StatKey: Online Tools for Bootstrap Intervals
and Randomization Tests
Kari Lock MorganDepartment of Statistical Science
Duke University
Joint work with Robin Lock, Patti Frazer Lock, Eric Lock, Dennis Lock
ICOTS7/17/14
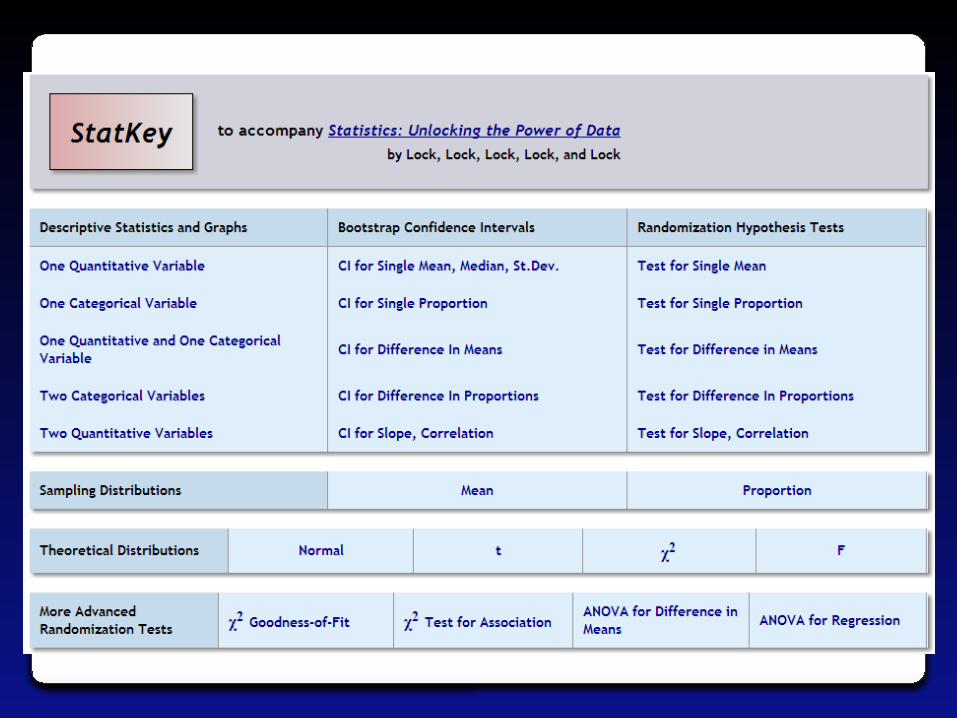
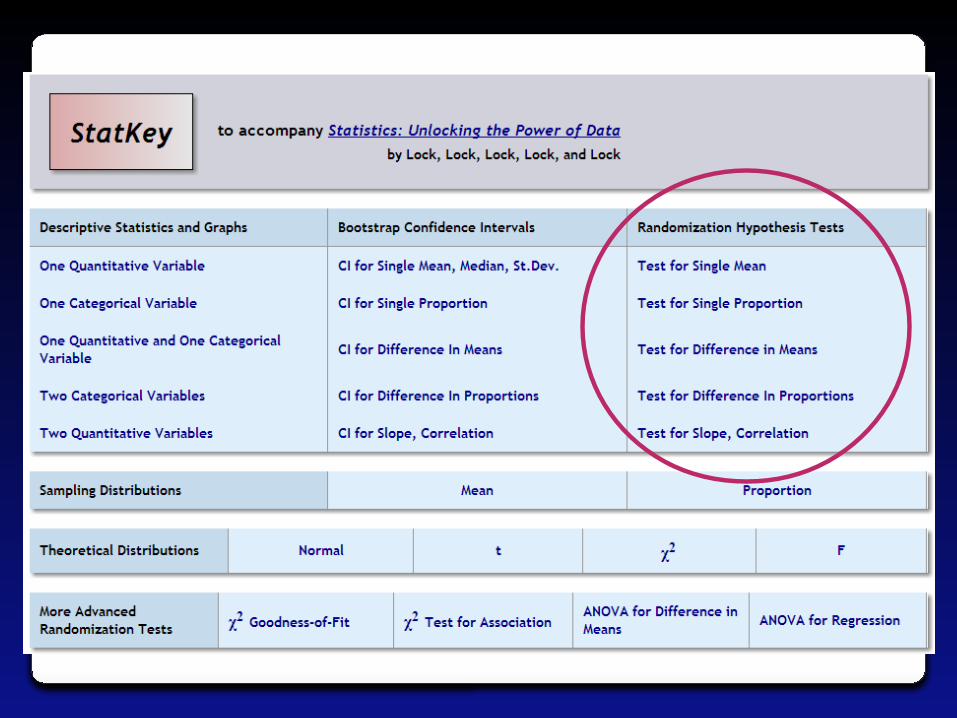
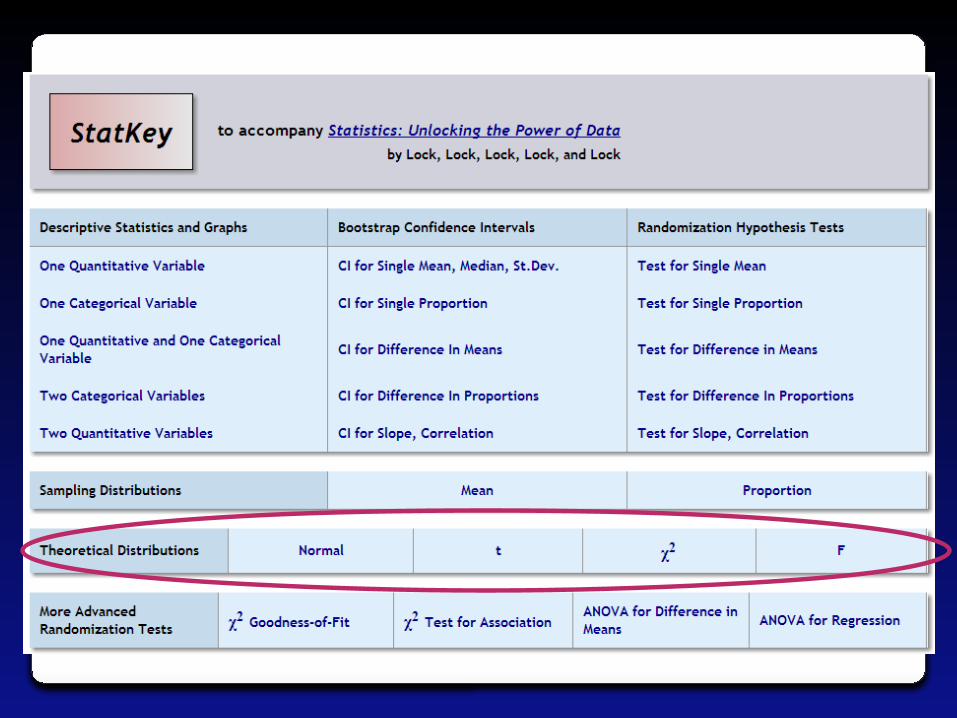
StatKeyA set of web-based, interactive, dynamic
statistics tools designed for teaching simulation-based methods at an
introductory level.
Freely available at www.lock5stat.com/statkey
No login requiredRuns in (almost) any browser (incl. smartphones) Google Chrome App available (no internet needed)Standalone or supplement to existing technology
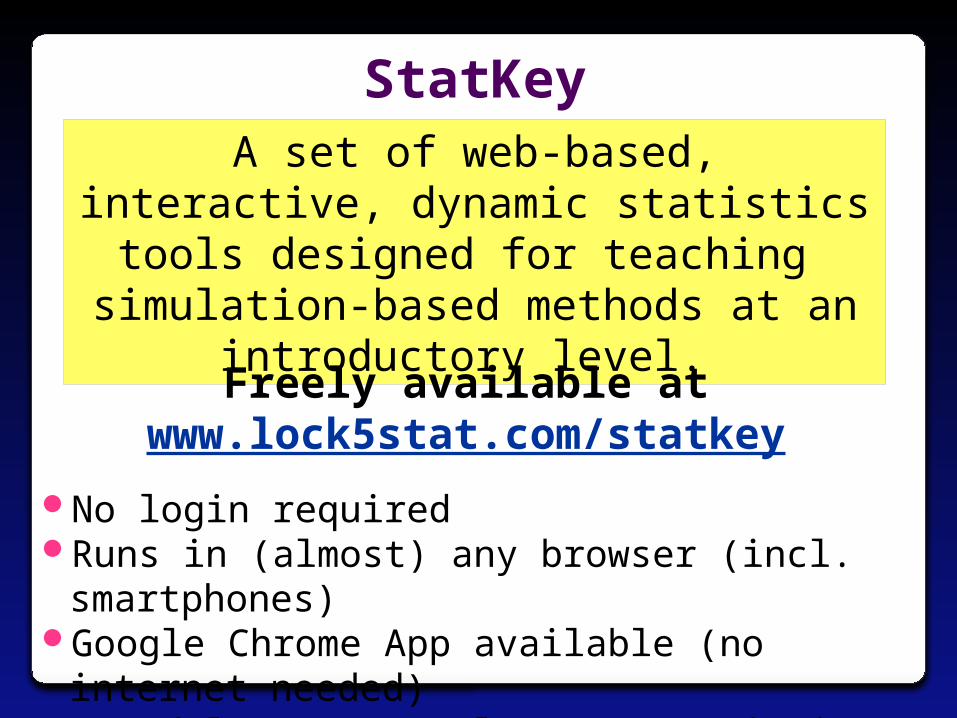
StatKey• Developed by the Lock5 team
• Developed for our book, Statistics: Unlocking the Power of Data (although can be used with any book)
• Programmed by Rich Sharp (Stanford), Ed Harcourt and Kevin Angstadt (St. Lawrence)
Wiley (2013)
Robin & PattiSt. Lawrence
DennisMiami Dolphins Kari
Duke / Penn State
Eric U Minnesota
StatKey Goals• Free
• Convenient
• Very easy-to-use
• Helps promote understanding
• For those who want to use simulation methods, technology should not be a limiting factor!
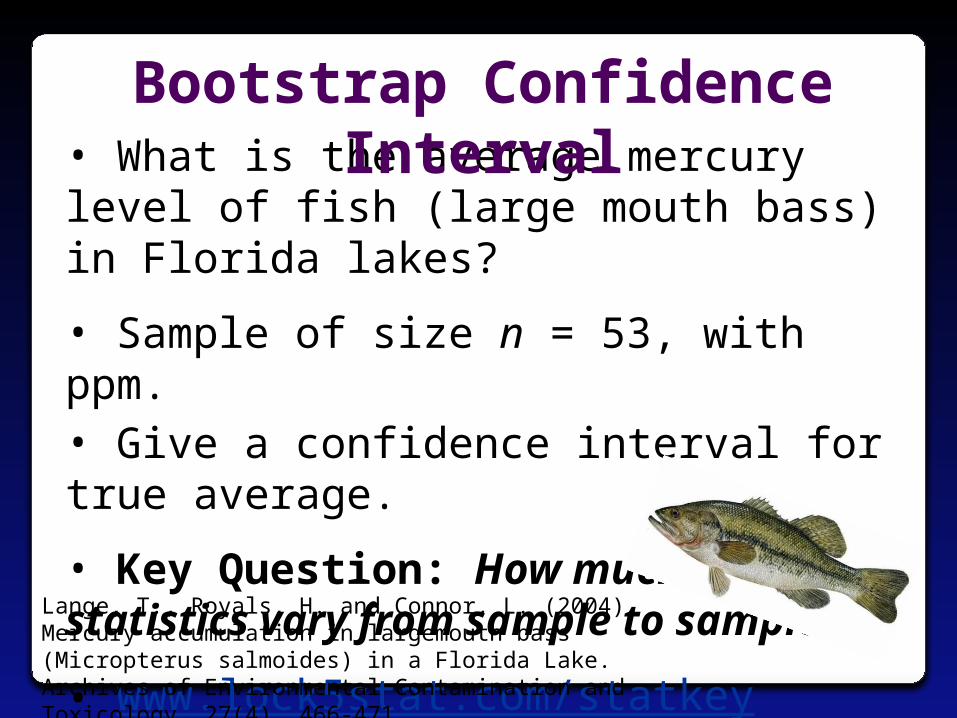
• What is the average mercury level of fish (large mouth bass) in Florida lakes?
• Sample of size n = 53, with ppm.• Give a confidence interval for true average.
• Key Question: How much can statistics vary from sample to sample?
• www.lock5stat.com/statkey
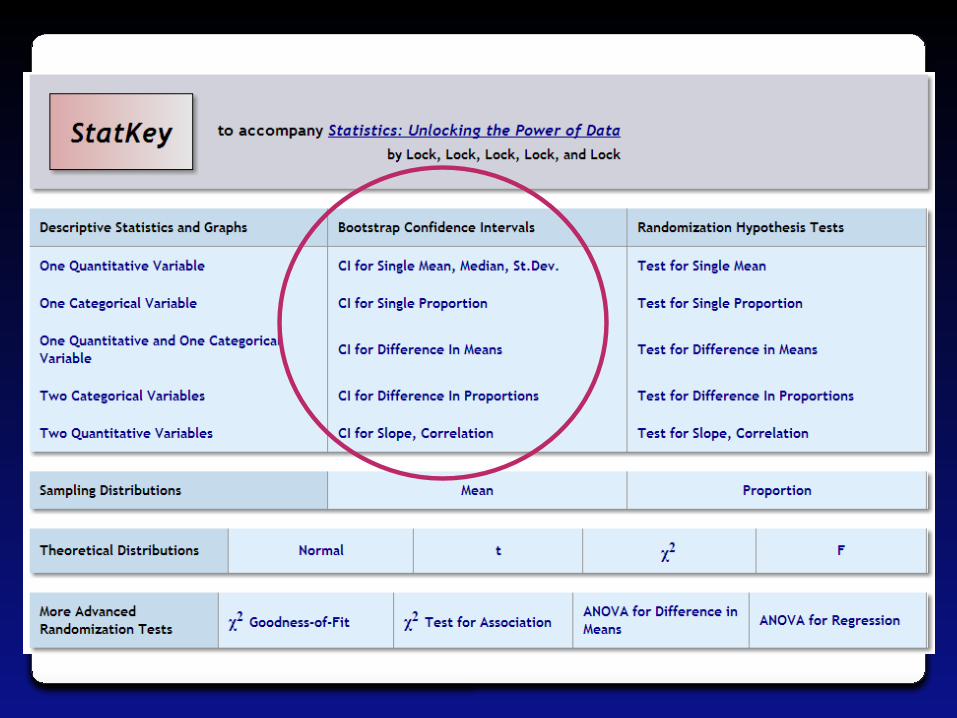
Bootstrap Confidence Interval
Lange, T., Royals, H. and Connor, L. (2004). Mercury accumulation in largemouth bass (Micropterus salmoides) in a Florida Lake. Archives of Environmental Contamination and Toxicology, 27(4), 466-471.
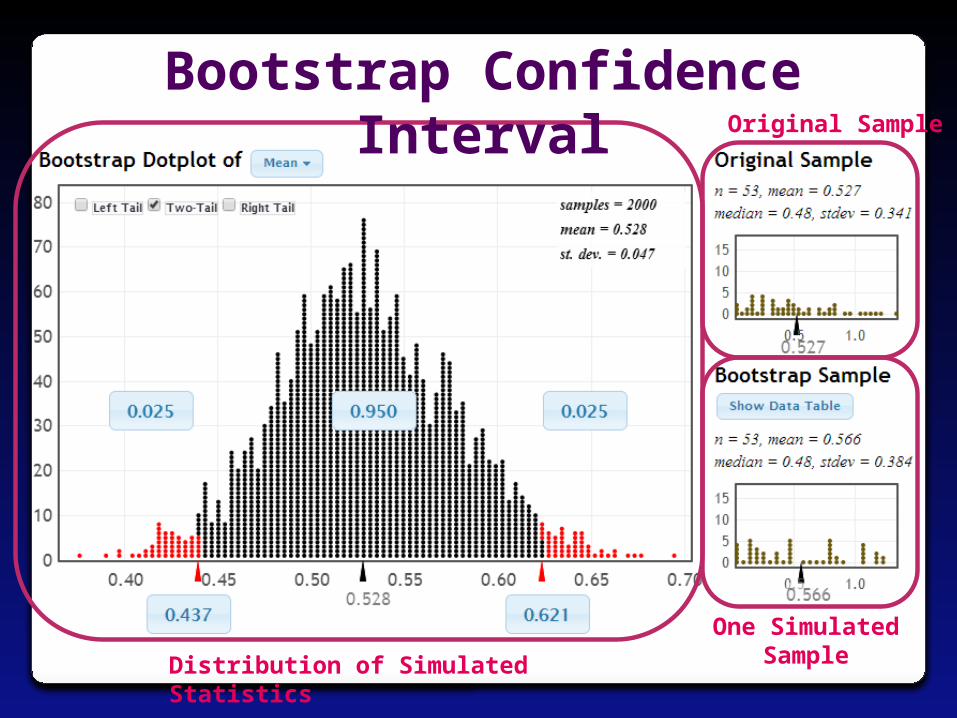
Original Sample
One Simulated SampleDistribution of Simulated Statistics
Bootstrap Confidence Interval
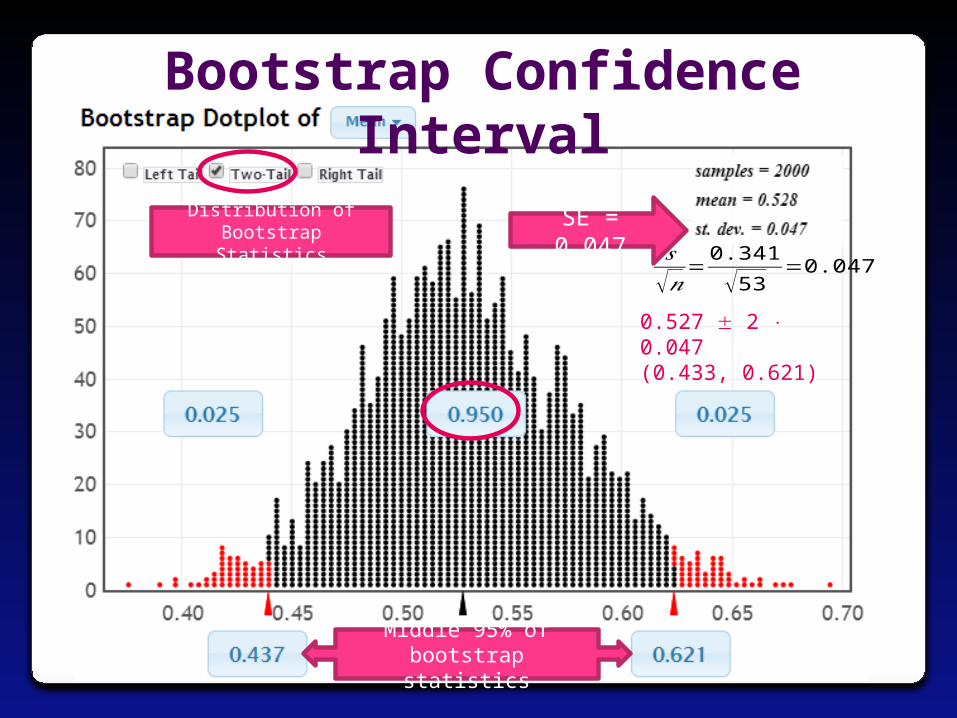
Bootstrap Confidence Interval
SE = 0.047Distribution of Bootstrap Statistics
0.527 2 0.047(0.433, 0.621)
Middle 95% of bootstrap statistics
𝑠√𝑛
=0.341
√53=0.047
CI for Proportion• Have you used simulation-based methods
(bootstrap confidence intervals or randomization tests) in your teaching?
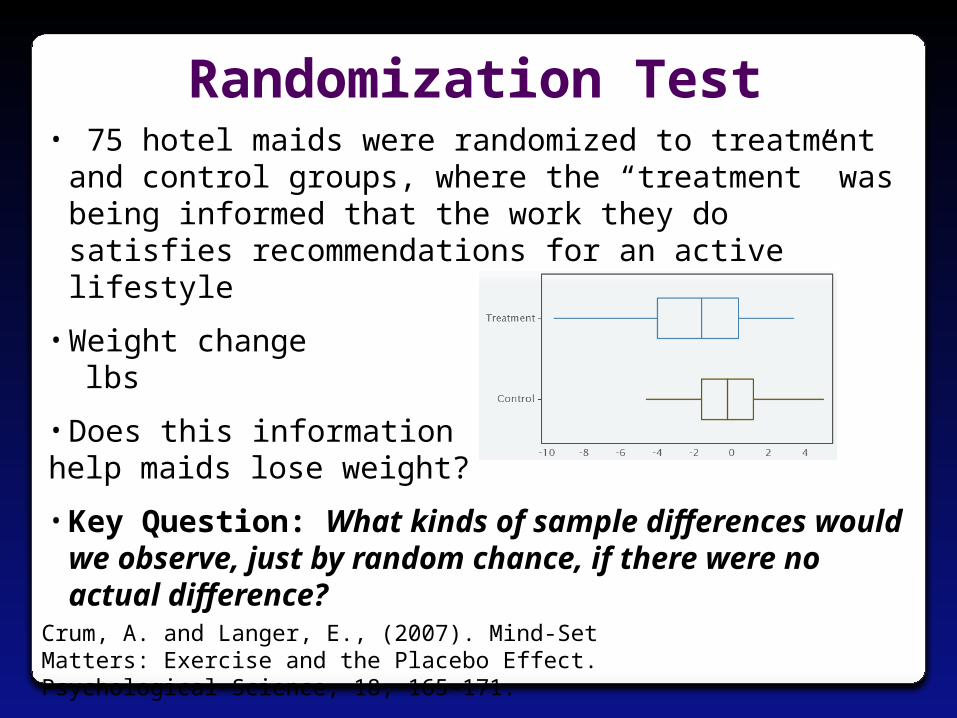
Randomization Test
Crum, A. and Langer, E., (2007). Mind-Set Matters: Exercise and the Placebo Effect. Psychological Science, 18, 165-171.
• 75 hotel maids were randomized to treatment and control groups, where the “treatment” was being informed that the work they do satisfies recommendations for an active lifestyle
• Weight change lbs
• Does this information help maids lose weight?
• Key Question: What kinds of sample differences would we observe, just by random chance, if there were no actual difference?
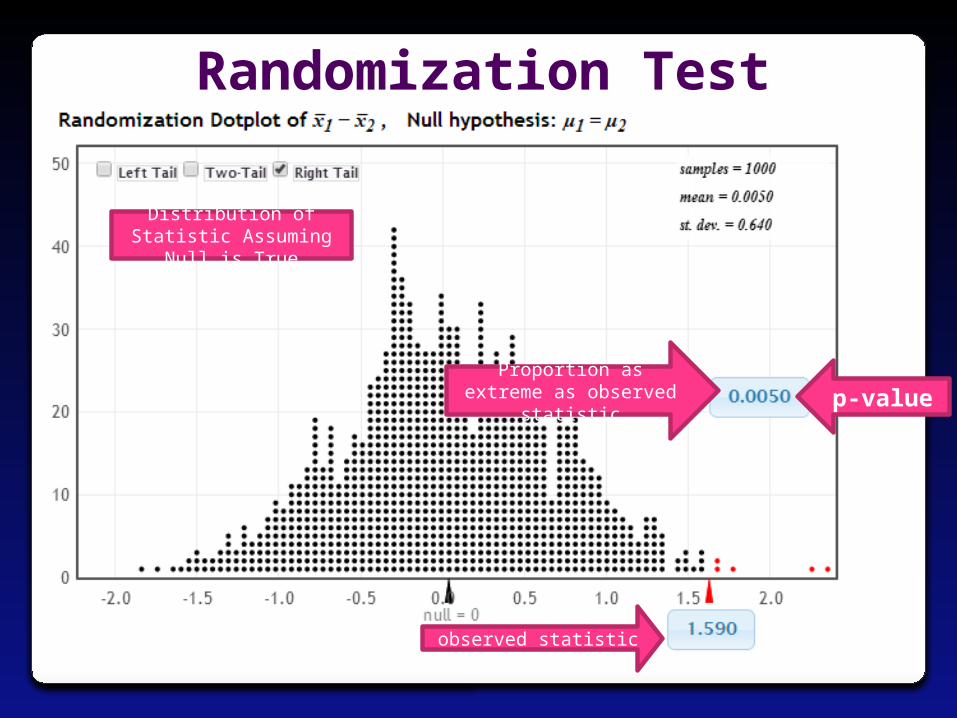
Randomization Test
p-valueProportion as extreme as observed statistic
observed statistic
Distribution of Statistic Assuming Null is True
3.0 3.5 4.0 4.5 5.0
-1.5
-1.0
-0.5
0.0
0.5
1.0
Malevolence Rating of Uniform
z-sc
ore
for
Pen
alty
Yar
ds
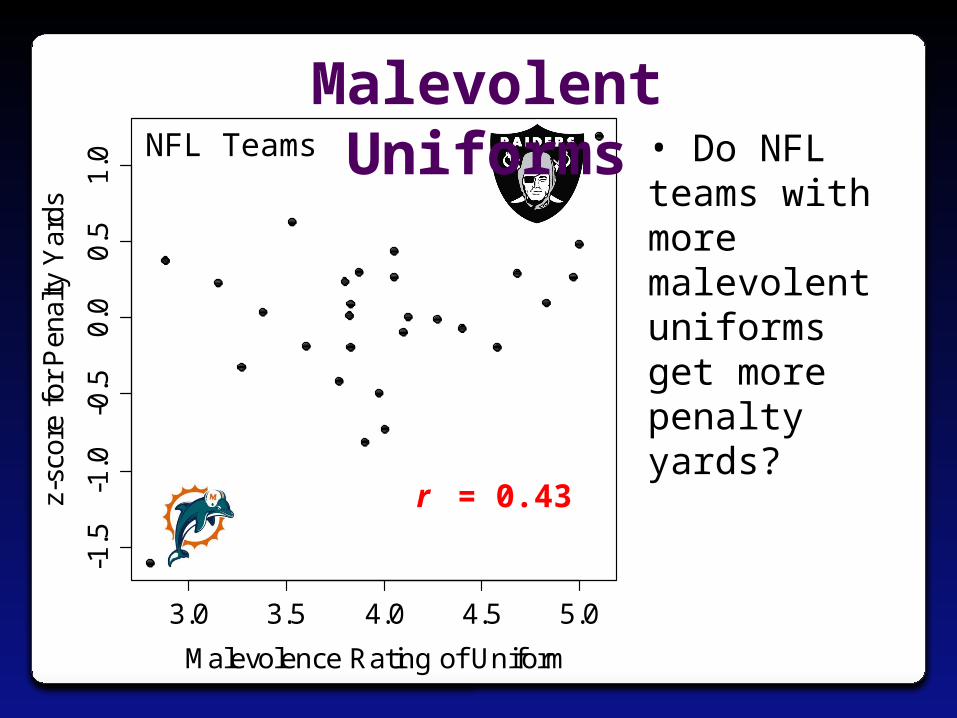
r = 0.43
NFL Teams
Malevolent Uniforms• Do NFL teams with more malevolent uniforms get more penalty yards?
• Ability to simulate one to many samples
• Helps students distinguish and keep straight the original data, a single simulated data set, and the distribution of simulated statistics
• Students have to interact with the bootstrap/randomization distribution – they have to know what to do with it
• Consistent interface for bootstrap intervals, randomization tests, theoretical distributions
StatKey Pedagogical Features

•Maid weight loss example:
• t-distribution
• df = 33
Theoretical Distributions
𝑡=𝑥1−𝑥2
√ 𝑠12𝑛1 + 𝑠22
𝑛2
=−0.2−(−1.79)
√ 2.32234+2.882
41
=2.65
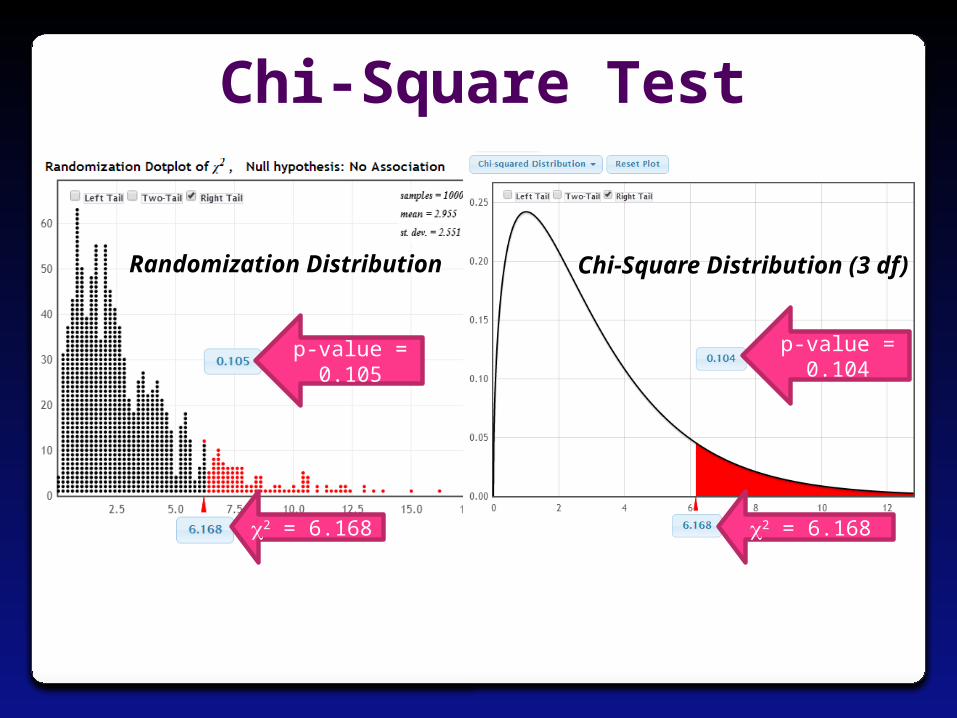
Chi-Square Test
Randomization Distribution Chi-Square Distribution (3 df)
p-value = 0.105
2 = 6.168
p-value = 0.104
2 = 6.168
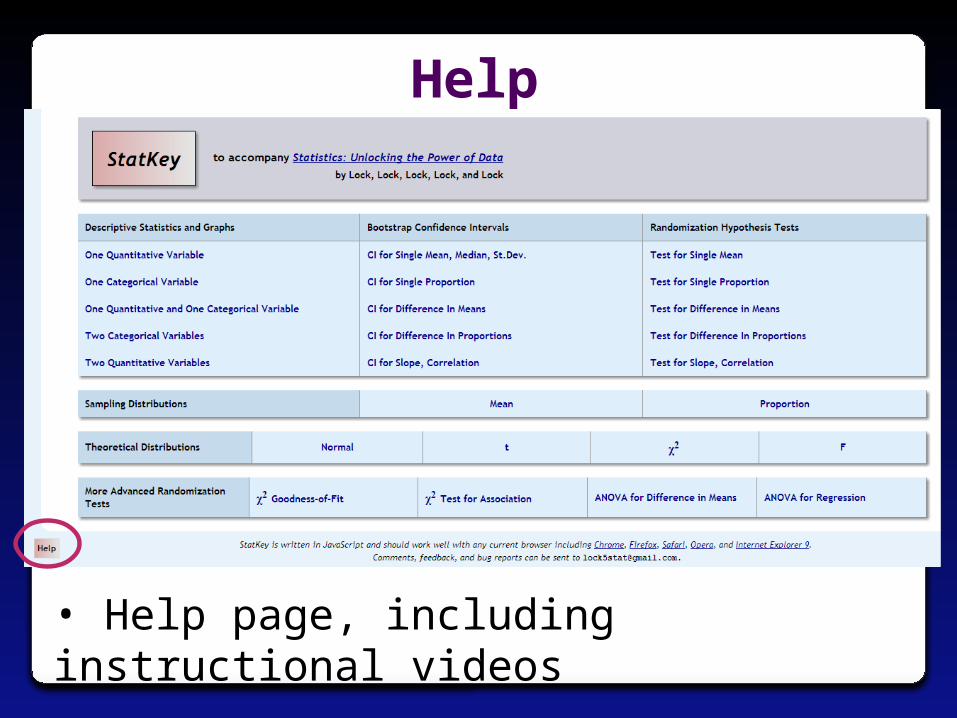
Help
• Help page, including instructional videos
Suggestions? Comments? Questions?
• You can email me at [email protected] or the whole Lock5 team at [email protected]


![[BOOK] [Bootstrap] [Awesome] Bootstrap-Programming-Cookbook](https://static.fdocuments.us/doc/165x107/577ca6bf1a28abea748c023f/book-bootstrap-awesome-bootstrap-programming-cookbook.jpg)