Statistics of slug flow subjected to wall transpiration
9
Turbulence, Heat and Mass Transfer 8 c 2015 Begell House, Inc. Statistics of slug flow subjected to wall transpiration F. J. S. Bandeira, J. B. R. Loureiro and A. P. Silva Freire Mechanical Engineering Program (PEM/COPPE/UFRJ) C.P. 68503,Rio de Janeiro, 21941-972, Brazil. [email protected] Abstract — The purpose of the present work is to investigate the changes on the statistical properties of horizontal slug flows caused by flow injection at the pipe wall. Measurements of turbulent flow in a horizontal slug flow subjected to wall transpiration are presented. Results include data on global flow rates and pressure drop, and on local mean and fluctuating velocity profiles. The properties of the two-phase flow are measured through a Shadow Sizer system and laser-based sensors. Two distinct flow transpiration rates are studied, v ++ w = v w /U m = 0.0005 and 0.001. The effects of flow transpiration seem to lead to bubble break-up and to changes in the slug frequency. In addition to the two-phase flow results, single-phase flow measurements are presented with a view to compare the different turbulent effects introduced by the second phase. 1. Introduction Turbulent flow in pipes with porous surfaces is a problem of great industrial interest. Typical ap- plications include the thermal protection of walls, filtration or the production of oil in horizontal or vertical wells. For laminar flow, the Navier-Stokes equations can be solved to unveil the dependence of the velocity components and the pressure on position coordinates, pipe dimensions and fluid properties. Berman (1953) proposed a classical solution for two-dimensional, incompressible, steady-flow in a channel. Other authors have examined Berman’s solution to consider pressure- dependent wall suction (Haldenwang, 2007) or the effect of slip boundary condition (Chellam and Liu, 2006). The above mentioned analyses consider symmetric flows in symmetric ducts. Extension of the solutions to circular pipes were provided, e.g., by Erdogan and Imrak (2005) and Tsangaris et al. (2007). For high Reynolds number flow, the search for analytical solutions in much complicated by the natural requirement of turbulence closure. Additionally, turbulent flow is known to be sensi- tive to wall roughness. For external flow, some authors have resorted (Stevenson 1963, Simpson 1970, Silva Freire 1988) to simple algebraic closure hypotheses and perturbation arguments to develop local analytical solutions for the fully turbulent region. These solutions exhibit bi- logarithmic terms and incorporate the effects of local Reynolds number and transpiration rate. One prominent feature is the dependence of an integration parameter on the transpiration rate. The underlying assumption of all the analytical methods is that flow transpiration at the wall is homogeneous. Some authors, however, have approached to problem differently. They consider distributed fluid injection, that is, isolated perforations, so that frictional losses are described through a decomposition of effects: wall friction, perforation friction and mixing ef- fects. Perforation friction is normally associated with an increase in roughness. The mixing effects are compared to the problem of multiple interacting jets in a cross flow. This approach results in such an intricate analysis that only external empirical evidence can be used to deter- mine the correct behavior of the friction contribution. Limited experimental works have been made for turbulent flow in porous pipes. The inves- tigation of Olson and Eckert (1966) described the effects of continuous mass injection at the
-
Upload
engenheirojarmeson -
Category
Documents
-
view
18 -
download
3
description
The purpose of the present work is to investigate the changes on the statistical properties of horizontalslug flows caused by flow injection at the pipe wall. Measurements of turbulent flow in a horizontal slug flowsubjected to wall transpiration are presented. Results include data on global flow rates and pressure drop, and onlocal mean and fluctuating velocity profiles. The properties of the two-phase flow are measured through a ShadowSizer system and laser-based sensors. Two distinct flow transpiration rates are studied, v++w = vw/Um = 0.0005 and0.001. The effects of flow transpiration seem to lead to bubble break-up and to changes in the slug frequency. Inaddition to the two-phase flow results, single-phase flow measurements are presented with a view to compare thedifferent turbulent effects introduced by the second phase.
Transcript of Statistics of slug flow subjected to wall transpiration
Turbulence, Heat and Mass Transfer 8c©2015 Begell House, Inc.
Statistics of slug flow subjected to wall transpirationF. J. S. Bandeira, J. B. R. Loureiro and A. P. Silva FreireMechanical Engineering Program (PEM/COPPE/UFRJ)C.P. 68503,Rio de Janeiro, 21941-972, Brazil.
Abstract — The purpose of the present work is to investigate the changes on the statistical properties of horizontalslug flows caused by flow injection at the pipe wall. Measurements of turbulent flow in a horizontal slug flowsubjected to wall transpiration are presented. Results include data on global flow rates and pressure drop, and onlocal mean and fluctuating velocity profiles. The properties of the two-phase flow are measured through a ShadowSizer system and laser-based sensors. Two distinct flow transpiration rates are studied, v++
w = vw/Um = 0.0005 and0.001. The effects of flow transpiration seem to lead to bubble break-up and to changes in the slug frequency. Inaddition to the two-phase flow results, single-phase flow measurements are presented with a view to compare thedifferent turbulent effects introduced by the second phase.
1. IntroductionTurbulent flow in pipes with porous surfaces is a problem of great industrial interest. Typical ap-plications include the thermal protection of walls, filtration or the production of oil in horizontalor vertical wells.
For laminar flow, the Navier-Stokes equations can be solved to unveil the dependence ofthe velocity components and the pressure on position coordinates, pipe dimensions and fluidproperties. Berman (1953) proposed a classical solution for two-dimensional, incompressible,steady-flow in a channel. Other authors have examined Berman’s solution to consider pressure-dependent wall suction (Haldenwang, 2007) or the effect of slip boundary condition (Chellamand Liu, 2006).
The above mentioned analyses consider symmetric flows in symmetric ducts. Extension ofthe solutions to circular pipes were provided, e.g., by Erdogan and Imrak (2005) and Tsangariset al. (2007).
For high Reynolds number flow, the search for analytical solutions in much complicated bythe natural requirement of turbulence closure. Additionally, turbulent flow is known to be sensi-tive to wall roughness. For external flow, some authors have resorted (Stevenson 1963, Simpson1970, Silva Freire 1988) to simple algebraic closure hypotheses and perturbation arguments todevelop local analytical solutions for the fully turbulent region. These solutions exhibit bi-logarithmic terms and incorporate the effects of local Reynolds number and transpiration rate.One prominent feature is the dependence of an integration parameter on the transpiration rate.
The underlying assumption of all the analytical methods is that flow transpiration at thewall is homogeneous. Some authors, however, have approached to problem differently. Theyconsider distributed fluid injection, that is, isolated perforations, so that frictional losses aredescribed through a decomposition of effects: wall friction, perforation friction and mixing ef-fects. Perforation friction is normally associated with an increase in roughness. The mixingeffects are compared to the problem of multiple interacting jets in a cross flow. This approachresults in such an intricate analysis that only external empirical evidence can be used to deter-mine the correct behavior of the friction contribution.
Limited experimental works have been made for turbulent flow in porous pipes. The inves-tigation of Olson and Eckert (1966) described the effects of continuous mass injection at the
Turbulence, Heat and Mass Transfer 8
wall in the shape of the velocity profile and in the pressure loss. Results on friction factor andeddy diffusivity were also discussed. Su and Gudmundsson (1998) and Ouyang et al. (1998)provided further experimental data; the latter authors, in particular, considered also two-phaseflows.
The purpose of the present work is to carry out reference experiments in horizontal pipeswith flow injection at the wall for single- and two-phase (slug) flow patterns. Measurementsof global flow rates and pressure drop are made for two different injection rates. In addition,the work presents local mean and fluctuating turbulent profiles obtained through Laser-DopplerAnemometry. The properties of the two-phase flow are measured through a Shadow Sizersystem and laser-based sensors. The validity of the law of resistance previously advanced byLoureiro and Silva Freire (2011) is investigated for both the single-phase and slug flows.
Important properties of slug flow including the passage frequency of unit cells (νt) and thelength (`) distribution of long bubbles have not been previously discussed in the literature. Theflow acceleration provoked by the wall injection of fluid and the very high levels of turbulenceobserved in the near wall region are bound to exert a large influence on both νt and `. Thesetwo aspects of the problem are reported here.
2. Theoretical backgroundThe law of resistance introduced in Loureiro and Silva Freire (2011) is valid for single-phaseflow and incorporates the effects of roughness and wall transpiration. The law is derived from aperturbation solution (see also Silva Freire (1988)); the main details of the derivation are shownnext.
2.1. Resistance law for smooth pipesThe friction coefficient λ can be defined by
(p1 − p2)L−1 = (λD−1)(2−1ρ)U2m, (1)
where D denotes the pipe diameter, Um is the mean flow velocity and L the length of a fluidcylinder.
For very large Reynolds numbers, the velocity distribution in the near wall fully turbulentregion is given by
uu−1∗ = κ−1 ln
(yu∗ν
−1)
+ A, (2)
where y is the wall distance, u∗ is the friction velocity (=√τw/ρ), κ (= 0.4) is von Karman’s
constant and A = 5.5.An integration of Eq. (16) over the cross-sectional area the pipe together with algebraic
manipulations gives the resistance law for smooth pipes,
(√λ)−1 = 2.035 log
(Re
√λ)− 0.8, (3)
with Re = UmDν−1.
2.2. Resistance law for smooth pipes with wall transpirationFor flow subject to wall transpiration, Eq. (3) is clearly not valid anymore. The result ofthe injection or suction of fluid into an oncoming flow is to modify the velocity distributionthroughout the boundary layer so that drag is either reduced or increased. Any expression
F. J. S. Bandeira, J.B.R. Loureiro and A. P. Silva Freire.
advanced with the purpose of determining the friction coefficient should therefore reflect this.Furthermore, an explicit dependence of Eq. (3) on the transpiration rate should be expected.
In Silva Freire (1988) the matched asymptotic expansions method was applied to the equa-tions of motion to find a law of the wall in which the additive parameter A varied with transpi-ration. The resulting expression is
u+ = κ−1 ln(y+)
+A+ Πκ−1W(yδ−1
)+ v+w
((2κ)−1 ln
(y+)
+ 2−1A)2
+ Π̃κ−1W(yδ−1
),
(4)with u+ = uu−1
∗ , y+ = yu∗ν−1, v+w = vwu−1∗ , vw = normal velocity at the wall and A is given by:
A = 5− 512(vwU−1), (5)
and parameters Π and Π̃ and function W are related to the universal wake function.An integration of Eq. (4) over the cross-sectional area of a pipe, gives
Um = U − 3.75u∗ − vw(1.86A+ 2.34 lnRe+2 − 5.47), (6)
with Re+ = Ru∗ν−1.Some further algebraic manipulations with
Umu∗−1 = 2
√2(√λ)−1, (7)
give
1 =√λ(2√
2)−1(2, 5 ln(Re+) + A− 3, 75)
+ v++w (1, 56 ln2(Re+) + (1, 25A− 4, 68) ln(Re+) + 4−1A2 + 1, 86A+ 5, 47),
(8)
where
v++w = vwUm
−1 and Re+ = (UmDν−1)(4
√2−1√
λ). (9)
The transcedental equation, Eq. (8), gives λ for given Re+ and v++w .
2.3. Resistance law for rough pipesThe law of resistance for flow in a rough pipe was shown by Nikuradse 1933 to have the form
uu∗−1 = κ−1 ln
(yks
−1)
+B, (10)
where ks is a characteristic length of the roughness and B = 8.5 (completely rough regime).In fact, B was shown to be a function of Rek (= ksu∗ν−1). The behaviour of B for the three
types of flow regime discussed by Nikuradse 1933 has been studied by several authors. Forexample, Ligrani & Moffat 1986 suggest the following functional dependence
B = 8.5σ + (1− σ)κ−1 ln (Rek) + (1− σ)C, (11)
where Rek = ksu∗/ν, C = 5.1 and σ = sin((1/2)πg) with
g = ln(RekRe
−1k,s
) (ln(Rek,rRe
−1k,s
))−1, (12)
Rek,s = 5, Rek,r = 70 and this approximation is valid in 5 ≤ Rek ≤ 70.
Turbulence, Heat and Mass Transfer 8
The resistance formula for flow in a rough pipe can be obtained by integrating Eq. (10) overthe cross-sectional area of a pipe. The result is
λ = [0.88 ln(Rk−1s ) + 0.35B − 1.33]−2. (13)
A comparison of Eq. (13) with the experiments of Nikuradse shows that for a fully roughregime the ln additive term should be replaced by 1.74.
2.4. Resistance law for rough pipes with wall transpirationA law of resistance for rough pipes with wall transpiration can now be deduced provided theresults of the previous sections are taken into account. Let us define Re+ = R/ks and Ak = B -512 v++
w . It follows immediately from Eqs. (8) and (13) that
1 =√λ(2√
2)−1(2.5 ln(Rk−1s ) + Ak − 3.75) + v++
w (1.56 ln2(Rk−1s )
+ (1.25Ak − 4.68) ln(Rk−1s ) + 4 − 1A2
k + 1.86Ak + 5.47).(14)
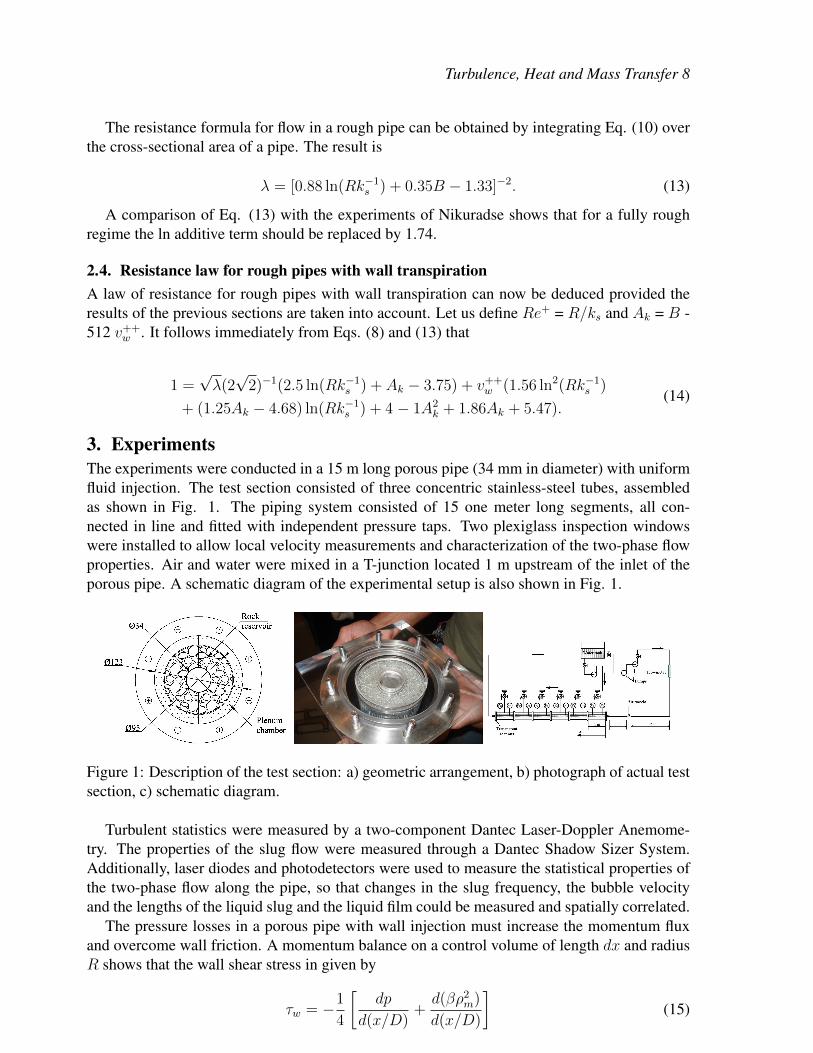
3. ExperimentsThe experiments were conducted in a 15 m long porous pipe (34 mm in diameter) with uniformfluid injection. The test section consisted of three concentric stainless-steel tubes, assembledas shown in Fig. 1. The piping system consisted of 15 one meter long segments, all con-nected in line and fitted with independent pressure taps. Two plexiglass inspection windowswere installed to allow local velocity measurements and characterization of the two-phase flowproperties. Air and water were mixed in a T-junction located 1 m upstream of the inlet of theporous pipe. A schematic diagram of the experimental setup is also shown in Fig. 1.
Figure 1: Description of the test section: a) geometric arrangement, b) photograph of actual testsection, c) schematic diagram.
Turbulent statistics were measured by a two-component Dantec Laser-Doppler Anemome-try. The properties of the slug flow were measured through a Dantec Shadow Sizer System.Additionally, laser diodes and photodetectors were used to measure the statistical properties ofthe two-phase flow along the pipe, so that changes in the slug frequency, the bubble velocityand the lengths of the liquid slug and the liquid film could be measured and spatially correlated.
The pressure losses in a porous pipe with wall injection must increase the momentum fluxand overcome wall friction. A momentum balance on a control volume of length dx and radiusR shows that the wall shear stress in given by
τw = −1
4
[dp
d(x/D)+d(βρ2m)
d(x/D)
](15)

F. J. S. Bandeira, J.B.R. Loureiro and A. P. Silva Freire.
where β, the momentum flux factor, is the ratio of the real momentum flux through a given crosssection to that based on one-dimensional flow at the mean velocity.
In our estimates, β was found to be 1.06.
4. Results and discussion4.1. Single-phase flowThe roughness length (ks) of the producing pipe was determined from the single-phase waterflow with no injection at the wall. Various experiments with Reynolds number varying from6,000 to 100,000 were performed to find ks (= 0.000334 m). Two distinct flow transpirationrates are studied, v++
w = vw/Um = 0.0005 and 0.001.To investigate the logarithmic character of the velocity profile, Eq. (4) is re-written in the
form
Φ = 2(v+w )−1[(v+wu
+ + 1)1/2 − 1
]= κ−1 ln y+ + A (16)
For the single-phase flow case, the mean velocity profile for all transpiration rates are shownin Fig. 2a according to the coordinates defined by Eq. (16). The existence of a bi-logarithmicregion is evident, with the level of the log-region decreasing as vw increases. The agreementprovided by the predictions of Eq. (14) with the experimental data is very good despite the factthat the parameters in Eq. (14) were not particularly adjusted to fit the present experimentaldata. The values of the constants are the values presented in Loureiro and Silva Freire (2011),based entirely in the analysis of Silva Freire (1988).
Figure 2: Comparison between the results for unblown case and for the two different transpira-tion rates studied: a) logarithmic mean velocity distributions, b) pressure drop distributions.
4.2. Two-phase flowRegarding the two-phase flow experiments, mean velocity profiles for the liquid phase for twodifferent injection rates are shown in Fig. 3a. For the same injection velocity, the single- andtwo-phase velocity profiles correspond to flows with about the same top centerline velocity.The presence of the gas phase makes the liquid velocity profiles less full, as expected. Theinjection of fluid through the wall clearly modifies the velocity distribution, reducing the wallshear stress.
The streamwise velocity fluctuations are shown in Fig. 3b. The presence of bubbles in theflow naturally increases its degree of agitation, with a corresponding increase in longitudinal
Turbulence, Heat and Mass Transfer 8
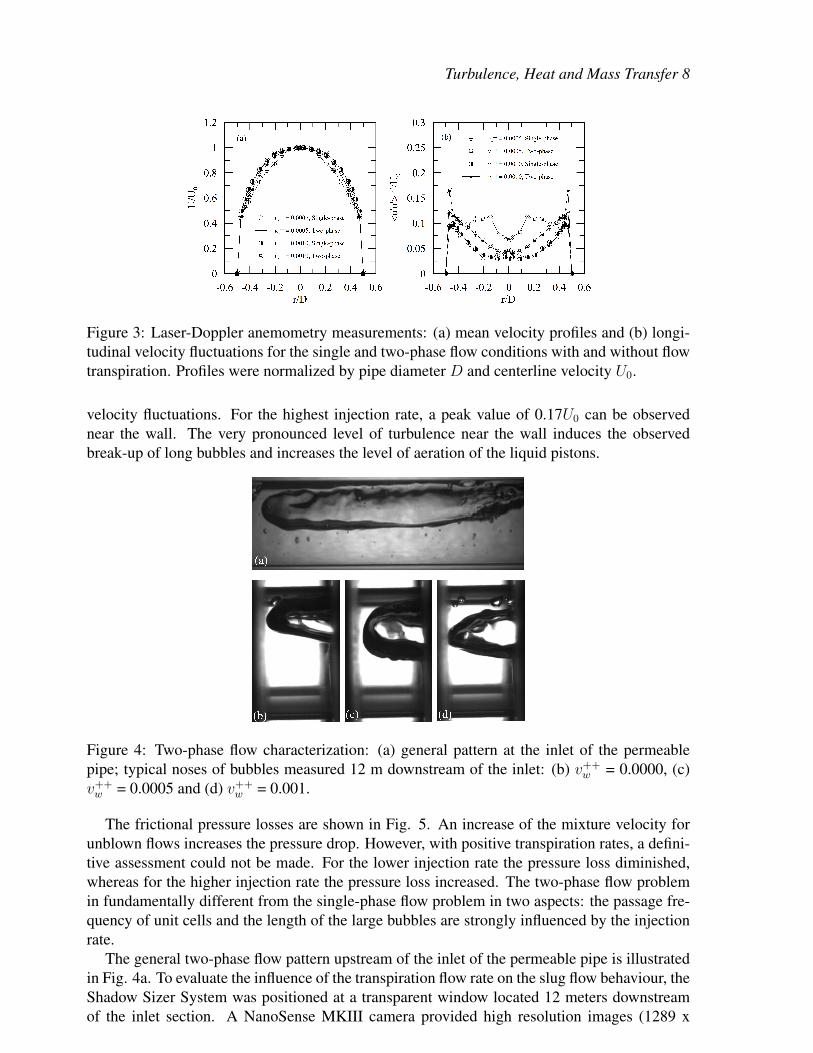
Figure 3: Laser-Doppler anemometry measurements: (a) mean velocity profiles and (b) longi-tudinal velocity fluctuations for the single and two-phase flow conditions with and without flowtranspiration. Profiles were normalized by pipe diameter D and centerline velocity U0.
velocity fluctuations. For the highest injection rate, a peak value of 0.17U0 can be observednear the wall. The very pronounced level of turbulence near the wall induces the observedbreak-up of long bubbles and increases the level of aeration of the liquid pistons.
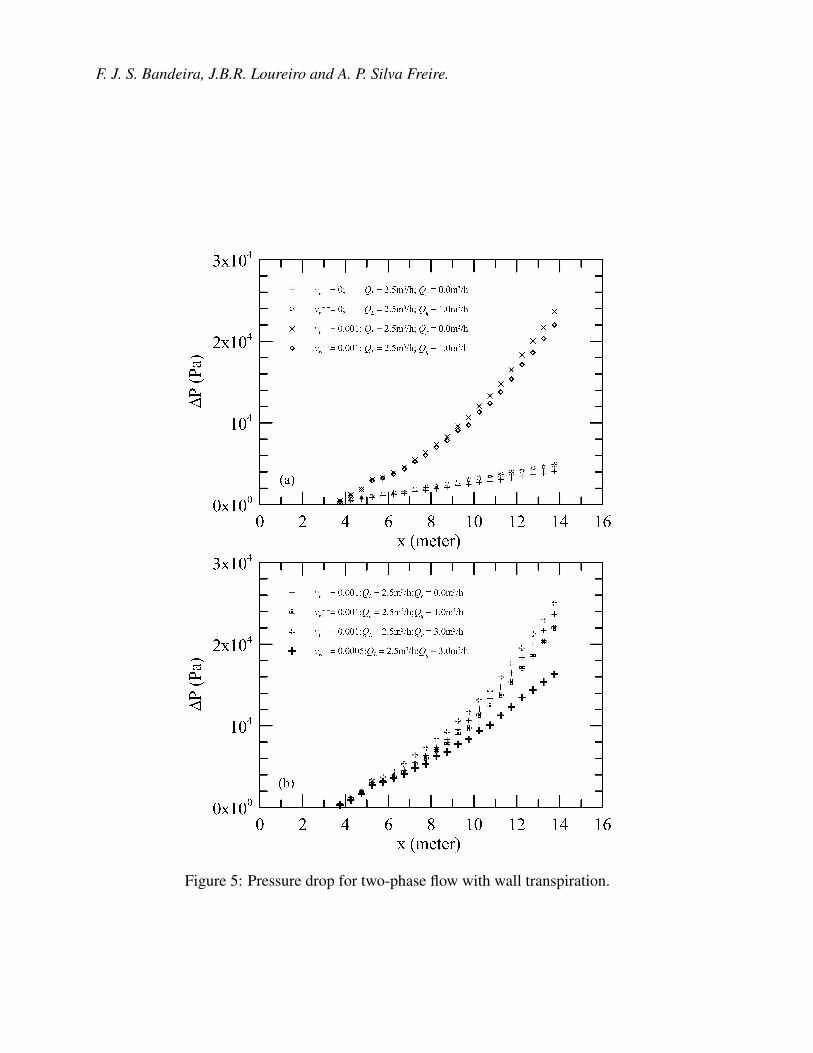
Figure 4: Two-phase flow characterization: (a) general pattern at the inlet of the permeablepipe; typical noses of bubbles measured 12 m downstream of the inlet: (b) v++
w = 0.0000, (c)v++w = 0.0005 and (d) v++
w = 0.001.
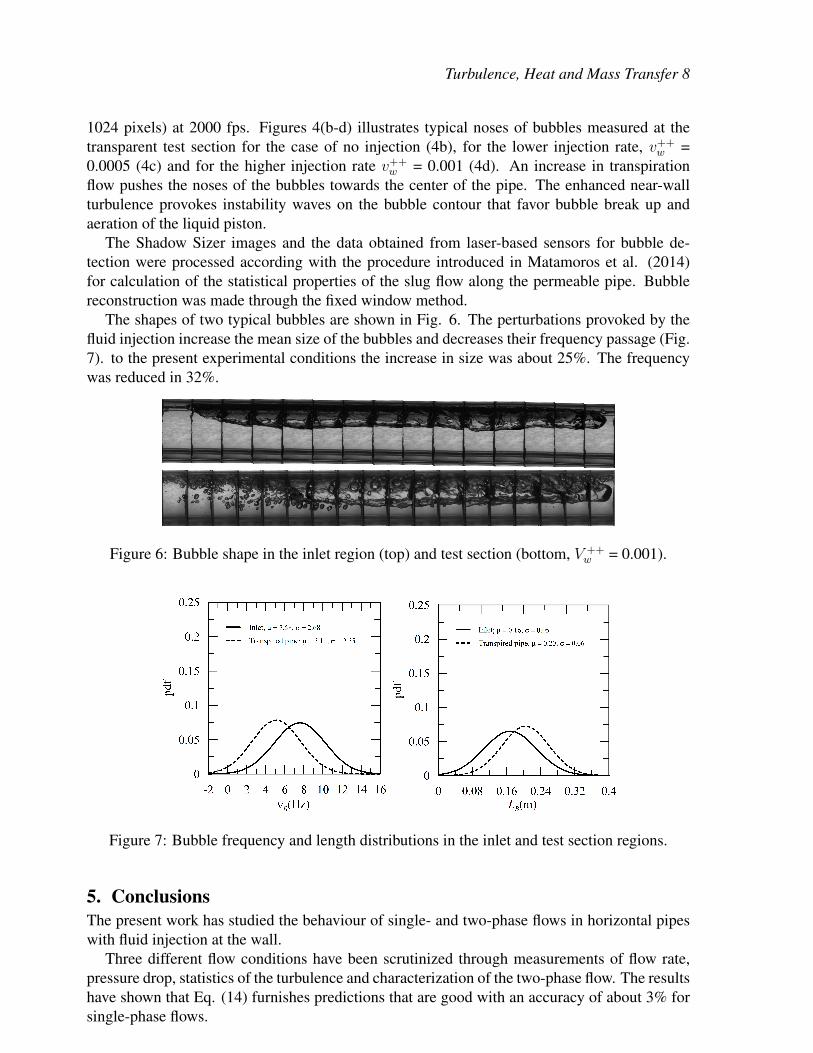
The frictional pressure losses are shown in Fig. 5. An increase of the mixture velocity forunblown flows increases the pressure drop. However, with positive transpiration rates, a defini-tive assessment could not be made. For the lower injection rate the pressure loss diminished,whereas for the higher injection rate the pressure loss increased. The two-phase flow problemin fundamentally different from the single-phase flow problem in two aspects: the passage fre-quency of unit cells and the length of the large bubbles are strongly influenced by the injectionrate.
The general two-phase flow pattern upstream of the inlet of the permeable pipe is illustratedin Fig. 4a. To evaluate the influence of the transpiration flow rate on the slug flow behaviour, theShadow Sizer System was positioned at a transparent window located 12 meters downstreamof the inlet section. A NanoSense MKIII camera provided high resolution images (1289 x
F. J. S. Bandeira, J.B.R. Loureiro and A. P. Silva Freire.
Figure 5: Pressure drop for two-phase flow with wall transpiration.
Turbulence, Heat and Mass Transfer 8
1024 pixels) at 2000 fps. Figures 4(b-d) illustrates typical noses of bubbles measured at thetransparent test section for the case of no injection (4b), for the lower injection rate, v++
w =0.0005 (4c) and for the higher injection rate v++
w = 0.001 (4d). An increase in transpirationflow pushes the noses of the bubbles towards the center of the pipe. The enhanced near-wallturbulence provokes instability waves on the bubble contour that favor bubble break up andaeration of the liquid piston.
The Shadow Sizer images and the data obtained from laser-based sensors for bubble de-tection were processed according with the procedure introduced in Matamoros et al. (2014)for calculation of the statistical properties of the slug flow along the permeable pipe. Bubblereconstruction was made through the fixed window method.
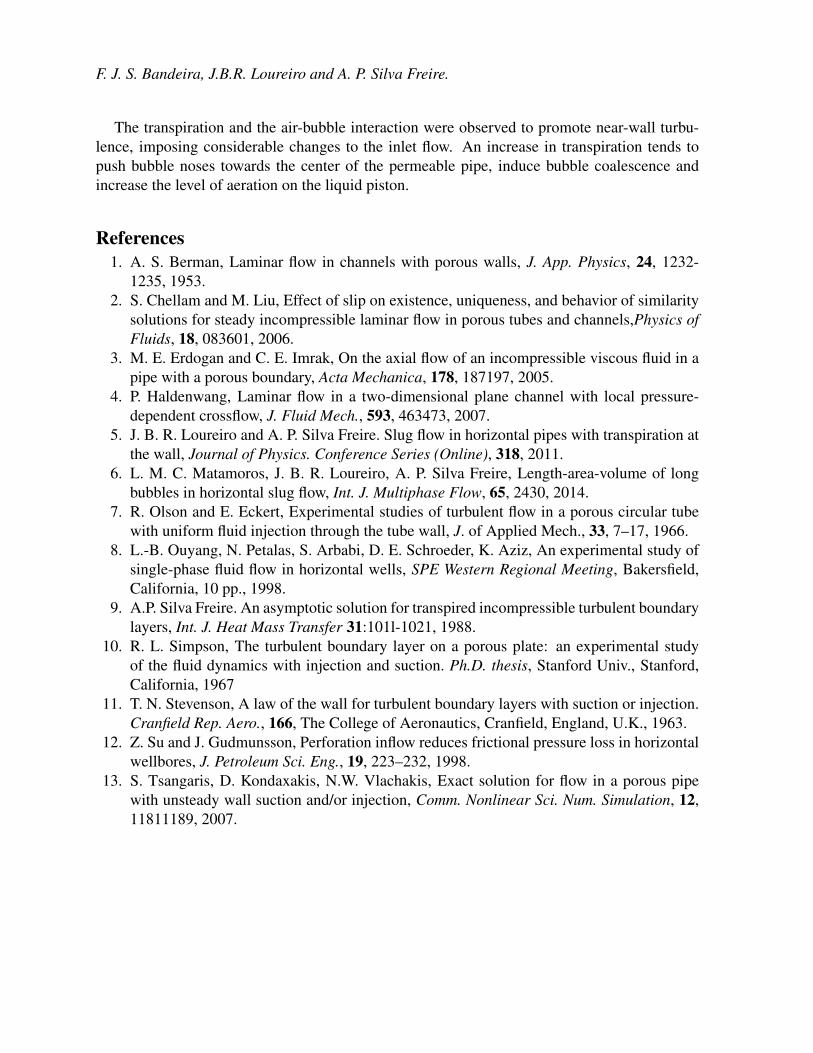
The shapes of two typical bubbles are shown in Fig. 6. The perturbations provoked by thefluid injection increase the mean size of the bubbles and decreases their frequency passage (Fig.7). to the present experimental conditions the increase in size was about 25%. The frequencywas reduced in 32%.
Figure 6: Bubble shape in the inlet region (top) and test section (bottom, V ++w = 0.001).
Figure 7: Bubble frequency and length distributions in the inlet and test section regions.
5. ConclusionsThe present work has studied the behaviour of single- and two-phase flows in horizontal pipeswith fluid injection at the wall.
Three different flow conditions have been scrutinized through measurements of flow rate,pressure drop, statistics of the turbulence and characterization of the two-phase flow. The resultshave shown that Eq. (14) furnishes predictions that are good with an accuracy of about 3% forsingle-phase flows.
F. J. S. Bandeira, J.B.R. Loureiro and A. P. Silva Freire.
The transpiration and the air-bubble interaction were observed to promote near-wall turbu-lence, imposing considerable changes to the inlet flow. An increase in transpiration tends topush bubble noses towards the center of the permeable pipe, induce bubble coalescence andincrease the level of aeration on the liquid piston.
References1. A. S. Berman, Laminar flow in channels with porous walls, J. App. Physics, 24, 1232-
1235, 1953.2. S. Chellam and M. Liu, Effect of slip on existence, uniqueness, and behavior of similarity
solutions for steady incompressible laminar flow in porous tubes and channels,Physics ofFluids, 18, 083601, 2006.
3. M. E. Erdogan and C. E. Imrak, On the axial flow of an incompressible viscous fluid in apipe with a porous boundary, Acta Mechanica, 178, 187197, 2005.
4. P. Haldenwang, Laminar flow in a two-dimensional plane channel with local pressure-dependent crossflow, J. Fluid Mech., 593, 463473, 2007.
5. J. B. R. Loureiro and A. P. Silva Freire. Slug flow in horizontal pipes with transpiration atthe wall, Journal of Physics. Conference Series (Online), 318, 2011.
6. L. M. C. Matamoros, J. B. R. Loureiro, A. P. Silva Freire, Length-area-volume of longbubbles in horizontal slug flow, Int. J. Multiphase Flow, 65, 2430, 2014.
7. R. Olson and E. Eckert, Experimental studies of turbulent flow in a porous circular tubewith uniform fluid injection through the tube wall, J. of Applied Mech., 33, 7–17, 1966.
8. L.-B. Ouyang, N. Petalas, S. Arbabi, D. E. Schroeder, K. Aziz, An experimental study ofsingle-phase fluid flow in horizontal wells, SPE Western Regional Meeting, Bakersfield,California, 10 pp., 1998.
9. A.P. Silva Freire. An asymptotic solution for transpired incompressible turbulent boundarylayers, Int. J. Heat Mass Transfer 31:101l-1021, 1988.
10. R. L. Simpson, The turbulent boundary layer on a porous plate: an experimental studyof the fluid dynamics with injection and suction. Ph.D. thesis, Stanford Univ., Stanford,California, 1967
11. T. N. Stevenson, A law of the wall for turbulent boundary layers with suction or injection.Cranfield Rep. Aero., 166, The College of Aeronautics, Cranfield, England, U.K., 1963.
12. Z. Su and J. Gudmunsson, Perforation inflow reduces frictional pressure loss in horizontalwellbores, J. Petroleum Sci. Eng., 19, 223–232, 1998.
13. S. Tsangaris, D. Kondaxakis, N.W. Vlachakis, Exact solution for flow in a porous pipewith unsteady wall suction and/or injection, Comm. Nonlinear Sci. Num. Simulation, 12,11811189, 2007.