Statistics of Illumination Beth Chance Roxy Peck Cal Poly, San Luis Obispo.
57
Statistics of Illumination Beth Chance Roxy Peck Cal Poly, San Luis Obispo
-
Upload
madlyn-walker -
Category
Documents
-
view
216 -
download
1
Transcript of Statistics of Illumination Beth Chance Roxy Peck Cal Poly, San Luis Obispo.

Statistics of Illumination
Beth Chance
Roxy Peck
Cal Poly, San Luis Obispo
STATISTICS SAY… Increasingly daily life involves
statistical information– interpretations of graphical and numerical
summaries – comparisons of groups– poll results from random samples– conclusions from randomized experiments– predictions of future outcomes
Most people use statistics as a drunkard uses a
lamppost- more for support than
for illumination.
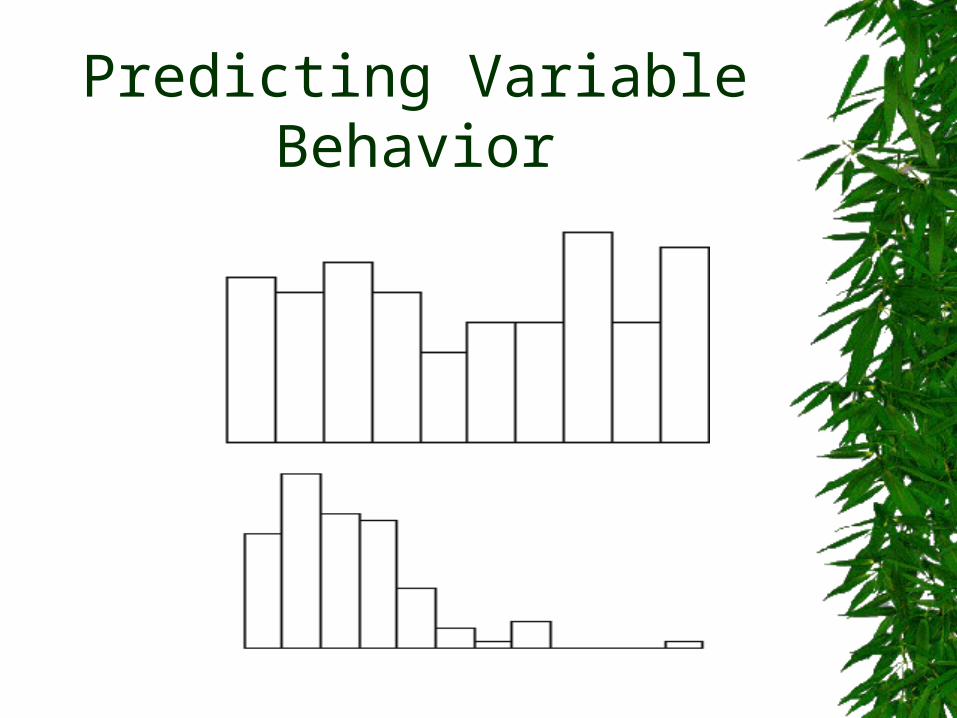
Predicting Variable Behavior
Predicting Variable Behavior
(a) Height of students in this class
(b) Students’ preference for coca-cola vs. pepsi-cola
(c) Number of siblings of individuals
(d) Amount paid for last haircut
(e) Gender breakdown
(f) Students’ guesses of my age
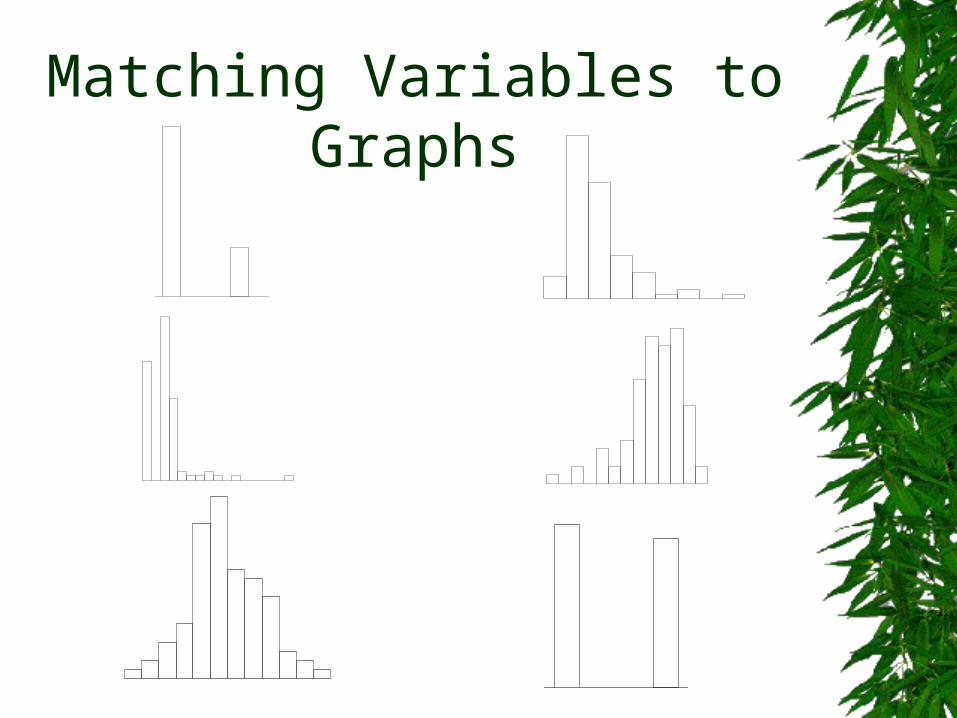
Matching Variables to Graphs
Matching Variables to Graphs
Think about context! Anticipate patterns and variations
– variable intuition– graph-sense
STATISTICS SAY… Students’ heights would show more
variability than guesses of my age KDC Pursues High-Return, Low-Risk
Strategy
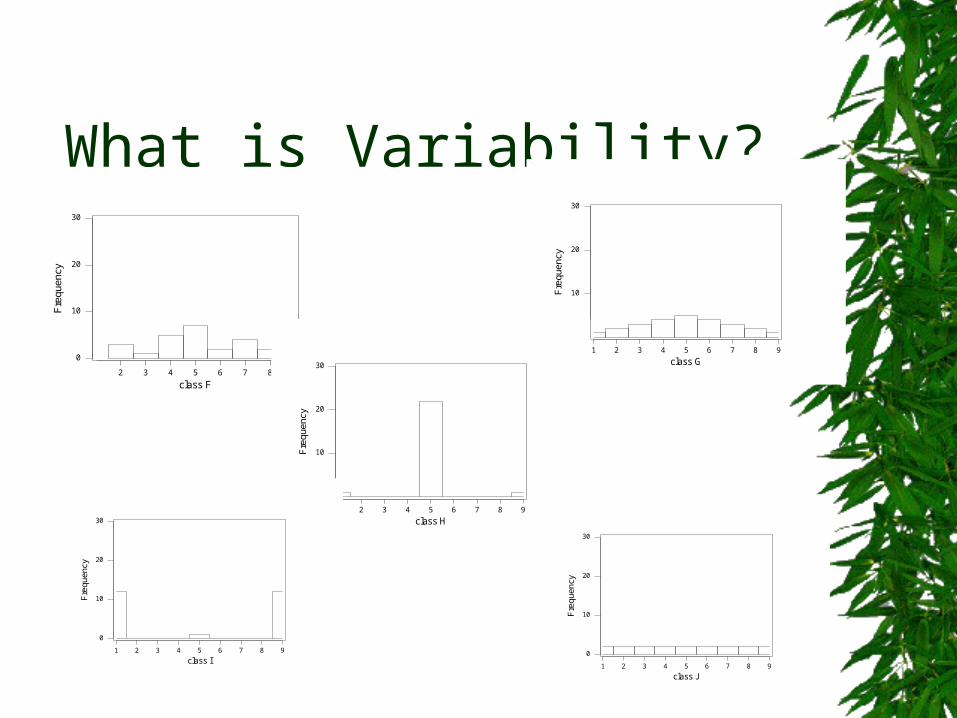
What is Variability?
8765432
30
20
10
0
class F
Fre
quen
cy
987654321
30
20
10
0
class G
Fre
quen
cy
987654321
30
20
10
0
class H
Fre
quen
cy
987654321
30
20
10
0
class I
Fre
quen
cy
987654321
30
20
10
0
class J
Fre
quen
cy
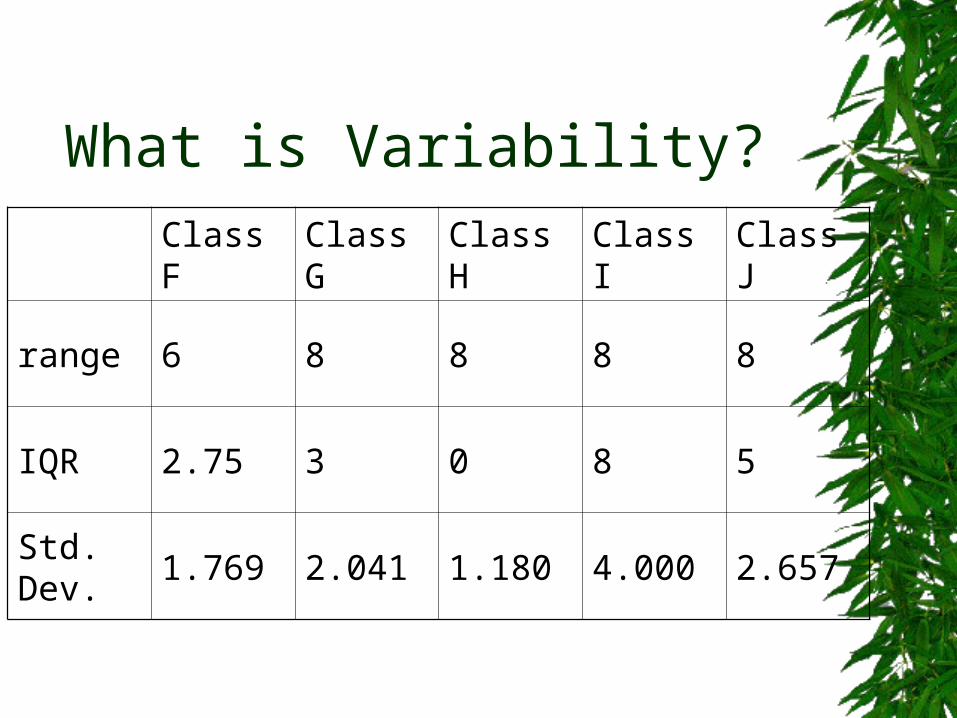
What is Variability?
Class F Class G Class H Class I Class J
range 6 8 8 8 8
IQR 2.75 3 0 8 5
Std. Dev.
1.769 2.041 1.180 4.000 2.657
Describing Variability The “bumpiness” of a histogram does
not determine the variability of the observations
The number of distinct values the variable takes does not determine the variability of the observations
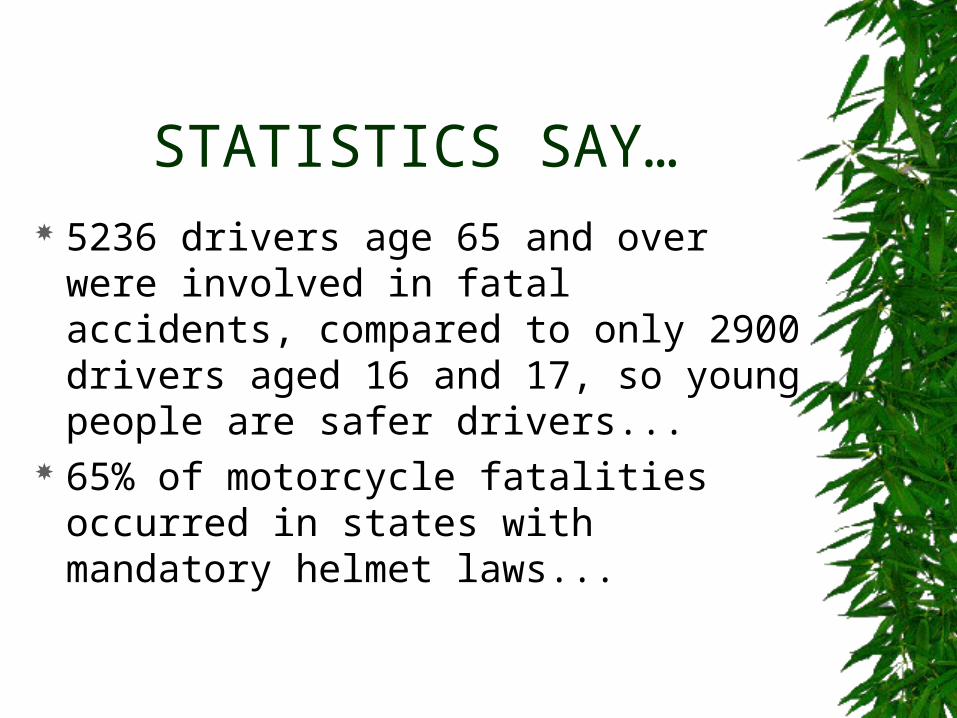
STATISTICS SAY… 5236 drivers age 65 and over were
involved in fatal accidents, compared to only 2900 drivers aged 16 and 17, so young people are safer drivers...
65% of motorcycle fatalities occurred in states with mandatory helmet laws...
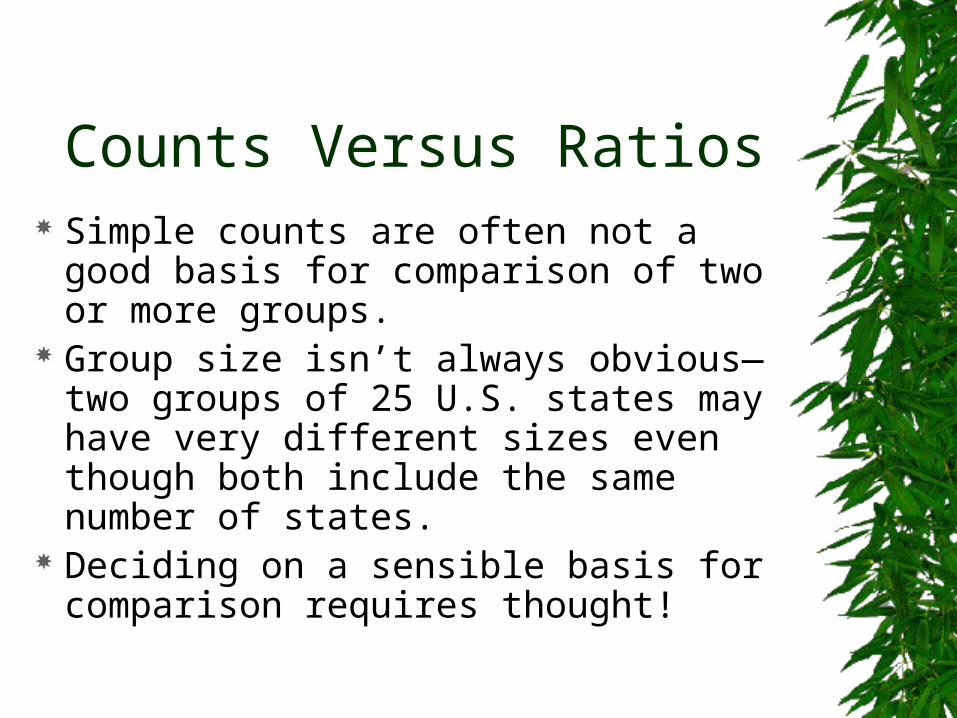
Counts Versus Ratios Simple counts are often not a good
basis for comparison of two or more groups.
Group size isn’t always obvious—two groups of 25 U.S. states may have very different sizes even though both include the same number of states.
Deciding on a sensible basis for comparison requires thought!

STATISTICS SAY… 85% of software developers predicted
that Microsoft's integration of Internet functions into Windows would help their company
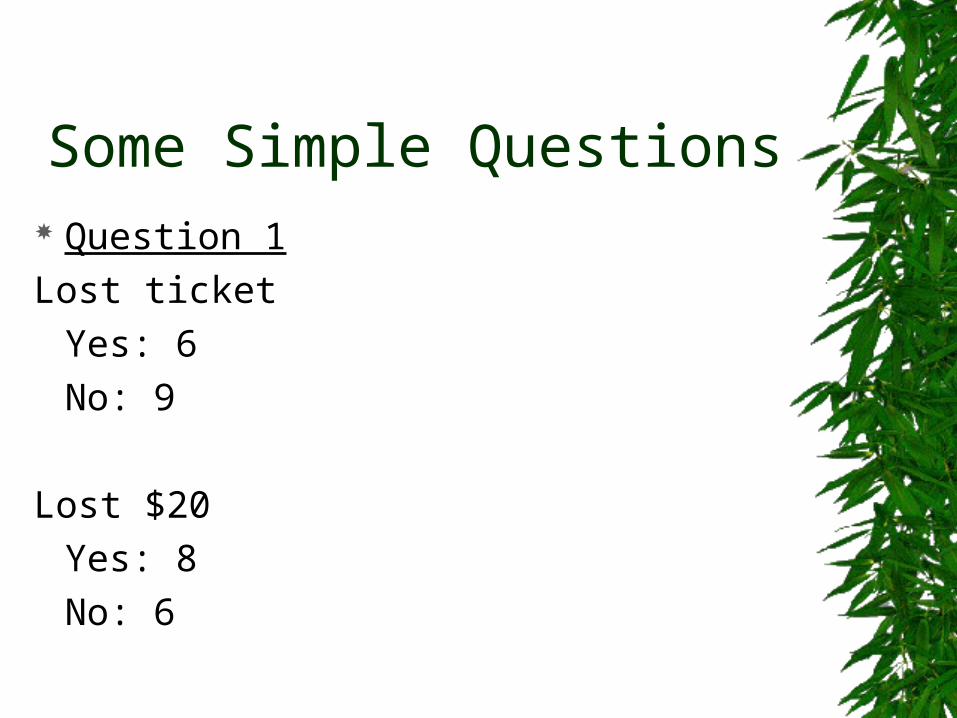
Some Simple Questions Question 1
Lost ticket
Yes: 6
No: 9
Lost $20
Yes: 8
No: 6
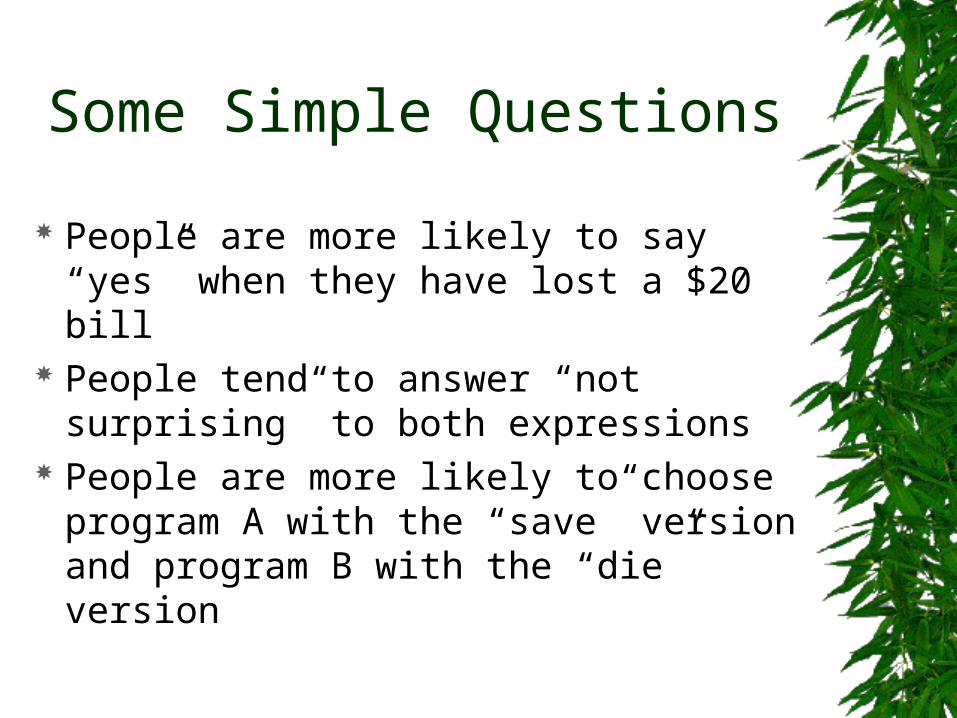
Some Simple Questions
People are more likely to say “yes” when they have lost a $20 bill
People tend to answer “not surprising” to both expressions
People are more likely to choose program A with the “save” version and program B with the “die” version

Some Simple Questions
Be careful when wording survey questions – ask to see the phrasing!
Bill Gates: It would help me EMENSELY to have a survey showing that 90% of developers believe putting the browser into the operating system is a good idea…– Browser vs. “browser technologies”
STATISTICS SAY …
Researchers in Philadelphia investigated whether pamphlets containing information for cancer patients are written at a level that the cancer patients can comprehend– Median reading levels are equal
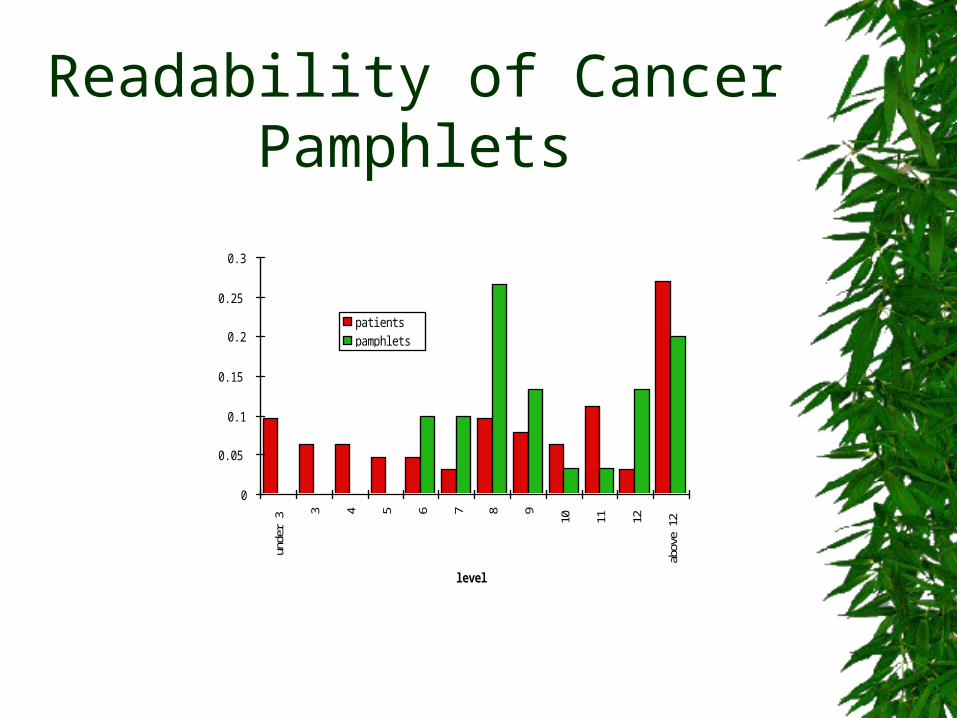
Readability of Cancer Pamphlets
0
0.05
0.1
0.15
0.2
0.25
0.3
unde
r 3 3 4 5 6 7 8 9
10 11 12
abov
e 12
level
prop
ortion
patientspamphlets

Readability of Cancer Pamphlets
Graphs can illuminateLook at the data!
Think about the question
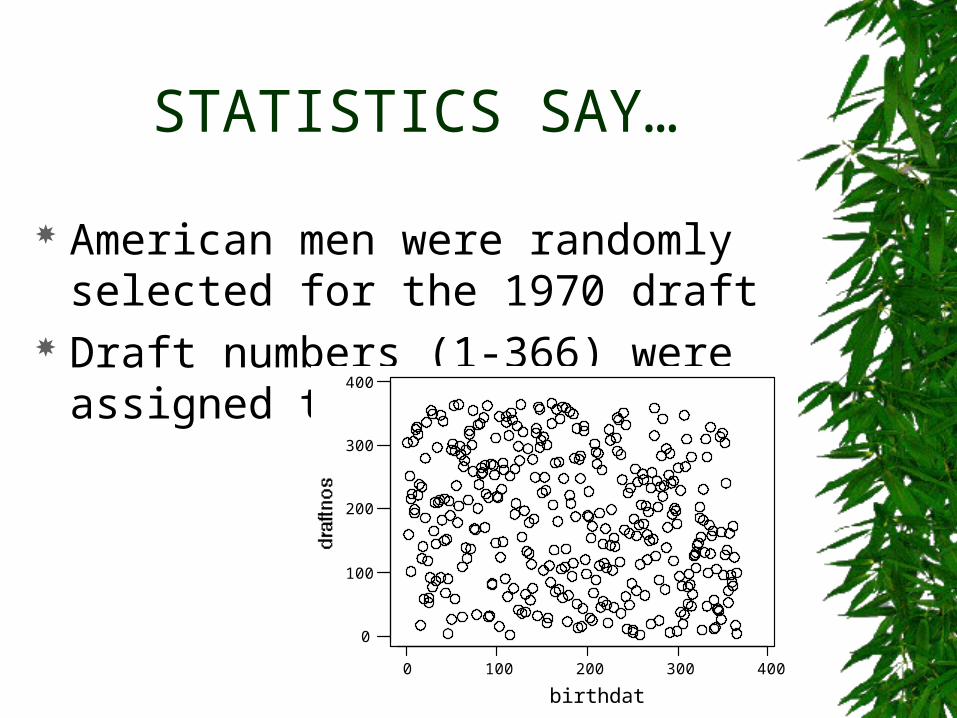
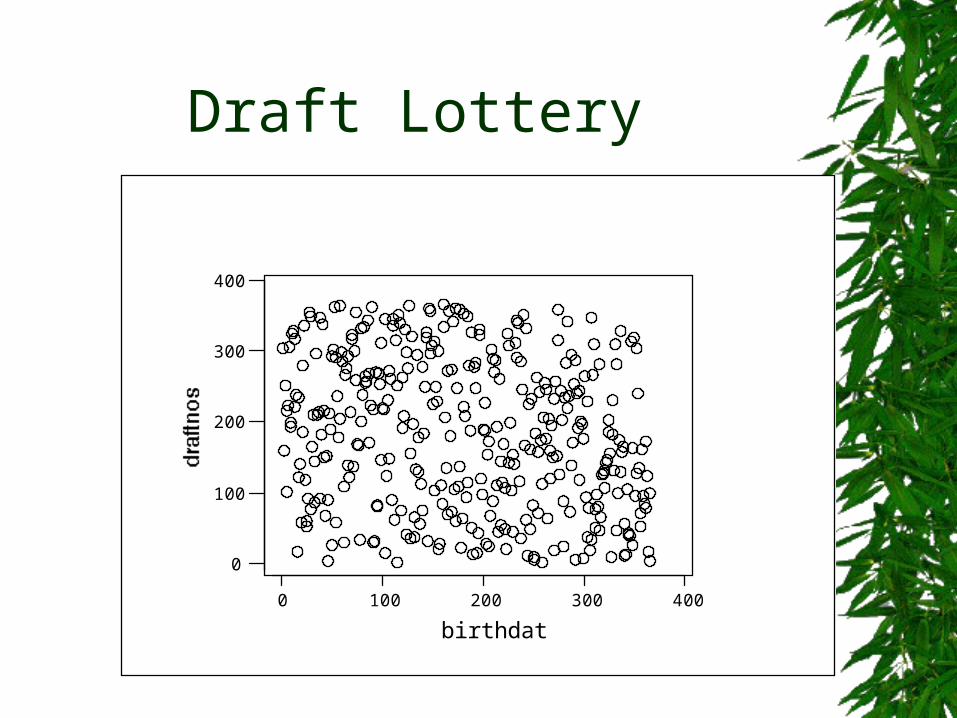
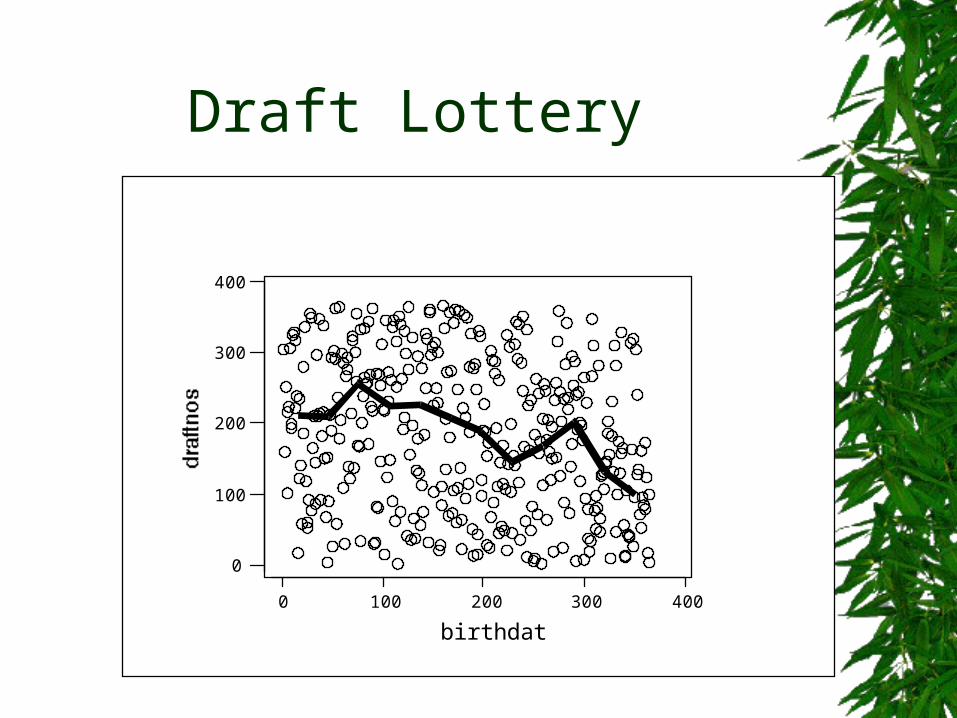
STATISTICS SAY…
American men were randomly selected for the 1970 draft
Draft numbers (1-366) were assigned to birthdates
4003002001000
400
300
200
100
0
birthdat
Draft Lottery Calculate the median draft number for
each month– 31 days: 16th value– 30 days: average 15th and 16th values– 29 days: 15th value
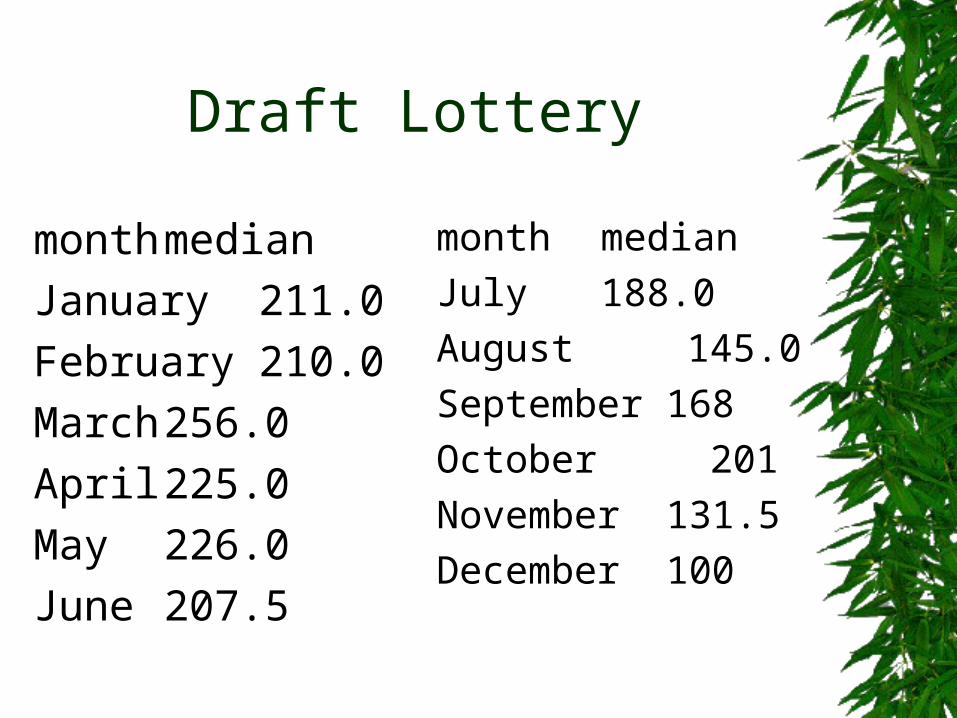
Draft Lottery
month median
January 211.0
February 210.0
March 256.0
April 225.0
May 226.0
June 207.5
month median
July 188.0
August 145.0
September 168
October 201
November 131.5
December 100
Draft Lottery
4003002001000
400
300
200
100
0
birthdat
Draft Lottery
4003002001000
400
300
200
100
0
birthdat
Draft Lottery
Statistics matter Summaries can illuminate Randomization can be difficult
STATISTICS SAY…
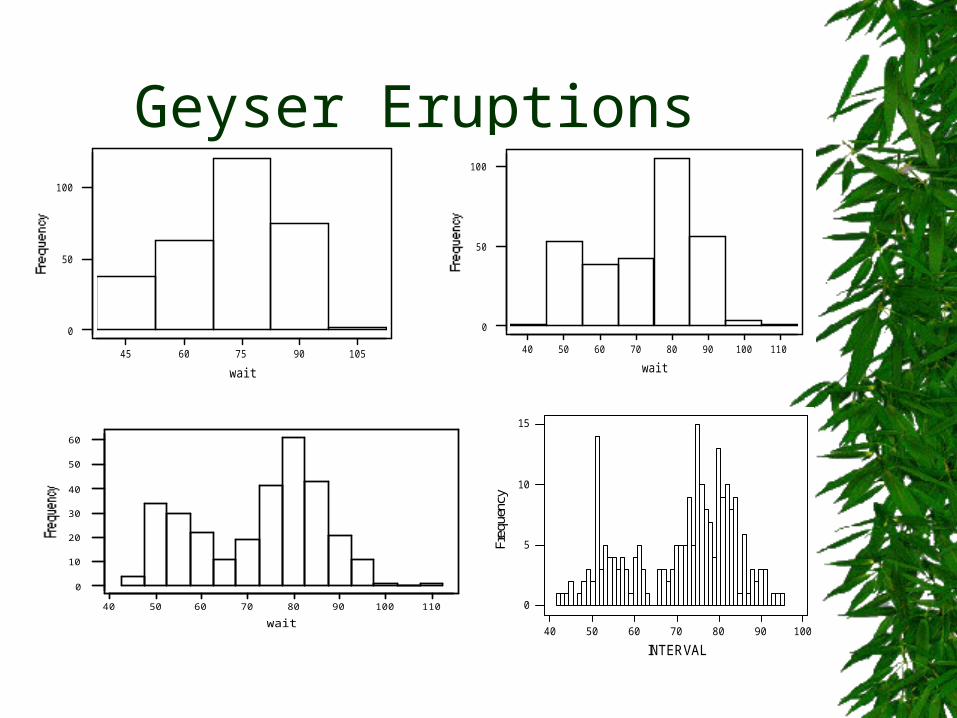
The average time between eruptions of the Old Faithful Geyser is 71 minutes– August, 1985
Geyser Eruptions
40 50 60 70 80 90 100
0
5
10
15
INTERVAL
Freq
uenc
y
40 50 60 70 80 90 100 110
0
50
100
wait45 60 75 90 105
0
50
100
wait
40 50 60 70 80 90 100 110
0
10
20
30
40
50
60
wait
Geyser Eruptions
Looks can be deceiving! Use the graph that summarizes
without losing important details
STATISTICS SAY… The average major league baseball
salary in the United States is about $1.5 million

Rowers’ Weights
2000 Men’s Olympic Rowing Team
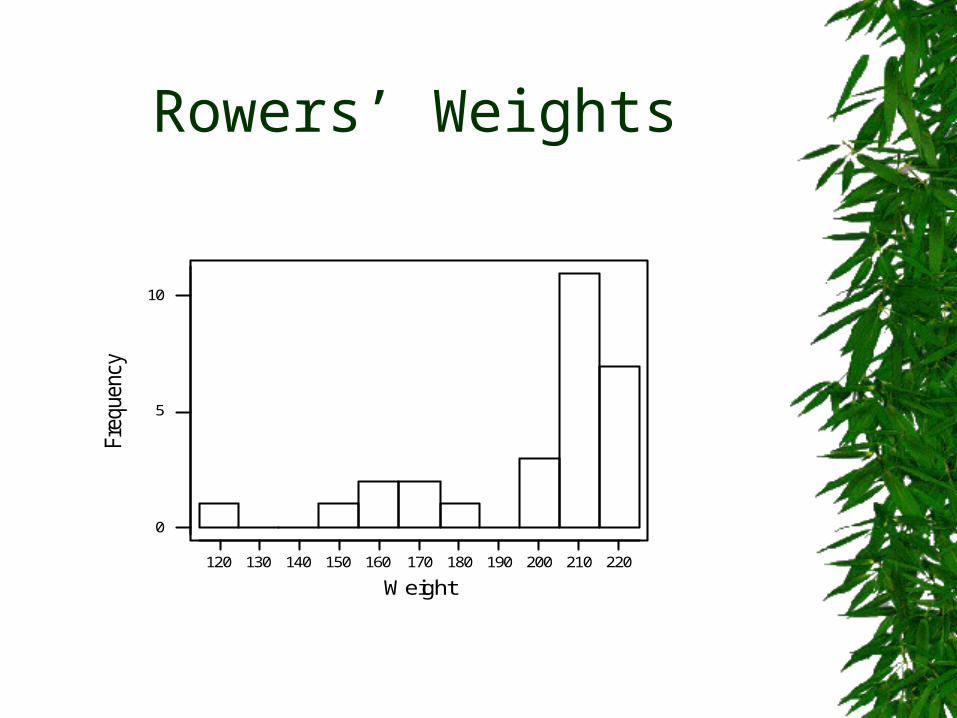
Rowers’ Weights
220210200190180170160150140130120
10
5
0
Weight
Freq
uenc
y
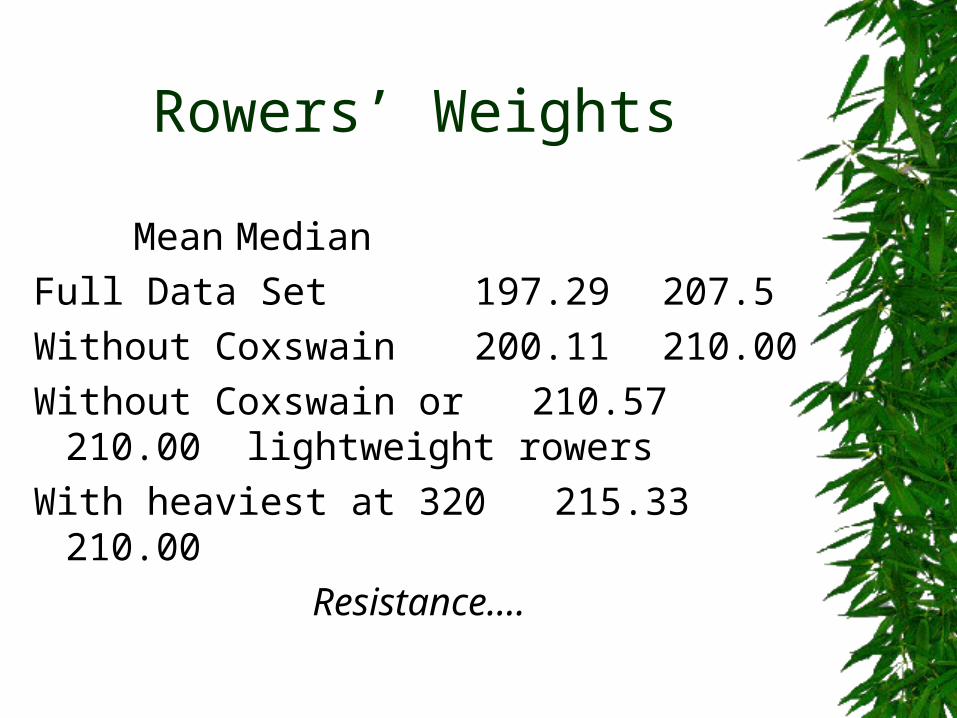
Rowers’ Weights
Mean Median
Full Data Set 197.29 207.5
Without Coxswain 200.11 210.00
Without Coxswain or 210.57 210.00 lightweight rowers
With heaviest at 320 215.33 210.00
Resistance....

Rowers’ Weights
Know what your numerical summary is measuring
Investigate causes for unusual observations
Baseball: median salary ~ $500,000
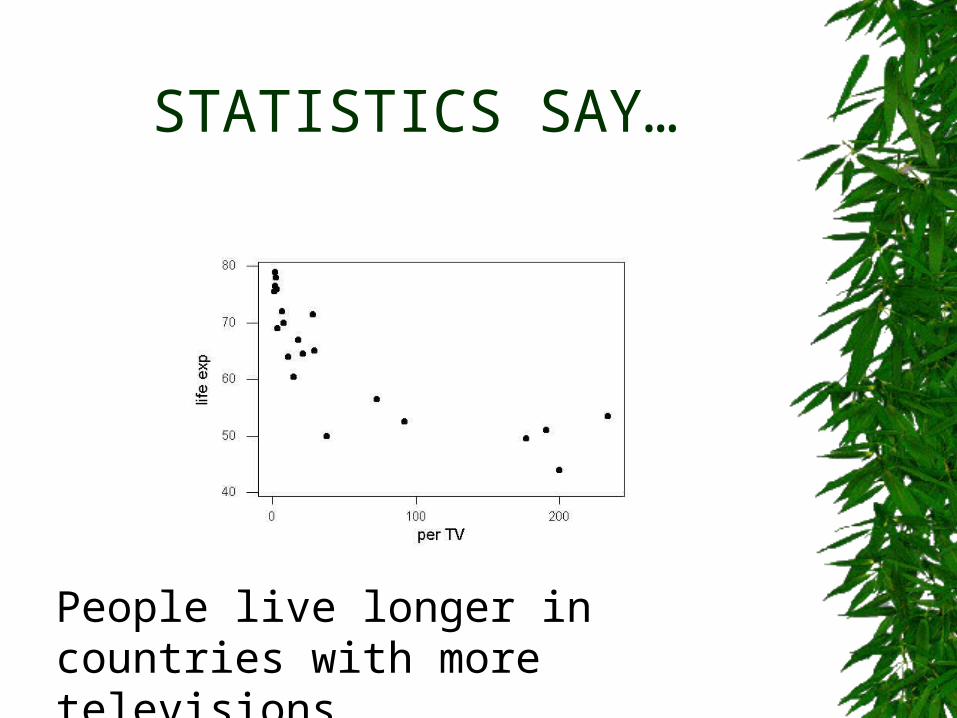
STATISTICS SAY…
People live longer in countries with more televisions
Televisions and Life Expectancy
Buy another television? Association is not causation

STATISTICS SAY… Overall survival rates:
– A: 80% B: 90%
Fair condition:– A: 98.3% B: 96.7%
Poor condition:– A: 52.5% B: 30.0%
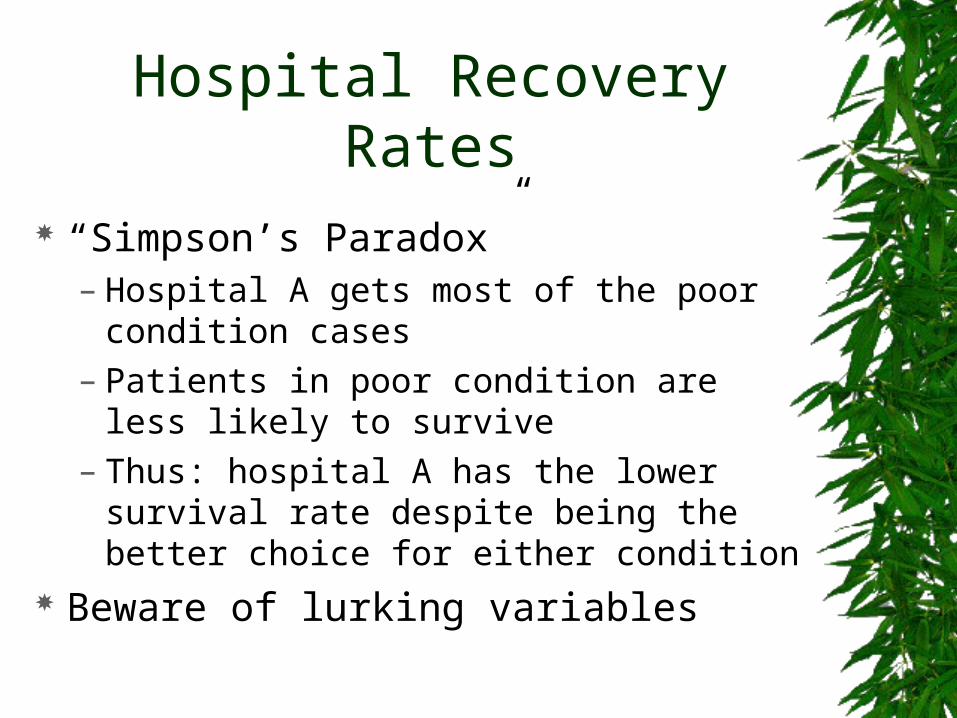
Hospital Recovery Rates “Simpson’s Paradox”
– Hospital A gets most of the poor condition cases
– Patients in poor condition are less likely to survive
– Thus: hospital A has the lower survival rate despite being the better choice for either condition
Beware of lurking variables
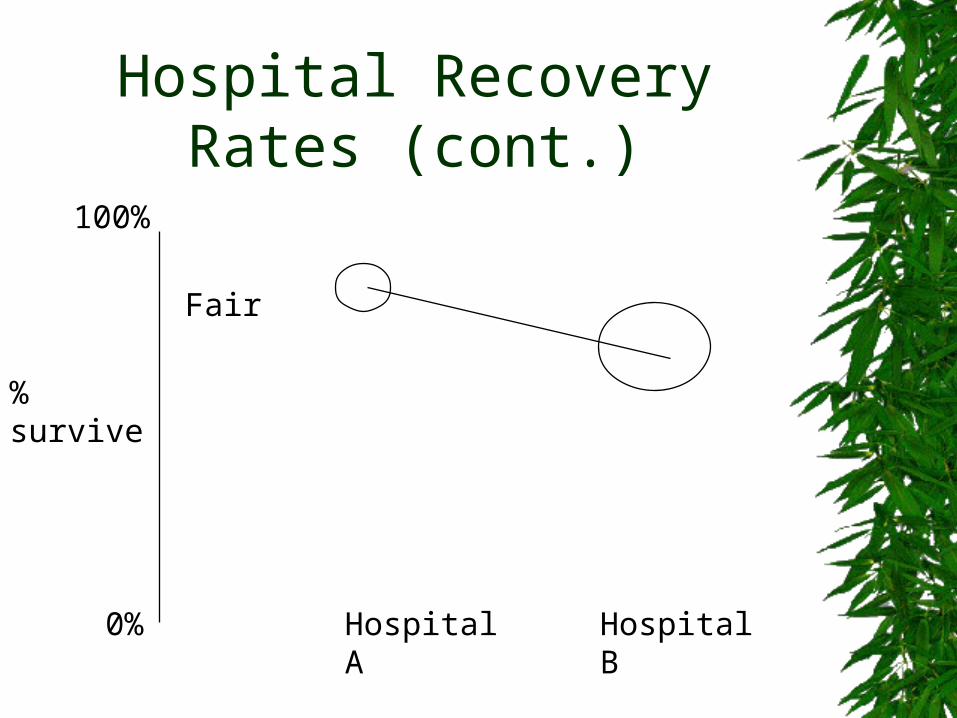
Hospital Recovery Rates (cont.)
Fair
% survive
Hospital A Hospital B0%
100%
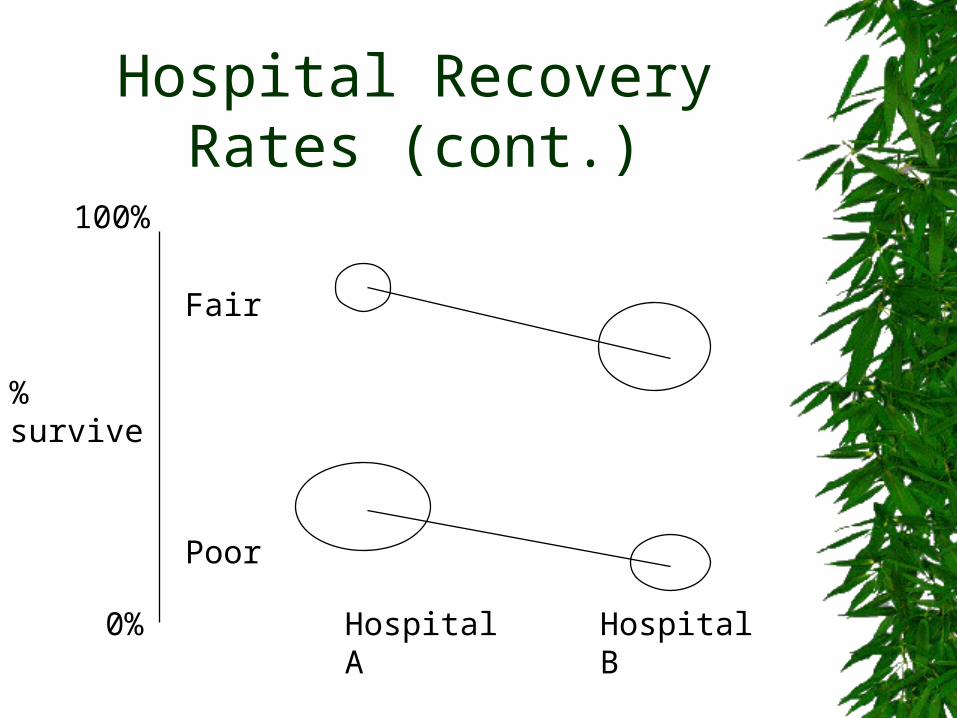
Hospital Recovery Rates (cont.)
Fair
Poor
Hospital A Hospital B
% survive
0%
100%
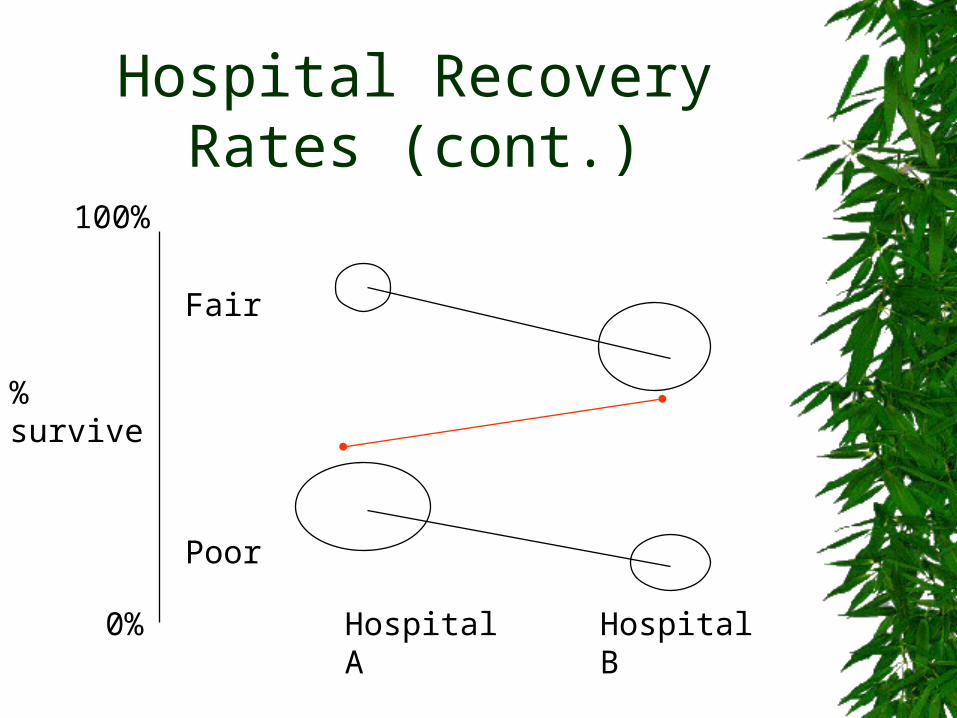
Hospital Recovery Rates (cont.)
Fair
Poor
Hospital A Hospital B
% survive
0%
100%
STATISTICS SAY… Taking an aspirin each day reduces
the risk of heart attack for men, but less so for women
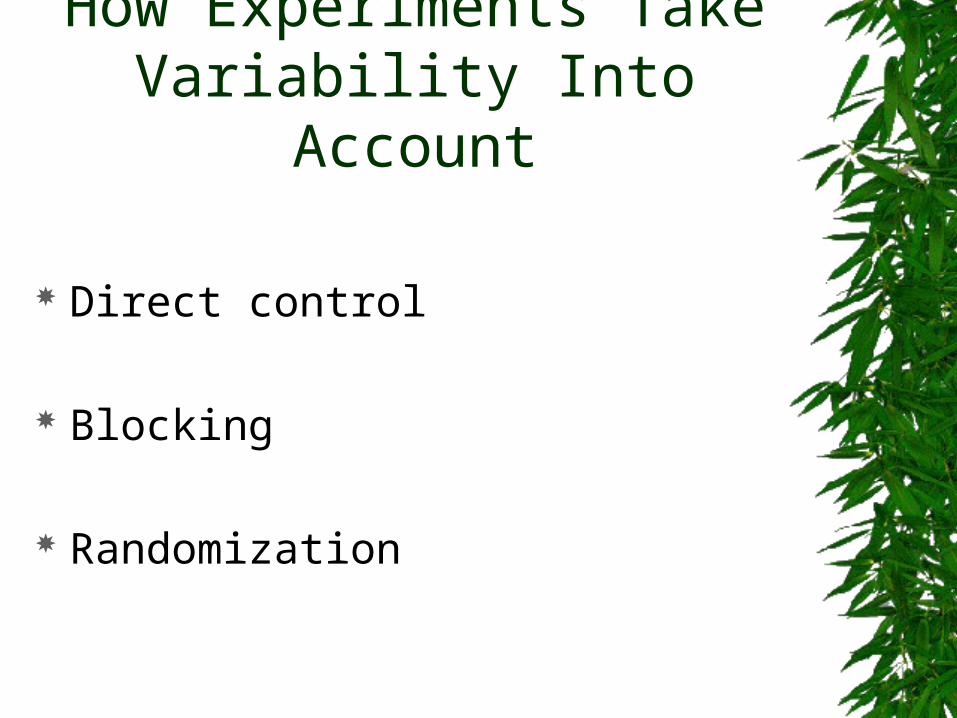
How Experiments Take Variability Into Account
Direct control
Blocking
Randomization
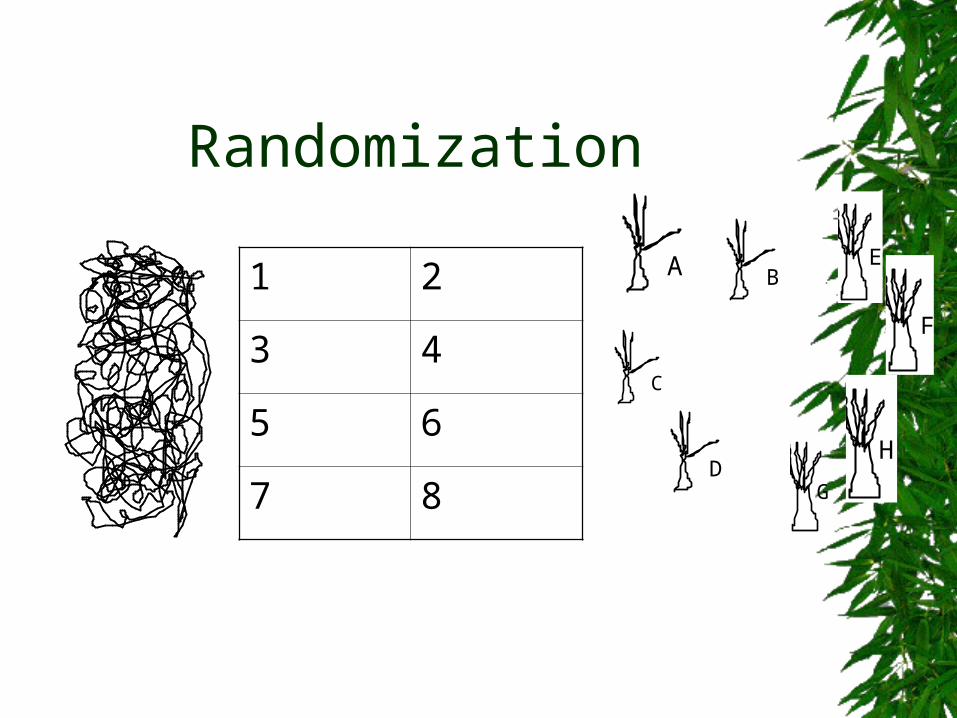
Randomization
A 1 2
3 4
5 6
7 8
B
D
C
E
F
G
H

Blocking Scheme A
A 1 2
3 4
5 6
7 8
B
D
C
E
F
G
H

Blocking Scheme B
A 1 2
3 4
5 6
7 8
B
D
C
E
F
G
H
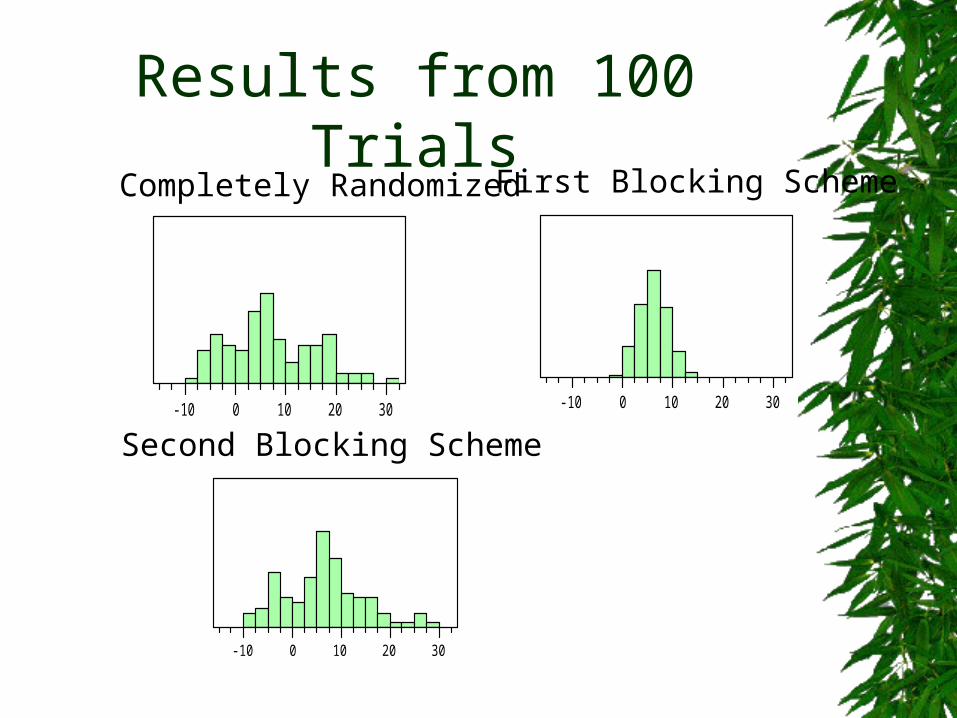
Results from 100 Trials
-10 0 10 20 30 -10 0 10 20 30
-10 0 10 20 30
Completely Randomized First Blocking Scheme
Second Blocking Scheme
Controlling for Variability Blocking reduces variability in the
estimated mean difference Homogeneous blocks are desirable
Randomization evens out the effects of extraneous variables
STATISTICS SAY… A log was selected at random…

Sampling Logs Does choosing times at random result
in a random sample of logs?
_______________________________

Estimating Mean String Length
Does the sampling procedure produce a simple random sample?
How is this related to the log problem??
Can you suggest a better sampling method?
Selecting a Sample
Random Sampling eliminates human selection bias so the sample will be fair and unbiased/representative of the population.
While increasing the sample size improves precision, this does not decrease bias.
STATISTICS SAY… 45% +/- 1% of people surveyed claim
to prefer watching soccer to baseball
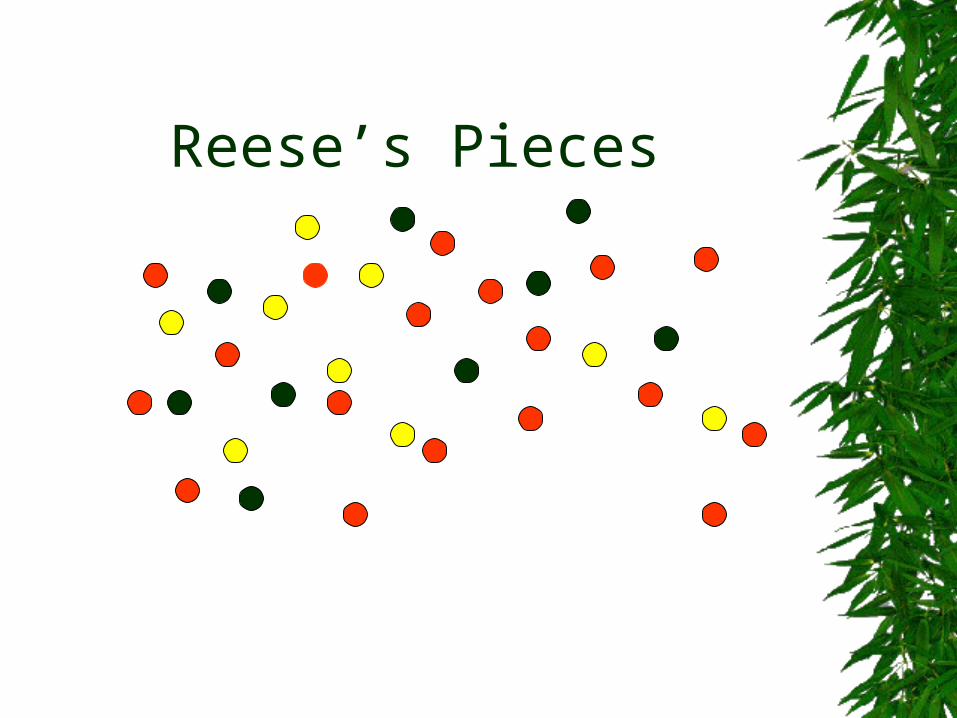
Reese’s Pieces
Reese’s Pieces Take sample of 25 candies Sort by color Calculate the proportion of orange
candies in your sample Construct a dotplot of the distribution
of sample proportions
Reese’s Pieces Did everyone obtain the same sample
result? Is there a pattern to the sample results? Is it possible to make predictions about
the population based on only one sample?
Can you be “confident” of your prediction?

Thank You [email protected] [email protected]