Presentation by: Dr Mimi Tatlow-Golden [email protected] Presentation Title:
date post
19-Dec-2015Category
view
217download
0
Statistics for PsychologyStatistics for Psychology
Patrick MurphyPatrick Murphy
Department of StatisticsDepartment of Statistics
Room L548 Room L548
5th Floor Library Building5th Floor Library Building
[email protected]@UCD.IE
12 Lectures12 Lectures
2.00 pm Tuesdays 2.00 pm Tuesdays
Theatre LTheatre L
TextbookTextbook
Seeing Through StatisticsSeeing Through Statistics
by by
Jessica UttsJessica Utts
Duxbury PressDuxbury Press
CLASS WEBPAGECLASS WEBPAGE
1. 1. Go to the Statistics Go to the Statistics Department WebsiteDepartment Website
WWW.UCD.IE/~Statdept/WWW.UCD.IE/~Statdept/
2.2. Then click on Then click on ClassPages ClassPages in the left in the left frameframe
3. Finally click on 3. Finally click on
Statistics for PsychologyStatistics for Psychology
What do you know about statistics?

It’s boring…

Frogs and Princesses
There are three kinds of lies:
LiesLies Damned LiesDamned Lies and and StatisticsStatistics
- Benjamin Disraeli- Benjamin Disraeli
A single death is a tragedy, a million deaths is a statistic.
Joseph Stalin (1879-1953)
The weaker the data available upon which to base one's conclusion, thegreater the precision which should be quoted in order to give the dataauthenticity.
Norman R. Augustine

Simpsons episode: Homer is questioned about his Homer is questioned about his
newly formed vigilante groupnewly formed vigilante group
Newscaster:Newscaster: Since your group Since your group started up, petty crime is down started up, petty crime is down 20%, but other crimes are up. 20%, but other crimes are up.
Such as heavy sack beating Such as heavy sack beating which is up 800%. So you’re which is up 800%. So you’re actually increasing crime.actually increasing crime.
Homer:Homer: You can make up You can make up statistics to prove anything.statistics to prove anything.
43% of people know that.43% of people know that.

Misuse of Statistics
The Great Meryl Streep Apple The Great Meryl Streep Apple Juice Cancer Scare Juice Cancer Scare
Asbestos is really bad for you Asbestos is really bad for you so we need to eradicate it from so we need to eradicate it from our buildingsour buildings

Aeroplanes
1/1,000,000 chance of a bomb 1/1,000,000 chance of a bomb on a planeon a plane
Aeroplane EnginesAeroplane Engines

The foundation of Probability The foundation of Probability theory lies in problems associated theory lies in problems associated with gambling and games of chancewith gambling and games of chance
The Romans used played a game The Romans used played a game with ASTRAGALI - Heel bones of with ASTRAGALI - Heel bones of animalsanimals
What about Probability?

DICE as we know them were DICE as we know them were invented around 300 BCinvented around 300 BC
DICE

“I lied, cheated and stole to become a millionaire. Now anybody at all can win the lottery and become a millionaire”

LOTTO 6/42
What are the chance of What are the chance of winning with one selection winning with one selection of 6 numbers?of 6 numbers?
Matches Matches Odds Odds
66 1 in 5,245,7861 in 5,245,786
5 5 1 in 24,2861 in 24,286
4 4 1 in 555 1 in 555
LOTTO 6/42 The average time to win each of the prizes is The average time to win each of the prizes is
given by:given by:
Match 3 with BonusMatch 3 with Bonus 2 Years, 6 Weeks2 Years, 6 Weeks
Match 4Match 4 2 Years, 8 Months 2 Years, 8 Months
Match 5Match 5 116 Years, 9 Months 116 Years, 9 Months
Match 5 with BonusMatch 5 with Bonus 4323 Years, 5 Months4323 Years, 5 Months
Share in JackpotShare in Jackpot 25,220 Years 25,220 Years
Why do people still play the lottery?
If you’re not in you can’t win!If you’re not in you can’t win! You never know your luck You never know your luck
until you try!until you try! My chances of winning a My chances of winning a
million are better than my million are better than my chances of earning a million.chances of earning a million.
The lottery is a tax on the The lottery is a tax on the statistically challenged.statistically challenged.
Lincoln & Kennedy
Abraham Lincoln was elected to Congress in 1846.
John F Kennedy was elected to Congress in 1946.
Abraham Lincoln was elected President in 1860.
John F. Kennedy was elected President in 1960.
The names Lincoln and Kennedy each contain seven letters.
Both were particularly concerned with civil rights.

Lincoln & Kennedy Both wives lost a child while
living in the White House. Both Presidents were shot on a
Friday. Both Presidents were shot in the
head. Lincoln's secretary was named
Kennedy. Kennedy's secretary was named
Lincoln. Both were assassinated by
Southerners.
Lincoln & Kennedy Both were succeeded by
Southerners named Johnson. Andrew Johnson, who succeeded
Lincoln, was born in 1808. Lyndon Johnson, who succeeded
Kennedy, was born in 1908. John Wilkes Booth, who
assassinated Lincoln, was born in 1839.
Lee Harvey Oswald, who assassinated Kennedy, was born in 1939.
Lincoln & Kennedy Both assassins were known by
their three names. Both names are composed of
fifteen letters. Lincoln was shot at the theatre
named 'Ford.' Kennedy was shot in a car called
'Lincoln.' Booth ran from the theatre and
was caught in a warehouse. Oswald ran from a warehouse and
was caught in a theatre. Booth and Oswald were
assassinated before their trials.
Lincoln & Kennedy And here's the clincher. A week before Lincoln was
shot, he was in Monroe, Maryland.
A week before Kennedy was shot, he was in Marilyn Monroe.
Oh…and on the day he died Lincoln pardoned a man named…
Patrick Murphy

Election: Which parties have
most power?
Party A - 45%Party A - 45% Party B - 44%Party B - 44% Party C - 7%Party C - 7% Party D - 4%Party D - 4%

We’re ready to play some games…
An Example Experiment:Experiment: Roll Two Dice Roll Two Dice Possible Outcomes:Possible Outcomes: Any Any
number from 1 to 6 can appear number from 1 to 6 can appear on each die.on each die.
There are 36 possible outcomes There are 36 possible outcomes Each Outcome in the Sample Each Outcome in the Sample
Space is equally probable.Space is equally probable. So the probability of each So the probability of each
outcome is 1/36outcome is 1/36 What is the probability of the What is the probability of the
Event - “get combined total of 7 Event - “get combined total of 7 on the dice”on the dice”
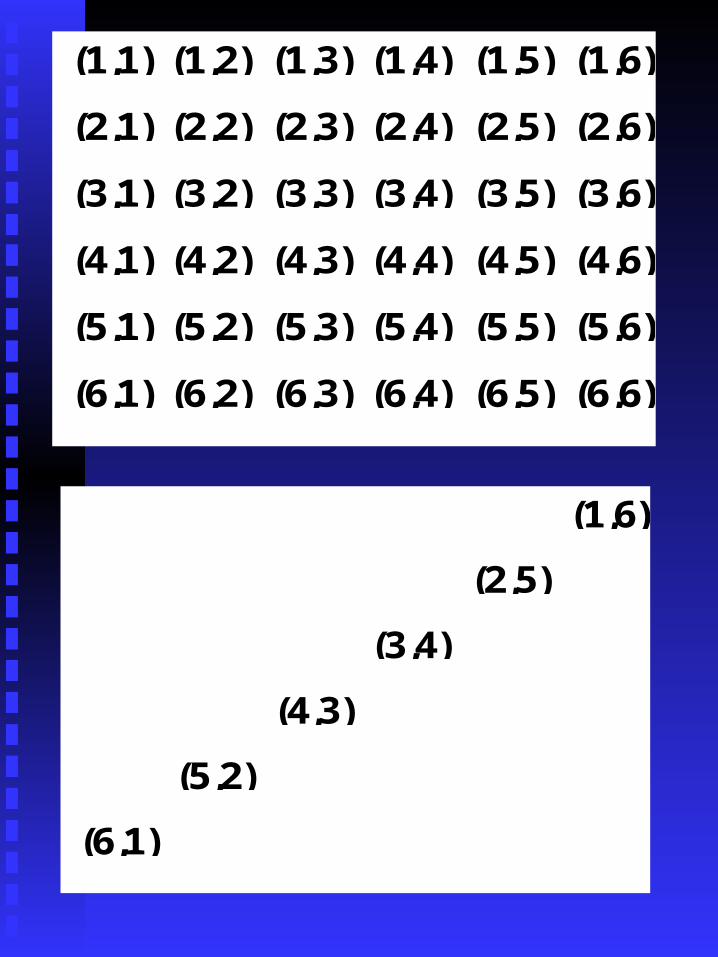
(1,6)
(2,5)
(3,4)
(4,3)
(5,2)
(6,1)
(1,1) (1,2) (1,3) (1,4) (1,5) (1,6)
(2,1) (2,2) (2,3) (2,4) (2,5) (2,6)
(3,1) (3,2) (3,3) (3,4) (3,5) (3,6)
(4,1) (4,2) (4,3) (4,4) (4,5) (4,6)
(5,1) (5,2) (5,3) (5,4) (5,5) (5,6)
(6,1) (6,2) (6,3) (6,4) (6,5) (6,6)
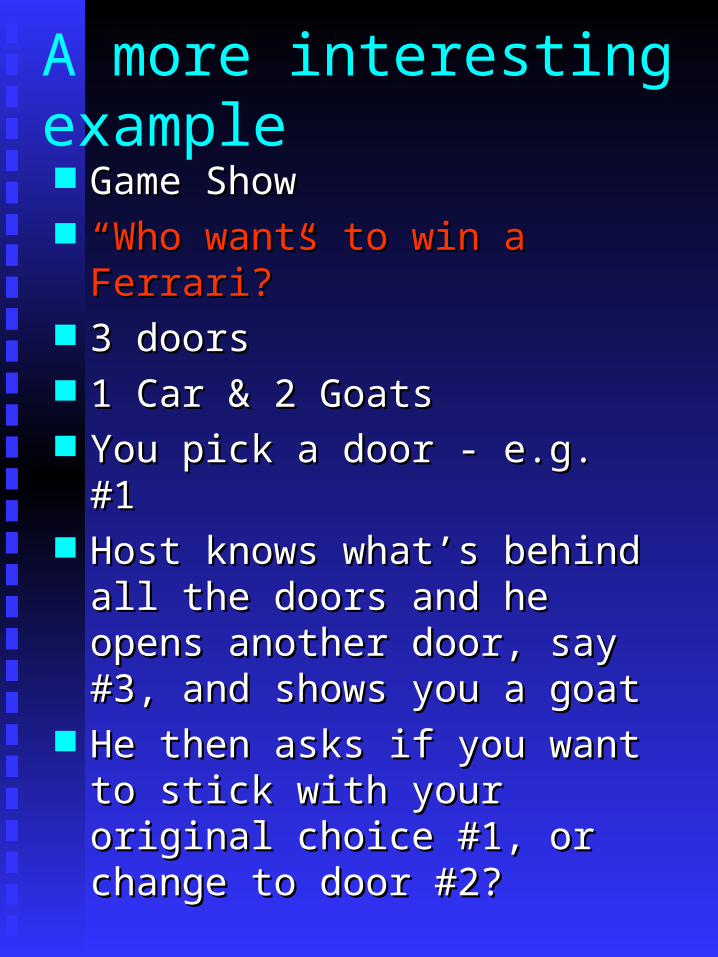
A more interesting example Game Show Game Show ““Who wants to win a Ferrari?”Who wants to win a Ferrari?” 3 doors3 doors 1 Car & 2 Goats1 Car & 2 Goats You pick a door - e.g. #1You pick a door - e.g. #1 Host knows what’s behind all Host knows what’s behind all
the doors and he opens another the doors and he opens another door, say #3, and shows you a door, say #3, and shows you a goatgoat
He then asks if you want to He then asks if you want to stick with your original choice stick with your original choice #1, or change to door #2?#1, or change to door #2?
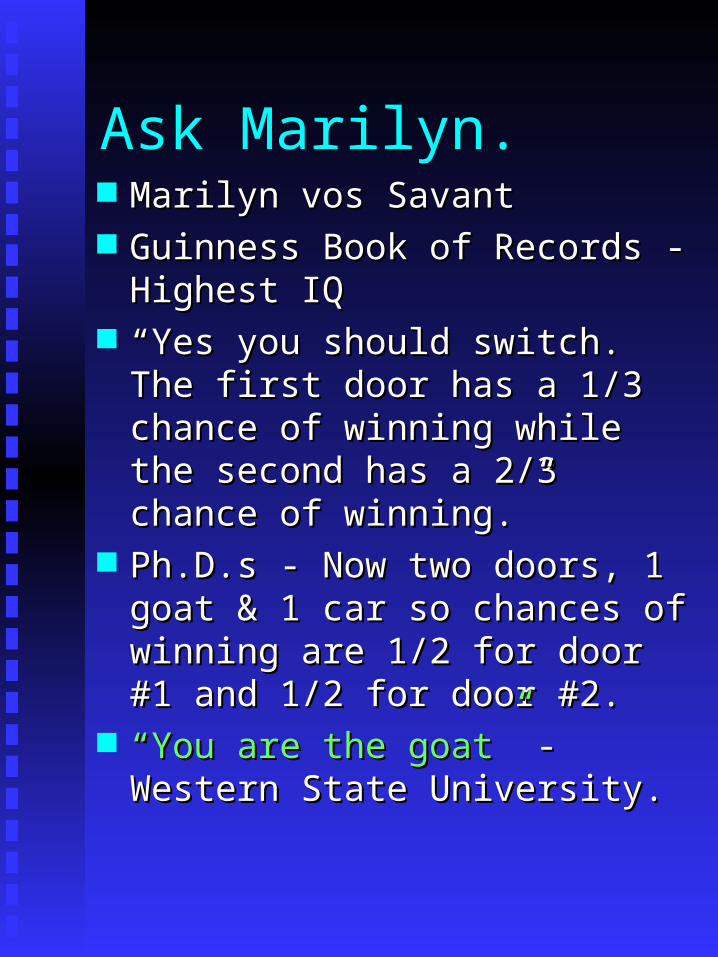
Ask Marilyn. Marilyn vos SavantMarilyn vos Savant Guinness Book of Records -Guinness Book of Records -
Highest IQHighest IQ ““Yes you should switch. The Yes you should switch. The
first door has a 1/3 chance of first door has a 1/3 chance of winning while the second has a winning while the second has a 2/3 chance of winning.”2/3 chance of winning.”
Ph.D.s - Now two doors, 1 goat Ph.D.s - Now two doors, 1 goat & 1 car so chances of winning & 1 car so chances of winning are 1/2 for door #1 and 1/2 for are 1/2 for door #1 and 1/2 for door #2.door #2.
““You are the goat”You are the goat” - Western - Western State University.State University.
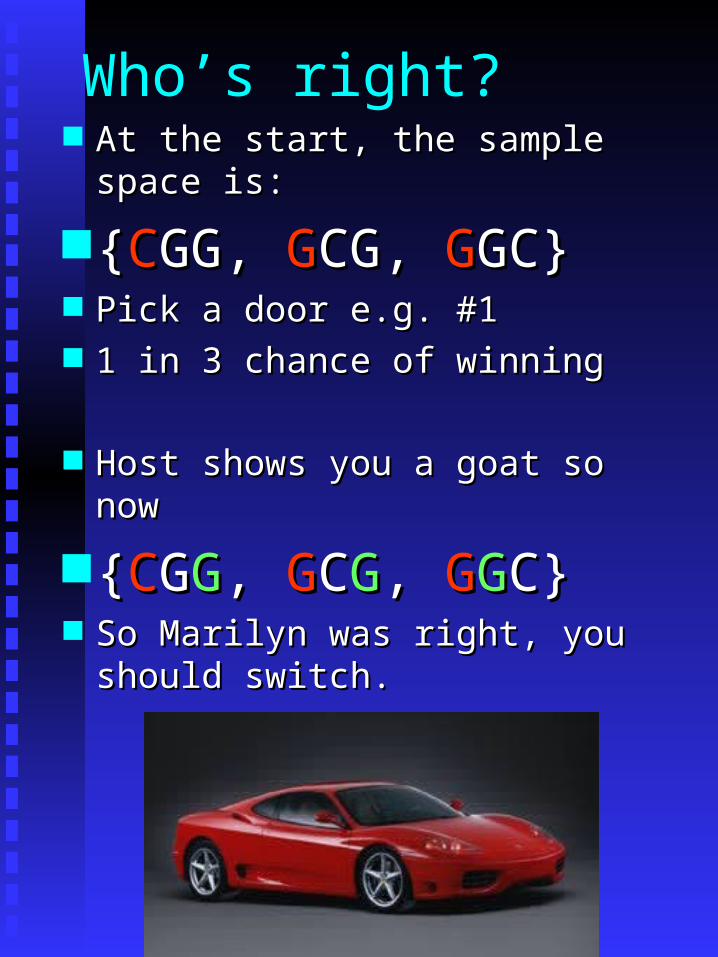
Who’s right? At the start, the sample space is:At the start, the sample space is:
{{CCGG, GG, GGCG, CG, GGGC}GC} Pick a door e.g. #1Pick a door e.g. #1 1 in 3 chance of winning1 in 3 chance of winning
Host shows you a goat so nowHost shows you a goat so now
{{CCGGGG, , GGCCGG, , GGGGC}C} So Marilyn was right, you So Marilyn was right, you
should switch.should switch.

StatisticsStatistics is the science of data. is the science of data. This involves collecting, analysing This involves collecting, analysing and interpreting information.and interpreting information.
Descriptive StatisticsDescriptive Statistics uses uses graphical and numerical techniques graphical and numerical techniques to summarise and display the to summarise and display the information contained in a dataset.information contained in a dataset.
Inferential StatisticsInferential Statistics uses sample uses sample data to make decisions or data to make decisions or predictions about a larger predictions about a larger population of data population of data
Chapter 1The Beginning

More DefinitionsMore Definitions
Population:Population: The entire collection of The entire collection of individuals or objects about which individuals or objects about which information is desired.information is desired.
Sample:Sample: A part (subset) of the A part (subset) of the populationpopulation selected in some prescribed selected in some prescribed manner.manner.
Variable:Variable: A characteristic or property A characteristic or property of an individual unit in the population.of an individual unit in the population.
Representative Sample:Representative Sample: A selection A selection of data chosen from the target of data chosen from the target population population which exhibits which exhibits characteristics typical of the characteristics typical of the populationpopulation..
Representative samples should give Representative samples should give unbiased estimatesunbiased estimates
More DefinitionsMore Definitions
The most common way to select a The most common way to select a Representative Sample is to choose a Representative Sample is to choose a Random Sample.Random Sample.
A A Random SampleRandom Sample is a sample is a sample selected so that each different possible selected so that each different possible sample of the desired size has an equal sample of the desired size has an equal chance of being the one chosen.chance of being the one chosen.
This implies that each member of the This implies that each member of the original population has an equal chance original population has an equal chance of being selected in any random of being selected in any random sample.sample.
Descriptive vs Inferential Statistics
Descriptive statistics is only interested Descriptive statistics is only interested in describing a dataset, whereas in describing a dataset, whereas Inferential Statistics seeks to make a Inferential Statistics seeks to make a decision based on the data.decision based on the data.
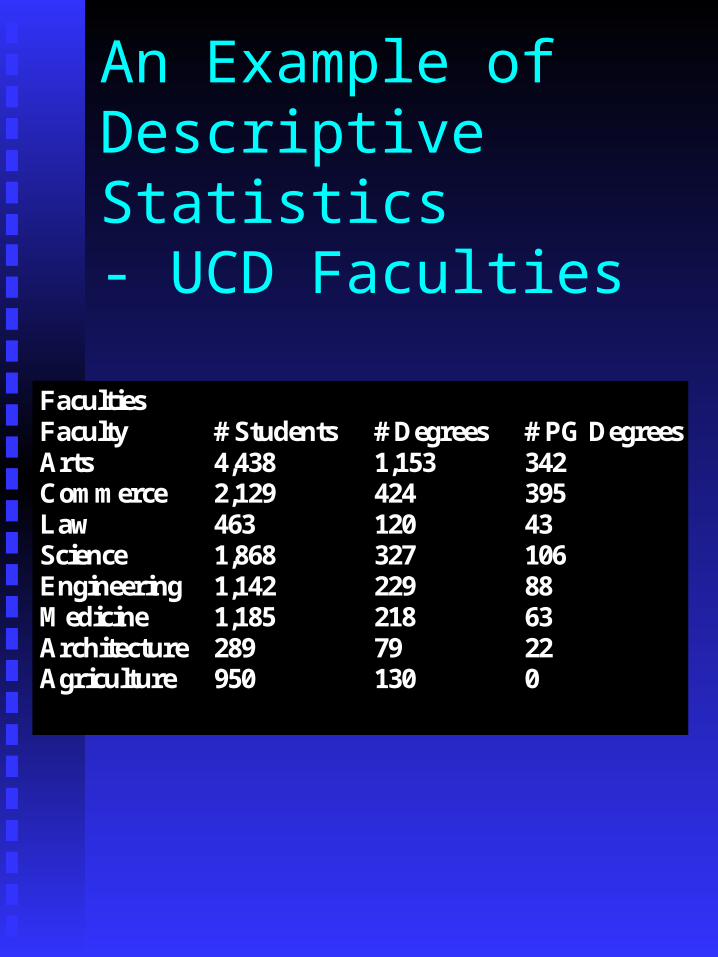
An Example of Descriptive Statistics- UCD Faculties
Faculties Faculty # Students # Degrees # PG Degrees Arts 4,438 1,153 342 Commerce 2,129 424 395 Law 463 120 43 Science 1,868 327 106 Engineering 1,142 229 88 Medicine 1,185 218 63 Architecture 289 79 22 Agriculture 950 130 0

Faculty
010002000300040005000
# Degrees
0
500
1000
1500
Arts Commerce
Law Science
Engineering
Medicine
Architectur
e
Agriculture
X
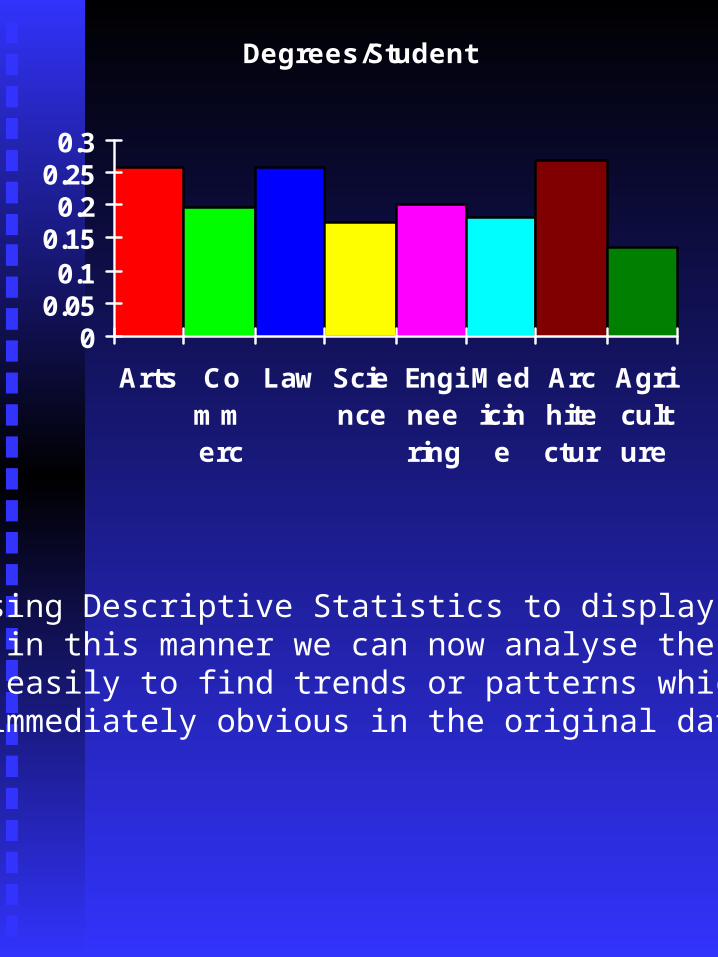
Degrees/Student
00.050.1
0.150.2
0.250.3
Arts Commerce
Law Science
Engineering
Medicine
Architectur
e
Agriculture
By using Descriptive Statistics to display the data in this manner we can now analyse the data more easily to find trends or patterns which were not immediately obvious in the original dataset.
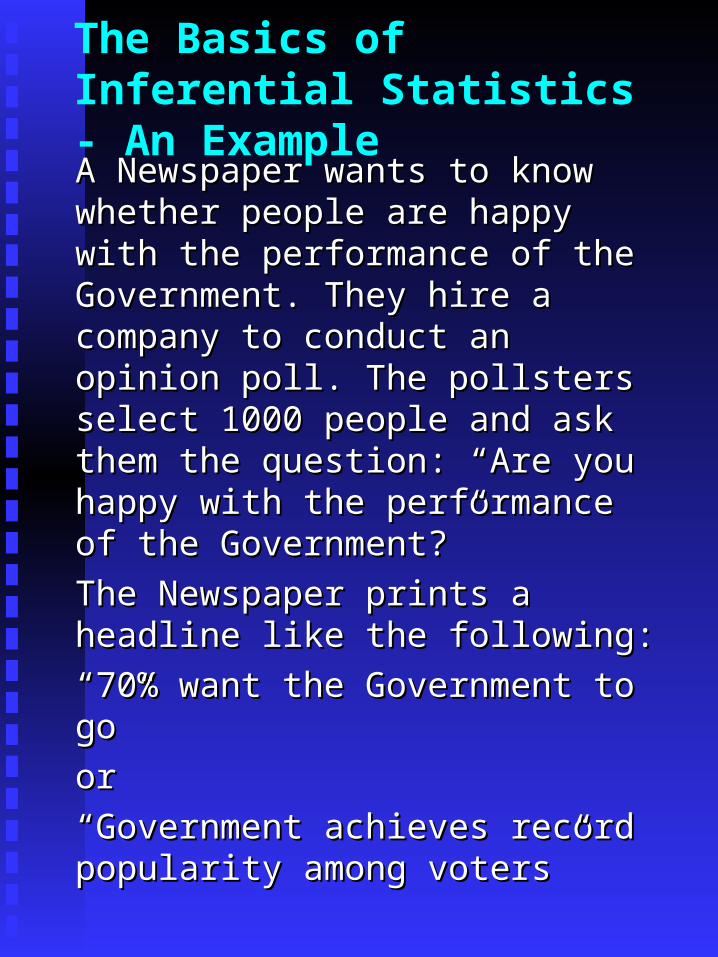
The Basics of Inferential Statistics - An ExampleA Newspaper wants to know whether A Newspaper wants to know whether people are happy with the performance people are happy with the performance of the Government. They hire a of the Government. They hire a company to conduct an opinion poll. company to conduct an opinion poll. The pollsters select 1000 people and The pollsters select 1000 people and ask them the question: “Are you happy ask them the question: “Are you happy with the performance of the with the performance of the Government?”Government?”
The Newspaper prints a headline like The Newspaper prints a headline like the following:the following:
““70% want the Government to go”70% want the Government to go”
oror
““Government achieves record Government achieves record popularity among voters” popularity among voters”

How can the newspaper publish things How can the newspaper publish things like this?like this?
They have only got the opinions of less They have only got the opinions of less than 1000 people ( remember the than 1000 people ( remember the “don’t knows”).“don’t knows”).
1000/2.3 Million = 0.00043 or 0.043%1000/2.3 Million = 0.00043 or 0.043%
Before the end of this course we will Before the end of this course we will find out in great detail whether we find out in great detail whether we should believe these polls.should believe these polls.

For the moment lets examine the For the moment lets examine the procedure carried out in this example.procedure carried out in this example.
The newspaper is interested in a certain The newspaper is interested in a certain population. What is this Population?population. What is this Population?
The newspaper wants to measure some The newspaper wants to measure some variable for each unit of the population. variable for each unit of the population. What variable do they want to What variable do they want to measure?measure?
The opinion pollsters decide to select a The opinion pollsters decide to select a sample from the population. What is sample from the population. What is the sample? the sample?
And what is so special about the And what is so special about the sample chosen?sample chosen?
Is the result reliable?Is the result reliable?
How to collect data.
Before we can begin making inferences about Before we can begin making inferences about the data we need to collect the data itself. the data we need to collect the data itself. Usually one gets data in one of 4 different Usually one gets data in one of 4 different ways.ways.
Data from a published sourceData from a published source
The data has already been collected and the The data has already been collected and the results published, all we need do is draw results published, all we need do is draw conclusions from the data. This is where conclusions from the data. This is where politicians and economists get most of their politicians and economists get most of their data. A boring way to get data!!!data. A boring way to get data!!!
Data from a designed experimentData from a designed experiment
Here you design and conduct an experiment Here you design and conduct an experiment to measure some characteristic of a to measure some characteristic of a population. You have strict control over how population. You have strict control over how the experiment is carried out. This is the way the experiment is carried out. This is the way scientists collect their data and it is the scientists collect their data and it is the method which should provide the most method which should provide the most accurate results.accurate results.
How to collect data continued...
Data from a surveyData from a survey
Here you select a representative sample of Here you select a representative sample of people from the population you are interested people from the population you are interested in. You ask each person some questions and in. You ask each person some questions and record their answers. This method is used by record their answers. This method is used by polling companies, government statisticians polling companies, government statisticians etc. It has certain obvious drawbacks relating etc. It has certain obvious drawbacks relating to the truthfulness of responses.to the truthfulness of responses.
Data collected observationallyData collected observationally
Here one observes the sample in its normal Here one observes the sample in its normal environment and records the variables of environment and records the variables of interest. Used by biologists and psychologists.interest. Used by biologists and psychologists.


![UCDCASL March1,2011 arXiv:1102.5727v1 …arXiv:1102.5727v1 [math.CO] 28 Feb 2011 OpenproblemsinCostasarrays KonstantinosDrakakis∗ UCDCASL Email: Konstantinos.Drakakis@ucd.ie March1,2011](https://static.fdocuments.us/doc/165x107/5fe2b1e82b341802ef1f4acf/ucdcasl-march12011-arxiv11025727v1-arxiv11025727v1-mathco-28-feb-2011-openproblemsincostasarrays.jpg)