Statistics for Anesthesia - Franklin · PDF fileStatistics for Anesthesia Using...
83
Statistics for Anesthesia Using OnlineStatBook.com Franklin Dexter, M.D., Ph.D. Director, Division of Management Consulting Professor, Department of Anesthesia University of Iowa [email protected] www.FranklinDexter.net
Transcript of Statistics for Anesthesia - Franklin · PDF fileStatistics for Anesthesia Using...

Statistics for Anesthesia Using OnlineStatBook.com
Franklin Dexter, M.D., Ph.D.
Director, Division of Management Consulting
Professor, Department of Anesthesia
University of Iowa
www.FranklinDexter.net

Using Slides
• For educational principles and integration with course’s interactive Excel spreadsheets see
– Dexter F et al. Application of an online reference for reviewing basic statistical principles of operating room management. Journal of Statistics Education 18(3), 2010
• Topics selected are those needed for study of anesthesia group and OR management
© 2017 Franklin Dexter 12/14/17
Using Slides
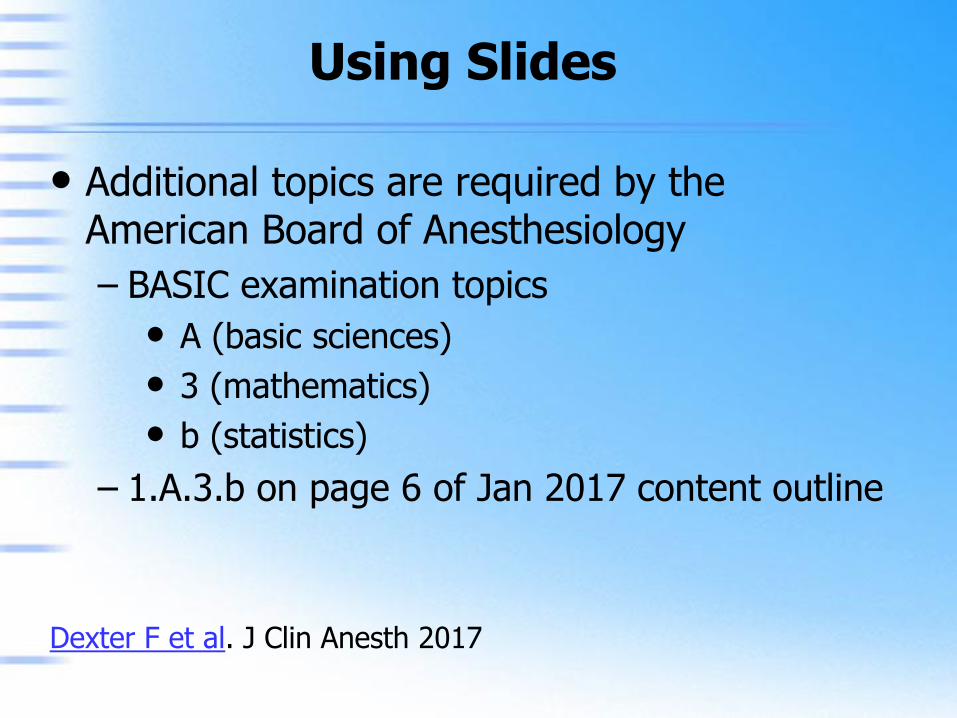
• Additional topics are required by the American Board of Anesthesiology
– BASIC examination topics
• A (basic sciences)
• 3 (mathematics)
• b (statistics)
– 1.A.3.b on page 6 of Jan 2017 content outline
Dexter F et al. J Clin Anesth 2017
Using Slides
• Additional topics are required by the American Board of Anesthesiology
– BASIC examination topics
• A (basic sciences)
• 3 (mathematics)
• b (statistics)
– 1.A.3.b on page 6 of Jan 2017 content outline
Additional topics are not used in the Operations Research for Surgical Services course
– Can stop half way through where told to do so

Using Slides
• Test predictions to remind yourself that we humans have little stochastic intuition and we study to learn to trust the mathematics
• Read the chosen content online
• Do the interactive questions
– Unless you perform statistical analyses daily, remind yourself of the mindset about solving problems for which there are correct answers
• Do not give yourself “partial credit”

Using Slides
• Use these slides downloaded and open in latest version of Adobe Reader, not web browser
– Can use Adobe Reader for mobile: iPad, iPhone, Android
• Rice University’s Online Statistics Interactive Multimedia Course contains three modes
– Standard, if you prefer to read content
– Multimedia, if you prefer to listen to lectures
– Condensed, which does not apply to our use

Using Slides
• Learn about animations’ software versions
– Since the simulations require Java, depending on security settings you may receive warnings
• You can just click “OK”
– Reading and thinking about consequences of the Illustrated Instructions and/or Video Demos on each simulation page is sufficient
• That is what most people do
• Still, if you want, you can Run Simulation

Prerequisite Knowledge – Basic Algebra I
• OR time costs $2 per minute
• Dr. Jones takes 25% more OR time to perform same procedure as Dr. Yue
• Dr. Yue uses $50 extra disposables per case
• Dr. Yue is less expensive for cases longer than?
Take the practice test at Virtual Math Lab
– If you get any of the 5 questions incorrect, use the Tutorials 7 to 10, especially Tutorial 8

Test Your Learning – Basic Algebra I
• What is the answer to the preceding question with Drs. Jones and Yue?
– A) 25 minutes
– B) 50 minutes
– C) 63 minutes
– D) 100 minutes
– E) 125 minutes

Test Your Learning – Basic Algebra I
• What is the answer to the preceding question with Drs. Jones and Yue?
– A) 25 minutes
– B) 50 minutes
– C) 63 minutes
D) 100 minutes
– E) 125 minutes

Test Your Learning – Basic Algebra I
($2 per minute) (JonesTime) ≥ ($2 per minute) (YueTime) + $50
($2 per minute) (YueTime + 0.25 YueTime) ≥
($2 per minute) (YueTime) + $50
($2 per minute) (1.25 – 1.00) YueTime ≥ $50
YueTime ≥ $50 / ($2 per minute x 0.25)
YueTime ≥ 100 minutes
Probability Distribution
• Probability distribution
– Review learning objectives at top of page
– Answer the questions at bottom
• Check your answers by clicking the OK
– Surgical case durations and time from end of surgery to extubation follow right-skewed distributions
– Birth weight, ejection fractions, and SaO2 on room air follow left-skewed distributions

Probability Distribution
• Cumulative frequency curve
– Answer the questions at the bottom of the web page and review answers
– Proportions of physiologically complex pediatric procedures performed at different hospitals in a region can be viewed with cumulative frequency curve

Central Tendency
• What is central tendency?
– Since total cost for caring for a population of patients equals the mean multiplied by the number of patients, knowing the “central tendency” of a probability distribution is important to cost accounting for anesthesia

Central Tendency
• Difference between mean and median
– View the Illustrated Instructions and consider implications for lengths of stay after surgery or surgical case durations
• Mean is approximately 53rd percentile
Dexter F et al. Estimating surgical case durations and making comparisons among facilities: identifying facilities with lower anesthesia professional fees. Anesthesia and Analgesia 116:1103-1115, 2013
Central Tendency
• Absolute deviations
– View and consider the Illustrated Instructions
– Absolute deviations often are used to assess the magnitude of differences between scheduled and actual OR times
• Day before surgery, once cases in each OR have been chosen, adjust the estimated case durations (scheduled start times)
Wachtel RE, Dexter F. Reducing tardiness from scheduled start times by making adjustments to the operating room schedule. Anesthesia & Analgesia 108:1902-1909, 2009

Central Tendency
• Mean
– Mean and median rarely are the same for historical OR times of similar cases, but often are the same for total hours of cases and turnovers of a specialty in an OR on a weekday
– When considering costs, the mean OR time is economically relevant, being proportional to the total OR time used

Central Tendency
• Median
– View and consider the Illustrated Instructions
– Median is useful when analyzing OR times because it is unaffected by very long cases
Central Tendency
• Trimmed mean
– Trimmed mean is at bottom of web page
– Many commercial products suggest OR case scheduling using trimmed mean of historical OR times of recent, similar cases

Variability
• Percentiles
– Do not worry about different ways to calculate percentiles, just that there are different ways
– The longest and shortest amounts of time to complete cases are often estimated by using the 5th and 90th percentiles of historical OR times of similar cases
• They are about 1/3rd less and 1/3rd more than the median, respectively
Variability
• Variance and standard deviation
– Standard deviation among days in the total hours of cases including turnovers affects how often anesthetists work later than average
– Although standard deviation can be used to assess lability in hemodynamic parameters during an anesthetic, estimates can be sensitive to artifacts (i.e., extreme outliers)
Variability
• Standard deviation and mean
– View and consider the Illustrated Instructions
– Focus on how large standard deviations reflect large absolute deviations from the mean
• Not same as large range
• Not same as equally spread out
• Not increased by large mean

Correlation
• Positive and negative correlation
– Payment and total costs are positively correlated
– Patient age and endotracheal tube size are positively correlated
– Average pain score and satisfaction are negatively correlated
Correlation
• Linear correlation
– Professional fee charges for anesthesia care and anesthesia time are linearly correlated
– Height and weight are not linearly correlated
– Altitude and hemoglobin saturation are not linearly correlated

Correlation
• Strength of correlation
– View and consider the Illustrated Instructions
– Propofol induction dose is strongly correlated with weight among patients of all ages
– Surgical time is very weakly correlated to anesthesia induction and emergence times

Probability
• Basic concepts
– Probability of a single event
• Surgeon #1 finishes case #1 with the surgical microscope within 3 hr
– Probability of pair of events
• Surgeon #1 finishes his case #1 with the surgical microscope within 3 hr
• Surgeon #2 finishes her case #1 without the microscope more than 3 hr after start, and only then will need the microscope for her case #2

Probability
• Conditional probability
– View and consider the Illustrated Instructions
– Probability that a case will finish within the next 1 hr is conditional on its having been on-going for the past 2 hr
• Estimating time remaining in late running OR cases is important on day of surgery
– Probability that mean arterial pressure will drop 10 mmHg within 10 min is conditional on its having already dropped 20 mmHg
Probability
• Prior probability
– View and consider the Illustrated Instructions
– Calculate the probability that a case that the surgeon has never scheduled before at the facility will take > 1 hr longer than scheduled
• Depends on prior probabilities
• Frequent problem with add-on cases done in afternoons keeping people working late
Probability
• Bayes’ theorem
– If temperature of child undergoing mastoidectomy has increased from 36.5°C to 38.3°C over the past 2 hr, consider malignant hyperthermia or remove blankets?
Normal Distributions
• Basic features
– May plan staffing at 66th percentile of workload if 2 as expensive to work overtime as during regularly scheduled hours
• Close to 1 standard deviation > mean
– May reduce staffing to save money while assuring that at least 95% of urgent cases start within 4 hr of submission
• Close to 2 standard deviations > mean

Normal Distributions
• Area under normal curve
– Area under curve from far left to X is useful for calculating probability that a case will take at most X hours
• Also useful for probability that all the cases in an OR will finish by 4:00 PM
Normal Distributions
• Differences among normal distributions
– View and consider the Illustrated Instructions
– Comparison of 2 normal distributions is central to understanding Student’s t -test comparison of means of 2 normal distributions

Normal Distributions
• Standard normal distribution
– Questions at bottom of web page are especially practical for future content
– If the total hours of cases including turnover times in an OR has a mean of 7 hr and a standard deviation of 0.5 hr, on what percentage of days will there be overtime payment for work > 8 hr?

Sampling Distributions
• Introduction
– After answering questions at bottom of web page, consider the following:
• Sampling distribution of maximum number of patients present simultaneously in the phase I post anesthesia care unit each day
• Sampling distribution of minimum mean arterial pressure after induction of anesthesia

Sampling Distributions
• Sample size
– View and consider the Video Demo
– When calculating mean variable costs per hour of OR time among all of a surgeon’s cases, typically sample size (N) > 200 cases
– When calculating mean OR time of historical cases of a certain combination of surgeon and scheduled procedure, the most common sample size at a tertiary suite is N = 0 cases and the second most common is N = 1 case

Sampling Distributions
• Central limit theorem
– View and consider the Video Demo
– Consider that for total hours of cases including turnovers, sample sizes are generally N > 30 weeks and staffing is planned for slightly more than average workload
• From central limit theorem, basing staffing on a normal distribution is often reasonable

Estimating Population Parameters
• Parameters and statistics
– To estimate how much longer one anesthetist takes to do a lumbar (labor) epidural than another, you might calculate a 95% confidence interval for the difference in their mean times

Estimating Population Parameters
• Degrees of freedom
– My anesthesia examples are less interesting than the heights of Martians on the web page

Estimating Population Parameters
• Bias
– Questions at the bottom of the web page are especially useful for OR management, because bias in case duration prediction is a common concern
– If a group of surgeons consistently underestimate OR times to get cases onto an OR schedule, then there is bias

Confidence Intervals
• Introduction
– Useful to estimate the 95% lower confidence limit for the cancellation rate of each specialty at a facility and to compare that value to a threshold for being unacceptable

Confidence Intervals
• Confidence interval for mean
– Calculate 95% two-sided confidence interval for the average payment per American Society of Anesthesiologists’ Relative Value Guide billing unit of different payers contracting with an anesthesia group

Confidence Intervals
• Student t -distribution
– Important to understand that even if you sample from a normal distribution, the mean follows a Student’s t -distribution
– For OR times, the sample sizes are often very small (e.g., N = 3), and thus the difference between Student’s t -distribution and a normal distribution is important practically
Test Your Learning – Confidence Intervals (#1)
• Heights of men undergoing inguinal hernia repair follow a normal distribution
• You have sample mean and standard deviation of heights of past 5 male patients of the surgeon
– The 0.05 inverse of the standard normal cumulative distribution function equals -1.65
– The 0.05 inverse of the Student t-distribution with 4 degrees of freedom equals -2.13

Test Your Learning – Confidence Intervals (#1)
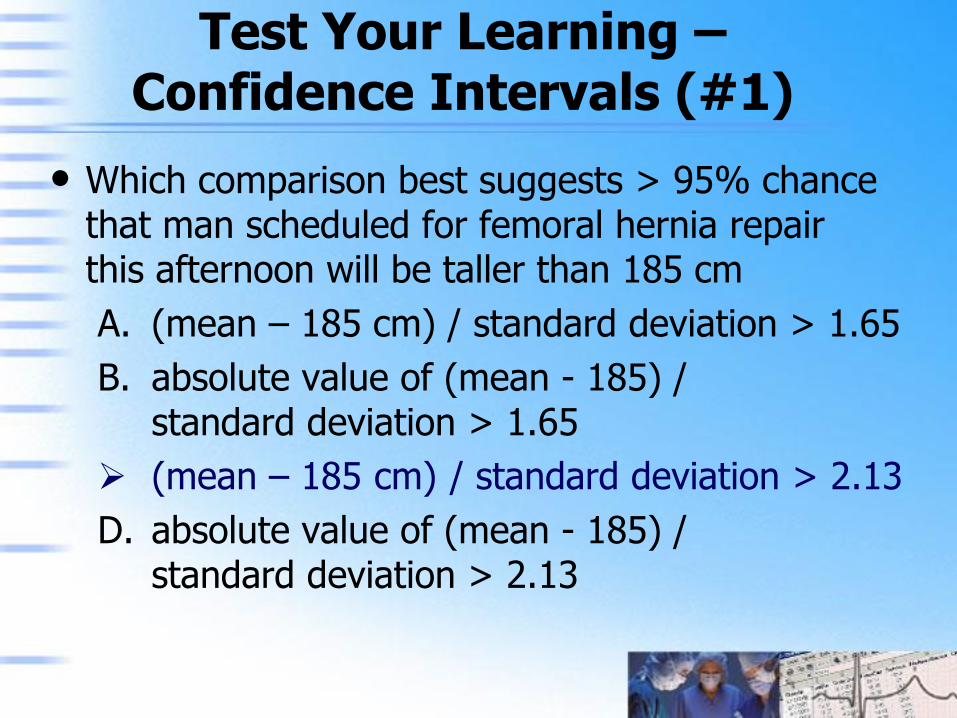
• Which comparison best suggests > 95% chance that man scheduled for femoral hernia repair this afternoon will be taller than 185 cm
A. (mean – 185 cm) / standard deviation > 1.65
B. absolute value of (mean - 185) / standard deviation > 1.65
C. (mean – 185 cm) / standard deviation > 2.13
D. absolute value of (mean - 185) / standard deviation > 2.13
Test Your Learning – Confidence Intervals (#1)
• Which comparison best suggests > 95% chance that man scheduled for femoral hernia repair this afternoon will be taller than 185 cm
A. (mean – 185 cm) / standard deviation > 1.65
B. absolute value of (mean - 185) / standard deviation > 1.65
(mean – 185 cm) / standard deviation > 2.13
D. absolute value of (mean - 185) / standard deviation > 2.13
Test Your Learning – Confidence Intervals (#1)
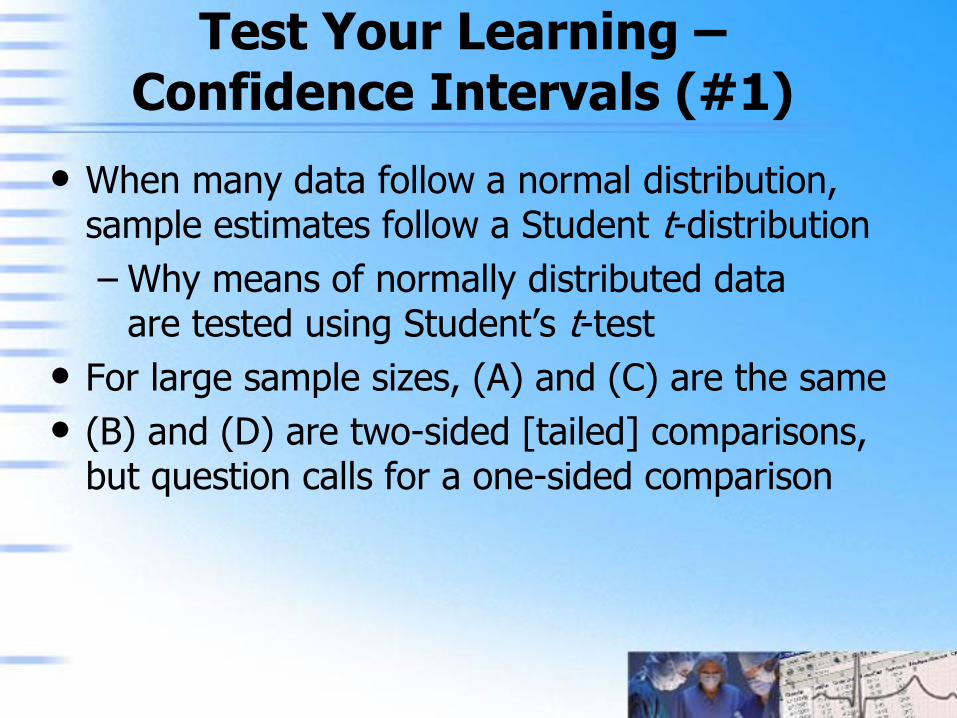
• When many data follow a normal distribution, sample estimates follow a Student t-distribution
– Why means of normally distributed data are tested using Student’s t-test
• For large sample sizes, (A) and (C) are the same
• (B) and (D) are two-sided [tailed] comparisons, but question calls for a one-sided comparison
Test Your Learning – Confidence Intervals (#1)
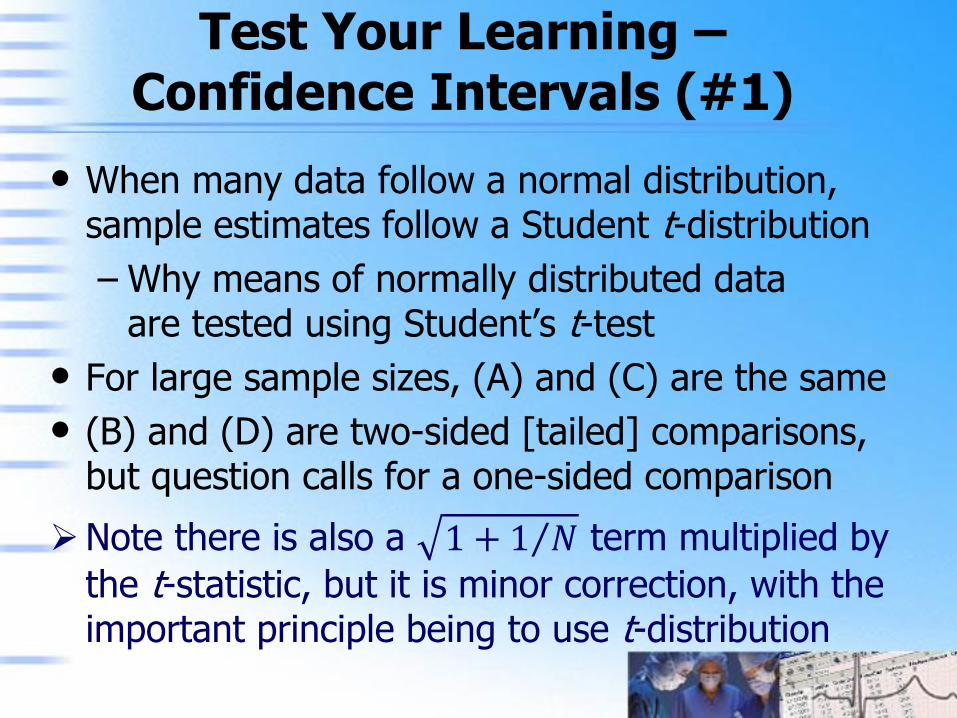
• When many data follow a normal distribution, sample estimates follow a Student t-distribution
– Why means of normally distributed data are tested using Student’s t-test
• For large sample sizes, (A) and (C) are the same
• (B) and (D) are two-sided [tailed] comparisons, but question calls for a one-sided comparison
Note there is also a 1 + 1 𝑁 term multiplied by
the t-statistic, but it is minor correction, with the important principle being to use t-distribution

Test Your Learning – Confidence Intervals (#2)
• Logarithms of operating room times tend to follow normal distributions
– Example: over 2 years, surgeon performs 100 laparoscopic pediatric inguinal hernia repairs
• A surgeon has previously performed 5 (five) anorectal myomectomies
– Which comparison best suggests > 95% chance that the next anorectal myomectomy will take the surgeon > 2 hours?

Test Your Learning – Confidence Intervals (#2)
• Which comparison best suggests > 95% chance that next case will last longer than 2 hours?
A. (mean – 2 hours) / standard deviation > 1.65
B. (mean(log10[durations in hours]) – 2) / standard deviation(log10[durations in hours]) > 1.65
C. (mean – 2 hours) / standard deviation > 2.13
D. (mean(log10[durations in hours]) – 2) / standard deviation(log10[durations in hours]) > 2.13
E. (mean(log10[durations in hours]) – log10[2] ) / standard deviation(log10[durations in hours]) > 2.13

Test Your Learning – Confidence Intervals (#2)
• Which comparison best suggests > 95% chance that next case will last longer than 2 hours?
A. (mean – 2 hours) / standard deviation > 1.65
B. (mean(log10[durations in hours]) – 2) / standard deviation(log10[durations in hours]) > 1.65
C. (mean – 2 hours) / standard deviation > 2.13
D. (mean(log10[durations in hours]) – 2) / standard deviation(log10[durations in hours]) > 2.13
(mean(log10[durations in hours]) – log10[2] ) / standard deviation(log10[durations in hours]) > 2.13
Hypothesis Testing
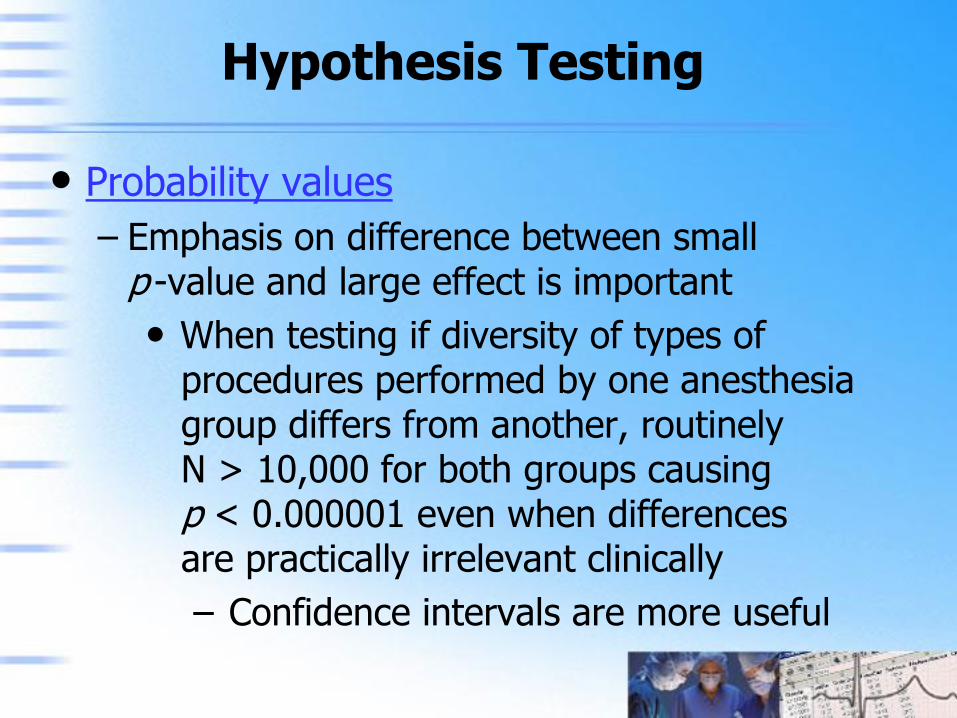
• Probability values
– Emphasis on difference between small p -value and large effect is important
• When testing if diversity of types of procedures performed by one anesthesia group differs from another, routinely N > 10,000 for both groups causing p < 0.000001 even when differences are practically irrelevant clinically
– Confidence intervals are more useful

Hypothesis Testing
• One-tailed tests
– One-tailed tests are often practical for managerial questions
• When evaluating the probability that a case will fit within a hole in the OR schedule, all that is of interest is whether its OR time will be less than or equal to some threshold

Student’s t -Test
• Testing a single mean
– Test whether a payer’s rate of payment per American Society of Anesthesiologists Relative Value Guide unit is significantly different from the national survey value

Student’s t -Test
• Difference of two means
– Test whether two surgeons take different amounts of time to complete a procedure
Statistics Review Complete for Operating Room Management

Additional Education in Operating Room Management
• www.FranklinDexter.net/education.htm
– Course in OR management by web, onsite or at the University of Iowa (3.5 days)
– Lectures on day of surgery decision making, PACU staffing, OR allocation and staffing, anesthesia staffing, financial analyses, comparing surgical services among hospitals, strategic decision making, and drug costs
• www.FranklinDexter.net
– Comprehensive bibliography of peer reviewed articles in OR & anesthesia group management

Additional Content for Anesthesia Residents
• Additional topics are required by the American Board of Anesthesiology
– Part 1, Basic topics in Anesthesiology
• A (basic sciences)
• 3 (mathematics)
• b (statistics)
– 1.A.3.b on page 6 of Jan 2017 content outline
• Additional topics not used in the Operations Research for Surgical Services course

Power Analysis
• When perform a power analysis
– Surgeons report that a new anesthesiologist has longer times from end of surgery to extubation than her colleagues
• For reliable comparison, would you need data from 10, 100, or 1000 cases?

Power Analysis
• Examples of power analyses
– When reading whether Mr. Bond can predict whether his martini was shaken or stirred, consider whether a post-anesthesia care unit nurse can predict whether a patient received propofol or desflurane for maintenance

Test Your Learning – Power Analysis
• Do mean turnover times differ < 10 min between cases of different surgeons rather than the same surgeon. (Yes) A study is proposed wherein OR nurses will record the time when each case leaves an OR until the next patient enters, and whether the surgeon is the same or different. There will be approximately 20 turnover times daily between cases of the same surgeon and 20 between cases of different surgeons. Thus, in 1 week, there will be approximately 200 turnover times in each of 2 groups.

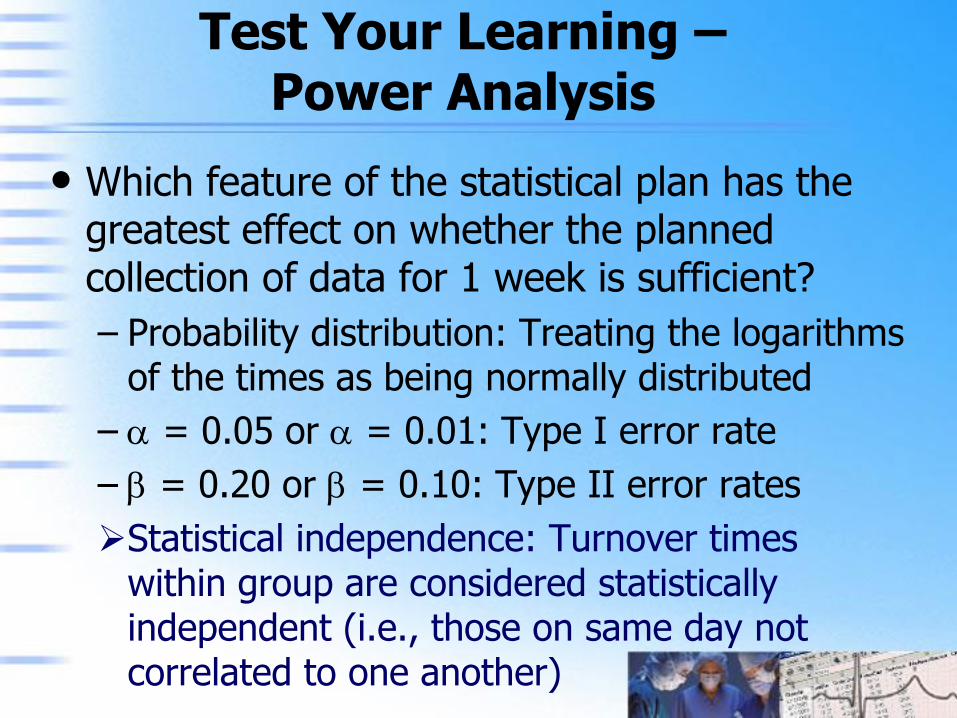
• Which feature of the statistical plan has the greatest effect on whether the planned collection of data for 1 week is sufficient?
– Probability distribution: Treating the logarithms of the times as being normally distributed
– = 0.05 or = 0.01: Type I error rate
– = 0.20 or = 0.10: Type II error rates
– Statistical independence: Turnover times within group are considered statistically independent (i.e., those on same day not correlated to one another)
Test Your Learning – Power Analysis
• Which feature of the statistical plan has the greatest effect on whether the planned collection of data for 1 week is sufficient?
– Probability distribution: Treating the logarithms of the times as being normally distributed
– = 0.05 or = 0.01: Type I error rate
– = 0.20 or = 0.10: Type II error rates
Statistical independence: Turnover times within group are considered statistically independent (i.e., those on same day not correlated to one another)
Test Your Learning – Power Analysis
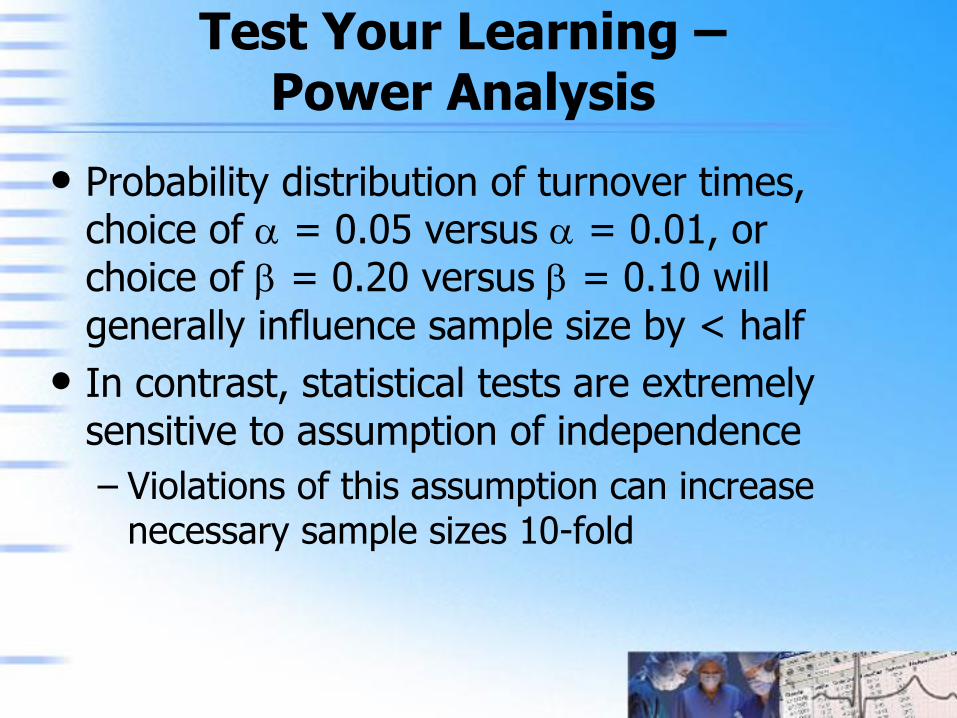
• Probability distribution of turnover times, choice of = 0.05 versus = 0.01, or choice of = 0.20 versus = 0.10 will generally influence sample size by < half
• In contrast, statistical tests are extremely sensitive to assumption of independence
– Violations of this assumption can increase necessary sample sizes 10-fold
When read that data assumed independent and identically distributed, this matters!
Test Your Learning – Power Analysis

Generalizability Theory Has Analogy to Power Analysis
• To detect differences in postoperative pain between 2 groups with/without regional analgesia, need total of 350 patients
• Accrue period 8 years at your hospital
– Reality: Impractically large sample size
• Suppose proceed anyway, using 100 patients as “exploratory study”
– Findings will not be reproducible
– Confidence intervals will be wide
– P < 0.05 will be fragile
Generalizability Theory Has Analogy to Power Analysis
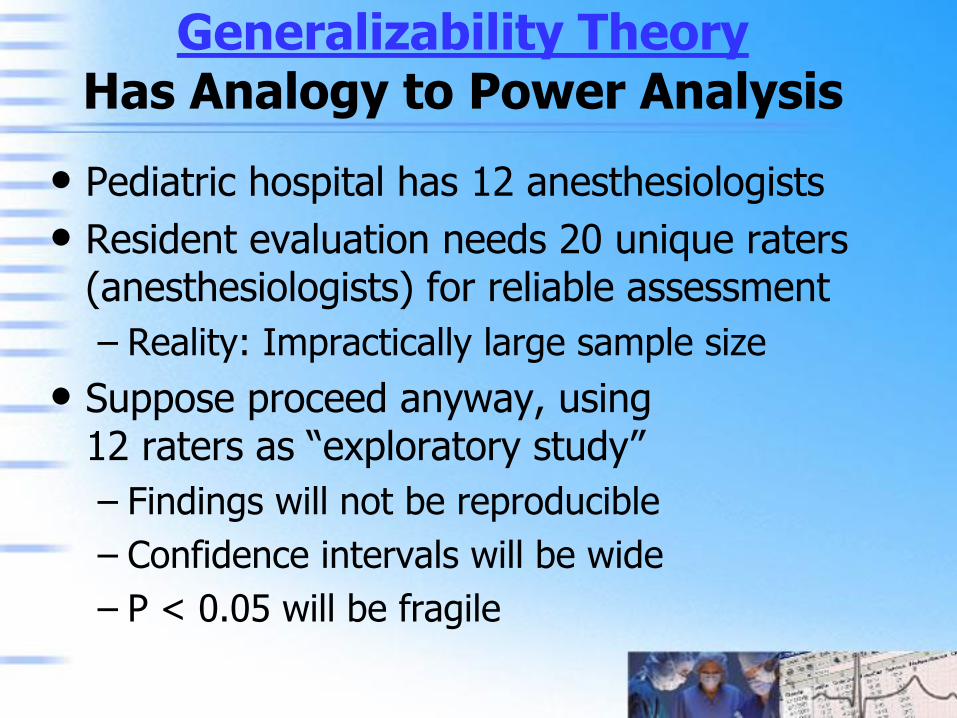
• Pediatric hospital has 12 anesthesiologists
• Resident evaluation needs 20 unique raters (anesthesiologists) for reliable assessment
– Reality: Impractically large sample size
• Suppose proceed anyway, using 12 raters as “exploratory study”
– Findings will not be reproducible
– Confidence intervals will be wide
– P < 0.05 will be fragile

Repeated Measures and Independent Raters
• Trial of 2 IV anesthetics comparing minimum BP measured q 5 minutes for 30 minutes
• Power analysis shows that 30 patients in each group can detect important differences
– Will result in 180 BP measurements per group
• Perform the trial instead using 6 patients in each group and measure BP q 1 minute
– Will result in 180 BP measurements per group
• Invalid because BP measurements within subject are not independent random samples

Regression Analysis
• Simple linear regression
– When adjusting scheduled OR times for cases, use historical data and let the dependent variable (Y) be actual times and independent variable (X) be the scheduled times

Analysis of Variance
• Uses of analysis of variance
– Compare mean turnover times among different anesthesiologists in a group
– Compare mean surgical times for the same common procedure among surgeons

Chi Square
• Chi-square analysis of contingency table
– Consider columns of table to be different anesthesiologists and the two rows to be numbers of weekends worked previous year
– Chi-square test compares percentage incidence of weekends worked among anesthesiologists
Odds Ratio and Relative Risk
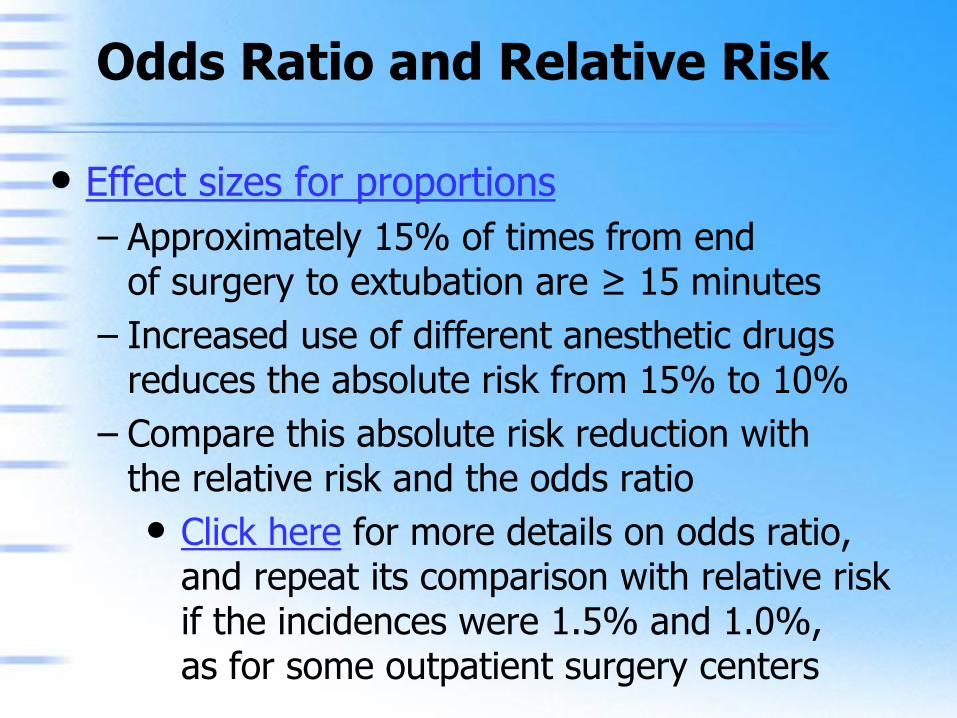
• Effect sizes for proportions
– Approximately 15% of times from end of surgery to extubation are ≥ 15 minutes
– Increased use of different anesthetic drugs reduces the absolute risk from 15% to 10%
– Compare this absolute risk reduction with the relative risk and the odds ratio
• Click here for more details on odds ratio, and repeat its comparison with relative risk if the incidences were 1.5% and 1.0%, as for some outpatient surgery centers

Odds Ratio and Relative Risk
• Example comparing the statistics
– For many economic applications, the statistic of interest is the absolute risk reduction
– For many randomized trials to prevent adverse events, the relative risk is studied
– For many retrospective studies of rare adverse events, the odds ratio can easily be studied

Test Your Learning – Odds Ratio and Relative Risk
• Each night after 5 PM, 1 anesthesiologist and 3 nurse anesthetists are on-call
• Team-based 1 hour training is initiated on making decisions on the day of surgery including principles of reducing the hours of over-utilized OR time
• Half the teams receive training and half do not
• Among nights (teams) with training, 10 of 50 decisions reviewed were poor quality
• Among nights (teams) without training, 40 of 50 decisions reviewed were poor quality

Test Your Learning – Odds Ratio and Relative Risk
• What is calculated value of the odds ratio?
• What is calculated value of the relative risk?
• Can the odds ratio be meaningfully interpreted?
Test Your Learning – Odds Ratio and Relative Risk
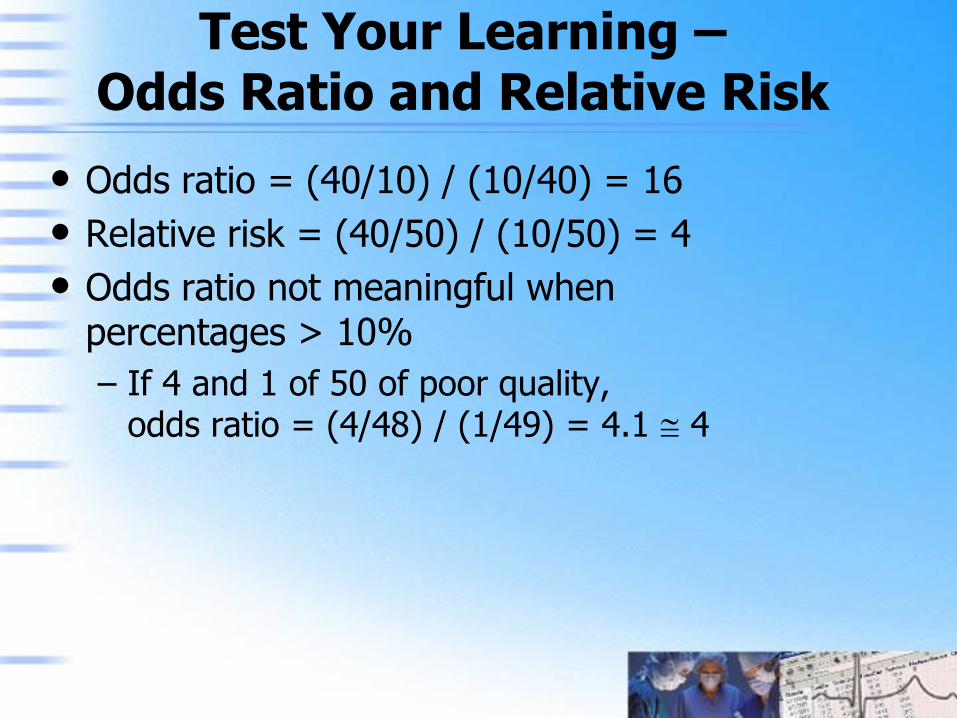
• Odds ratio = (40/10) / (10/40) = 16
• Relative risk = (40/50) / (10/50) = 4
• Odds ratio not meaningful when percentages > 10%
– If 4 and 1 of 50 of poor quality, odds ratio = (4/48) / (1/49) = 4.1 4
Meta-Analysis
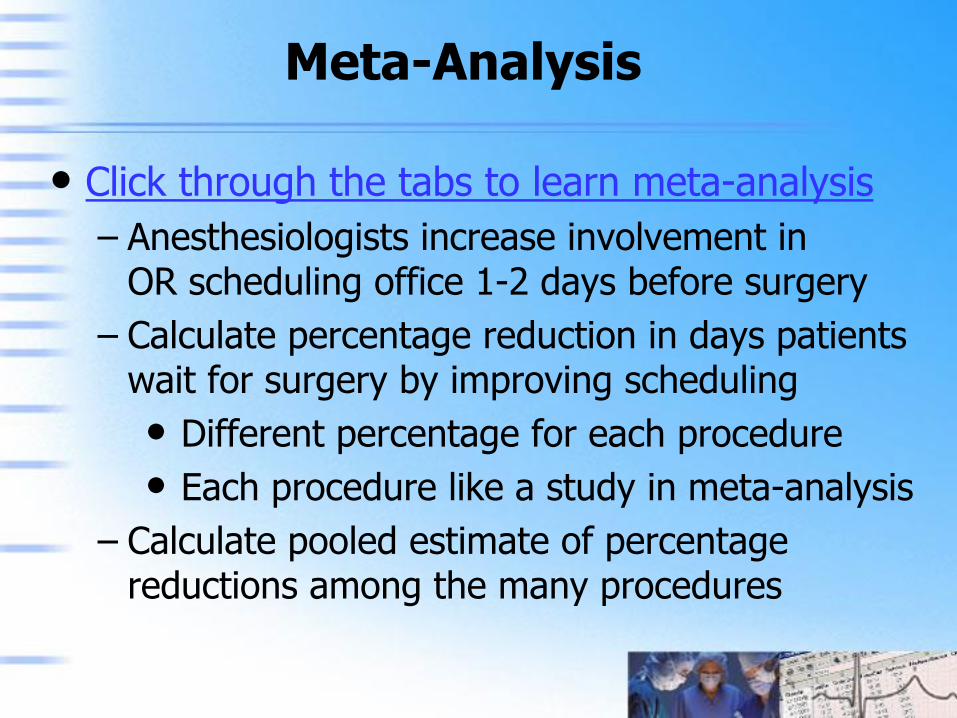
• Click through the tabs to learn meta-analysis
– Anesthesiologists increase involvement in OR scheduling office 1-2 days before surgery
– Calculate percentage reduction in days patients wait for surgery by improving scheduling
• Different percentage for each procedure
• Each procedure like a study in meta-analysis
– Calculate pooled estimate of percentage reductions among the many procedures

Validity of Scales (and Educational Tests)
• Content (face) validity of non-technical skills often unclear without specification of the principal attributes of the anesthetics
– Patient age
– Patient physical status
– Surgical procedure(s)
• For study design, important because anesthesia for large diversity of procedures

Validity of Scales
• Concurrent validity reflects whether scale performs as expected in relation to other variables collected at the same time
– Examples for residents’ evaluations of faculty supervision during OR cases
• Textual analysis of written comments supplementing the numerical scores
• Evaluations of the same faculty when working in ICU or pain clinic
• Nurse anesthetists’ evaluations
Validity of Scales
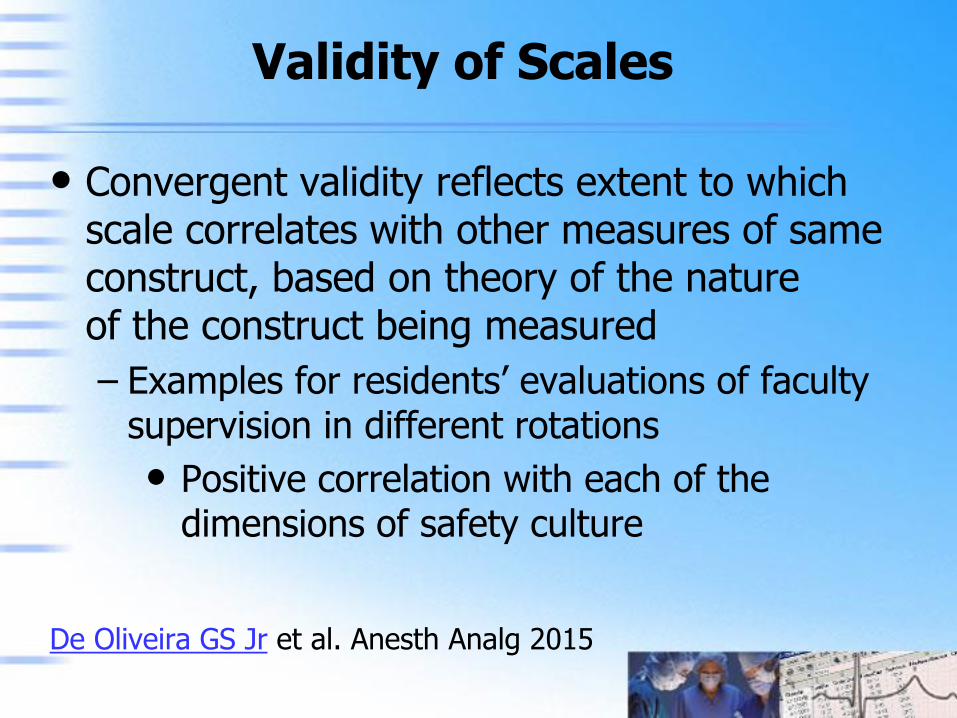
• Convergent validity reflects extent to which scale correlates with other measures of same construct, based on theory of the nature of the construct being measured
– Examples for residents’ evaluations of faculty supervision in different rotations
• Positive correlation with each of the dimensions of safety culture
De Oliveira GS Jr et al. Anesth Analg 2015

Validity of Scales
• Discriminant validity reflects extent to which scale does not correlate with other constructs from which it is supposed to differ
– Examples for residents’ evaluations of faculty supervision in different rotations
• Resident’s average hours working weekly
• Resident’s year in program
• Resident’s program size
• Resident’s gender
• Resident’s age

Internal Consistency “Scale Did Not Ask About …”
• Assessing knowledge of anesthesia machine
– Medical student that gets first 6 items all wrong has indicated his (lack of) knowledge
– No need to ask 100 additional items
• Yet, often: “since XYZ scale or test asks A, B, and C, but not D, E, and F, we added items”
– By this logic, add 100 more items too
– If scale has large internal consistency, then trust that adding more items does not result in more reliable assessment

Internal Consistency “Scale Did Not Ask About …”
• Cronbach’s alpha is the mean of all possible split-half coefficients resulting from the different ways of splitting a scale’s items
• Values of 0.85, 0.90, etc., are good
– Valid when used with non-redundant items
• Addition of essentially redundant items (e.g., nearly identical wording) artificially increases coefficient alpha

Bland-Altman Analysis
• Description from British Journal of Anaesthesia
– On vertical axis plot difference between:
• Update of estimated case duration made at the time out before skin incision
• Actual duration known when case is done
– Plot on horizontal axis the actual duration