STATISTICS CHAPTER ONE ECN 129
36
1.1 Chapter One What is Statistics?
-
Upload
hussain-jawa -
Category
Documents
-
view
219 -
download
0
Transcript of STATISTICS CHAPTER ONE ECN 129
7/23/2019 STATISTICS CHAPTER ONE ECN 129
http://slidepdf.com/reader/full/statistics-chapter-one-ecn-129 1/36
1.1
Chapter One
What is Statistics?

7/23/2019 STATISTICS CHAPTER ONE ECN 129
http://slidepdf.com/reader/full/statistics-chapter-one-ecn-129 2/36
1.2
What is Statistics?
“Statistics is a way to get information from data.
7/23/2019 STATISTICS CHAPTER ONE ECN 129
http://slidepdf.com/reader/full/statistics-chapter-one-ecn-129 3/36
1.3
What is Statistics?
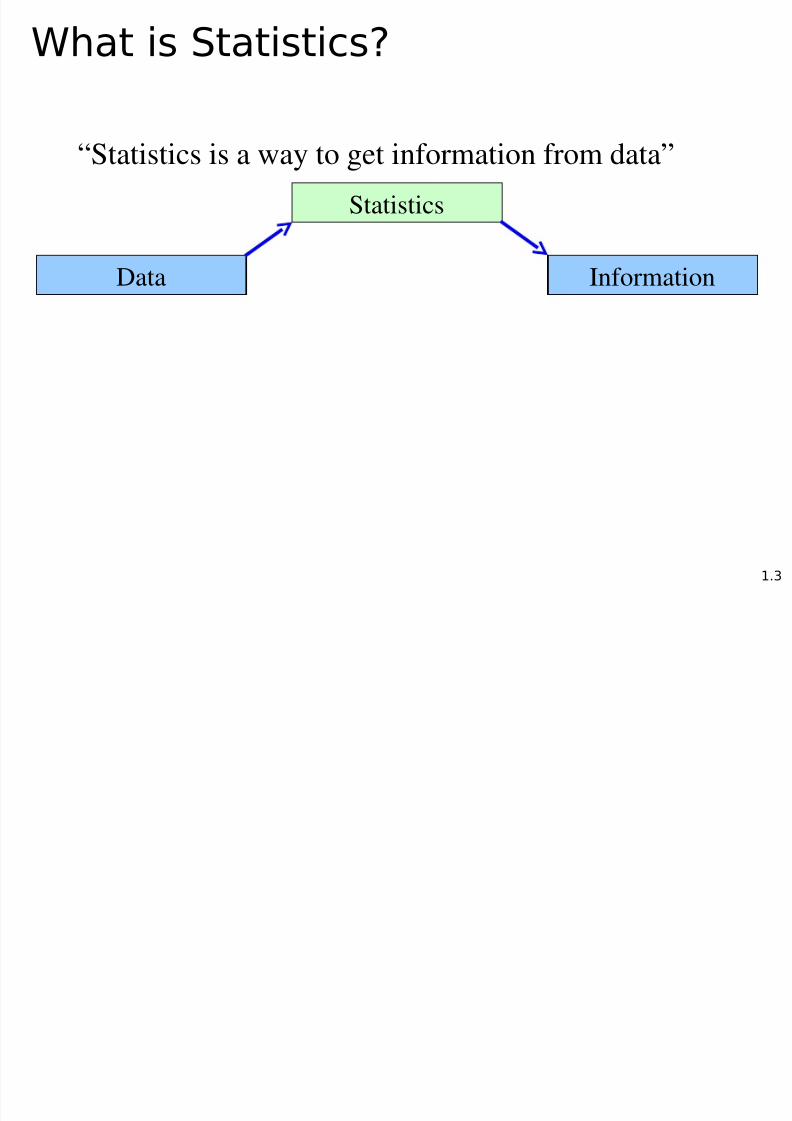
“Statistics is a way to get information from data”
Data
Statistics
Information

7/23/2019 STATISTICS CHAPTER ONE ECN 129
http://slidepdf.com/reader/full/statistics-chapter-one-ecn-129 4/36
1.4
Example 2.6 Stats Anxiety
A student enrolled in a business program is attending the first
class of the required statistics course. The student is somewhatapprehensive because he believes the myth that the course is
difficult.
To alleviate his anxiety the student asks the professor about
last year’s marks.
The professor obliges and provides a list of the final marks,
which is composed of term work plus the final exam. What
information can the student obtain from the list?

7/23/2019 STATISTICS CHAPTER ONE ECN 129
http://slidepdf.com/reader/full/statistics-chapter-one-ecn-129 5/36
1.5
Example 2.6 Stats Anxiety
7/23/2019 STATISTICS CHAPTER ONE ECN 129
http://slidepdf.com/reader/full/statistics-chapter-one-ecn-129 6/36
1.6
Example 2.6 Stats Anxiety
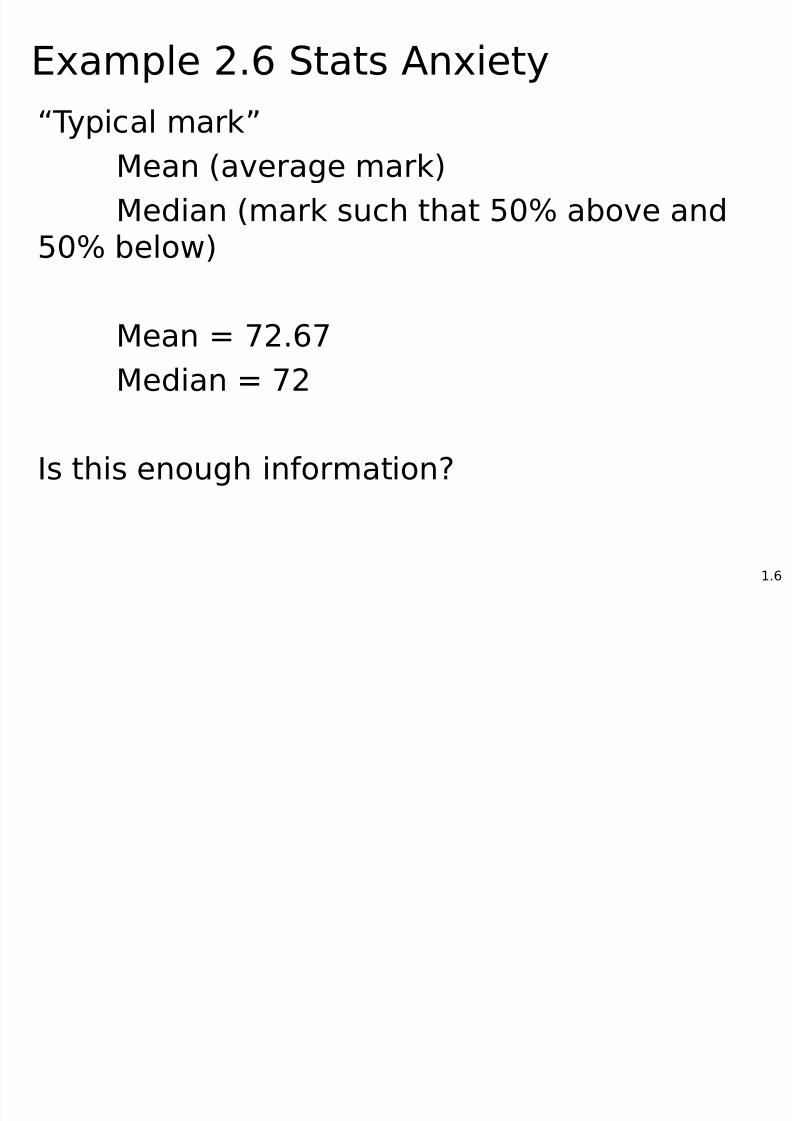
“Typical mark”ean !a"era#e mark$
e%ian !mark s&ch that 5'( a)*"e an%5'( )el*+$
ean , -2.6-
e%ian , -2
s this en*&#h in/*rmati*n?

7/23/2019 STATISTICS CHAPTER ONE ECN 129
http://slidepdf.com/reader/full/statistics-chapter-one-ecn-129 7/361.-
Example 2.6 Stats Anxiety
Are m*st */ the marks cl&stere% ar*&n% themean *r are they m*re sprea% *&t?
0an#e , axim&m minim&m , 253 ,
3
ariance
Stan%ar% %e"iati*n
7/23/2019 STATISTICS CHAPTER ONE ECN 129
http://slidepdf.com/reader/full/statistics-chapter-one-ecn-129 8/361.
Example 2.6 Stats Anxiety
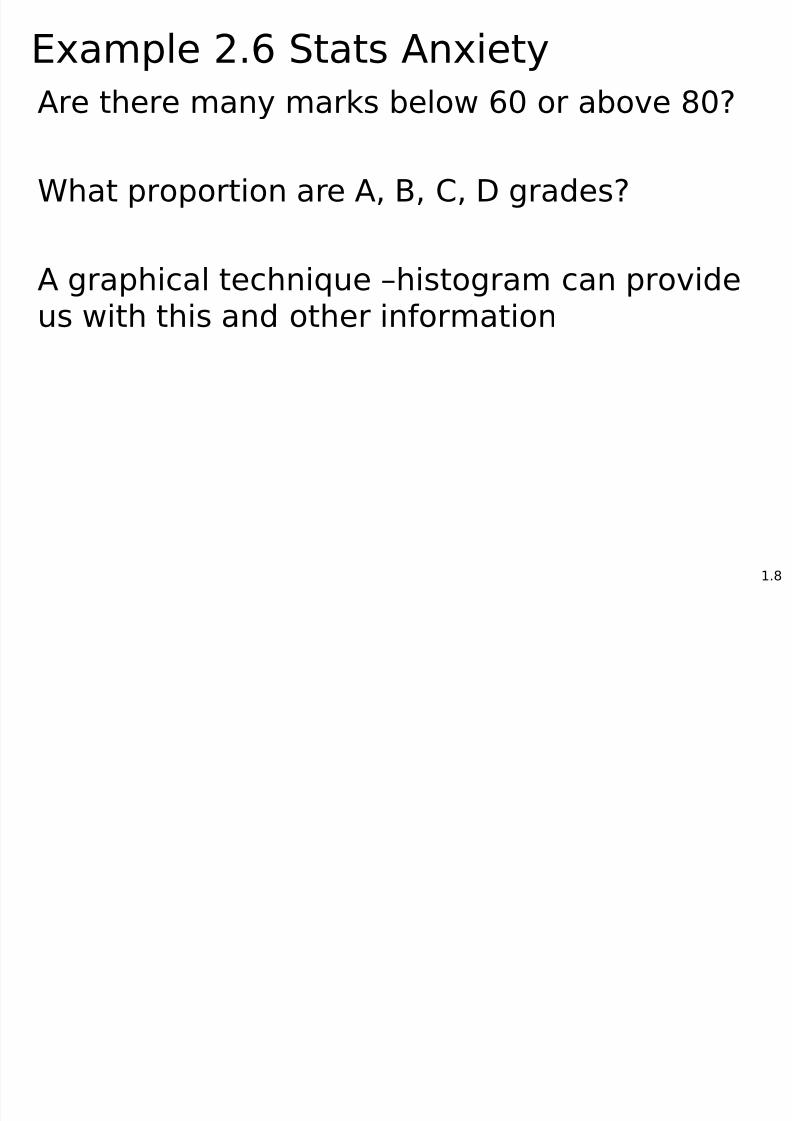
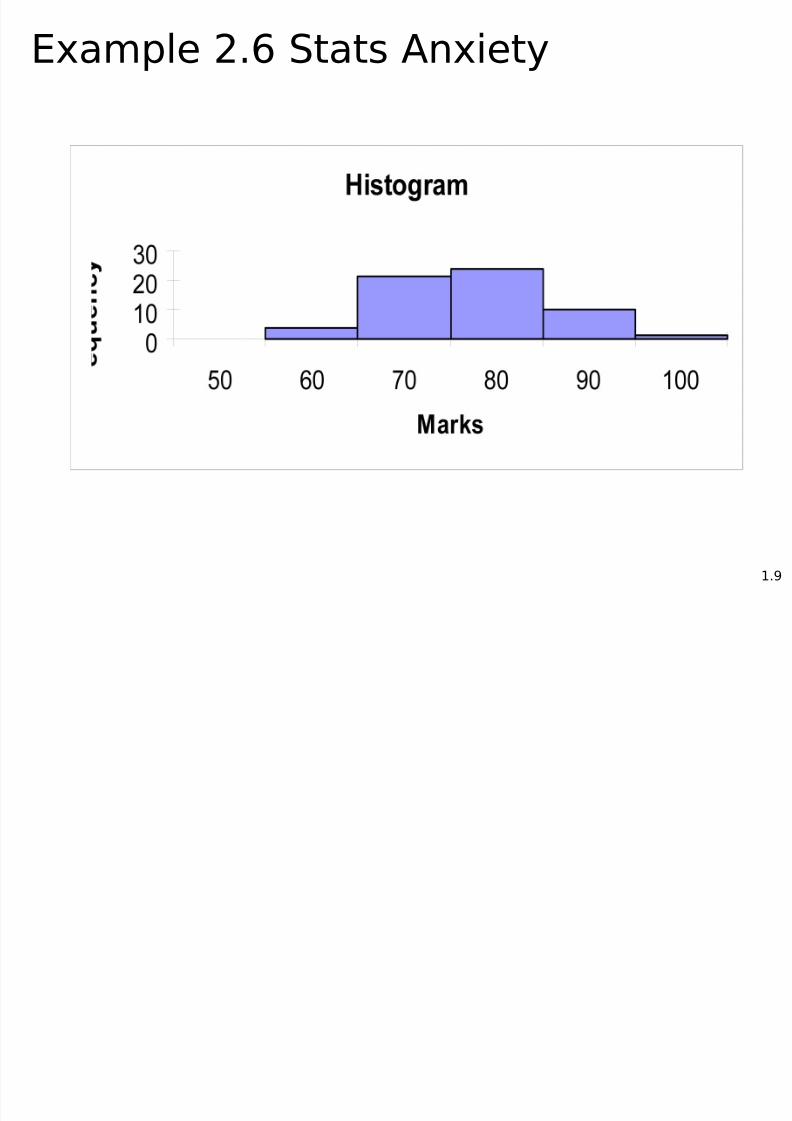
Are there many marks )el*+ 6' *r a)*"e '?
What pr*p*rti*n are A 7 8 9 #ra%es?
A #raphical techni:&e hist*#ram can pr*"i%e&s +ith this an% *ther in/*rmati*n
7/23/2019 STATISTICS CHAPTER ONE ECN 129
http://slidepdf.com/reader/full/statistics-chapter-one-ecn-129 9/361.
Example 2.6 Stats Anxiety

7/23/2019 STATISTICS CHAPTER ONE ECN 129
http://slidepdf.com/reader/full/statistics-chapter-one-ecn-129 10/361.1'
9escripti"e Statistics
Descriptive statistics deals with methods of organizing,
summarizing, and presenting data in a convenient andinformative way.
One form of descriptive statistics uses graphical techniques,which allow statistics practitioners to present data in ways that
make it easy for the reader to extract useful information.
Chapter 2 and 3 introduces several graphical methods.
7/23/2019 STATISTICS CHAPTER ONE ECN 129
http://slidepdf.com/reader/full/statistics-chapter-one-ecn-129 11/361.11
9escripti"e Statistics
Another form of descriptive statistics uses numerical
techniques to summarize data.
The mean and median are popular numerical techniques to
describe the location of the data.
The range, variance, and standard deviation measure the
variability of the data
Chapter 4 introduces several numerical statistical measures
that describe different features of the data.

7/23/2019 STATISTICS CHAPTER ONE ECN 129
http://slidepdf.com/reader/full/statistics-chapter-one-ecn-129 12/361.12
8ase 12.1 ;epsi<s Excl&si"ityA#reementA large university with a total enrollment of about 50,000
students has offered Pepsi-Cola an exclusivity agreement thatwould give Pepsi exclusive rights to sell its products at all
university facilities for the next year with an option for future
years.
In return, the university would receive 35% of the on-campus
revenues and an additional lump sum of $200,000 per year.
Pepsi has been given 2 weeks to respond.

7/23/2019 STATISTICS CHAPTER ONE ECN 129
http://slidepdf.com/reader/full/statistics-chapter-one-ecn-129 13/36
ntr*%&ce ne+ c*ncepts "iaexamples• Population
• Sample
• Parameters
• statistics
• Statistical Inference• Confidence level
• Significance level
1.13
7/23/2019 STATISTICS CHAPTER ONE ECN 129
http://slidepdf.com/reader/full/statistics-chapter-one-ecn-129 14/361.14
8ase 12.1 ;epsi<s Excl&si"ityA#reementThe market for soft drinks is measured in terms of 12-ounce
cans.
Pepsi currently sells an average of 22,000 cans per week (over
the 40 weeks of the year that the university operates).
The cans sell for an average of 1 dollar each. The costs
including labor are 30 cents per can.
Pepsi is unsure of its market share but suspects it is
considerably less than 50%.

7/23/2019 STATISTICS CHAPTER ONE ECN 129
http://slidepdf.com/reader/full/statistics-chapter-one-ecn-129 15/361.15
8ase 12.1 ;epsi<s Excl&si"ityA#reementA quick analysis reveals that if its current market share were
25%, then, with an exclusivity agreement,Pepsi would sell 88,000 (22,000 is 25% of 88,000) cans per
week or 3,520,000 cans per year.
The profit or loss can be calculated.
The only problem is that we do not know how many soft
drinks are sold weekly at the university.
7/23/2019 STATISTICS CHAPTER ONE ECN 129
http://slidepdf.com/reader/full/statistics-chapter-one-ecn-129 16/361.16
8ase 12.1 ;epsi<s Excl&si"ityA#reementPepsi assigned a recent university graduate to survey the
university's students to supply the missing information.
Accordingly, she organizes a survey that asks 500 students to
keep track of the number of soft drinks they purchase in thenext 7 days.
The responses are stored in a file on the disk that accompanies
this book. Case 12.1
7/23/2019 STATISTICS CHAPTER ONE ECN 129
http://slidepdf.com/reader/full/statistics-chapter-one-ecn-129 17/361.1-
n/erential statistics
The information we would like to acquire in Case 12.1 is an
estimate of annual profits from the exclusivity agreement. Thedata are the numbers of cans of soft drinks consumed in 7 days
by the 500 students in the sample.
We want to know the mean number of soft drinks consumed
by all 50,000 students on campus.
To accomplish this goal we need another branch of statistics-inferential statistics.
7/23/2019 STATISTICS CHAPTER ONE ECN 129
http://slidepdf.com/reader/full/statistics-chapter-one-ecn-129 18/361.1
n/erential statistics
Inferential statistics is a body of methods used to draw
conclusions or inferences about characteristics of populationsbased on sample data.
The population in question in this case is the soft drink
consumption of the university's 50,000 students.
The cost of interviewing each student would be prohibitive and
extremely time consuming.
Statistical techniques make such endeavors unnecessary.
Instead, we can sample a much smaller number of students(the sample size is 500) and infer from the data the number of
soft drinks consumed by all 50,000 students. We can then
estimate annual profits for Pepsi.

7/23/2019 STATISTICS CHAPTER ONE ECN 129
http://slidepdf.com/reader/full/statistics-chapter-one-ecn-129 19/36
1.1
Example 12.5
When an election for political office takes place, the television
networks cancel regular programming and instead provideelection coverage.
Usually the ballots are counted the results are reported. Thistakes time.
However, for important offices such as president or senator in
large states, the networks actively compete to see which willbe the first to predict a winner.

7/23/2019 STATISTICS CHAPTER ONE ECN 129
http://slidepdf.com/reader/full/statistics-chapter-one-ecn-129 20/36
1.2'
Example 12.5
This is done through exit polls, wherein a random sample of
voters who exit the polling booth is asked for whom theyvoted.
From the data the sample proportion of voters supporting thecandidates is computed.
A statistical technique is applied to determine whether there is
enough evidence to infer that the leading candidate will garnerenough votes to win.

7/23/2019 STATISTICS CHAPTER ONE ECN 129
http://slidepdf.com/reader/full/statistics-chapter-one-ecn-129 21/36
1.21
Example 12.5
The exit poll results from the state of Florida during the 2000
year elections were recorded (only the votes of the Republicancandidate George W. Bush and the Democrat Albert Gore).
Suppose that the results (765 people who voted for either Bush
or Gore) were stored on a file on the disk. (1 = Gore and 2 =
Bush) Xm12-05
The network analysts would like to know whether they canconclude that George W. Bush will win the state of Florida.
7/23/2019 STATISTICS CHAPTER ONE ECN 129
http://slidepdf.com/reader/full/statistics-chapter-one-ecn-129 22/36
1.22
Example 12.5
Example 12.5 describes a very common application of
statistical inference.
The population the television networks wanted to make
inferences about is the approximately 5 million Floridians whovoted for Bush or Gore for president.
The sample consisted of the 765 people randomly selected by
the polling company who voted for either of the two maincandidates.

7/23/2019 STATISTICS CHAPTER ONE ECN 129
http://slidepdf.com/reader/full/statistics-chapter-one-ecn-129 23/36
1.23
Example 12.5
The characteristic of the population that we would like to
know is the proportion of the total electorate that voted forBush.
Specifically, we would like to know whether more than 50%of the electorate voted for Bush (counting only those who
voted for either the Republican or Democratic candidate).
7/23/2019 STATISTICS CHAPTER ONE ECN 129
http://slidepdf.com/reader/full/statistics-chapter-one-ecn-129 24/36
1.24
Example 12.5
Because we will not ask every one of the 5 million actual
voters for whom they voted, we cannot predict the outcomewith 100% certainty.
A sample that is only a small fraction of the size of thepopulation can lead to correct inferences only a certain
percentage of the time.
You will find that statistics practitioners can control thatfraction and usually set it between 90% and 99%.

7/23/2019 STATISTICS CHAPTER ONE ECN 129
http://slidepdf.com/reader/full/statistics-chapter-one-ecn-129 25/36
1.25
=ey Statistical 8*ncepts
Population
— a population is the group of all items of interest toa statistics practitioner.
— frequently very large; sometimes infinite.
E.g. All 5 million Florida voters, per Example 12.5
Sample
— A sample is a subset of data drawn from thepopulation.
— Potentially very large, but less than the population.
E.g. a sample of 765 voters exit polled on election day.

7/23/2019 STATISTICS CHAPTER ONE ECN 129
http://slidepdf.com/reader/full/statistics-chapter-one-ecn-129 26/36
1.26
=ey Statistical 8*ncepts
Parameter
— A descriptive measure of a population.
Statistic
— A descriptive measure of a sample.

7/23/2019 STATISTICS CHAPTER ONE ECN 129
http://slidepdf.com/reader/full/statistics-chapter-one-ecn-129 27/36
1.2-
=ey Statistical 8*ncepts
Populations have Parameters,
Samples have Statistics.
;arameter
;*p&lati*n Sample
Statistic
S&)set

7/23/2019 STATISTICS CHAPTER ONE ECN 129
http://slidepdf.com/reader/full/statistics-chapter-one-ecn-129 28/36
1.2
9escripti"e Statistics
…are methods of organizing, summarizing, and presenting
data in a convenient and informative way. These methodsinclude:
Graphical Techniques (Chapter 2, 3), and
Numerical Techniques (Chapter 4).
The actual method used depends on what information we
would like to extract. Are we interested in…
• measure(s) of central location? and/or
• measure(s) of variability (dispersion)?
Descriptive Statistics helps to answer these questions…

7/23/2019 STATISTICS CHAPTER ONE ECN 129
http://slidepdf.com/reader/full/statistics-chapter-one-ecn-129 29/36
1.2
n/erential Statistics
Descriptive Statistics describe the data set that’s being
analyzed, but doesn’t allow us to draw any conclusions ormake any interferences about the data. Hence we need
another branch of statistics: inferential statistics.
Inferential statistics is also a set of methods, but it is used
to draw conclusions or inferences about characteristics of
populations based on data from a sample.
7/23/2019 STATISTICS CHAPTER ONE ECN 129
http://slidepdf.com/reader/full/statistics-chapter-one-ecn-129 30/36
1.3'
Statistical n/erence
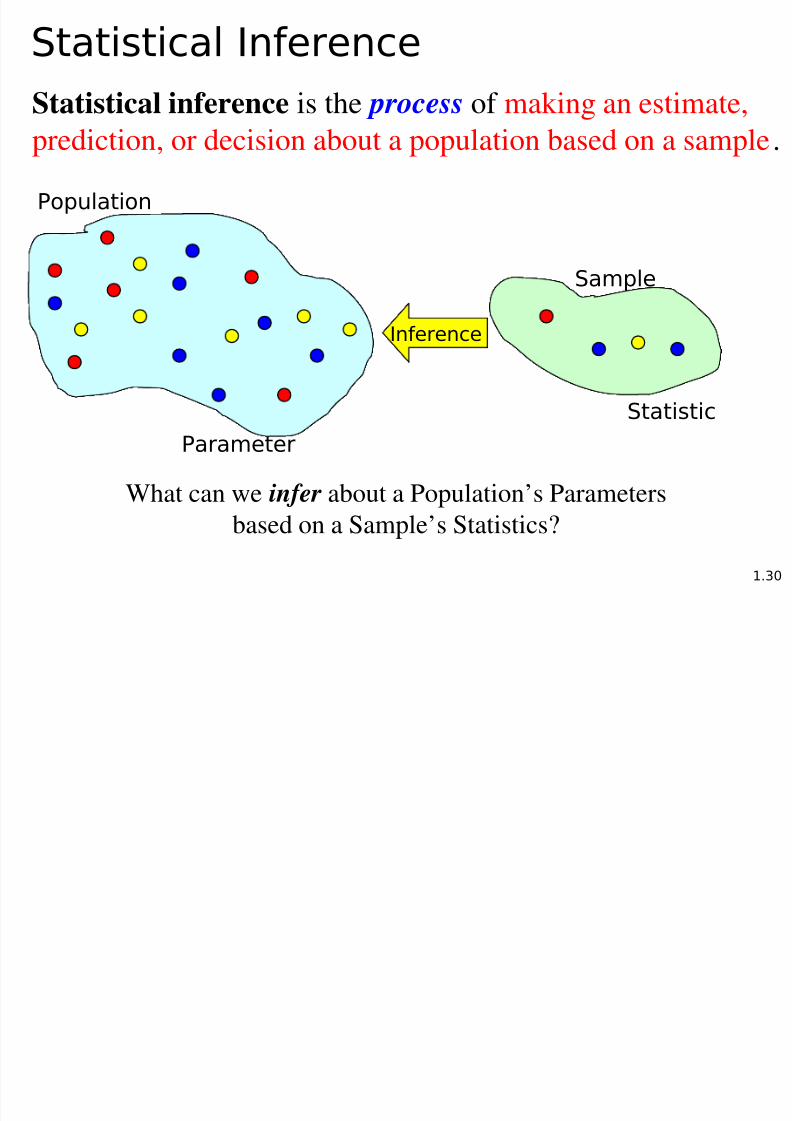
Statistical inference is the process of making an estimate,
prediction, or decision about a population based on a sample.
;arameter
;*p&lati*n
Sample
Statistic
n/erence
What can we infer about a Population’s Parameters
based on a Sample’s Statistics?

7/23/2019 STATISTICS CHAPTER ONE ECN 129
http://slidepdf.com/reader/full/statistics-chapter-one-ecn-129 31/36
1.31
Statistical n/erence
We use statistics to make inferences about parameters.
Therefore, we can make an estimate, prediction, or decision
about a population based on sample data.
Thus, we can apply what we know about a sample to the
larger population from which it was drawn!
7/23/2019 STATISTICS CHAPTER ONE ECN 129
http://slidepdf.com/reader/full/statistics-chapter-one-ecn-129 32/36
1.32
Statistical n/erence
Rationale:
• Large populations make investigating each member impracticaland expensive.
• Easier and cheaper to take a sample and make estimates about the
population from the sample.
However:
Such conclusions and estimates are not always going to be correct.
For this reason, we build into the statistical inference “measures ofreliability”, namely confidence level and significance level.

7/23/2019 STATISTICS CHAPTER ONE ECN 129
http://slidepdf.com/reader/full/statistics-chapter-one-ecn-129 33/36
1.33
8*n>%ence Si#ni>cance @e"els
The confidence level is the proportion of times that an
estimating procedure will be correct.E.g. a confidence level of 95% means that, estimates based on this
form of statistical inference will be correct 95% of the time.
When the purpose of the statistical inference is to draw a
conclusion about a population, the significance level
measures how frequently the conclusion will be wrong in
the long run.E.g. a 5% significance level means that, in the long run, this type
of conclusion will be wrong 5% of the time.

7/23/2019 STATISTICS CHAPTER ONE ECN 129
http://slidepdf.com/reader/full/statistics-chapter-one-ecn-129 34/36
1.34
8*n>%ence Si#ni>cance @e"els
If we useα(Greek letter “alpha”) to represent significance,
then our confidence level is 1 -α.
This relationship can also be stated as:
Confidence Level
+ Significance Level
= 1
7/23/2019 STATISTICS CHAPTER ONE ECN 129
http://slidepdf.com/reader/full/statistics-chapter-one-ecn-129 35/36
1.35
8*n>%ence Si#ni>cance @e"els
Consider a statement from polling data you may hear about
in the news:
“This poll is considered accurate within 3.4
percentage points, 19 times out of 20.”
In this case, our confidence level is 95% (19/20 = 0.95),
while our significance level is 5%.

7/23/2019 STATISTICS CHAPTER ONE ECN 129
http://slidepdf.com/reader/full/statistics-chapter-one-ecn-129 36/36
Statistical Applicati*ns in 7&siness
Statistical analysis plays an important role in virtually all
aspects of business and economics.
Throughout this course, we will see applications of statistics
in accounting, economics, finance, human resourcesmanagement, marketing, and operations management.