Statistics and forecast - Svensk...
14
Statistics and forecast This is quarterly edition of statistics and forecasts for the Wind Power Market, covering data from turbine manufacturers and wind power developers acting on the Swedish market (estimated coverage is 100 percent respectively 95 percent of the total Swedish market) Q2 2017 Svensk Vindenergi – Swedish Wind Energy Association, SWEA 2017-06-26
Transcript of Statistics and forecast - Svensk...

Statistics and forecastThis is quarterly edition of statistics and forecasts for the Wind Power Market, covering data from
turbine manufacturers and wind power developers acting on the Swedish market (estimated
coverage is 100 percent respectively 95 percent of the total Swedish market)
Q2 2017
Svensk Vindenergi – Swedish Wind Energy Association, SWEA
2017-06-26

• The statistics are based on the order books of the turbine manufacturers and
project portfolios of the wind power developers presented at aggregated level
• The forecast consists of three future scenarios (low, base, high). They are based
on assumptions regarding which projects will be realized - considering today’s
market situation and the future’s.
• Low case: Only projects where turbine contracts (firm and unconditional) have been signed
will be realized. In this scenario no further investment decisions are made, hence this
scenario defines the lower limit of wind power growth in Sweden.
• Base case: Projects with signed turbine contracts, approximately 10 percent of permitted
projects and 5 percent of projects under permission process will be realized. This is the most
realistic scenario and is the official forecast.
• High case: Projects with signed turbine contracts, around 15 percent of permitted projects
and 10 percent of projects under permission process will be realized. This scenario may be
relevant in circumstances leading to higher electricity and green certificate prices and sets
the ceiling for growth of wind power in Sweden.
The statistics and forecast
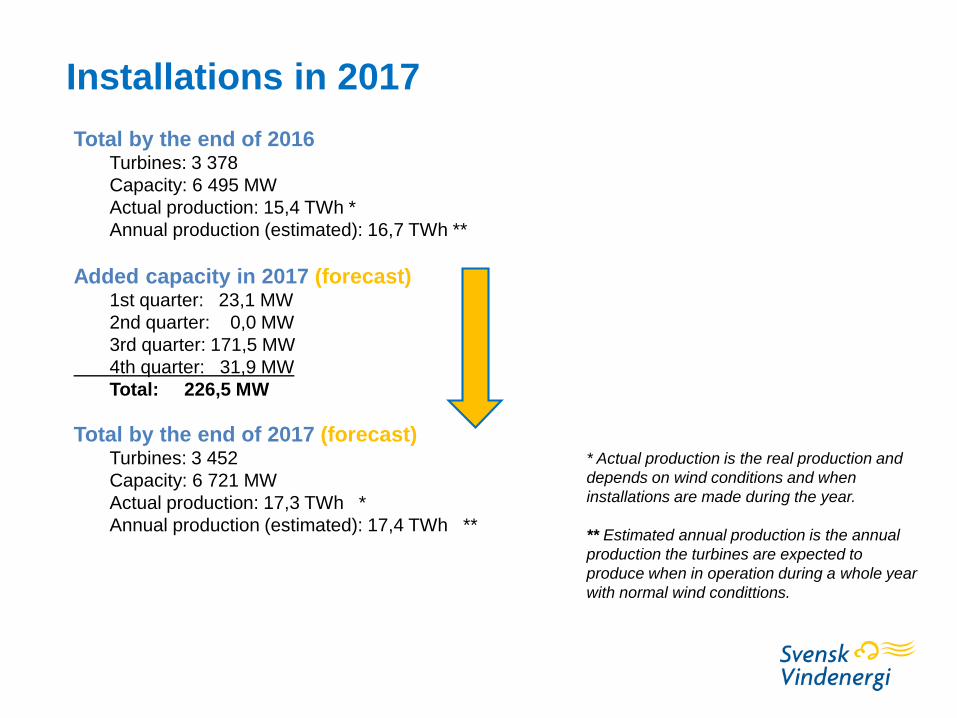
Total by the end of 2016Turbines: 3 378
Capacity: 6 495 MW
Actual production: 15,4 TWh *
Annual production (estimated): 16,7 TWh **
Added capacity in 2017 (forecast)1st quarter: 23,1 MW
2nd quarter: 0,0 MW
3rd quarter: 171,5 MW
4th quarter: 31,9 MW
Total: 226,5 MW
Total by the end of 2017 (forecast)Turbines: 3 452
Capacity: 6 721 MW
Actual production: 17,3 TWh *
Annual production (estimated): 17,4 TWh **
Installations in 2017
* Actual production is the real production and
depends on wind conditions and when
installations are made during the year.
** Estimated annual production is the annual
production the turbines are expected to
produce when in operation during a whole year
with normal wind condittions.
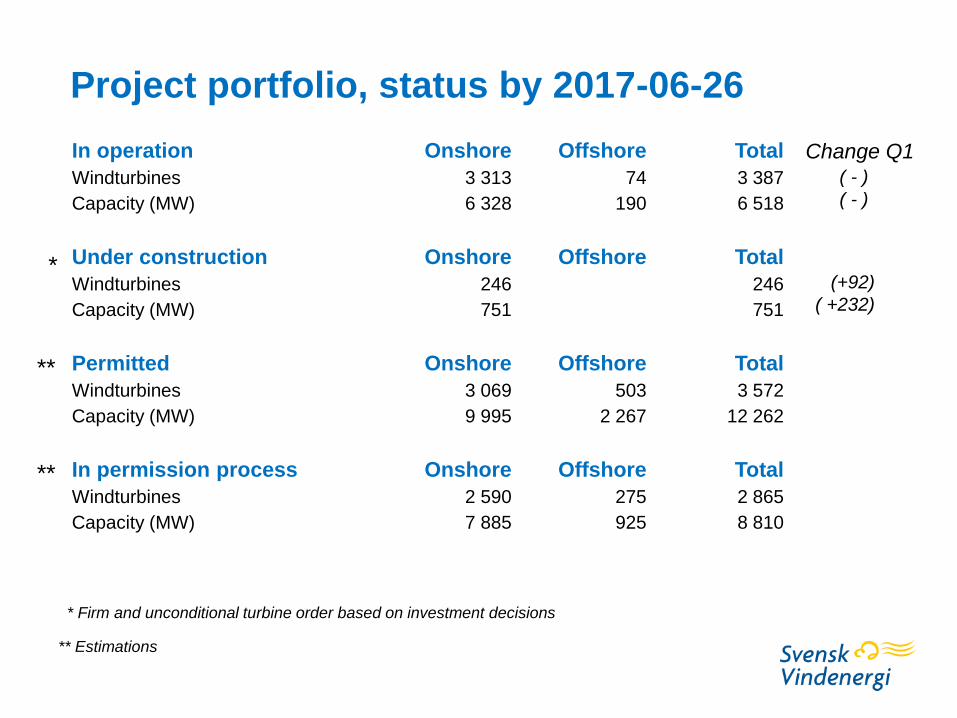
Project portfolio, status by 2017-06-26
** Estimations
**
**
*
* Firm and unconditional turbine order based on investment decisions
( - )
( - )
(+92)
( +232)
Change Q1In operation Onshore Offshore Total
Windturbines 3 313 74 3 387
Capacity (MW) 6 328 190 6 518
Under construction Onshore Offshore Total
Windturbines 246 246
Capacity (MW) 751 751
Permitted Onshore Offshore Total
Windturbines 3 069 503 3 572
Capacity (MW) 9 995 2 267 12 262
In permission process Onshore Offshore Total
Windturbines 2 590 275 2 865
Capacity (MW) 7 885 925 8 810
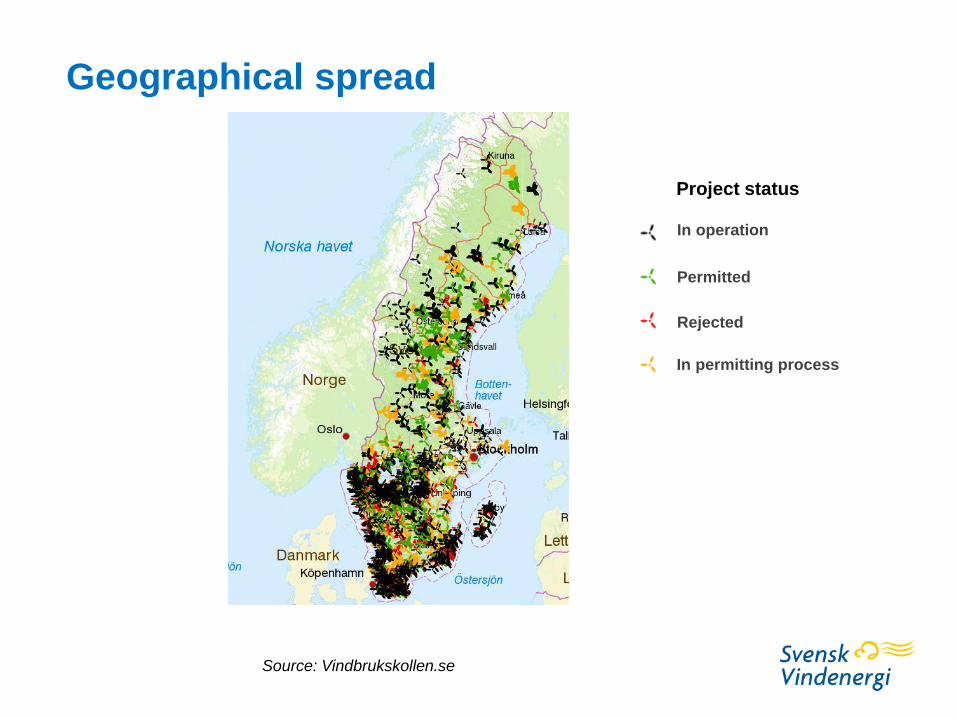
In operation
Permitted
In permitting process
Source: Vindbrukskollen.se
Geographical spread
Rejected
Project status

New turbine contracts (firm and binding)
* Figures from all turbine manufacturers acting on the Swedish market
275
106
248
50
221
115
189
25
51 4963
160
66
273
2
232
0
50
100
150
200
250
300
Q3 2
01
3
Q4 2
01
3
Q1 2
01
4
Q2 2
01
4
Q3 2
01
4
Q4 2
01
4
Q1 2
01
5
Q2 2
01
5
Q3 2
01
5
Q4 2
01
5
Q1 2
01
6
Q2 2
01
6
Q3 2
01
6
Q4 2
01
6
Q1 2
01
7
Q2 2
01
7
New turbine contracts(capacity)
Mean value last 12month
MW

Order books
Time plan according to turbine manufacturers for wind power installations
during year (MW) *
2016 2017
Q1
2017
Q2
2017
Q3
2017
Q4
2017
(Tot)
2018 2019
468 23 0 172 32 227 468 80
* Figures from all turbine manufacturers acting on the Swedish market

Status as of 2017-06-26
MW
Installed capacity by price area 2020-12-31 (base case)
530
2375
2012
1575
234
274
210
34
342
267
96
82
11
132
58
37
0
500
1000
1500
2000
2500
3000
3500
SE1 SE2 SE3 SE4
Permission process
Permitted
Under construction
In operation

15,416,4
17,618,4
17,3
4,8
8,6
12,6
17,3
0
2
4
6
8
10
12
14
16
18
20
Production last 52 weeks
Cumulative production
Wind power production 2017 (forecast)
TWh
31/12-16 31/3 30/6 30/9 31/12-17
Actual and forecast

0
5
10
15
20
25
2007 2008 2009 2010 2011 2012 2013 2014 2015 2016 2017 2018 2019 2020
High case
Base case
Low case
Wind power production – different scenarios
TWh
Actual and forecast
Increased uncertainty
As of 31/12

61007160
9900
11450
1660015500
1740417980
19408
20906
28993743
43825425
6029,2 6495 6721 7244 76918296
2039 2403 2663 3048 3233 3378 3452 3616 3770 3933
0
5000
10000
15000
20000
25000
2007 2008 2009 2010 2011 2012 2013 2014 2015 2016 2017 2018 2019 2020
Annual production[TWh]
Cumulative capacityat end year [MW]
Cumulative installedwind turbines
As of 31/12
Actual and forecast
Base caseThis scenario is the most realistic and official forecast of Svensk Vindenergi
Increased uncertainty
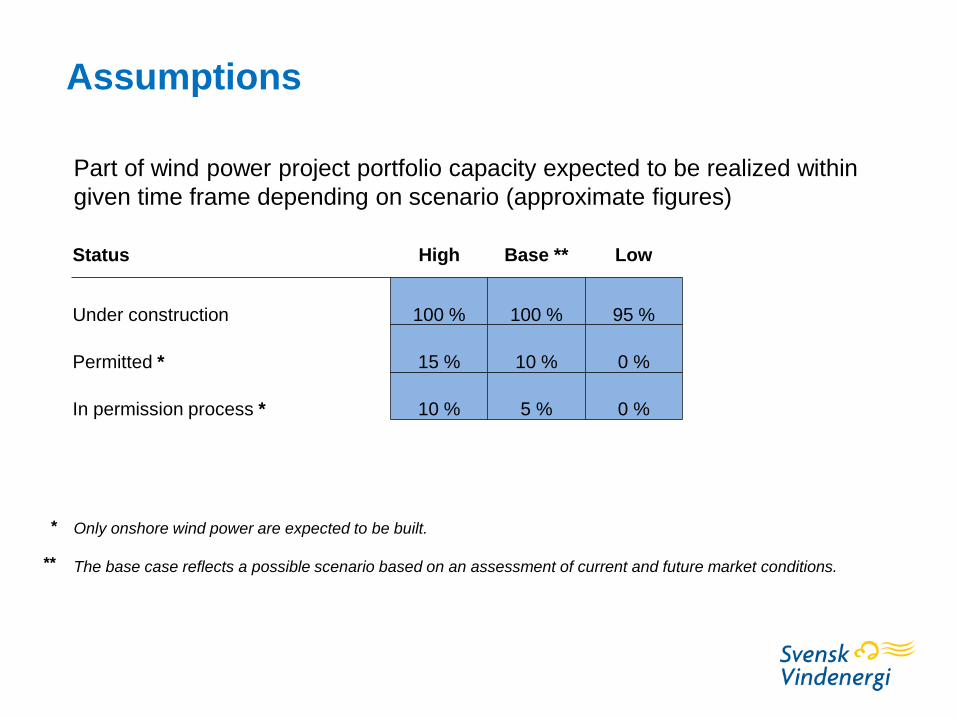
Assumptions
Part of wind power project portfolio capacity expected to be realized within
given time frame depending on scenario (approximate figures)
Status High Base ** Low
Under construction 100 % 100 % 95 %
Permitted * 15 % 10 % 0 %
In permission process * 10 % 5 % 0 %
Only onshore wind power are expected to be built.
The base case reflects a possible scenario based on an assessment of current and future market conditions.
*
**
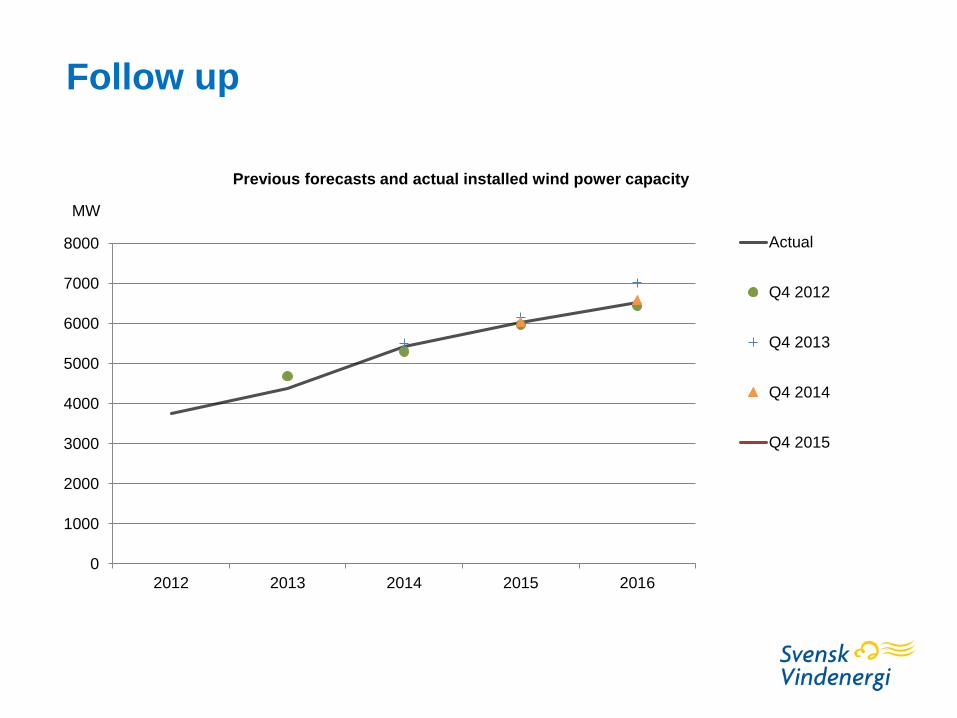
Follow up
0
1000
2000
3000
4000
5000
6000
7000
8000
2012 2013 2014 2015 2016
Actual
Q4 2012
Q4 2013
Q4 2014
Q4 2015
Previous forecasts and actual installed wind power capacity
MW

0
2
4
6
8
10
12
14
16
18
2012 2013 2014 2015 2016
Actual
Actual(normal year)
Q4 2012
Q4 2013
Q4 2014
Q4 2015
Previous forecasts and actual wind power production
TWh
Follow up