Statistics An Introduction
52
1 - 1 - 1 1 Statistics Statistics An Introduction An Introduction
description
Statistics An Introduction. Learning Objectives. 1.Define Statistics 2.Describe the Uses of Statistics 3.Distinguish Descriptive & Inferential Statistics Define Population, Sample, Parameter, & Statistic Identify data types. What is Statistics?. - PowerPoint PPT Presentation
Transcript of Statistics An Introduction

1 - 1 - 11
StatisticsStatisticsAn IntroductionAn Introduction

1 - 1 - 22
Learning ObjectivesLearning Objectives
1.1. Define StatisticsDefine Statistics2.2. Describe the Uses of StatisticsDescribe the Uses of Statistics3.3. Distinguish Descriptive & Inferential Distinguish Descriptive & Inferential
StatisticsStatistics4.4. Define Population, Sample, Parameter, Define Population, Sample, Parameter,
& Statistic& Statistic5.5. Identify data typesIdentify data types
1 - 1 - 33
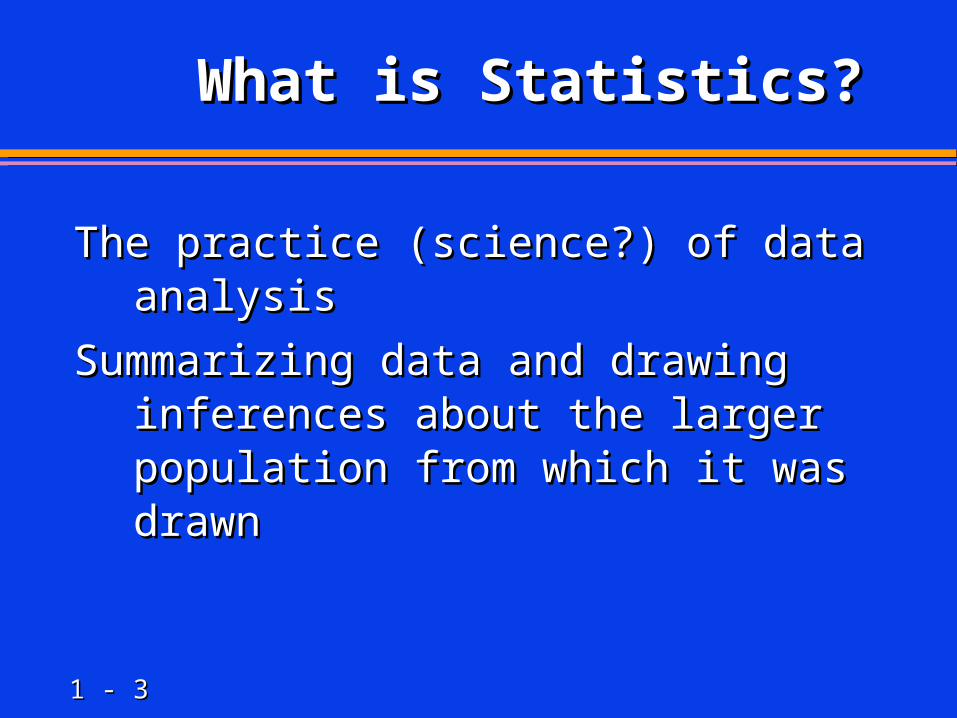
What is Statistics?What is Statistics?
The practice (science?) of data analysisThe practice (science?) of data analysisSummarizing data and drawing inferences Summarizing data and drawing inferences
about the larger population from which about the larger population from which it was drawnit was drawn

1 - 1 - 44
Statistical MethodsStatistical Methods
StatisticalMethods
DescriptiveStatistics
InferentialStatistics

1 - 1 - 55
Descriptive Descriptive StatisticsStatistics
1.1. InvolvesInvolves Collecting DataCollecting Data Presenting DataPresenting Data Characterizing Characterizing
DataData
2.2. PurposePurpose Describe DataDescribe Data X = 30.5 SX = 30.5 S22 = 113 = 113
00
2525
5050
Q1Q1 Q2Q2 Q3Q3 Q4Q4
$$

1 - 1 - 66
Inferential StatisticsInferential Statistics
1.1. InvolvesInvolves EstimationEstimation Hypothesis Hypothesis
TestingTesting
2.2. PurposePurpose Make Decisions About Make Decisions About
Population Based on Population Based on Sample CharacteristicsSample Characteristics
Population?Population?

1 - 1 - 77
Key TermsKey Terms
1.1. Population (Universe)Population (Universe) All Items of InterestAll Items of Interest
2.2. SampleSample Portion of PopulationPortion of Population
3.3. ParameterParameter Summary Measure about PopulationSummary Measure about Population
4.4. StatisticStatistic Summary Measure about SampleSummary Measure about Sample
• PP in in PPopulation opulation
& & PParameterarameter• SS in in SSample ample
& & SStatistictatistic

1 - 1 - 88
Data TypesData Types
QuantitativeQuantitative DiscreteDiscrete ContinuousContinuous
QualitativeQualitative Nominal (categorical)Nominal (categorical) Ordinal (rank ordered categories)Ordinal (rank ordered categories)
1 - 1 - 99
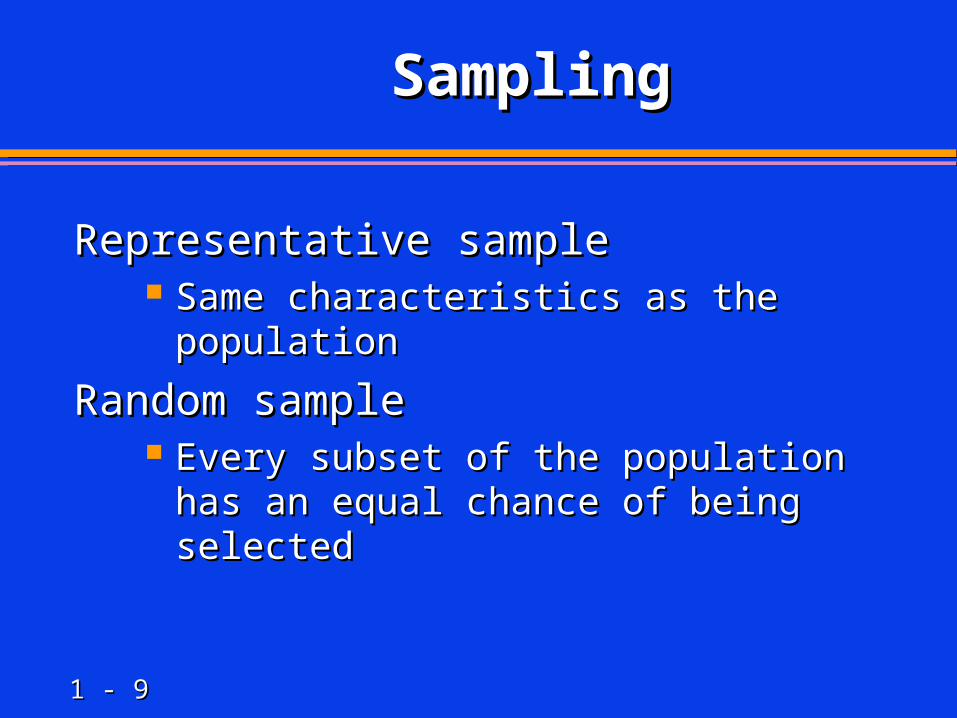
SamplingSampling
Representative sampleRepresentative sample Same characteristics as the populationSame characteristics as the population
Random sampleRandom sample Every subset of the population has an Every subset of the population has an
equal chance of being selectedequal chance of being selected
1 - 1 - 1010
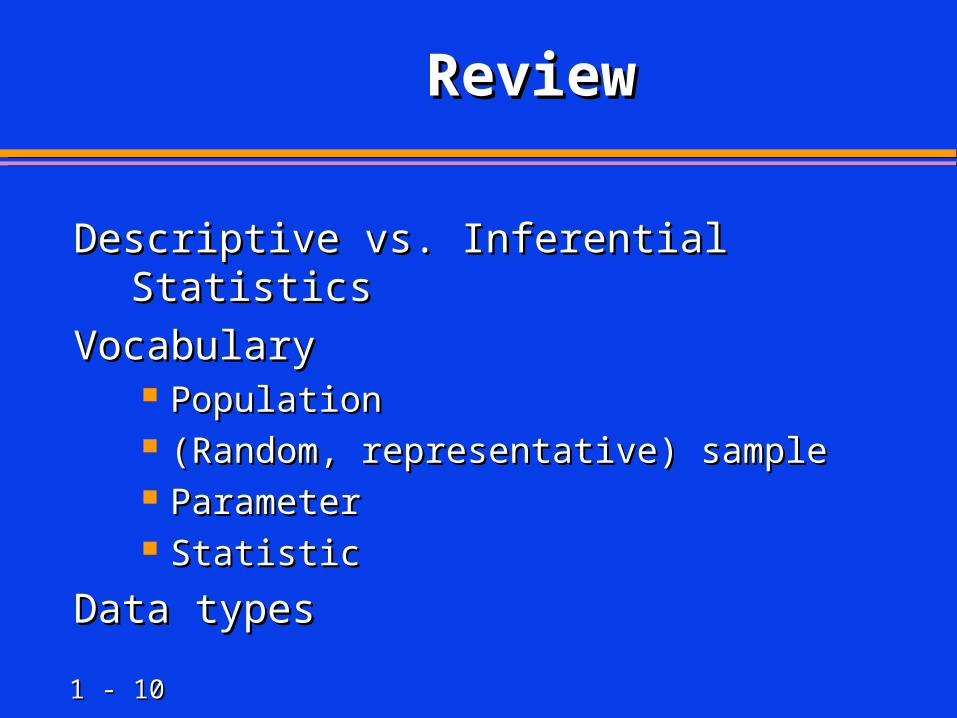
ReviewReview
Descriptive vs. Inferential StatisticsDescriptive vs. Inferential StatisticsVocabularyVocabulary
PopulationPopulation (Random, representative) sample(Random, representative) sample ParameterParameter StatisticStatistic
Data typesData types

1 - 1 - 1111
Methods for Describing DataMethods for Describing Data

1 - 1 - 1212
Learning ObjectivesLearning Objectives
1.1. Describe Qualitative Data GraphicallyDescribe Qualitative Data Graphically2.2. Describe Numerical Data GraphicallyDescribe Numerical Data Graphically3.3. Create & Interpret Graphical DisplaysCreate & Interpret Graphical Displays4.4. Explain Numerical Data PropertiesExplain Numerical Data Properties5.5. Describe Summary MeasuresDescribe Summary Measures
6.6. Analyze Numerical Data Using Summary Analyze Numerical Data Using Summary Measures Measures

1 - 1 - 1313
Data PresentationData Presentation
SummaryTable
DotChart
PieChart
NumericalData
DataPresentation
BarChart
QualitativeData
Stem-&-LeafDisplay
FrequencyDistribution
Histogram

1 - 1 - 1414
Presenting Presenting Qualitative DataQualitative Data

1 - 1 - 1515
Data PresentationData Presentation
SummaryTable
DotChart
PieChart
NumericalData
DataPresentation
BarChart
QualitativeData
Stem-&-LeafDisplay
FrequencyDistribution
Histogram

1 - 1 - 1616
Student Student SpecializationsSpecializations
Specialization | Freq. Percent Cum.Specialization | Freq. Percent Cum.---------------+-------------------------------------------------+---------------------------------- HCI | 9 39.13 39.13HCI | 9 39.13 39.13 IEMP | 9 39.13 78.26IEMP | 9 39.13 78.26 LIS | 3 13.04 91.30LIS | 3 13.04 91.30 Undecided | 2 8.70 100.00Undecided | 2 8.70 100.00---------------+-------------------------------------------------+---------------------------------- Total | 23 100.00Total | 23 100.00

1 - 1 - 1717
Student Student SpecializationsSpecializations
HCIIEMP
LISUndecided
0123456789
10
HCI IEMP LIS Undecided

1 - 1 - 1818
Undergrad MajorsUndergrad Majors UG major | Freq. Percent Cum.UG major | Freq. Percent Cum.--------------------------+-------------------------------------------------------------+----------------------------------- American Studies | 1 4.76 4.76American Studies | 1 4.76 4.76 Cog Sci | 1 4.76 9.52Cog Sci | 1 4.76 9.52 Comp Sci | 3 14.29 23.81Comp Sci | 3 14.29 23.81 Economics | 3 14.29 38.10Economics | 3 14.29 38.10 English | 5 23.81 61.90English | 5 23.81 61.90Environmental Engineering | 1 4.76 66.67Environmental Engineering | 1 4.76 66.67 Graphic Design | 1 4.76 71.43Graphic Design | 1 4.76 71.43 Math | 2 9.52 80.95Math | 2 9.52 80.95 Mechanical Engineering | 1 4.76 85.71Mechanical Engineering | 1 4.76 85.71 Nutrition | 1 4.76 90.48Nutrition | 1 4.76 90.48 Sci and Tech Policy | 1 4.76 95.24Sci and Tech Policy | 1 4.76 95.24 Telecommunications | 1 4.76 100.00Telecommunications | 1 4.76 100.00--------------------------+-------------------------------------------------------------+----------------------------------- Total | 21 100.00Total | 21 100.00

1 - 1 - 1919
Favorite ColorsFavorite Colors
color | Freq. Percent Cum.color | Freq. Percent Cum.------------+-----------------------------------------------+----------------------------------- black | 2 8.70 8.70black | 2 8.70 8.70 blue | 12 52.17 60.87blue | 12 52.17 60.87 green | 1 4.35 65.22green | 1 4.35 65.22 orange | 1 4.35 69.57orange | 1 4.35 69.57 purple | 1 4.35 73.91purple | 1 4.35 73.91 red | 5 21.74 95.65red | 5 21.74 95.65 white | 1 4.35 100.00white | 1 4.35 100.00------------+-----------------------------------------------+----------------------------------- Total | 23 100.00Total | 23 100.00
1 - 1 - 2020
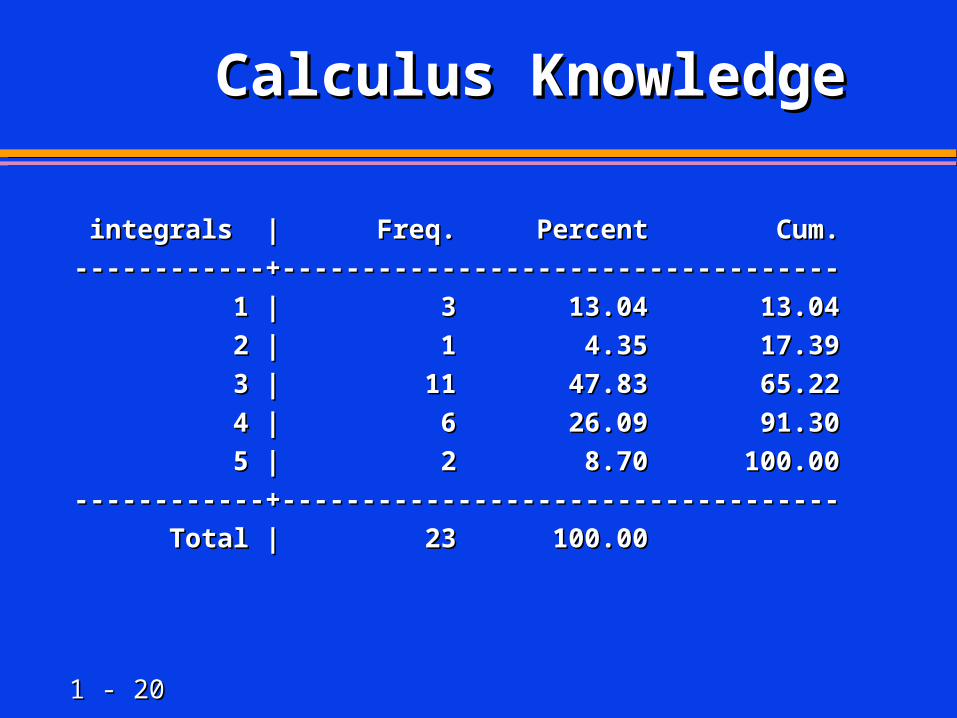
Calculus KnowledgeCalculus Knowledge
integrals | Freq. Percent Cum.integrals | Freq. Percent Cum.------------+-----------------------------------------------+----------------------------------- 1 | 3 13.04 13.041 | 3 13.04 13.04 2 | 1 4.35 17.392 | 1 4.35 17.39 3 | 11 47.83 65.223 | 11 47.83 65.22 4 | 6 26.09 91.304 | 6 26.09 91.30 5 | 2 8.70 100.005 | 2 8.70 100.00------------+-----------------------------------------------+----------------------------------- Total | 23 100.00Total | 23 100.00

1 - 1 - 2121
Presenting Presenting Numerical DataNumerical Data
1 - 1 - 2222
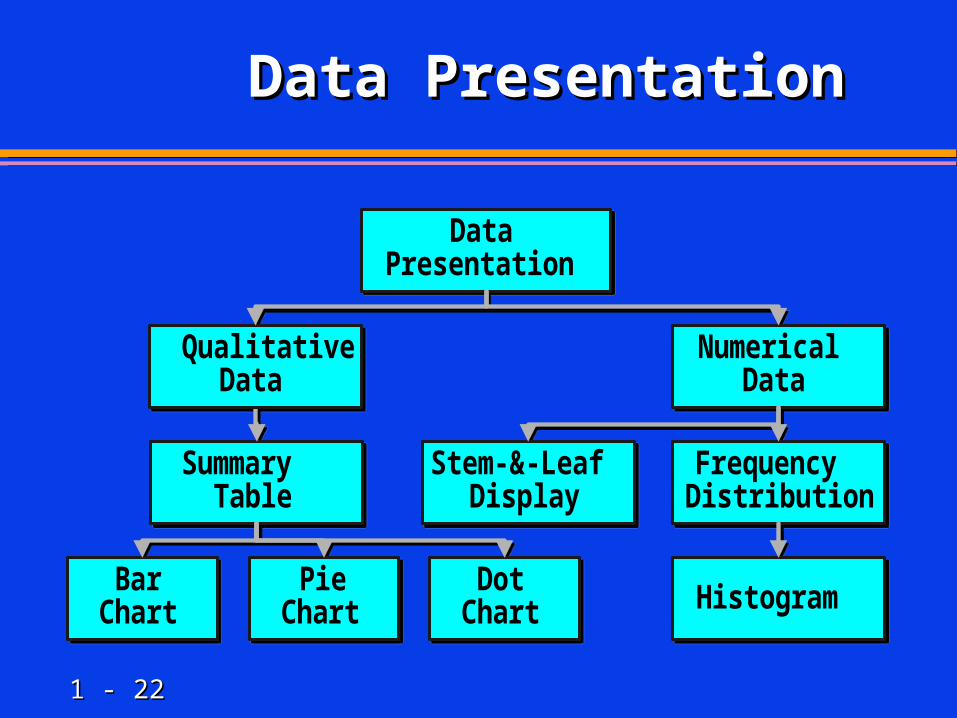
Data PresentationData Presentation
SummaryTable
DotChart
PieChart
NumericalData
DataPresentation
BarChart
QualitativeData
Stem-&-LeafDisplay
FrequencyDistribution
Histogram

1 - 1 - 2323
Student Age Student Age (Reported) Data(Reported) Data
Stem-and-leaf plot for ageStem-and-leaf plot for age
2* | 222334445557778992* | 22233444555777899 3* | 012573* | 01257 4* | 4* | 5* | 5* | 6* | 6* | 7* | 67* | 6
1 - 1 - 2424
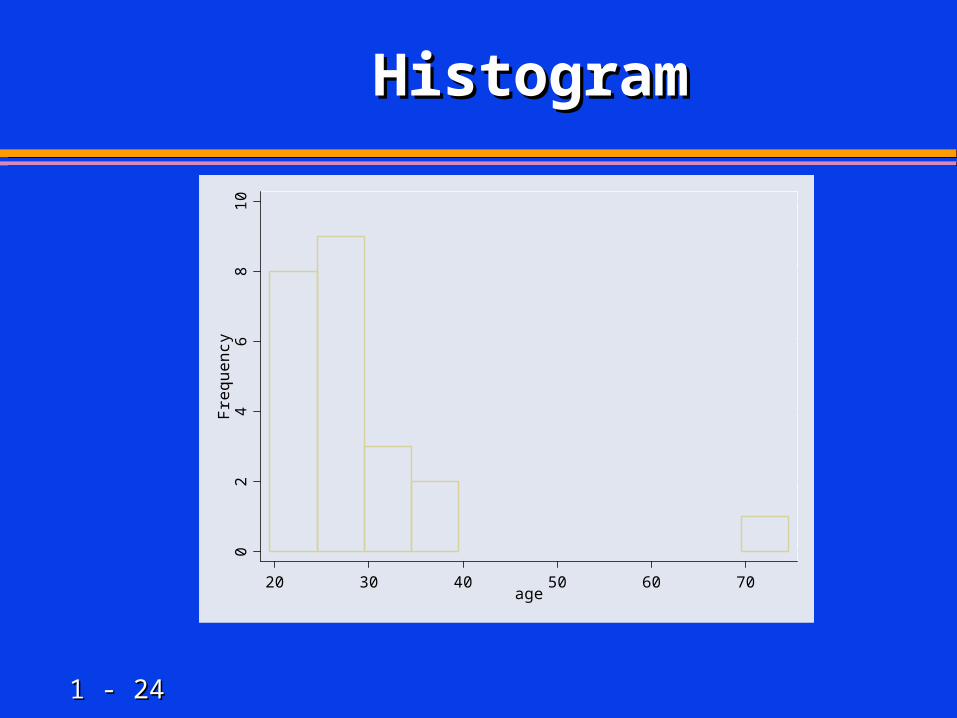
HistogramHistogram
02
46
810
Freq
uenc
y
20 30 40 50 60 70age

1 - 1 - 2525
Starting Salaries (in Starting Salaries (in $K)$K)
3* | 83* | 8 4* | 0000254* | 000025 5* | 00005* | 0000 6* | 00000056* | 0000005 7* | 57* | 5 8* | 08* | 0
1 - 1 - 2626
Numerical Data Numerical Data PropertiesProperties

1 - 1 - 2727
Thinking ChallengeThinking Challenge
... employees cite low ... employees cite low pay -- most workers pay -- most workers earn only $20,000.earn only $20,000.... President claims ... President claims average pay is $70,000!average pay is $70,000!
$400,000$400,000
$70,000$70,000
$50,000$50,000
$30,000$30,000
$20,000$20,000

1 - 1 - 2828
Standard NotationStandard Notation
MeasureMeasure SampleSample PopulationPopulation
MeanMean xx
Stand. Dev.Stand. Dev. ss
VarianceVariance ss 22 22
SizeSize nn NN

1 - 1 - 2929
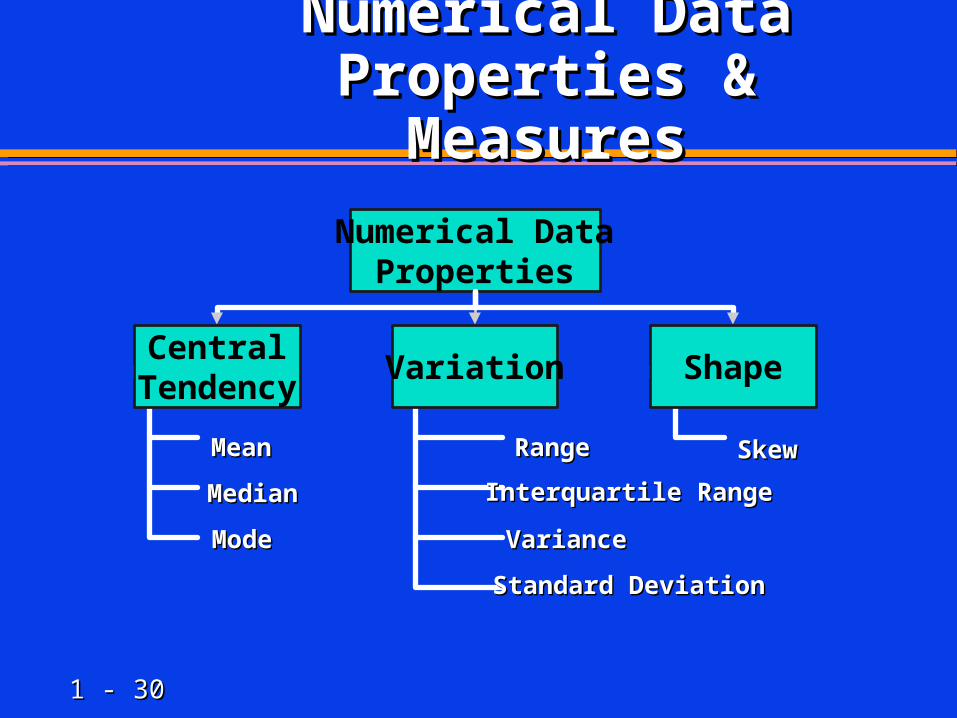
Numerical Data Numerical Data PropertiesProperties
Central Tendency Central Tendency (Location)(Location)
Variation Variation (Dispersion)(Dispersion)
ShapeShape
1 - 1 - 3030
Numerical DataNumerical DataProperties & Properties &
MeasuresMeasuresNumerical Data
Properties
MeanMean
MedianMedian
ModeMode
CentralTendency
RangeRange
VarianceVariance
Standard DeviationStandard Deviation
Variation
SkewSkew
Shape
Interquartile RangeInterquartile Range

1 - 1 - 3131
Central TendencyCentral Tendency

1 - 1 - 3232
Numerical DataNumerical DataProperties & Properties &
MeasuresMeasuresNumerical Data
Properties
MeanMean
MedianMedian
ModeMode
CentralTendency
RangeRange
VarianceVariance
Standard DeviationStandard Deviation
Variation
SkewSkew
Shape
Interquartile RangeInterquartile Range

1 - 1 - 3333
What’s wrong with What’s wrong with this?this?
Measurements 1 4 2 9 8Measurements 1 4 2 9 8Middle measurement is 2, so that’s the Middle measurement is 2, so that’s the
medianmedian
XXXX
nnXX XX XX
nn
iiii nn
11 11 22
8.45/24
589241

1 - 1 - 3434
AgesAges
Mean = 29Mean = 29Median = 27Median = 27
2* | 222334445557778992* | 22233444555777899 3* | 012573* | 01257 4* | 4* | 5* | 5* | 6* | 6* | 7* | 67* | 6

1 - 1 - 3535
Summary of Summary of Central Tendency Central Tendency
Measures Measures MeasureMeasure EquationEquation DescriptionDescription
MeanMean XXii / / nn Balance PointBalance PointMedianMedian ((nn+1)+1) PositionPosition
22Middle ValueMiddle ValueWhen OrderedWhen Ordered
ModeMode nonenone Most FrequentMost Frequent
1 - 1 - 3636
ShapeShape

1 - 1 - 3737
Numerical DataNumerical DataProperties & Properties &
MeasuresMeasuresNumerical Data
Properties
MeanMean
MedianMedian
ModeMode
CentralTendency
RangeRange
Interquartile RangeInterquartile Range
VarianceVariance
Standard DeviationStandard Deviation
Variation
SkewSkew
Shape

1 - 1 - 3838
ShapeShape
1.1. Describes How Data Are DistributedDescribes How Data Are Distributed
2.2. Measures of ShapeMeasures of Shape Skew = SymmetrySkew = Symmetry
Right-SkewedRight-SkewedLeft-SkewedLeft-Skewed SymmetricSymmetricMeanMean = = MedianMedian = = ModeModeMeanMean MedianMedian ModeMode ModeMode MedianMedian MeanMean
1 - 1 - 3939
VariationVariation

1 - 1 - 4040
Numerical DataNumerical DataProperties & Properties &
MeasuresMeasuresNumerical Data
Properties
MeanMean
MedianMedian
ModeMode
CentralTendency
RangeRange
VarianceVariance
Standard DeviationStandard Deviation
Variation
SkewSkew
Shape
Interquartile RangeInterquartile Range
1 - 1 - 4141
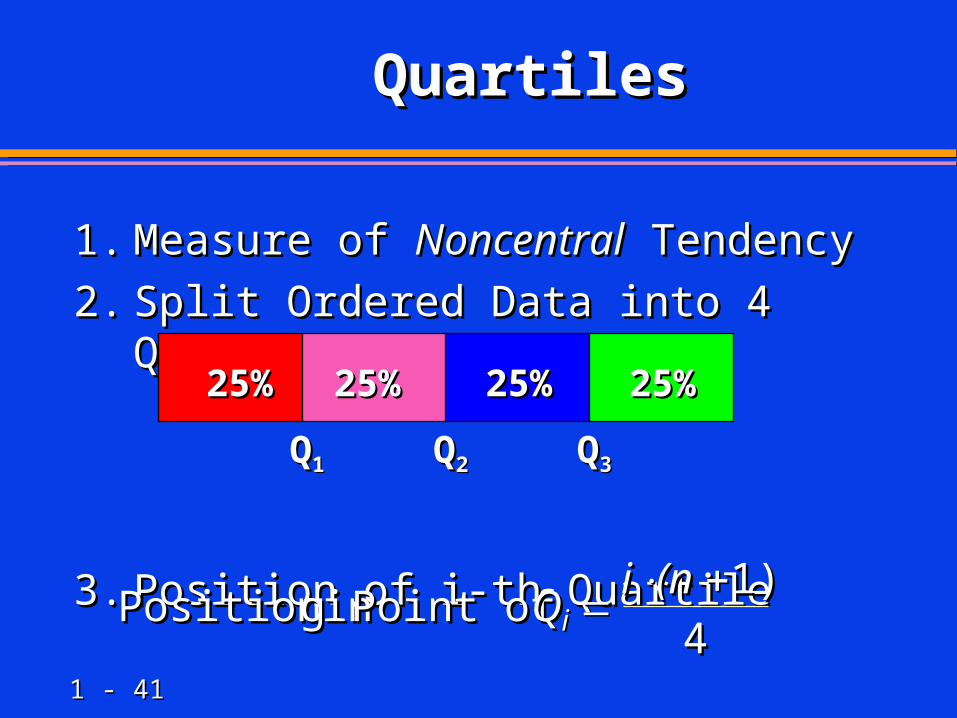
QuartilesQuartiles
1.1. Measure of Measure of NoncentralNoncentral Tendency Tendency2.2. Split Ordered Data into 4 QuartersSplit Ordered Data into 4 Quarters
3.3. Position of i-th QuartilePosition of i-th Quartile
25%25% 25%25% 25%25% 25%25%
QQ11 QQ22 QQ33
PositioninPositioning Point ofg Point of QQ ii (n(nii
1)1)44

1 - 1 - 4242
AgesAges
RangeRangeQuartilesQuartiles
2* | 222334445557778992* | 22233444555777899 3* | 012573* | 01257 4* | 4* | 5* | 5* | 6* | 6* | 7* | 67* | 6

1 - 1 - 4343
Box Plots - Age and Box Plots - Age and SalarySalary
Quartiles: 24, 27, 30Quartiles: 24, 27, 30Inner fences: (15,39)Inner fences: (15,39)Outer fences: (6, 48)Outer fences: (6, 48)
Quartiles: 41K, 50K, 60KQuartiles: 41K, 50K, 60KInner fences: ??Inner fences: ??Outer fences: ??Outer fences: ??
2040
6080
40,000
50,000
60,000
70,000
80,000

1 - 1 - 4444
Variance & Variance & Standard DeviationStandard Deviation
1.1. Measures of DispersionMeasures of Dispersion
2.2. Most Common MeasuresMost Common Measures
3.3. Consider How Data Are DistributedConsider How Data Are Distributed
4.4. Show Variation About Mean (Show Variation About Mean (XX or or ))
44 66 88 1010 1212
XX = 8.3= 8.3

1 - 1 - 4545
Sample Variance Sample Variance FormulaFormula
nn - 1 in denominator! - 1 in denominator! (Use (Use NN if if PopulationPopulation Variance)Variance)SS
(X(X X)X)
nn
(X(X X)X) (X(X X)X) (X(X X)X)nn
iiii
nn
nn
22
22
11
1122
2222 22
11
11

1 - 1 - 4646
Equivalent FormulaEquivalent Formula
1
1
2
12
12
1
2
1
2222
2222
1
22
1
2
2
nxnx
nxnxnxx
nxnxxx
nxxxx
n
xxxx
n
xxs
ii
iiii
n
iii
n
ii

1 - 1 - 4747
Another Equivalent Another Equivalent FormulaFormula
1
1
1
22
22
222
nnxx
nnxnx
nxnxs
ii
ii
i

1 - 1 - 4848
Empirical RuleEmpirical Rule
If x has a “symmetric, mound-shaped” If x has a “symmetric, mound-shaped” distributiondistribution
Justification: Known properties of the “normal” Justification: Known properties of the “normal” distribution, to be studied later in the coursedistribution, to be studied later in the course
%3.03Pr
%52Pr%32Pr
i
i
i
xxx

1 - 1 - 4949
Preview of Preview of Statistical InferenceStatistical Inference
You observe one data pointYou observe one data pointMake hypothesis about mean and standard Make hypothesis about mean and standard
deviation from which it was drawndeviation from which it was drawnEmpirical Rule tells you how (un)likely the data Empirical Rule tells you how (un)likely the data
point ispoint is If very unlikely, you are suspicious of the If very unlikely, you are suspicious of the
hypothesis about mean and standard deviation, hypothesis about mean and standard deviation, and reject it and reject it
1 - 1 - 5050
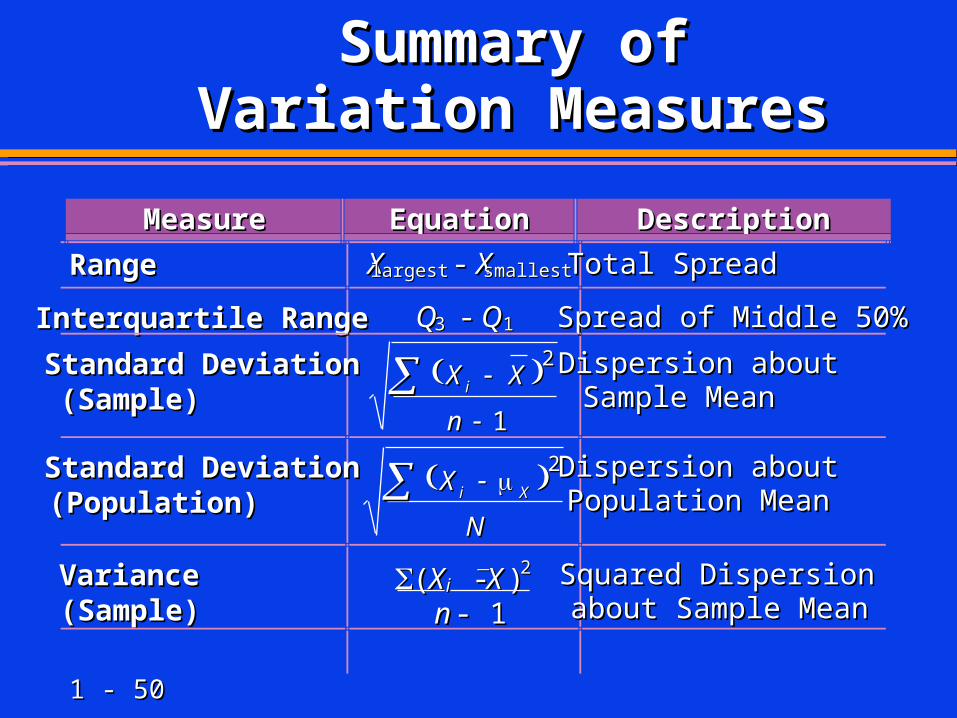
Summary of Summary of Variation Measures Variation Measures
MeasureMeasure EquationEquation DescriptionDescriptionRangeRange XXlargest largest - - XXsmallestsmallest Total SpreadTotal Spread
Interquartile RangeInterquartile Range QQ3 3 - - QQ11 Spread of Middle 50%Spread of Middle 50%
Standard DeviationStandard Deviation(Sample)(Sample)
XX XX
nnii
22
11
Dispersion aboutDispersion aboutSample MeanSample Mean
Standard DeviationStandard Deviation(Population)(Population)
XX
NNii XX
22 Dispersion aboutDispersion aboutPopulation MeanPopulation Mean
VarianceVariance(Sample)(Sample)
((XXii --XX ))22
nn - 1- 1Squared DispersionSquared Dispersionabout Sample Meanabout Sample Mean
1 - 1 - 5151
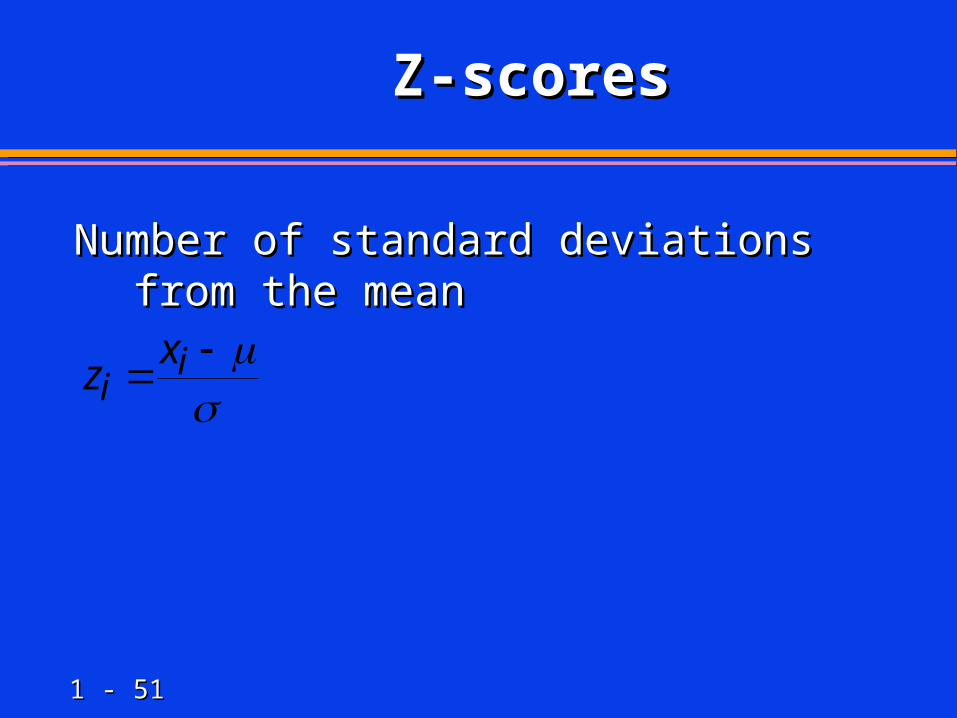
Z-scoresZ-scores
Number of standard deviations from the Number of standard deviations from the meanmean
i
ixz

1 - 1 - 5252
ConclusionConclusion
1.1. Described Qualitative Data GraphicallyDescribed Qualitative Data Graphically2.2. Described Numerical Data GraphicallyDescribed Numerical Data Graphically3.3. Created & Interpreted Graphical DisplaysCreated & Interpreted Graphical Displays4.4. Explained Numerical Data PropertiesExplained Numerical Data Properties5.5. Described Summary MeasuresDescribed Summary Measures
6.6. Analyzed Numerical Data Using Summary Analyzed Numerical Data Using Summary Measures Measures