Statistical Techniques I EXST7005 Two-sample t-tests.
53
Statistical Techniques I EXST7005 Two-sample t- tests
-
Upload
jessica-seckler -
Category
Documents
-
view
221 -
download
0
Transcript of Statistical Techniques I EXST7005 Two-sample t-tests.
Statistical Techniques I
EXST7005
Two-sample t-tests
Two-sample t-tests
Recall the derived population of sample means.
Imagine you had two of these derived populations, as we had for variances when we developed the F-test.

Equality of Population Means
Given two populations, test for equality. Actually test to see if the difference between two means is equal to some value, usually zero. H0: 1 - 2 = where often = 0
Pop'n 1 Pop'n 2Mean 1 2Variance 21 22
Derived populations
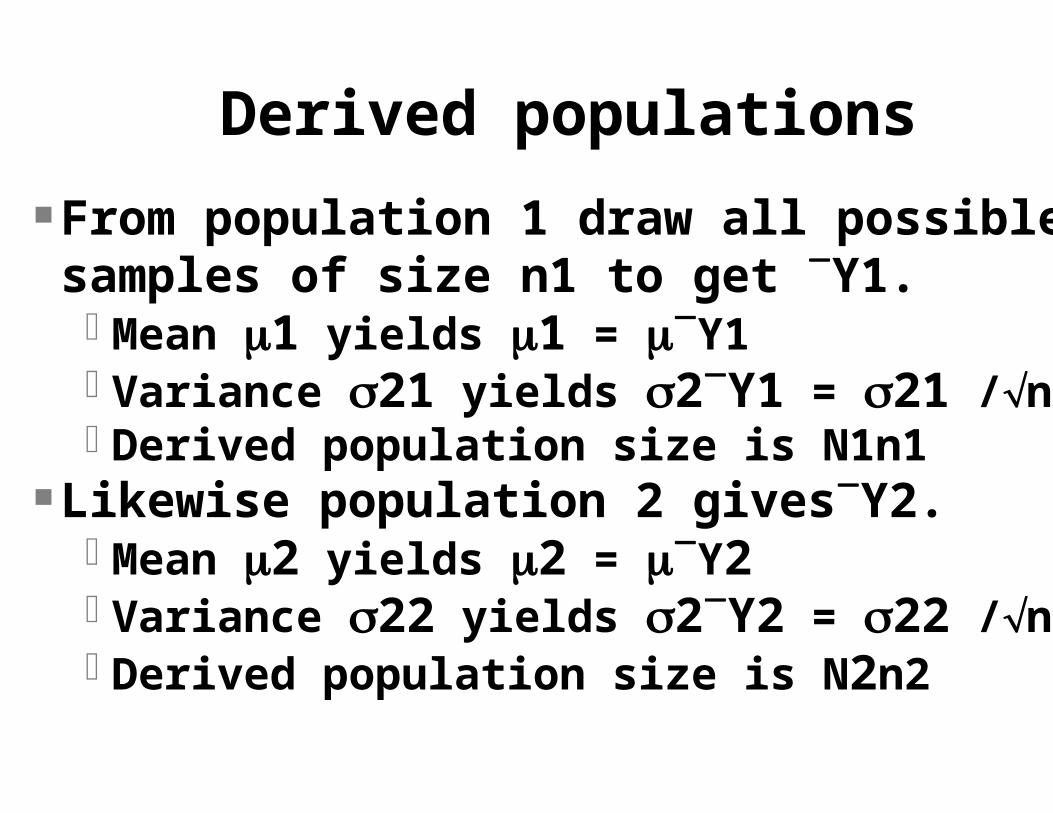
From population 1 draw all possible samples of size n1 to get Y1. Mean 1 yields 1 = Y1 Variance 21 yields 2Y1 = 21 /n1Derived population size is N1n1
Likewise population 2 givesY2. Mean 2 yields 2 = Y2 Variance 22 yields 2Y2 = 22 /n2Derived population size is N2n2

Derived populations (continued)
Draw a sample from each population
Pop'n 1 Pop'n 2Sample size n1 n2d.f. 1 2Sample mean Y1 Y2Sample variance S21 S22

Derived populations (continued) Take all possible differences (Y1-Y2)=dk
i. e. Take all possible means from the first population (N1n1 means) and all possible means from the second population (N2n2), and get the difference between each pair. There are a total of (N1n1)(N2n2) values.
dk = (Y1i-Y2j) – for i=1,...,N1n1 – j=1,...,N2n2 – k = 1,...,(N1n1)(N2n2)
Derived populations (continued)
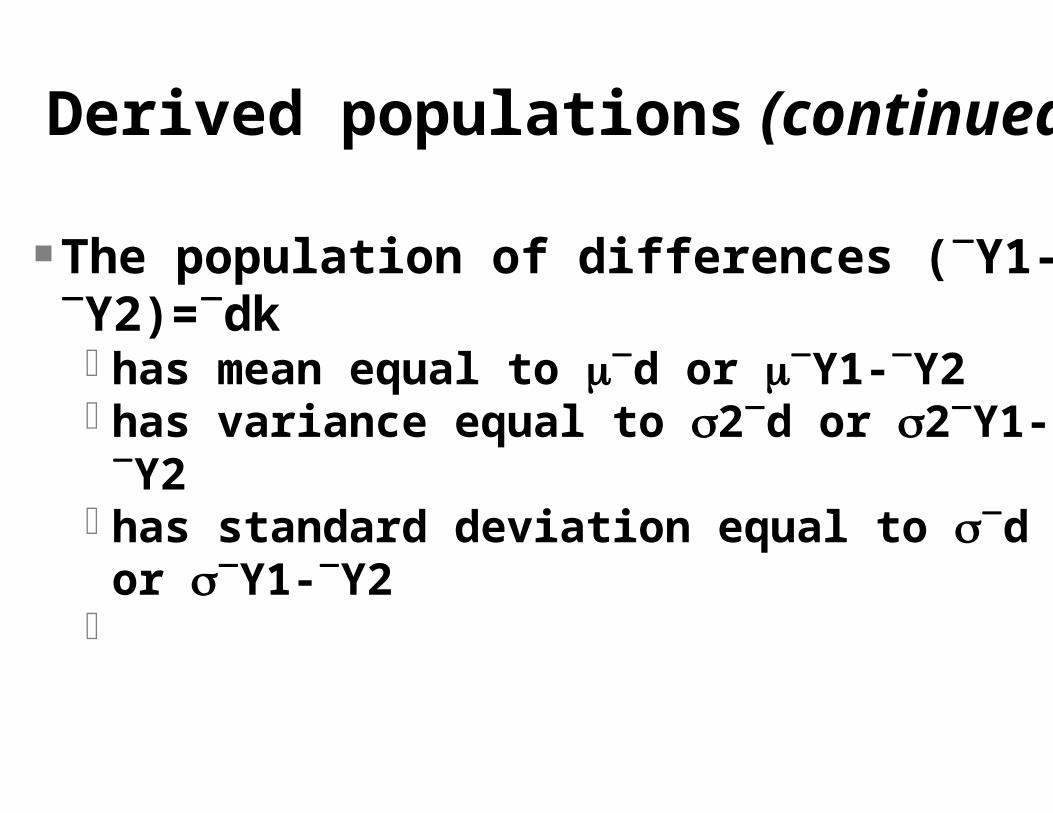
The population of differences (Y1-Y2)=dk has mean equal to d or Y1-Y2 has variance equal to 2d or 2Y1-Y2 has standard deviation equal to d or Y1-Y2

Characteristics of the derived population
1) As n1 and n2 increase, the distribution of d's approaches a normal distribution. If the two original populations are normal, the distribution of d is normal regardless of n1 and n2.
2) The mean of the differences (d) is equal to the difference between the means of the two parent populations. d = Y1 -Y2 =
Characteristics of the derived population (continued)
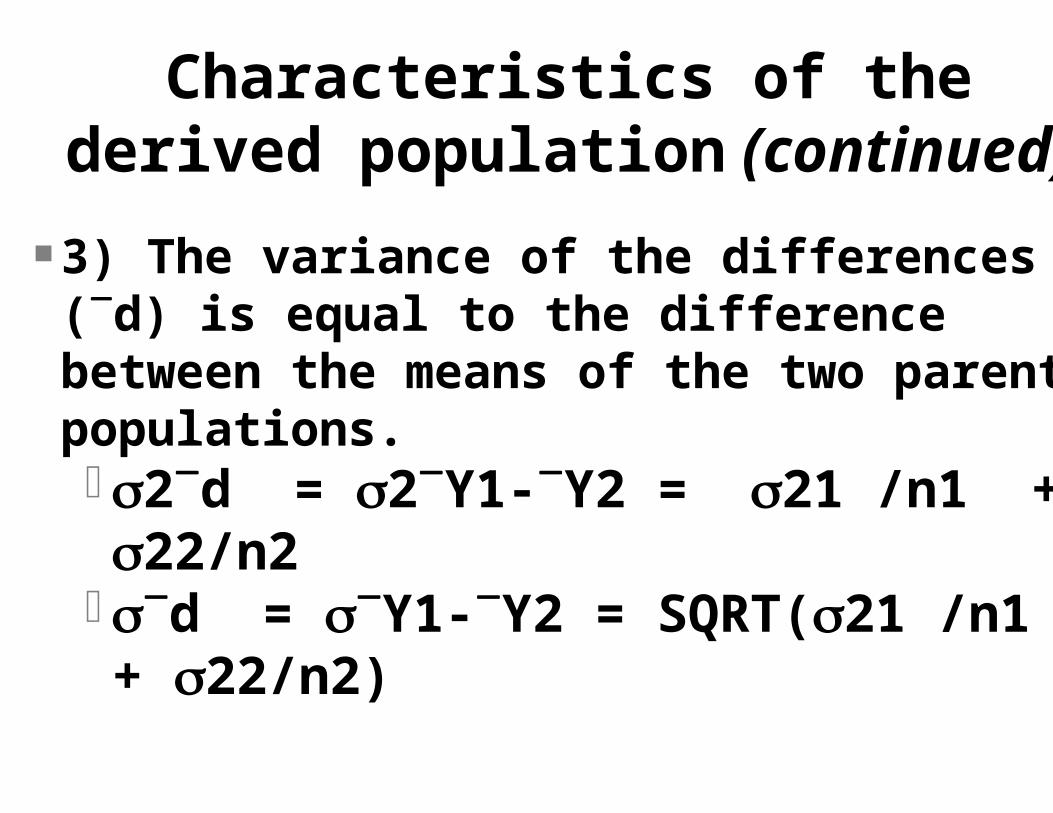
3) The variance of the differences (d) is equal to the difference between the means of the two parent populations. 2d = 2Y1-Y2 = 21 /n1 + 22/n2 d = Y1-Y2 = SQRT(21 /n1 + 22/n2)

Characteristics of the derived population (continued)
The variance comes from linear combinations. The variance of the sums is the sum of the variance (no covariance if independent).
Linear combination: Y1-Y2 Coefficients are 1, -1 Variance is 12*Var(Y1) + (-1)2*Var(Y2) 21 /n1 + 22/n2

The Two-sample t-test H0: 1 - 2 = H1: 1 - 2 the non-directional alternative, a one tailed test would specify a difference > or <.
Commonly, is 0 (zero) If H0 is true, then
E(d) = 1 - 2 2d = 21 /n1 + 22/n2
The Two-sample t-test (continued)
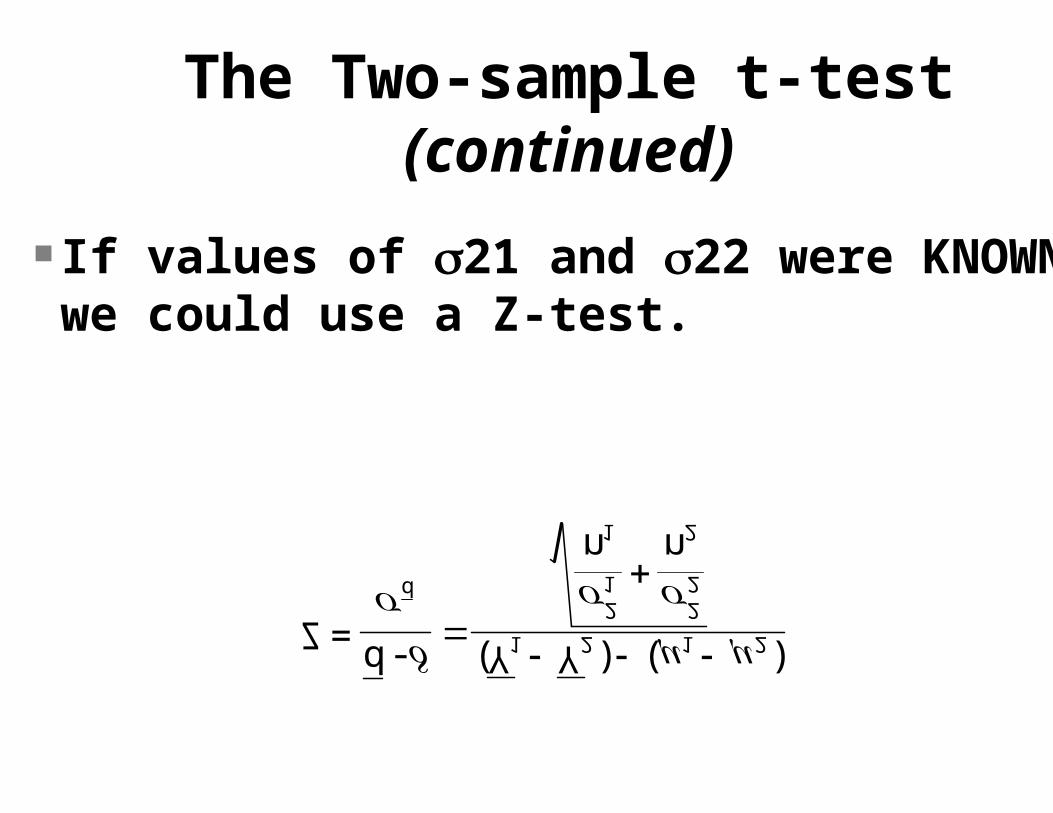
If values of 21 and 22 were KNOWN, we could use a Z-test.

The Two-sample t-test (continued)
If values of 21 and 22 were NOT KNOWN, and had to be estimated from the samples, we would use a t-test.

The Two-sample t-test (continued)
Since the hypothesized difference is usually 0 (zero), the term (1-2) is usually zero, and the equation is often simplified to ...
This is a very common test, and it is the basis for many calculations used in regression and analysis of variance (ANOVA). It will crop up repeatedly as we progress in the course.
It is very important!
Et voila, a two sample t-test!

The two-sample t-test

But there's more Unfortunately, this is not the end of the story. It turns out that there is some ambiguity about the degrees of freedom for the error term. Is it n1-1, or n2-1, or somewhere in between, or maybe the sum?
Power considerations
And POWER, we want the greatest possible power.
It turns out that we get the greatest power (and our problems with degrees of freedom go away) if we can combine the two variance estimates into one, single, new and improved estimate!
But we can only do this if the two variances are not different.
Two-sample t-tests start with an F-test
We can combine the two variance estimates into a single estimate if they are not too different. To determine if they are sufficiently similar we use an F test.
Therefore, two-sample t-tests START WITH AN F TEST!

Pooling variances
If the two variance estimates are sufficiently similar, as judged by the F test of variances, then they can be combined. This is called "pooling variances", and is done as a weighted mean (or weighted average) of the variances. The weights are the degrees of freedom.

Pooling variances (continued)
Weighted means or averages The usual mean is Yi / n The weighted mean is wiYi / wi , or the sum of the variable multiplied by the weights divided by the sum of the weights.

Pooling variances (continued)
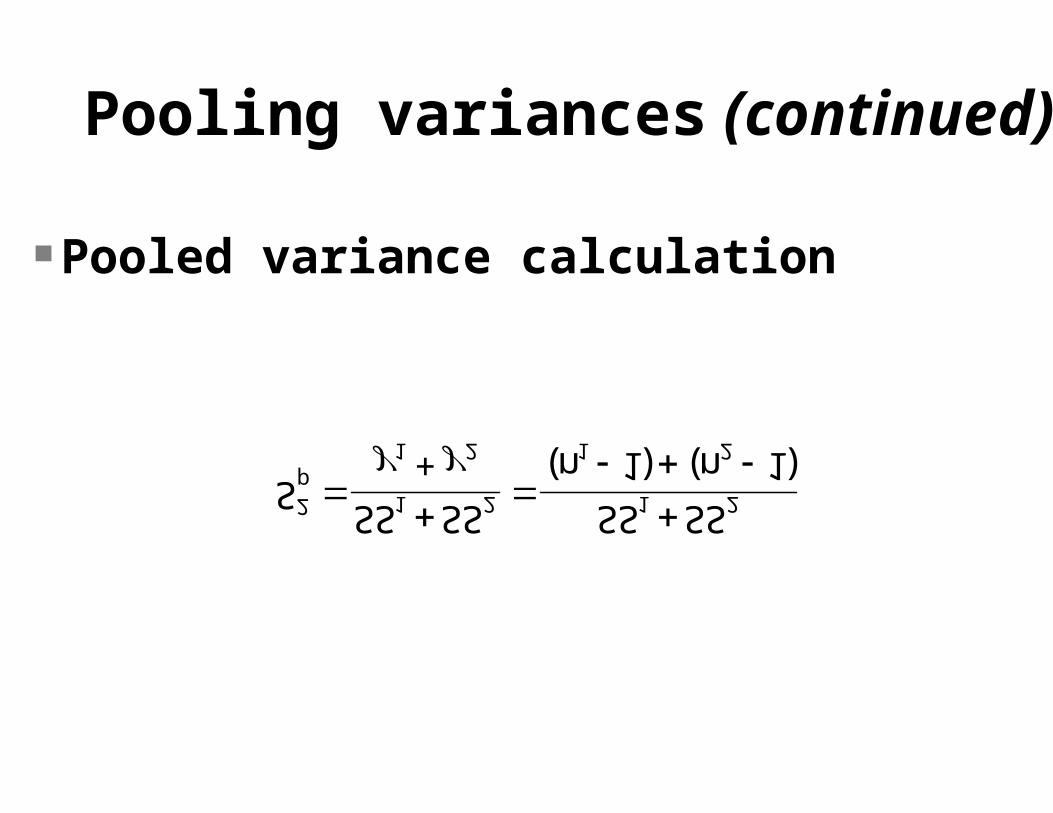
Pooled variances are calculated asPooled S2 = S2p = iS2i / i Recall that iS2i = SSi, so we can also calculate the sum of the corrected SS for each variable divided by the sum of the d.f. for each variable
S2p = iS2i / i = SSi / i
Pooling variances (continued)
Pooled variance calculation
Two sample t-test standard error estimates
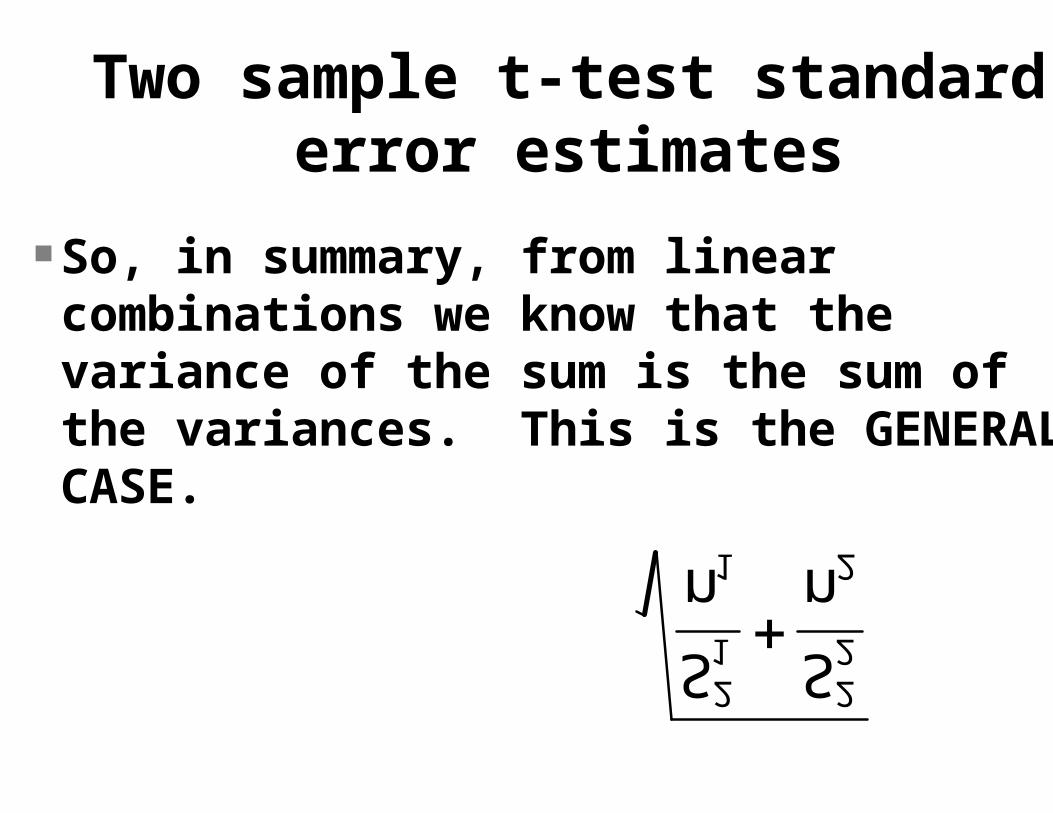
So, in summary, from linear combinations we know that the variance of the sum is the sum of the variances. This is the GENERAL CASE.

Two sample t-test standard error estimates (continued)
But if we test H0: S21 = S21 and fail to reject, we can pool the variances. The standard error is then.
Two sample t-test standard error estimates (continued)
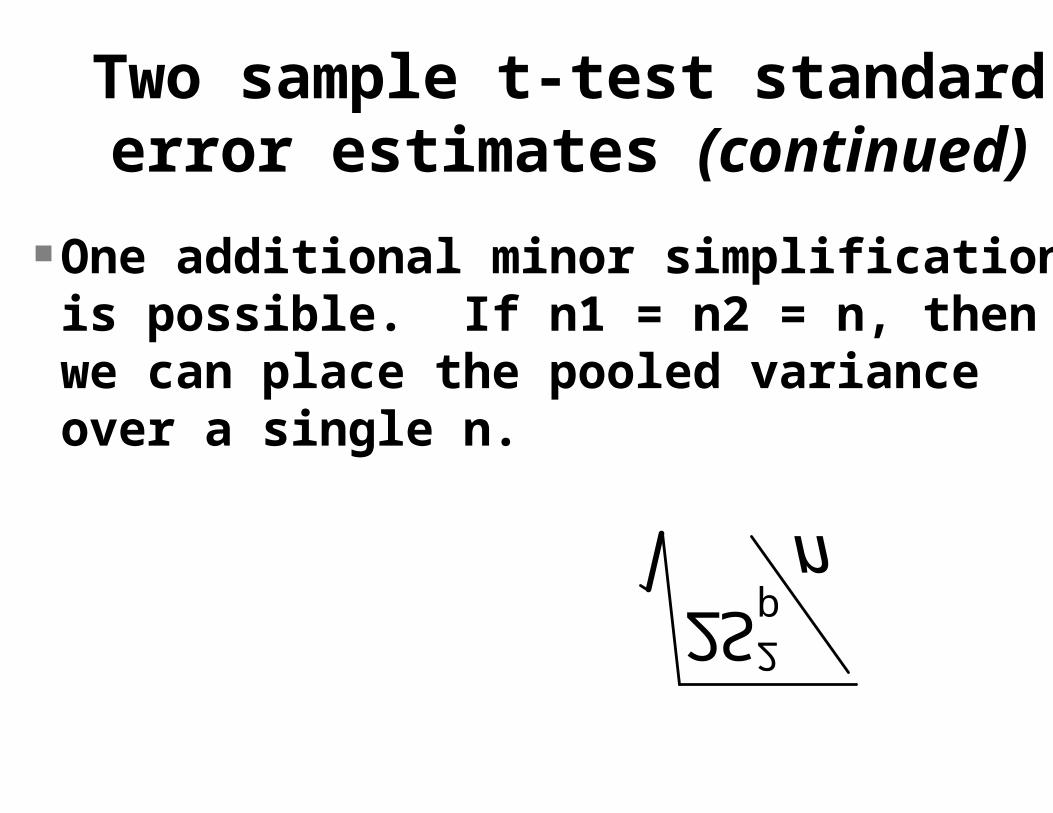
One additional minor simplification is possible. If n1 = n2 = n, then we can place the pooled variance over a single n.
d.f. for pooled variances
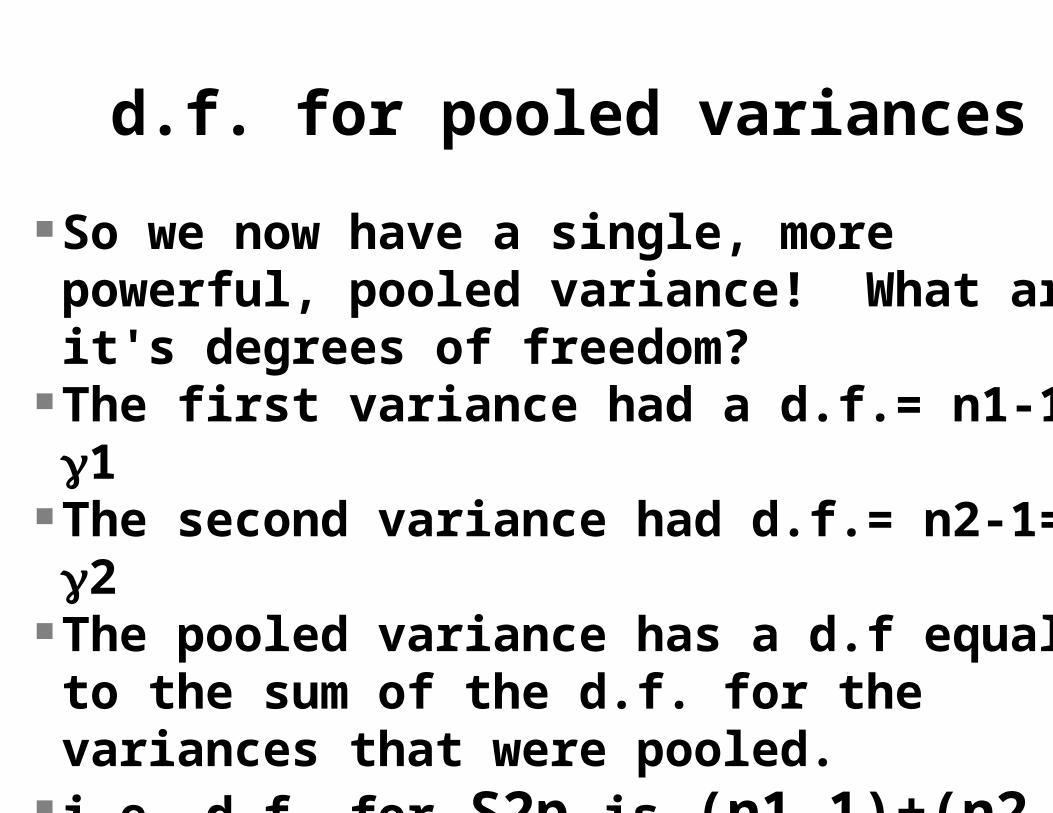
So we now have a single, more powerful, pooled variance! What are it's degrees of freedom?
The first variance had a d.f.= n1-1= 1 The second variance had d.f.= n2-1= 2 The pooled variance has a d.f equal to the sum of the d.f. for the variances that were pooled.
i.e. d.f. for S2p is (n1-1)+(n2-1) = 1+2

Summary: case where S21=S22
Test the variances to determine if they are significantly different. This is an F test of H0: 21=22.
If they are not different, then pool the variances into a single estimate of S2p.
The t-test is then done with this variance used to estimate the standard error of the difference.
The d.f. are (n1-1)+(n2-1)
Summary: case where S21=S22 (continued)
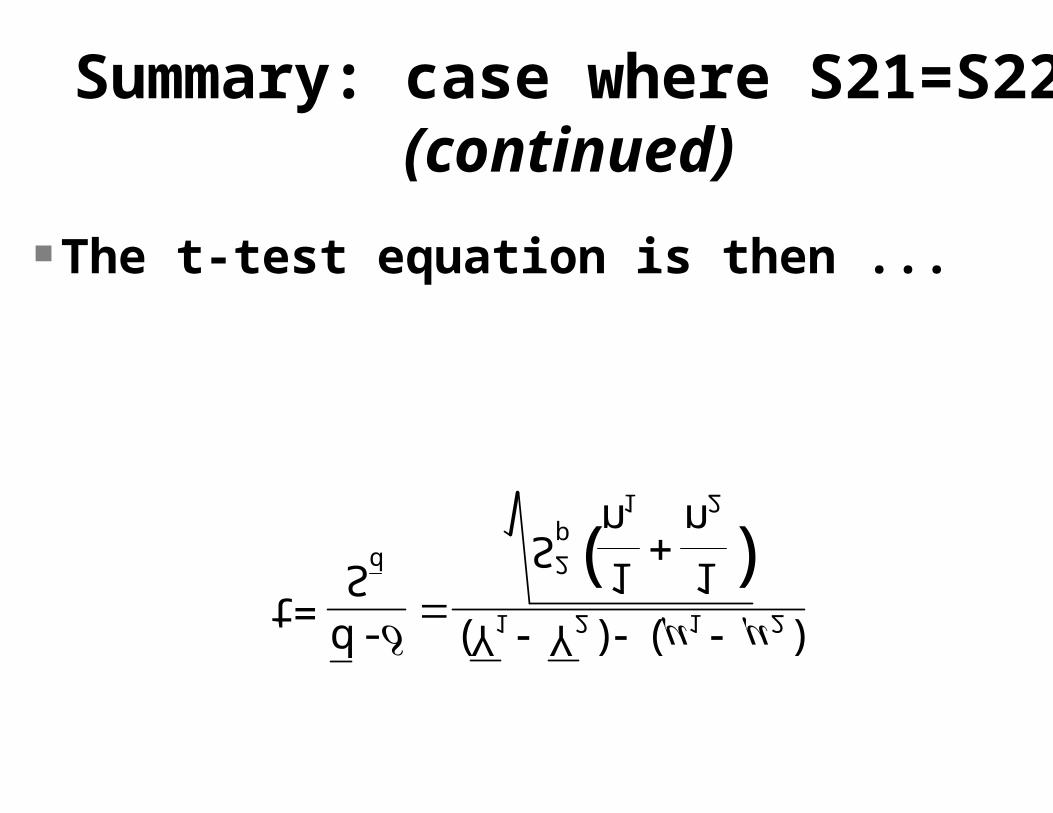
The t-test equation is then ...
Summary: case where S21=S22 (continued)
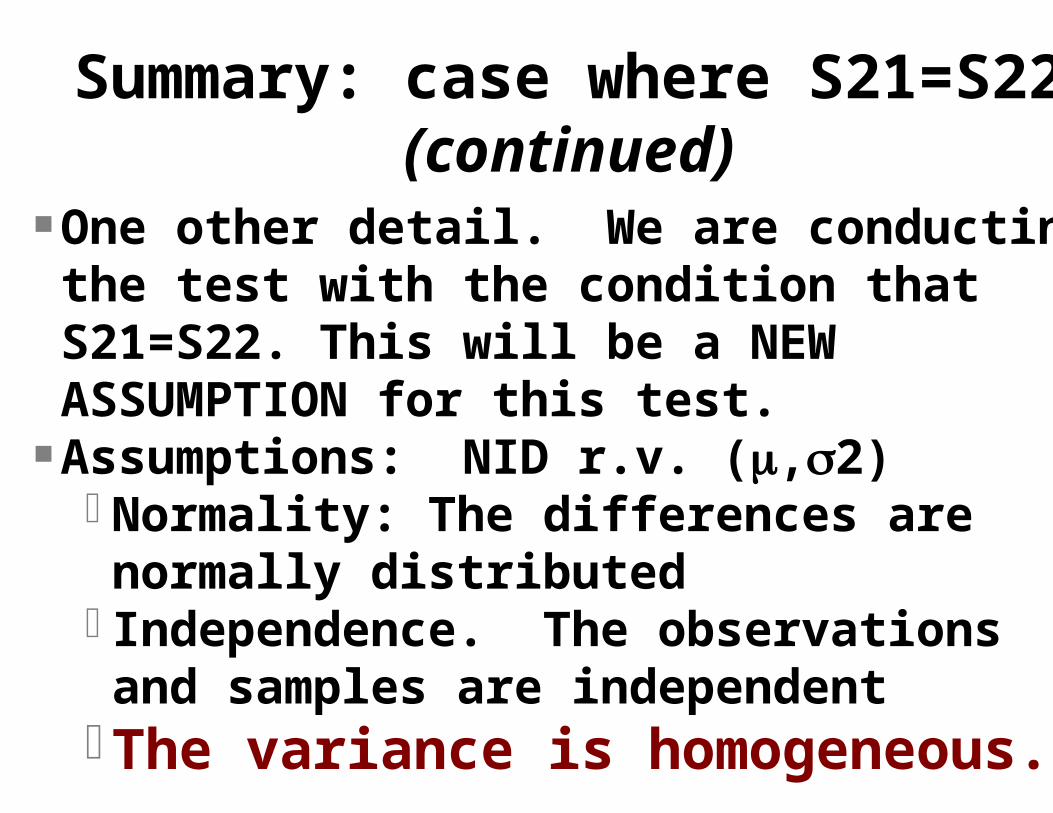
One other detail. We are conducting the test with the condition that S21=S22. This will be a NEW ASSUMPTION for this test.
Assumptions: NID r.v. (,2)Normality: The differences are normally distributed
Independence. The observations and samples are independentThe variance is homogeneous.

Case where S21 S22 How do we conduct the test if the variances are not equal?
On the one had, this is not a problem. The linear combination we used to get the variance does not require homogeneous variance.
So we know the variance.
Case where S21 S22 (continued)
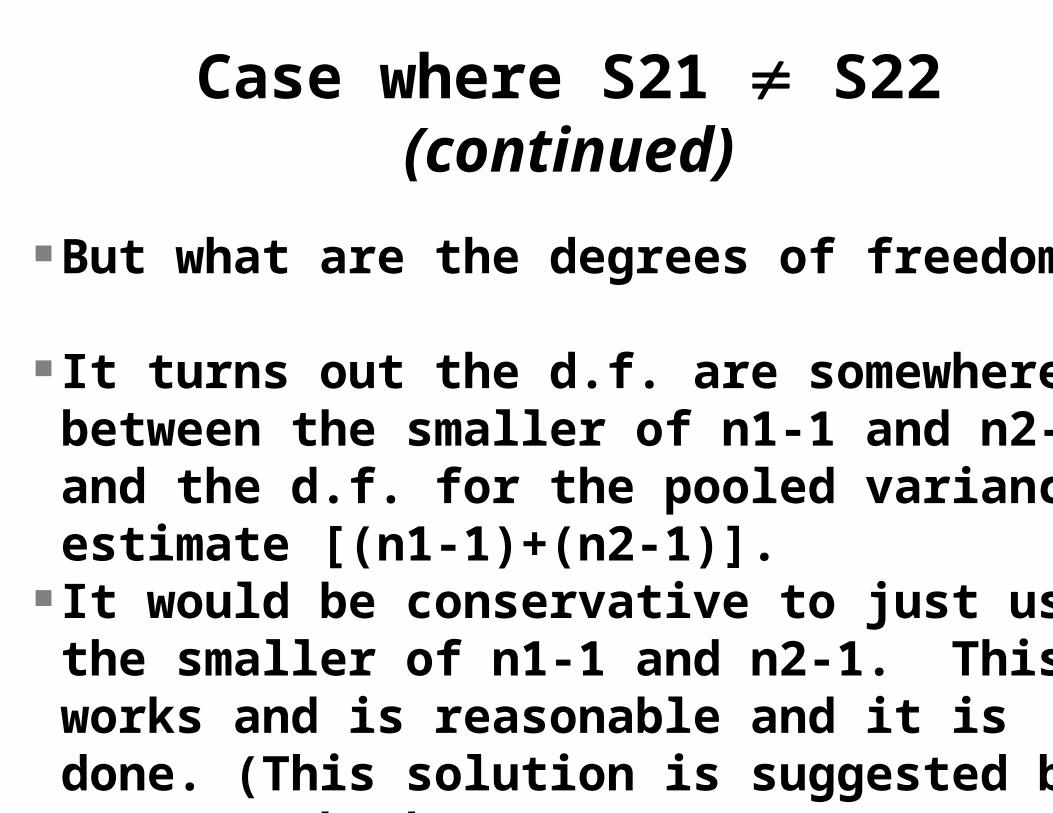
But what are the degrees of freedom? It turns out the d.f. are somewhere between the smaller of n1-1 and n2-1 and the d.f. for the pooled variance estimate [(n1-1)+(n2-1)].
It would be conservative to just use the smaller of n1-1 and n2-1. This works and is reasonable and it is done. (This solution is suggested by your textbook).
Case where S21 S22 (continued)
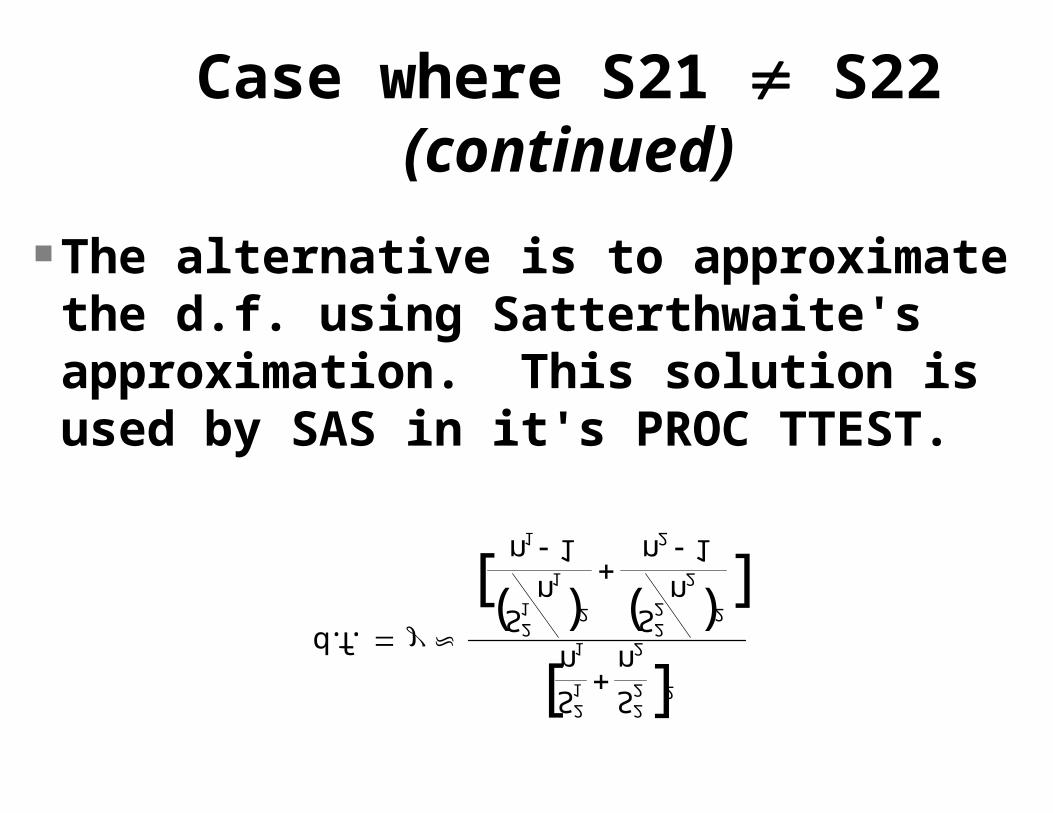
The alternative is to approximate the d.f. using Satterthwaite's approximation. This solution is used by SAS in it's PROC TTEST.
Case where S21 S22 (continued)
This calculation is, of course, an approximation as the name suggests. Note that it does not usually give nice INTEGER degrees of freedom. Expect some decimal places. This is not an issue for computer programs that can get P-values for any d.f., it does complicate using our tables a little.

Case where S21 S22 (continued)
There is one additional "simplification". We know that the d.f. are at least the smaller of n1-1 and n2-1. But what if n1 = n2 = n? In this case the d.f. will be at least n-1. However, Satterthwaite's approximation will still, usually, yield a larger d.f.
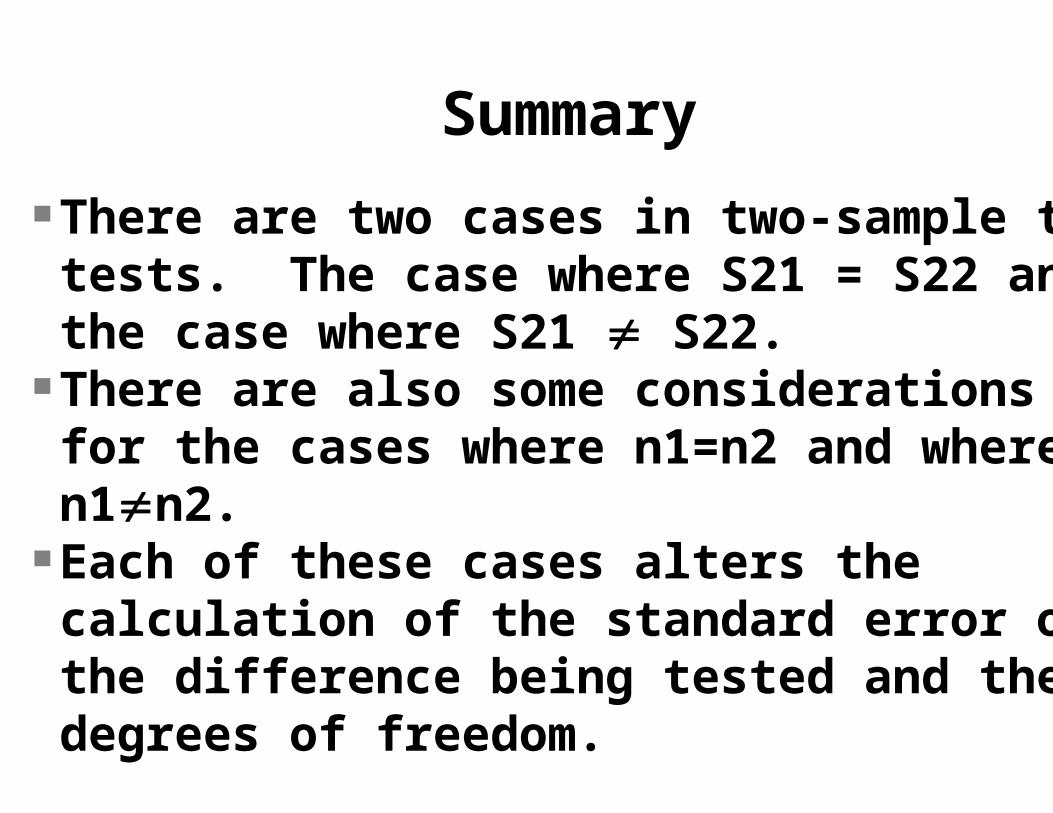
Summary There are two cases in two-sample t-tests. The case where S21 = S22 and the case where S21 S22.
There are also some considerations for the cases where n1=n2 and where n1n2.
Each of these cases alters the calculation of the standard error of the difference being tested and the degrees of freedom.

Summary (continued)
Variance S21 = S22 S21 S22
n1 n2 S2p(1/n1+1/n2) S21/n1+S22/
n2)n1=n2 =n 2S2p/n
d.f. S21 = S22 S21 S22
n1 n2 (n1-1)+(n2-1) smallern1-1, n2-1
n1=n2 =n 2n-2 n-1
Summary (continued)
For our purposes, we will generally use SAS to conduct two-sample t-tests, and will let SAS determine Satterthwaite's approximation when the variances are not equal?
How does SAS know if the variances are equal? How does it know what value of you want to use? Good questions. We'll get answers later.
Example 1
Compare the ovarian weight of 14 fish, 7 randomly assigned to receive injections of gonadotropin (treatment group) and 7 assigned to receive a saline solution injection (control group). Both groups are treated identically except for the gonadotropin treatment. Ovarian weights are to be compared for equality one week after treatment.

Example 1 (continued)
Obs Treatment Control1 134 702 146 853 104 944 119 835 124 976 * 777 * 80
* Died due to unrelated causes.

Example 1 (continued)
Statistic Treatment Controln 5 7
Yi 627 586Yi2 79,625 49,588Y 125.4 83.7SS 999 531 4 6
S2 249.8 88.6

Example 1 (continued)
Research question: Does the gonadotropin treatment affect the ovarian weight? (Note: non-directional)
First, which of the various situations for two-sample t-tests do we have?
Obviously, n1 n2. Now we must check the variances.

Example 1 (continued) 1) H0: 21 = 22 2) H1: 21 22 3) Assume Yi~NIDrv(, 2). Really, 2? 4) = 0.05 5) We have the samples, and know that the variances are 249.8 and 88.6, and the d.f. are 4 and 6 respectively. The calculated value is, given that we have a nondirectional alternative (put largest on top), F = 249.8/88.6 = 2.82 with 4, 6 d.f.

Example 1 (continued)
6) The critical value for 4, 6 d.f. is F/2,4,6 = 6.23. This is larger than the calculated value. We therefore fail to reject the null hypothesis.
7) We can conclude that the two samples have sufficiently similar variances for pooling.
Example 1 (continued)
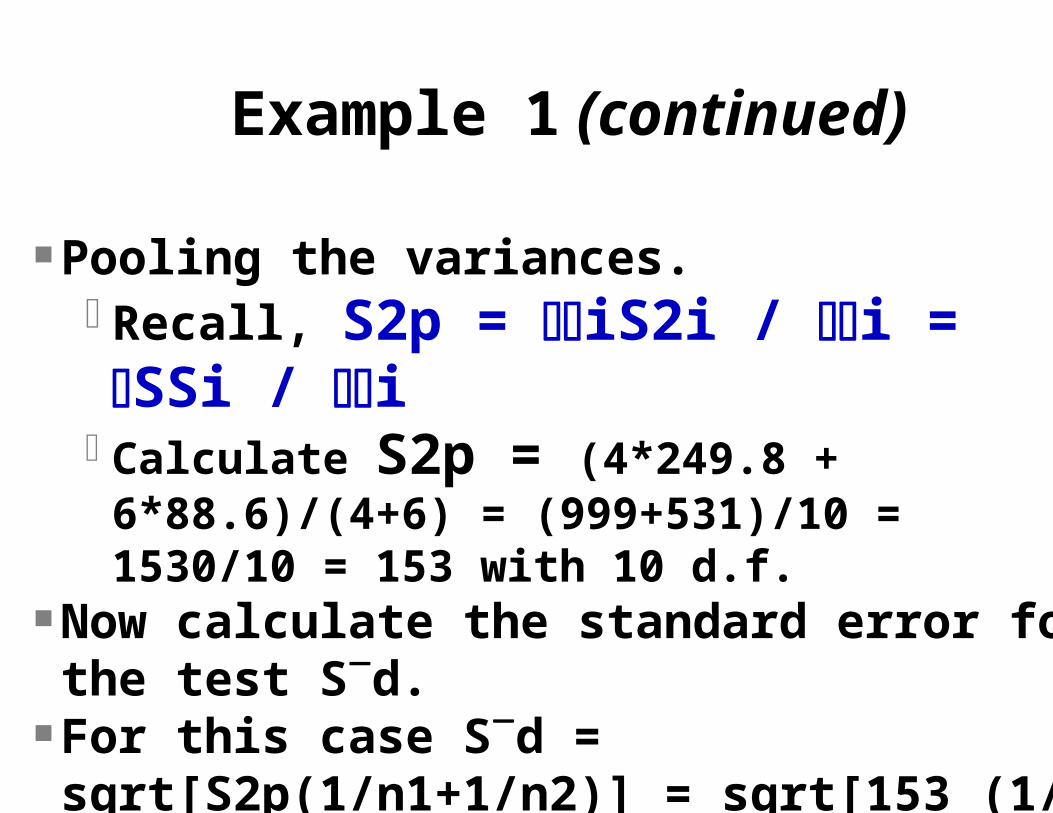
Pooling the variances. Recall, S2p = iS2i / i = SSi / iCalculate S2p = (4*249.8 + 6*88.6)/(4+6) =
(999+531)/10 = 1530/10 = 153 with 10 d.f. Now calculate the standard error for the test Sd.
For this case Sd = sqrt[S2p(1/n1+1/n2)] = sqrt[153 (1/5 + 1/7)] = sqrt[153(0.343)] = 52.457 = 7.24 with 10 d.f.

Example 1 (continued)
Now complete the two-sample t-test. 1) H0: 1-2 = , or in this case 1 = 2 since = 0
2) H1: 3) Assume Yi~NIDrv(, 2). NOTE 2. 4) = 0.05
Example 1 (continued)
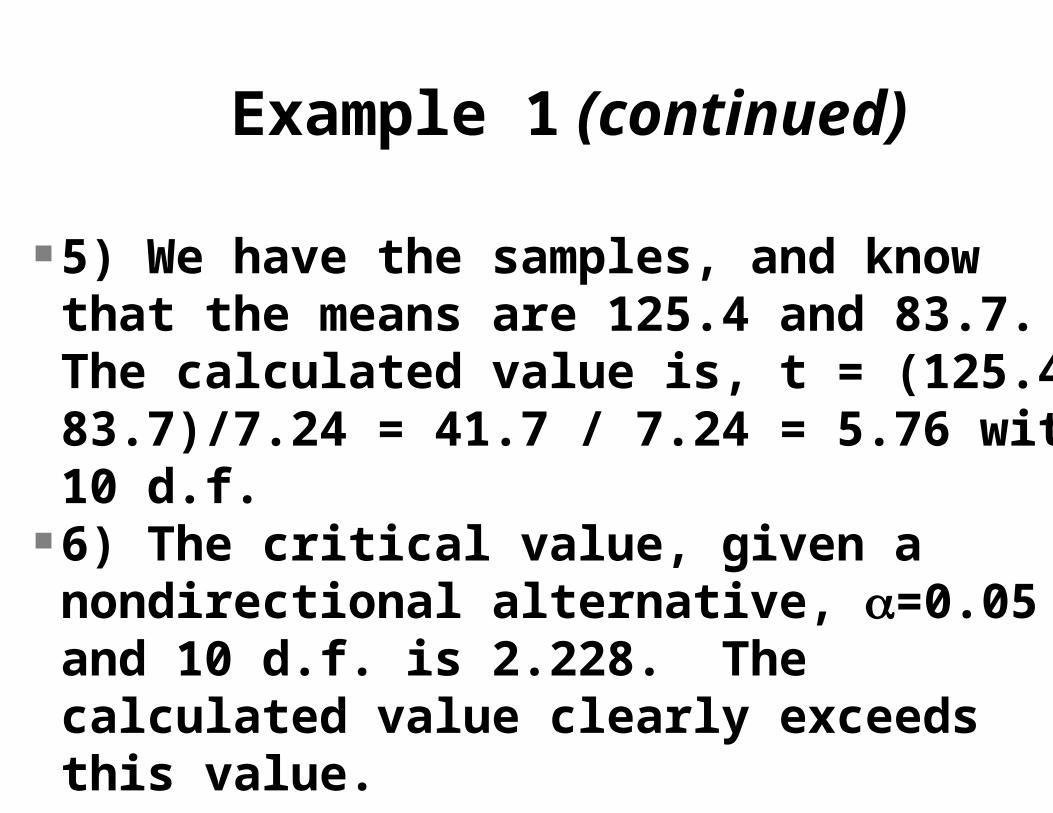
5) We have the samples, and know that the means are 125.4 and 83.7. The calculated value is, t = (125.4-83.7)/7.24 = 41.7 / 7.24 = 5.76 with 10 d.f.
6) The critical value, given a nondirectional alternative, =0.05 and 10 d.f. is 2.228. The calculated value clearly exceeds this value.
Example 1 (continued)
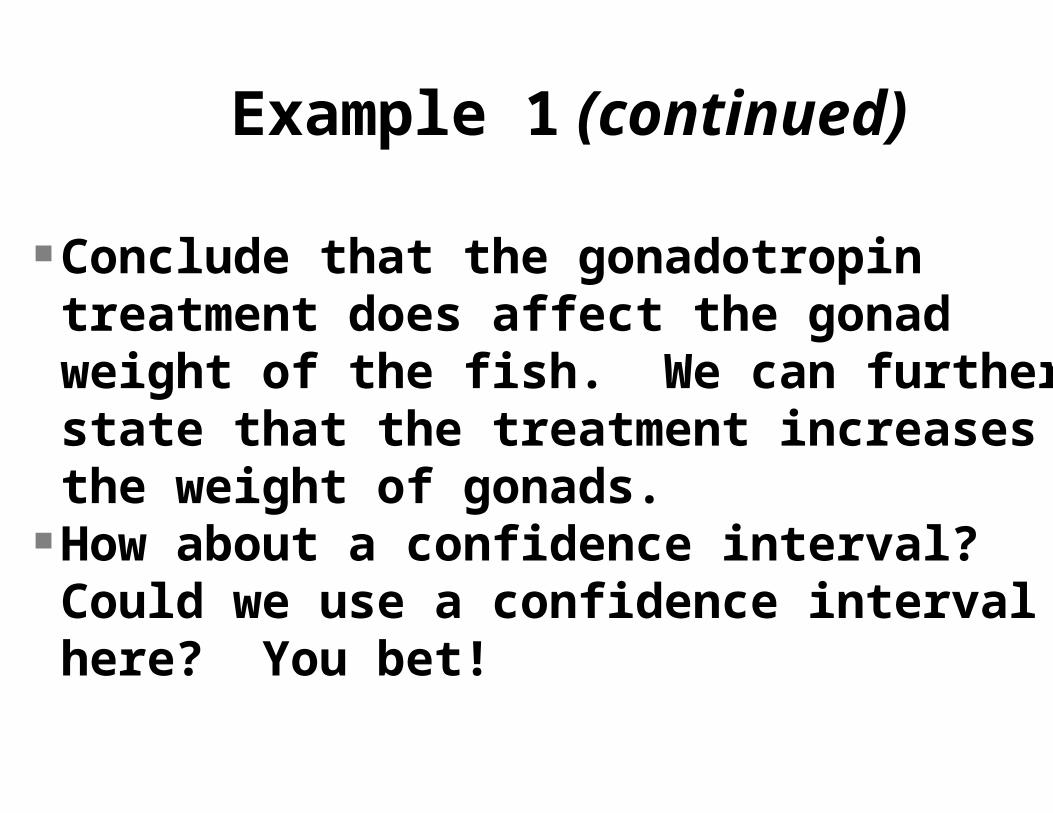
Conclude that the gonadotropin treatment does affect the gonad weight of the fish. We can further state that the treatment increases the weight of gonads.
How about a confidence interval? Could we use a confidence interval here? You bet!
Confidence interval for the difference between means
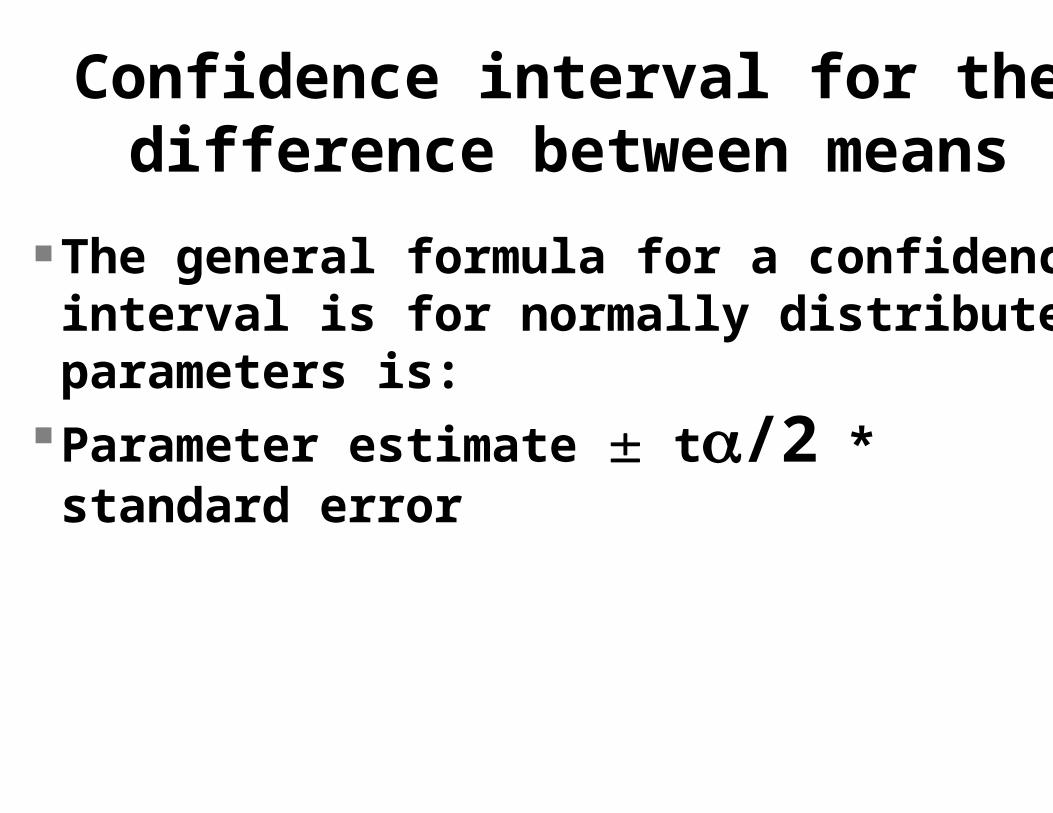
The general formula for a confidence interval is for normally distributed parameters is:
Parameter estimate t/2 * standard error

CI for the difference between means (continued)
For the estimate of the difference between 1 and 2 we have,for =0.05 we have t/2=2.228 with 10 d.fthe estimate of the difference is 41.7the std error of the difference is 7.24The confidence interval is then 41.7
2.228*7.24 or 41.7 16.13 and the probability statement is
P(25.57 1-2 57.83) = 0.95 Note that the interval does not contain the
value zero.

Summary
Testing for differences between two means can be done with the two-sample t-test or two sample Z test if variances are known.
For two independently sampled populations the variance will be
21/n1+22/n2 since it is a linear combination.
The problem is the d.f. for this expression are not known.
Summary (continued)
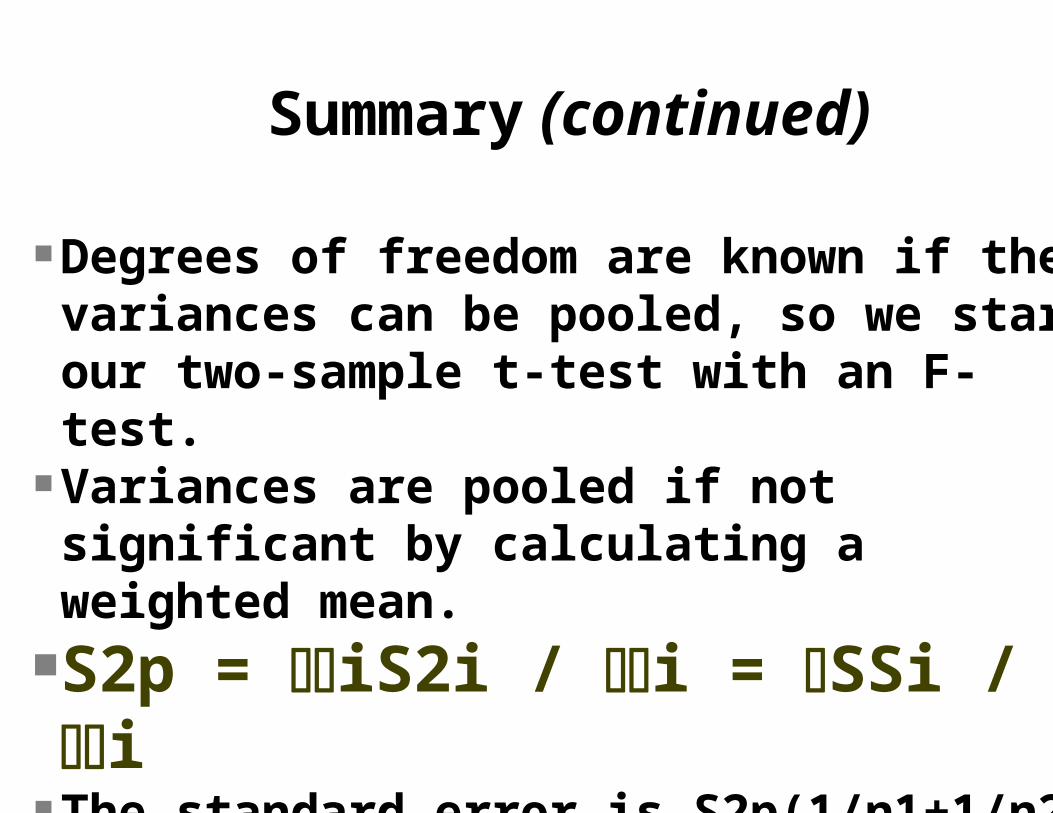
Degrees of freedom are known if the variances can be pooled, so we start our two-sample t-test with an F-test.
Variances are pooled if not significant by calculating a weighted mean.
S2p = iS2i / i = SSi / i The standard error is S2p(1/n1+1/n2)
Summary (continued)
If the variances cannot be pooled, the two-sample t-test can still be done, and degrees of freedom are approximated with Satterthwaite's approximation.
Once the standard error is known the test proceeds as any other t-test.
Confidence intervals can also be calculated.