STATISTICAL SURVEY OF XB-70 AIRPLANE
43
NASA TECHNICAL NOTE STATISTICAL SURVEY OF XB-70 AIRPLANE RESPONSES AND CONTROL USAGE WITH A N ILLUSTRATION OF THE APPLICATION -6872 LOAN COPY: RETURI AFWL (DOUL) KIRTLAND AFB. N. NATIONAL AERONAUTICS AND SPACE ADMINISTRATION WASHINGTON, D. C. JULY 1972 - II brought to you by CORE View metadata, citation and similar papers at core.ac.uk provided by NASA Technical Reports Server
Transcript of STATISTICAL SURVEY OF XB-70 AIRPLANE

N A S A TECHNICAL NOTE
STATISTICAL SURVEY OF XB-70 AIRPLANE RESPONSES AND CONTROL USAGE WITH A N ILLUSTRATION OF THE APPLICATION
-6872
LOAN COPY: RETURI AFWL (DOUL)
KIRTLAND AFB. N.
N A T I O N A L A E R O N A U T I C S A N D S P A C E A D M I N I S T R A T I O N W A S H I N G T O N , D. C. JULY 1972
- II
https://ntrs.nasa.gov/search.jsp?R=19720019363 2020-03-23T12:27:52+00:00Zbrought to you by COREView metadata, citation and similar papers at core.ac.uk
provided by NASA Technical Reports Server

~
1. Report No. 2. Garernment Accession No.
NASA TN D-6872 4. Title and Subtitle STATISTICAL SURVEY O F XB-70 AIRPLANE RE- SPONSES AND CONTROL USAGE WITH AN ILLUSTRATION O F THE APPLICATION TO HANDLING QUALITIES CRITERIA
~- . .~ . ~~ ~~. . .
Bruce G. Powers
9. Performing Organization Name and Addrm
NASA Flight Research Center P. 0. Box 273 Edwards, California 93523
~~ -
2. Sponsoring Agency Name and Address
National Aeronautics and space Administration Washington, D. C. 20546
5. Supplementary Notes ~. - _ _ _ . .. . .
l- 3. Recipient's C a t a l o g No.
5. Report Date July 1972
6. Performing Organization Code
8. Performing Organization Report No.
H-663 10. Work Unit No.
136-62-01-00-24 . .
11. Contract or Grant No.
13. Type of Report and Period Covered
- Technical Note 14. Sponsoring Agency Code
The magnitude and frequency of occurrence of aircraft responses and control inputs during 27 flights of the XB-70 airplane were measured. In order to consider only the normal operation of the airplane, data for specialized tests were not in- cluded in the general analysis, although another analysis which included these tests was made to indicate requirements for flight test aircraft. Data were recorded on digital tape and sampled at 1-minute intervals. The flights were divided into six regions for analysis. A separate analysis was made of the approach and landing region of 17 flights for which data were available at a sampling rate of 20 points per second.
Exceedance curves are presented for the airplane responses and control usage. A technique is presented which makes use of these exceedance curves to establish or verify handling qualities criteria. This technique can provide a means of incor- porating current operational experience in handling qualities requirements for future aircraft.
"" ~- - ~ - . " .. .
17. Key Words (Suggested by Authw(r)) 18. Distribution Statement
Control usage Airplane response Handling qualities
Unclassified - Unlimited
" ~ " - ~~
19. Security Classif. (of this report)
Unclassified
22. Rice' ,21. NO. of Pages 20. Security Classif. (of this page)
Unclassified . ~ ~ ~ _ _ - 40 .~. . $3.00
.. ~~ -.
*For sa le by the National Technical Information Service, Springfield, Virginia 22151
STATISTICAL SURVEY OF XB-70 AIRPLANE RESPONSES AND CONTROL USAGE
WITH AKILLUSTRATION OF THE APPLICATION TO
HANDLING QUALITIES CRITERIA
Bruce G. Powers Flight Research Center
INTRODUCTION
In the preliminary design of aircraft, several assumptions have to be made re- garding the maneuvering capability that must be provided in various parts of the flight envelope. On the basis of these assumptions, the size and authority of the con- trol surfaces can be determined. The assumptions are generally extrapolated from aircraft experience such as that described in references 1 to 4. However, little quan- titative information is available, especially in terms of frequency of usage of airplane response and control inputs, which could be applied to large, supersonic cruise vehicles.
The purpose of this study was to determine the magnitude and frequency of occur- rence of XB-70 airplane responses and control inputs. Results are presented for the normal operation of the airplane, as well as results of specialized tests (such as stability and control). These tests were made to indicate mission and flight test re- quirements.
Flights were divided into six regions for analysis. The data were limited by the number of flights (27) and by the sampling rate of 1 point per minute, which yielded less than 3000 data points for each parameter. A s a result, the data were limited to frequencies of occurrence greater than A separate analysis was made of the final approach and landing region for 17 flights for which data were sampled at a rate of 20 points per second.
Examples are given of the use of statistical data of this type to establish or verify handling qualities criteria. Two methods a r e used to establish the relationship between the probability of exceeding a response and the handling qualities criteria boundaries.
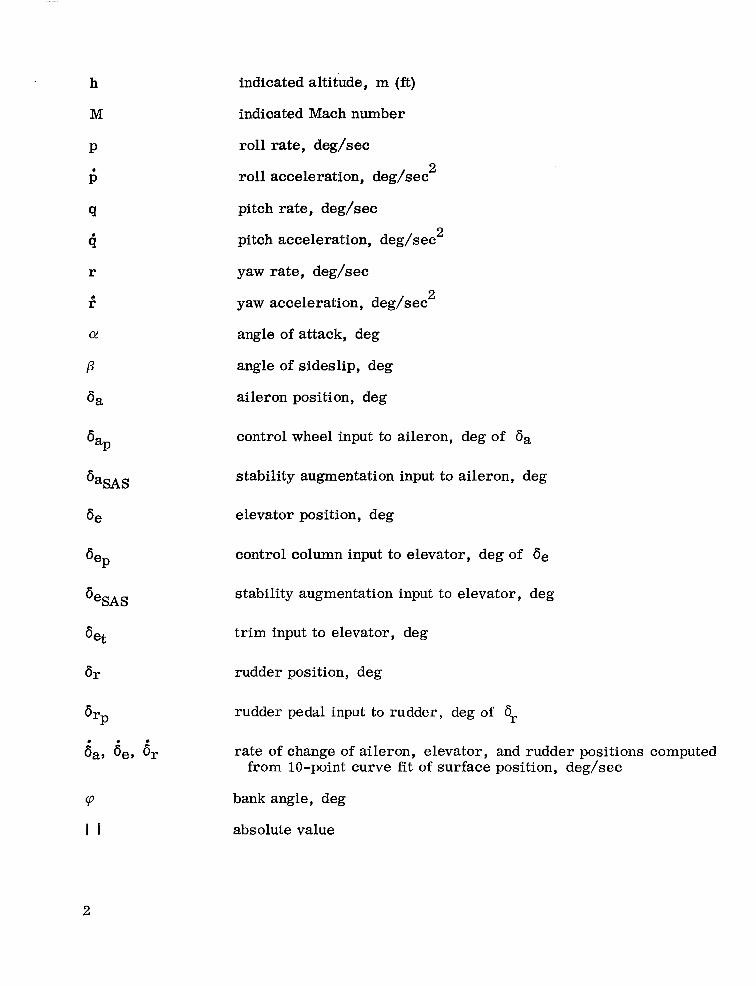
SYMBOLS
Physical quantities in this report are given in the International System of Units (SI) and parenthetically in U. S. Customary Units. The measurements were taken in U. S. Customary Units. Factors relating the two systems are presented in reference 5.
an normal acceleration, g
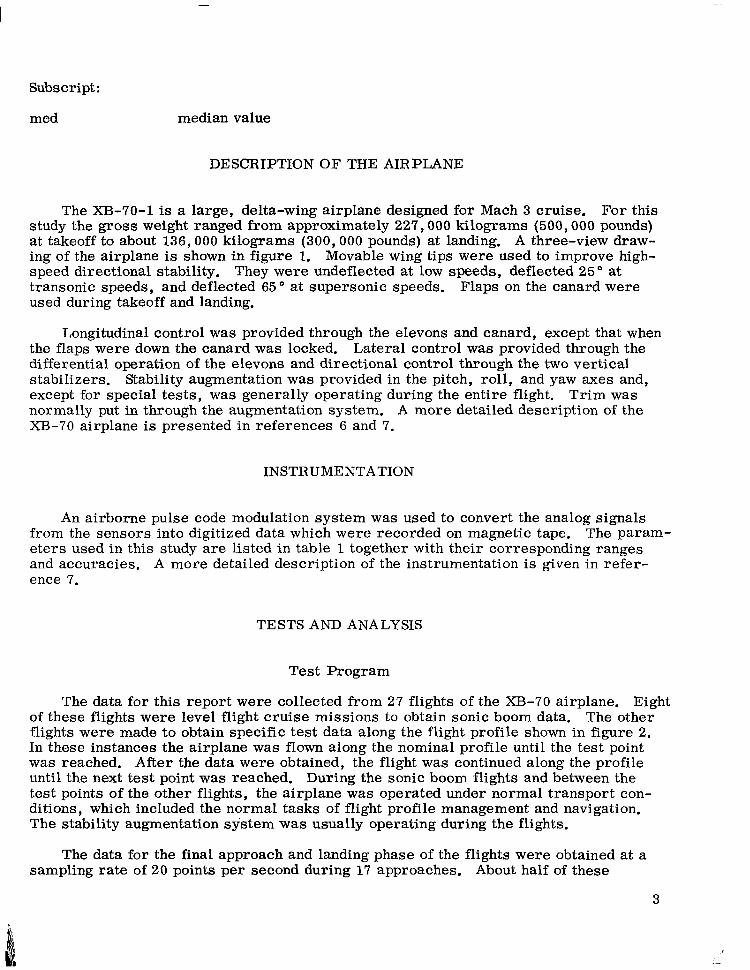
h
M
6aSAS
6e
6eSAS
6et
P
I I
indicated altitude, m (ft)
indicated Mach number
roll rate, deg/sec
roll acceleration, deg/sec
pitch rate, deg/sec
pitch acceleration, deg/sec
2
2
yaw rate, deg/sec
yaw acceleration, deg/sec 2
angle of attack, deg
angle of sideslip, deg
aileron position, deg
control wheel input to aileron, deg of 6a
stability augmentation input to aileron, deg
elevator position, deg
control column input to elevator, deg of 6e
stability augmentation input to elevator, deg
trim input to elevator, deg
rudder position, deg
rudder pedal input to rudder, deg of 6r
rate of change of aileron, elevator, and rudder positions computed from 10-point curve fit of surface position, deg/sec
bank angle, deg
absolute value
2
Subscript:
med median value
DESCRIPTION OF THE AIRPLANE
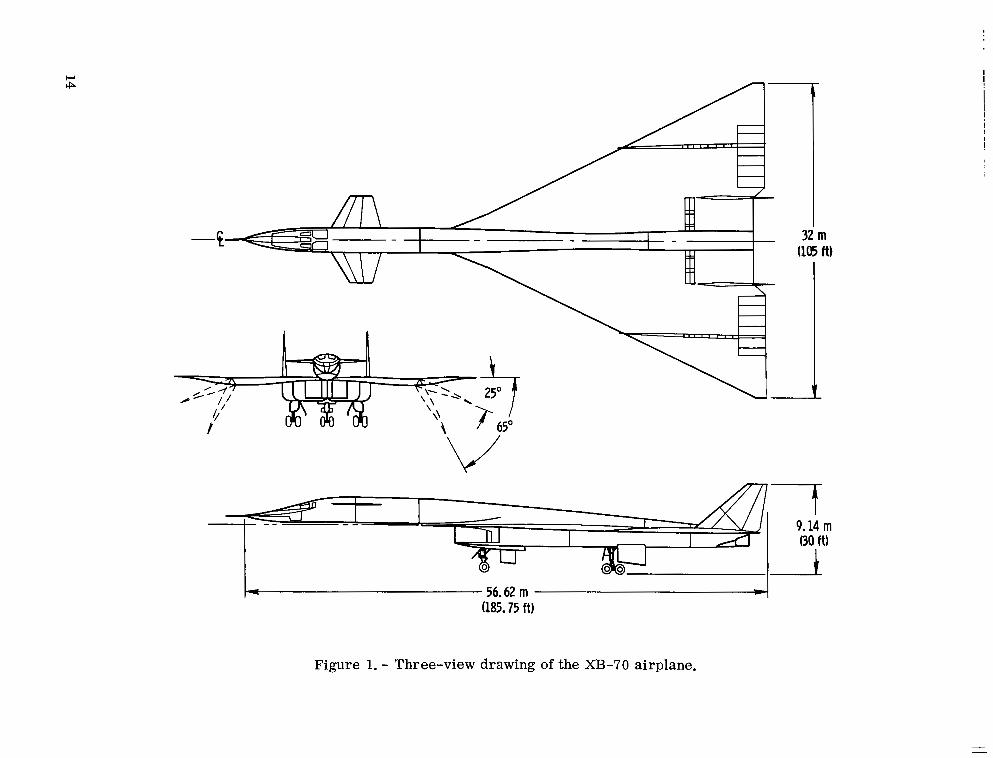
The XB-70-1 is a large, delta-wing airplane designed for Mach 3 cruise. For this study the gross weight ranged from approximately 227,000 kilograms (500,000 pounds) at takeoff to about 136,000 kilograms (300,000 pounds) at landing. A three-view draw- ing of the airplane is shown in figure l. Movable wing tips were used to improve high- speed directional stability. They were undeflected at low speeds, deflected 25" at transonic speeds, and deflected 65 O at supersonic speeds. Flaps on the canard were used during takeoff and landing.
Longitudinal control was provided through the elevons and canard, except that when the flaps were down the canard was locked. Lateral control was provided through the differential operation of the elevons and directional control through the two vertical stabilizers. Stability augmentation was provided in the pitch, roll, and yaw axes and, except for special tests, was generally operating during the entire flight. Trim was normally put in through the augmentation system. A more detailed description of the XB-70 airplane is presented in references 6 and 7.
INSTRUMENTATION
An airborne pulse code modulation system was used to convert the analog signals from the sensors into digitized data which were recorded on magnetic tape. The param- eters used in this study are listed in table 1 together with their corresponding ranges and accuracies, A more detailed description of the instrumentation is given in refer- ence 7.
TESTS AND ANALYSIS
Test Program
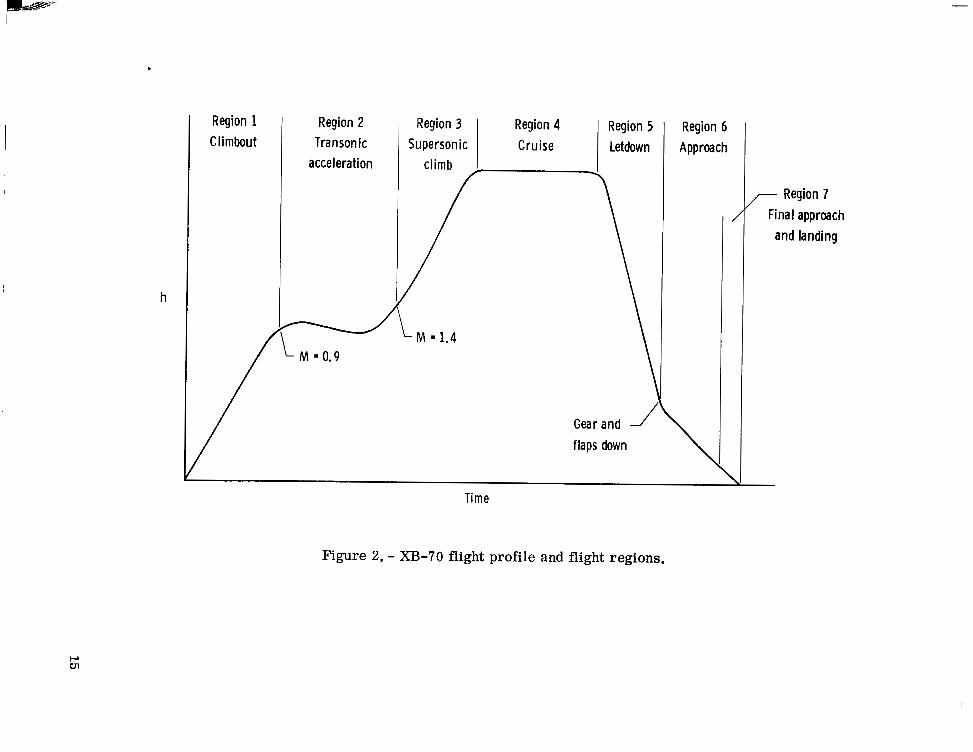
The data for this report were collected from 27 flights of the XB-70 airplane. Eight of these flights were level flight cruise missions to obtain sonic boom data. The other flights were made to obtain specific test data along the flight profile shown in figure 2. In these instances the airplane was flown along the nominal profile until the test point was reached. After the data were obtained, the flight was continued along the profile until the next test point was reached. During the sonic boom flights and between the test points of the other flights, the airplane was operated under normal transport con- ditions, which included the normal tasks of flight profile management and navigation. The stability augmentation system was usually operating during the flights.
The data for the final approach and landing phase of the flights were obtained at a sampling rate of 20 points per second during 17 approaches. About half of these
3

approaches were normal 1 " to 2 O glide slope, visual approaches ; the others were 3" glide slope approaches in which a visual light-beam, glide slope indicator was used. The 3" glide slope approaches were usually flown with the stability augmentation system disengaged so that handling qualities could be evaluated. The other approaches were usually made with the augmentation system engaged.
Flight Region Definition
To define the effects of different flight regions, the flights were divided into six segments (fig. 2): climbout, transonic acceleration, supersonic climb, cruise, letdown, and approach. These regions and the final approach and landing region may be described briefly a s follows:
(1) Climbout - from lift-off to the level-off for the transonic acceleration region at a Mach number of approximately 0.9 and an altitude of approximately 10,700 meters (35,000 feet), including gear and flap retraction and lowering of the wing tips to the half-down position.
(2) Transonic acceleration - from a Mach number of 0.9 to 1.4 usually involving level flight o r a slight dive with little maneuvering. Wing tips are lowered to the full down position near a Mach number of 1.4.
(3) Supersonic climb - the climb from a Mach number near 1.4 and an altitude of approximately 10,700 meters (35,000 feet) to cruise conditions, including the level-off and the establishment of cruise conditions.
(4) Cruise - essentially constant Mach number and altitude, with cruise conditions varying with the mission objectives.
(5) Letdown - from the end of the cruise portion through the deceleration and de- scent to about 6100 meters (20,000 feet) altitude, where the gear and flaps a re lowered for the landing configuration.
(6) Approach - includes all flight in the landing configuration and extends from ap- proximately 6100 meters (20,000 feet) altitude to, but not including, touchdown.
(7) Final approach and landing - extends from approximately the outer runway marker through the flare to, but not including, touchdown. The approach region over- laps the final approach and landing region, but, because of the different sampling rates, the region 7 data were not included with the region 6 data.
Histograms of Mach number and altitude for each of the flight regions a s well as the cumulation of these flight regions a r e shown in figures 3(a) to 3(g). The percents of occurrences shown are percents of the total occurrences in the flight rather than the percent of each region. Because the samplings were made at fixed time increments, the histograms represent the percent of time spent at these flight conditions. The data for the entire flight are somewhat nonrepresentative of a typical transport mission be- cause of the relatively short time spent in cruise. This is attributed primarily to the removal of data from the specialized tests, which were usually performed at cruise conditions.
4

Method of Analysis
The data recorded on the airplane were converted to engineering units and recorded on another tape. From a plotted time history of each flight, the time intervals of the various regions and the special test data which were to be removed were determined. Instrumentation checks were made to determine whether the data were valid for each of the parameters. The data tape was then searched, and histograms were made for each valid parameter for the various regions. The histogram data were summed for all the flights and nondimensionalized to determine the probability that they would fall within any given interval. The cumulative probabilities were then formed and presented in terms of the probability that the data would be greater or less than a given value of the parameter. For the parameters that were expected to have a symmetric distribution about zero, the cumulative probabilities or exceedance curves were formed in terms of the probability of exceeding the absolute value of the parameter.
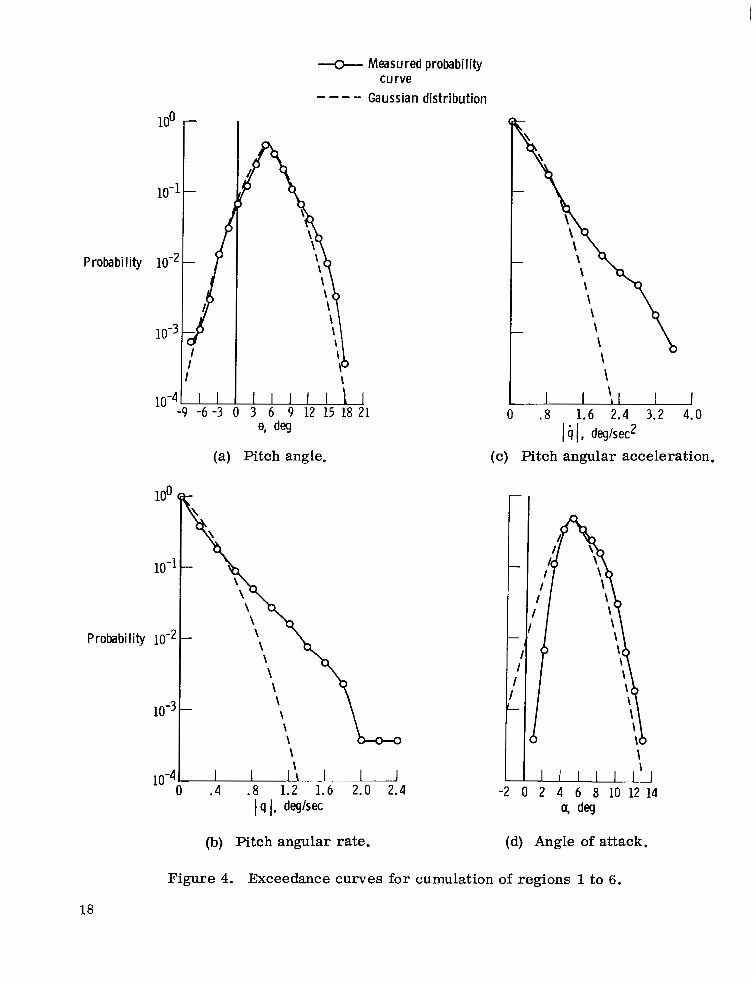
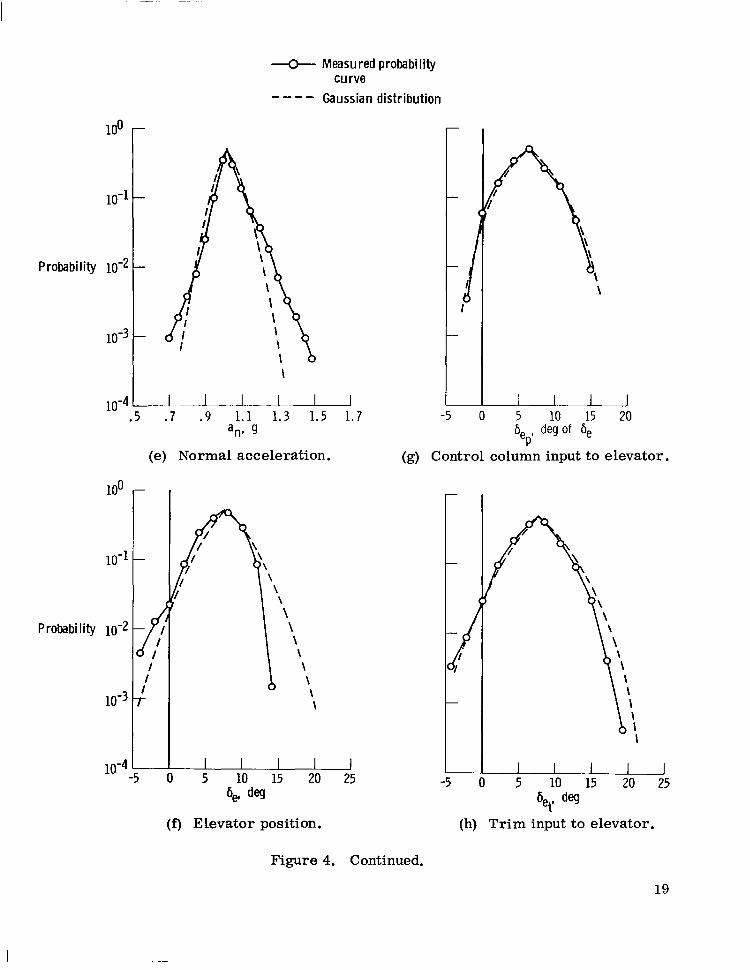
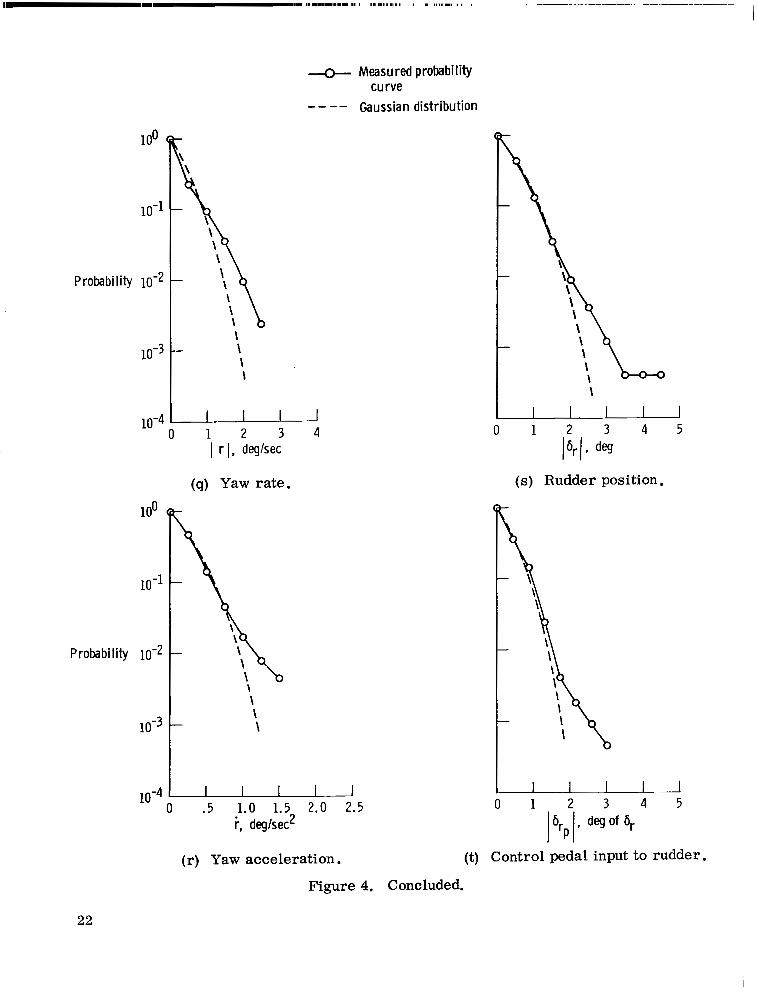
RESULTS
Exceedance curves of the basic data for the cumulation of regions 1 to 6 , including all special flight test maneuvers, are shown in figures 4(a) to 4(t). The data a re shown in terms of the probability of exceeding a given value of a parameter as a function of the parameter value. Also shown in the figures is the Gaussian distribution calculated from the standard deviation. The data for these figures were sampled at 1 point per minute,
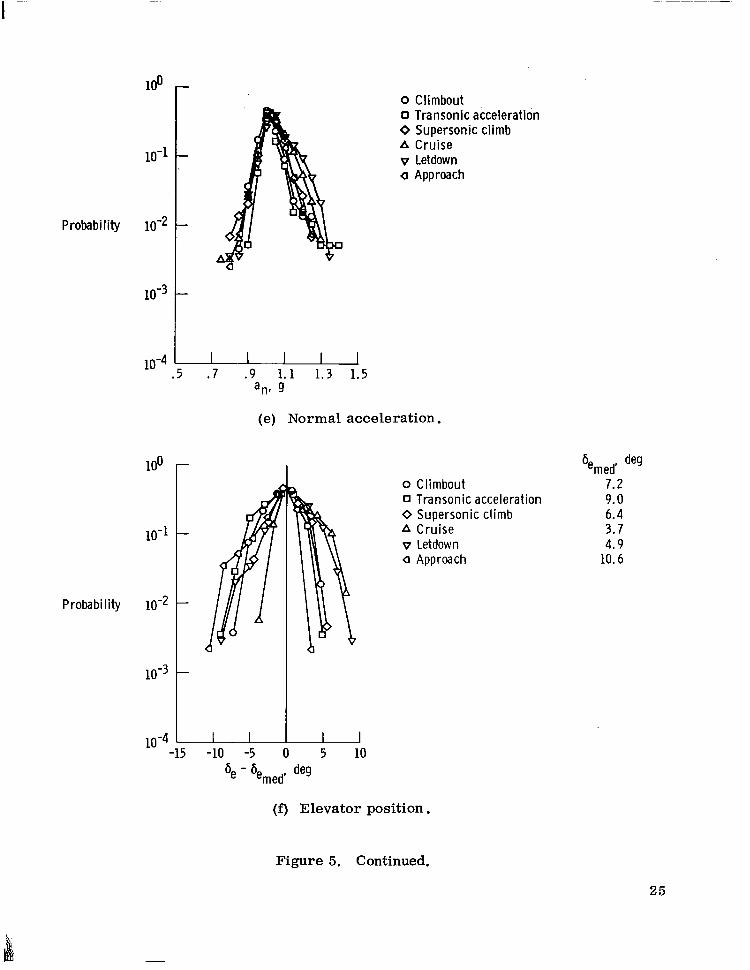
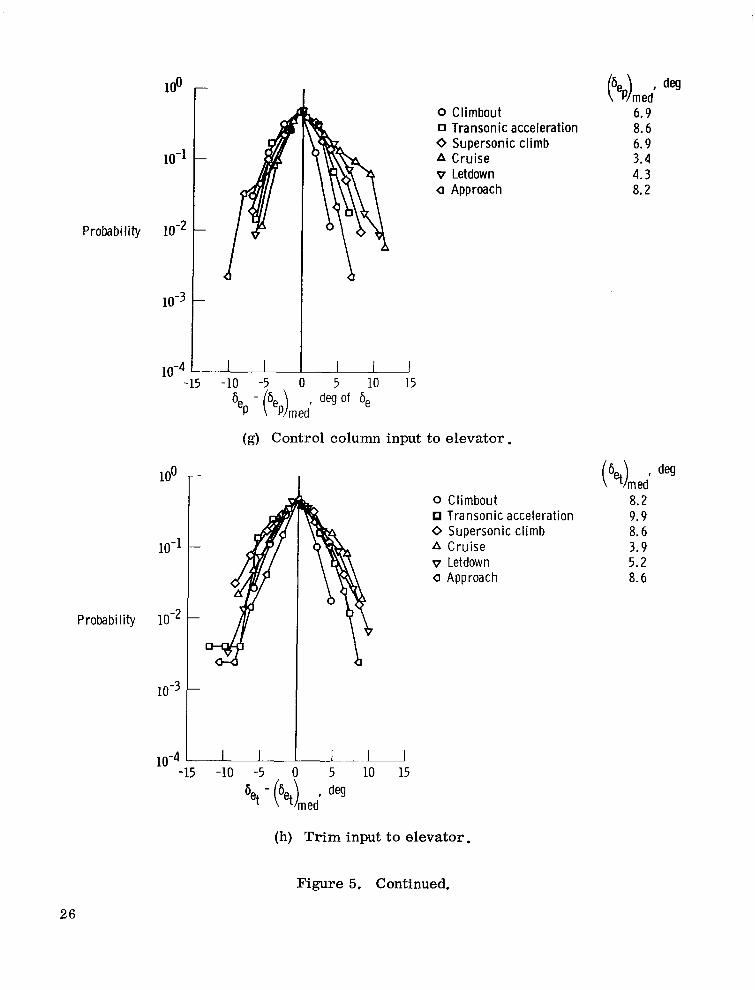
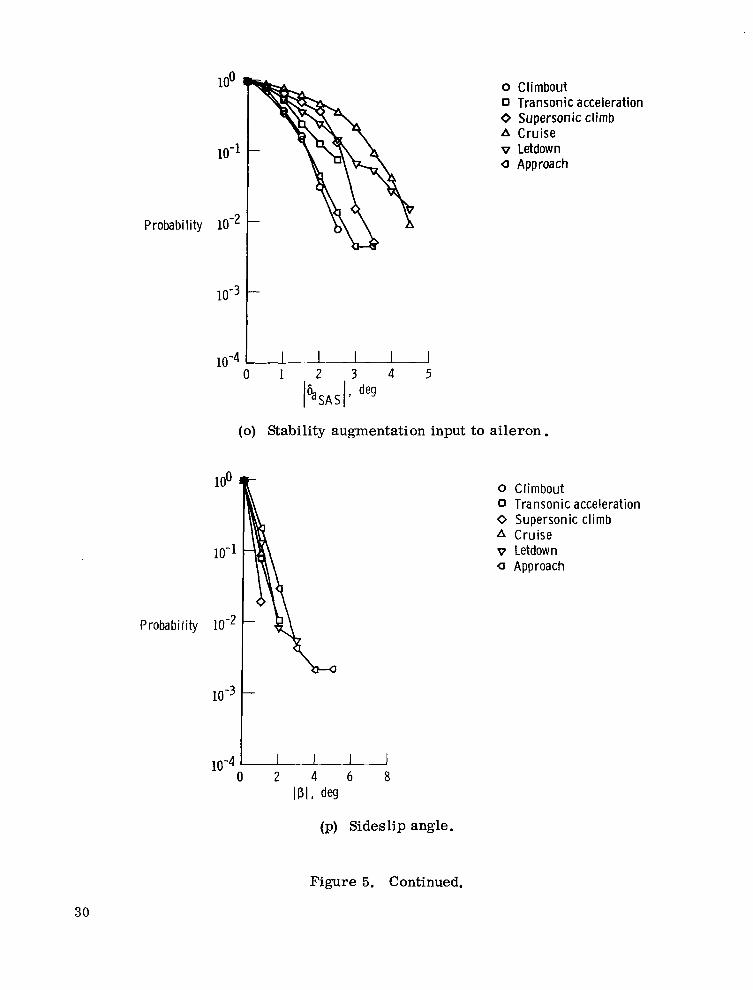
The data of figure 4 a re broken down into the six different flight regions in fig- ures 5(a) to 5(t). The data in these figures do not include the flight test maneuver data and are therefore representative of the "normal" operation of the XB-70 airplane in these flight regions. A cumulation of regions 1 to 6 with test maneuver data removed is not shown because the small amount of time spent in cruise would weight the other regions too heavily.
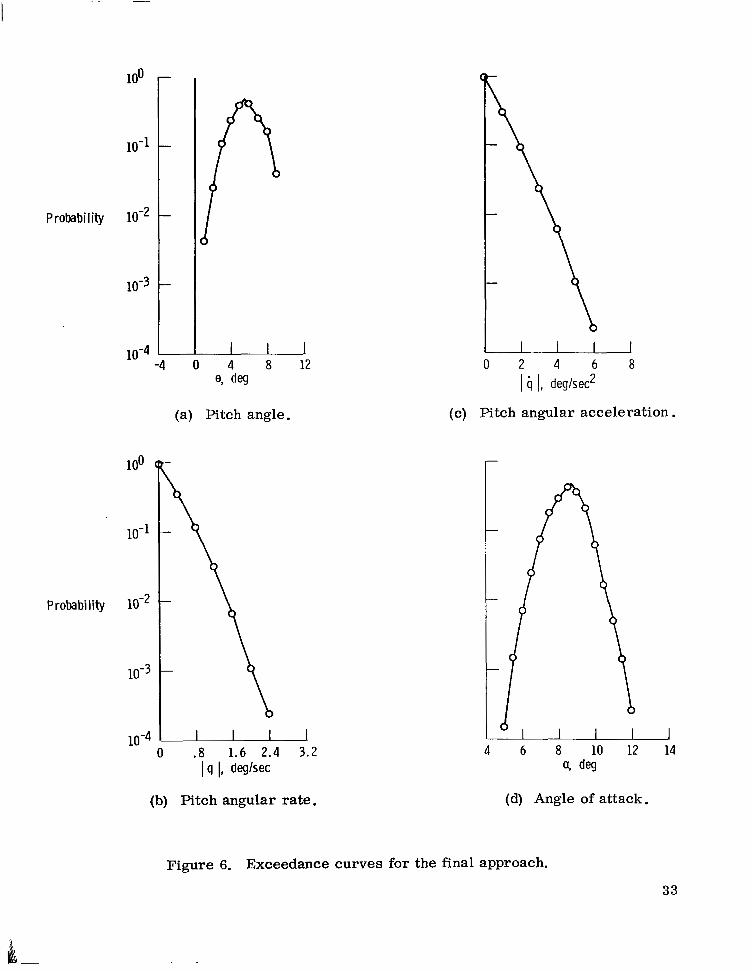
The data obtained at the 20-point-per-second sampling rate for the final approach and landing a r e shown in figures 6(a) to 6(t). These data were not added to the data in figure 4 o r to flight region 6 in figure 5.
DISCUSSION
Limitation Because of Nontypical Flight
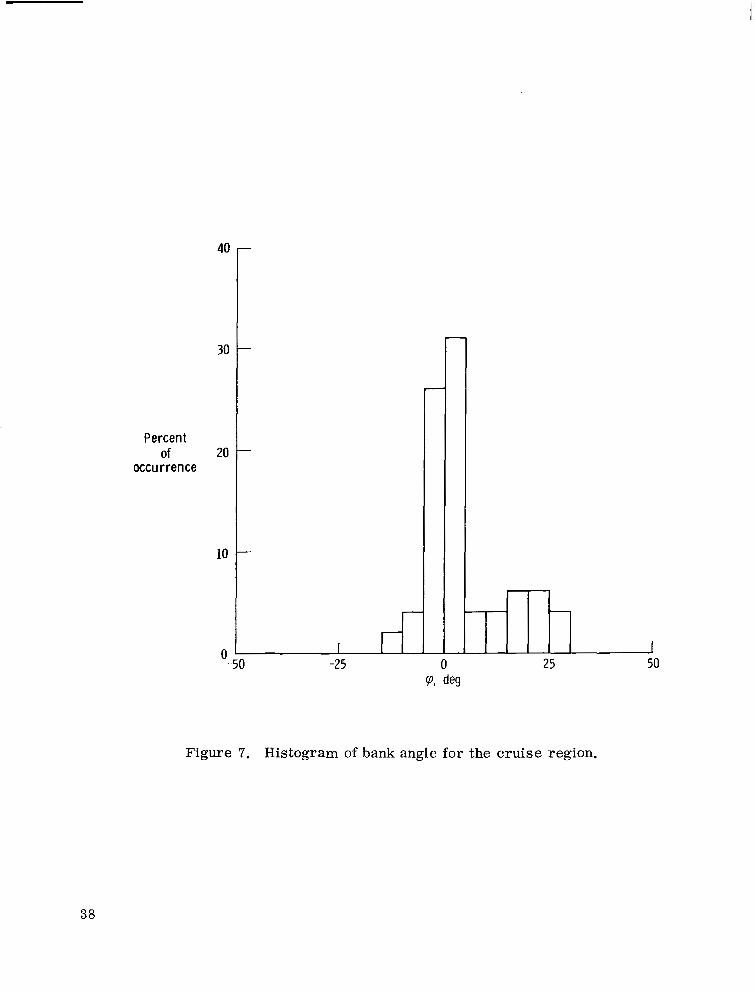
A s pointed out previously, the results for an entire flight could not be obtained di- rectly because of the relatively small amount of time spent in cruise conditions. An- other nonrepresentative feature of the XB-70 flight testing was that takeoffs and landings were made at the same location. This made an additional 360" turn necessary, which is not usual in normal transport operation. A clockwise track was usually flown, thus the turn was to the right, with about half occurring during the cruise portion of the flight, This is illustrated in figure 7, a histogram of bank angle for the cruise region. Although the histograms of all the roll and yaw axis parameters show a definite skew similar to the bank angle histogram, the absolute value of these parameters is repre- sentative of conditions where equal left- and right-hand turns are made. However,
5

this additional 360" turn does require maneuvering, especially during the cruise, that would not normally be necessary. The additional maneuvering is also reflected in the pitch axis parameters, because additional load factor must be used during the turns. Most flights were made under good weather conditions, so turbulence and weather in- puts were generally small.
Statistical Characteristics of the Data
Because it is desirable to be able to determine the parameter magnitude for low probabilities of occurrence, it is necessary to know something of the form of the dis- tribution. The data in figure 4 a re plotted on semilog paper, as is the Gaussian distri- bution calculated from the standard deviation. In general, a nearly straight-line fairing of the data would be a better fit of the angular rates and accelerations and the normal acceleration than the Gaussian distribution. Thus the form of the distribution of these data appears to be closer to a simple exponential distribution than to the Gaussian dis- tribution. A similar observation on the form of the distribution of gust velocities was made in reference 8. On the other hand, the distribution of the airplane attitudes and surface positions is closely approximated by the Gaussian distribution. The data in figures 5 and 6 for the individual regions also follow this trend.
From a statistical standpoint, the difference between the measured distribution and the Gaussian distribution is not significant. When the Kolmogorov-Smirnov test (ref. 9) is used, the maximum difference between a sample distribution and the actual
population distribution is E (where N is the number of points in the sample), for a 0.20 level of significance. For a sample of 3000 points, which is representative of the largest sample in this study, 0.20 of the sample distributions will be outside the band of kl. 07/3000 = * O . 02 around the true distribution. At the probability level of 0.001, the sample distribution need only be within the band of 0.001 &O. 02 to meet the 0.2 significance level test. So, although the distribution of the data of this study is sometimes an order of magnitude from the Gaussian distribution at the 0,001 level, this difference is not statistically significant with the small data sample that is available.
N
Relationship of Exceedance Probabilities and Handling Qualities Boundaries
Most previously reported statistical data on aircraft responses are oriented to- ward structural loads (as in ref. 1). In this section a few examples are given to illus- trate the application of statistical results to handling qualities requirements. Because the XB-70 data used for these examples are limited, the numerical results shown a r e tentative and intended only as illustrations of the suggested methods for applying the statistical results. In the probability data for the airplane responses, no distinction is made regarding the cause of the response. The response may be due to atmospheric inputs o r to airplane control inputs. It is assumed that even if a response is due to at- mospheric inputs, an airplane control input of the same magnitude would be required to counteract it. On this assumption the responses which were measured can be transla- ted into control requirements. This assumption is not completely accurate, however, because a pilot usually allows the basic airplane stability to return the airplane to its trim condition, perhaps with small pilot inputs. Thus, the measured response is gen- erally higher than the response due to the control input. This means that the control requirements derived in this study a r e higher than actually required.
6

After making the assumption that the measured responses are indicative of the re- sponses required of the airplane controls, the problem is to determine what probability of exceedance of airplane response corresponds to the various handling qualities crite- ria boundaries. In the following section, the relationship between the handling qualities criteria boundaries and the exceedance probabilities is developed using two methods. In the first method, the response values are determined by using an established handling qualities criterion (ref. 10). This is accomplished by correlating the response required by the criterion with the probability of exceeding this response obtained from the XB-70 data. In the second method, the probability of exceedance is related to the probabilities associated with the handling qualities criteria boundaries of Military Specification MIL-F-8785B (ref. 11).
Because the XB-70 data are limited in the range of probabilities covered, only the handling qualities boundary corresponding to a pilot rating of 6. 5 is examined. This is the boundary between the acceptable and the unacceptable regions. The pilot rating scale and the associated verbal description are shown in table 2.
Method I.- In the first method of establishing the relationship between the exceed- ance probability and the handling qualities boundaries, the roll rate criterion of refer- ence 10 is used. In this criterion, the roll performance in the approach is presented in terms of roll acceleration and roll mode time constant. The XB-70 airplane had a roll mode time constant of 0.8 second in the approach; the criterion boundary in this region corresponding to a pilot rating of 6 .5 is a roll rate of about 7 degrees per sec- ond. Comparing this value with the roll rate data of figure 6(j), the probability of ex- ceeding this roll rate is 4 X for the final approach and landing. On the basis of the data for the approach r e 'on (region 6, fig. 5(k)), the probability of exceeding 7 degrees per second is about lO-$using a straight-line extrapolation of the data. This would in- dicate that the probability of exceeding the value corresponding to the 6 . 5 pilot rating boundary is on the order of
Method 11.- In the second approach to determining the relationship of the criterion boundaries to the probability of exceedance, the handling qualities specification of ref- erence 11 is used. Reference 11 uses a statistical approach in considering the impact of system failures on handling qualities. The philosophy that underlies these specifica- tions is that the more likely it is that a particular system will fail, the less handling qualities degradation the system failure should cause. Consequently, the handling qualities requirements with a system failed are a function of the probability of the sys- tem failure, as shown in table 3. The region of interest is the 6 .5 pilot rating bounda- ry, which in table 3 corresponds to the level 2 boundary and a system failure probability of A roll control system consisting of ailerons and spoilers is used as an ex- ample of the a plication of these requirements. If the spoilers have a probability of failure of 1 0 - 4 the roll performance with the spoilers inoperative must meet the level 2 boundary requirements; that is, the handling qualities with the spoilers inoperative must have a pilot rating of at least 6.5. The problem then is to determine what roll perform- ance should be required for this spoiler-inoperative (i. e. , aileron-only) roll mode.
One method is to consider the probability of a system failure and the probability of needing airplane response in excess of that available with the system failed. The com- bined probability should be extremely remote (e. g. , the same probability a s a struc- tural failure) so that degraded handling qualities will not jeopardize the safety of the airplane. In this way, the possibility of needing more response than is available after a system failure would be as remote as the possibility of a structural failure. In terms
7

of the roll example, the probability of a spoiler system failure followed by a need for more roll performance than is available with the ailerons onl should be extremely re- mote. Assuming this extremely remote probability to be lo-+, and knowing that the probability of the spoilers fa i l ing is the probability of exceeding the roll capabili- ty available with the ailerons should be 10 -3.
The same rationale can be applied to the level 1 (3. 5 pilot rating) boundary, for which the system failure probability is 10 -2. For a total probability of 10 -7, the ex- ceedance probability corresponding to the 3 . 5 pilot rating boundary must be
General Application to Handling Qualities Analyses
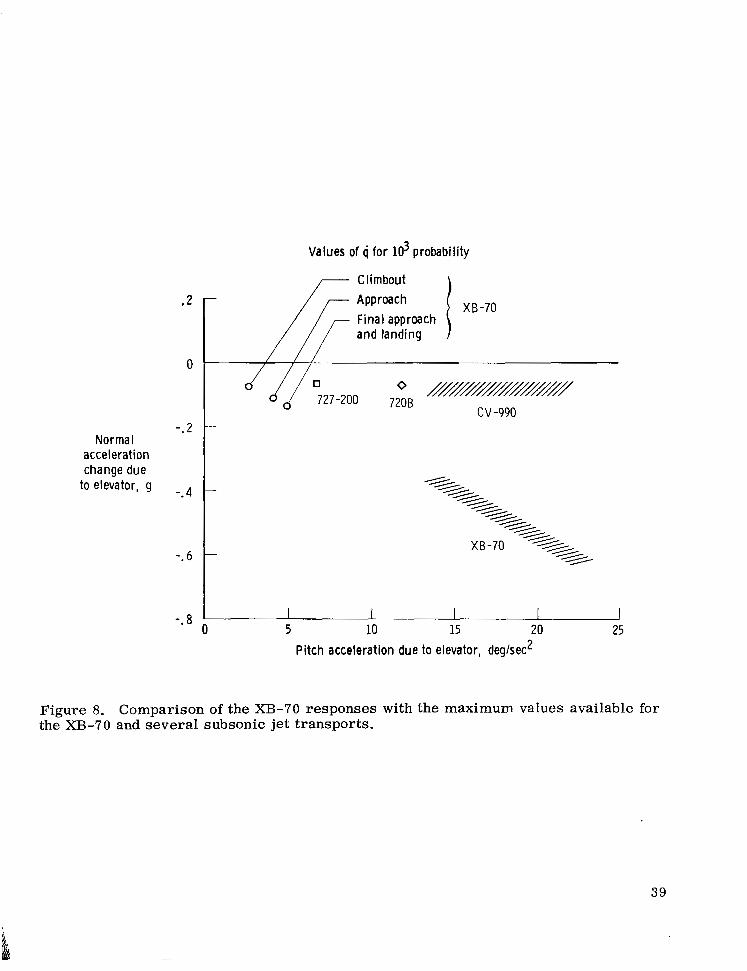
The two methods of establishing the relationship between the exceedance probabili- ty and the handling qualities boundaries indicate that the exceedance probability to be associated with the 6 . 5 pilot rating boundary is on the order f A summary of the response data in figures 5 and 6 corresponding to the lo-' exceedance probability is shown in table 4. These values are used to illustrate the application of the statistical data in handling qualities analyses.
An example of statistical data used in determining longitudinal handling qualities is shown in figure 8. In this figure, the maximum pitch acceleration available in the ap- proach (ref. 12) is presented for several airplanes. Included are the probability values for the pitch acceleration of the XB-70 for the climbout, approach, and the final approach and landing regions. The XB-70 data show the expected trend with flight region. The climbout region has the lowest pitch acceleration values because the task is less demanding and because the higher weight and inertia reduce the airplane responses, es - pecially to turbulence. The approach and final approach and landing regions have a lower weight and inertia (about half that for the climbout) and show higher values of pitch accel- eration. The final approach and landing region shows the highest value of pitch accelera- tion, probably because the task is the most demanding. A comparison of the three regions shows that the requirements for pitch acceleration are influenced by the task and the airplane inertia and gust response characteristics. An allowance for these factors should be made in extrapolating pitch acceleration values for different airplane configurations or when attempting to establish a general criterion. The maximum pitch acceleration capa- bility of the airplanes shown is greater than the probability values, which is to be expected because this should represent the 6 . 5 pilot rating boundary.
An example of the use of statistical data for roll mode criteria is shown in figure 9. In this figure, the lines of constant roll rate and roll acceleration that correspond to a
probability for the various flight regions are superimposed on the roll mode cri- terion of reference 13. The data for regions 1 to 5 have similar values of roll rate, although the supersonic climb region has about half the value of roll acceleration of the other regions. The approach and the final approach and landing regions have about twice the roll acceleration of the other regions. These data indicate that for a supersonic cruise airplane like the XB-70 the 6 . 5 pilot rating boundary of this criterion (which was developed for the cruise condition) would be essentially adequate for regions 1 to 5 but too low for regions 6 and 7 .
Further information on roll performance is presented in the aileron exceedance curves. Aileron position (fig. 5(m)) shows high values of occurrences for the 1" to 3" levels in the supersonic climb and cruise regions (regions 3 and 4). The approach
8
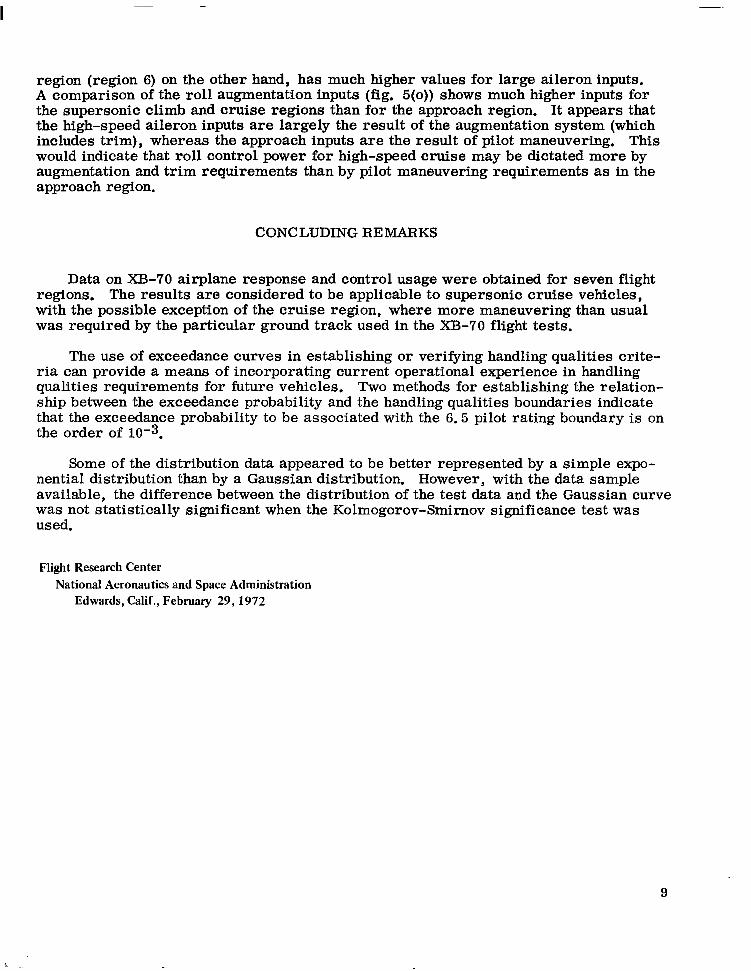
region (region 6) on the other hand, has much higher values for large aileron inputs. A comparison of the roll augmentation inputs (fig. 5(0) ) shows much higher inputs for the supersonic climb and cruise regions than for the approach region. It appears that the high-speed aileron inputs are largely the result of the augmentation system (which includes trim), whereas the approach inputs are the result of pilot maneuvering. This would indicate that roll control power for high-speed cruise may be dictated more by augmentation and trim requirements than by pilot maneuvering requirements as in the approach region.
CONCLUDING REMARKS
Data on XB-70 airplane response and control usage were obtained for seven flight regions. The results are considered to be applicable to supersonic cruise vehicles, with the possible exception of the cruise region, where more maneuvering than usual was required by the particular ground track used in the XB-70 flight tests.
The use of exceedance curves in establishing or verifying handling qualities crite- ria can provide a means of incorporating current operational experience in handling qualities requirements for future vehicles. Two methods for establishing the relation- ship between the exceedance probability and the handling qualities boundaries indicate that the exceedance probability to be associated with the 6.5 pilot rating boundary is on the order of 10-3.
Some of the distribution data appeared to be better represented by a simple expo- nential distribution than by a Gaussian distribution. However, with the data sample available, the difference between the distribution of the test data and the Gaussian curve was not statistically significant when the Kolmogorov-Smirnov significance test was used.
Flight Research Center National Aeronautics and Space Administration
Edwards, Calif., February 29,1972
9

REFERENCES
1.
2.
3.
4.
5.
6.
7.
8.
9.
10.
11.
12.
13.
14.
Mayer, John P. ; Hamer, Harold A. ; and HUSS, Carl R. : A Study of the Use of Con- trols and the Resulting Airplane Response During Service Training Operations of Four Jet Fighter Airplanes. NACA RM L53L28, 1954.
Hamer, Harold A. ; Mayer, John P. ; and Case, Donald I3. : Time-History Data of Maneuvers Performed by a Republic F-84F Airplane During Squadron Operational Training. NACA R M L57E17, 1957.
Pembo, Chris; and Matranga, Gene J. : Control Deflections, Airplane Response, and Tail Loads Measured on an F-100A Airplane in Service Operational Flying. NACA RM H58C26, 1958.
Matranga, Gene J. : Roll Utilization of an F-100A Airplane During Service Opera- tional Flying. NASA Memo 12-1-58H, 1959.
Mechtly, E. A. : The International System of Units - Physical Constants and Conver- sion Factors. NASA SP-7012, 1969.
Andrews, William H. : Summary of Preliminary Data Derived From the XB-70 A i r - planes. NASA TM X-1240, 1966.
Wolowicz, Chester H. ; Strutz, Larry W. ; Gilyard, Glenn B. ; and Matheny, Neil W. : Preliminary Flight Evaluation of the Stability and Control Derivatives and Dynamic Characteristics of the Unaugmented XB-70-1 Airplane Including Comparisons With Predictions. NASA TN D-4578, 1968.
Dutton, John A. ; and Thompson, Gary J. : Probabilistic Determination of Aircraft Response to Turbulence at Low Altitudes. Tech. Rep. ASD-TR-68-39, Aero. Systems Div. , Wright-Patterson A i r Force Base, Ohio, 1968.
Massey, Frank J. , Jr. : The Kolmogorov-Smirnov Test for Goodness of Fit, Am. Statistical Assoc. J., vol. 46, 1951, pp. 68-78.
Bisgood, P. L. : A Review of Recent Handling Qualities Research, and Its Applica- tion to the Handling Problems of Large Aircraft. Royal Aircraft Establishment Rep. No. TN Aero 2688, Brit. R. A. E., June 1964.
Anon. : Flying Qualities of Piloted Airplanes. Military Specification MIL-F-8785B (ASG), Aug. 7, 1969.
Berry, Donald T. ; and Powers, Bruce G. : Flying Qualities of a Large, Supersonic Aircraft in Cruise and Landing Approach. AIAA Paper No. 70-566, May 1970.
Holleman, Euclid C. : Flight Investigation of the Roll Requirements for Transport Airplanes in Cruising Flight. NASA TN D-5957, 1970.
10
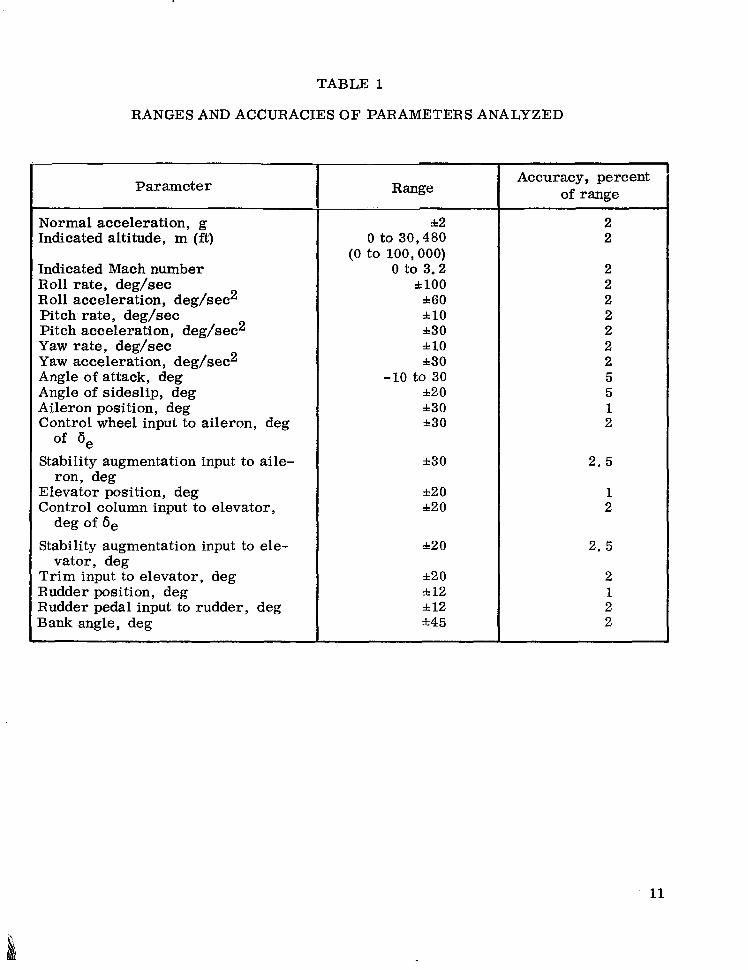
TABLE 1
RANGES AND ACCURACIES O F PARAMETERS ANALYZED
Parameter
Normal acceleration, g Indicated altitude, m (ft)
Indicated Mach number Roll rate, deg/sec Roll acceleration, deg/sec2 Pitch. rate, deg/sec Pitch acceleration, deg/sec2 Yaw rate, deg/sec Yaw acceleration, deg/sec2 Angle of attack, deg Angle of sideslip, deg Aileron position, deg Control wheel input to aileron, deg
Stability augmentation input to aile-
Elevator position, deg Control column input to elevator,
of 6,
ron, deg
deg of 6, Stability augmentation input to ele-
Trim input to elevator, deg Rudder position, deg Rudder pedal input to rudder, deg Bank angle, deg
vator, deg
Range ~ _ _ ~ ~~ "_
322 0 to 30,480
(0 to 100,000) 0 to 3.2
*loo A 6 0 f 10 +30 =I! 10 130
-10 to 30 120 430 130
*30
*2 0 120
+2 0
*2 0 Zk 12 i 12 *45
Accuracy, percent of range
2 2
2 2 2 2 2 2 2 5 5 1 2
2. 5
1 2
2. 5
2 1 2 2
11

C O N T R O L L A B L E
4PABLE OF BEING INTROLLED OR 4NAGED I N CONTEX F M I S S I O N , WITH YA I LABLE P I LOT TTENTION
I-
A C C E P T A B L E
Y A Y HAVE DEFICIENCIES WHICH WARRANT IMPROVEMENT, BUT ADEQUATE FOR M I S S ION.
PILOT COMPENSATION, I F REQUIRE0 TO ACHIEVE ACCEPTABLE PERFORMANCE, IS FEASIBLE.
U N A C C E P T A B L E
I E F I C I E N C I E S WHICH tEQUl RE MANDATORY IMPROVEMENT. INADEQUATE PERFORMANCE FOR M I S S I O N EVEN WITH MAXIMUM FEASIBLE PILOT COMPENSATION.
TABLE 2
PILOT RATING SCALE
[ref, 141
S A T I S F A C T O R Y
IEETS ALL REQUIREMENTS \ND EXPECTATIONS, GOOD iNOUGH WITHOUT IMPROVEMENT
:LEARLY ADEQUATE FOR YISSION.
U N S A T I S F A C T O R Y
RELUCTANTLY ACCEPTABLE DEFICIENCIES WHICH WARRANT IMPROVEMENT. PERFORMANCE ADEQUATE FOR MISSION WITH FEASIBLE P I LOT COMPENSATION.
U N C O N T R O L L A B L E
CONTROL WILL BE LOST DURING SOME PORTION OF MISSION. 1
EXCELLENT, HIGHLY DESIRABLE A I
GOOD, PLEASANT, WELL BEHAVED A2
FAIR. SOME MILDLY UNPLEASANT CHARACTERISTICS. GOOD ENOUGH FOR MISSION WITHOUT IMPROVEMENT.
A3
""""I
SOME MINOR BUT ANNOYING DEFICIENCIES. IMPROVEMENT IS REQUESTED. AQ
EFFECT ON PERFORMANCE I S EASILY COMPENSATED FOR BY PILOT.
WDERATELY OBJECTIONABLE DEFICIENCIES. IMPROVEMENT IS NEEDED. REASONABLE PERFORMANCE REQUl RES CONS I DERABLE P I LOT COMPENSATION.
VERY OBJECTIONABLE DEFICIENCIES. MAJOR IMPROVEMENTS ARE NEEDED. REQUIRES BEST AVAILABLE PILOT COMPENSATION TO ACHIEVE A6 ACCEPTABLE PERFORMANCE.
MAJOR DEFICIENCIES WHICH REQUIRE MANDATORY IMPROVEMENT FOR ACCEPTANCE. CONTROLLABLE. PERFORMANCE INADEQUATE FOR MISSION, OR PILOT COMPENSATION REQUIRE0 FOR MINIMUM ACCEPTABLE PERFORMANCE IN MISSION IS TOO HIGH.
""""
u7
CONTROLLABLE WITH DIFFICULTY. REQUIRES SUBSTANTIAL PILOT SKILL AND ATTENTION TO RETAIN CONTROL AND CONTINUE MISSION.
u8
1 MARGINALLY CONTROLLABLE I N MISSION. REQUIRES MAXIMUM AVAILABLE P I L O T S K I L L AND LTTENTION TO RETAIN CONTROL.
UNCONTROLLABLE I N M I S S I O N . I 10 1

I
TABLE 3
SYSTEM FAILURE PROBABILITIES FOR HANDLING QUALITIES LEVELS
[ref. 111
Extremely remote. prob- -ability of a basic airframe
failure (usually on the or- der of 10-7 to 10-9)
Pilot rating of 10
TABLE 4
RESPONSES O F THE XB-70 AIRPLANE CORRESPON2ING TO THE PROBABILITY O F EXCEEDANCE O F 10-
Parameter
p, deg/sec by deg/sec q , deg/sec 9. deg/sec 2 r . deg/sec Sy deg/sec 2
2
_____~_ ~
1
3. 0 4. 8
2
1. 1 1. 8 5. 1 7. 8
1. 0 1. 6 1.4 3.3 2. 1 2. 9
Region I 13
31 i (105 ft)
\
I m-
56.62 m (185.75 ft)
9.14 m 00 ft)
Figure 1. - Three-view drawing of the XB-70 airplane,
h
Region 1 Climbout
Region 2 Transonic
acceleration
4 M = 0.9
Region 3
Letdown Cruise Supersonic Region 5 Region 4
M = 1.4 \ \
Gear and 1 flaps down
Region 6 Approach
\
/
Ti me
- Region 7 Final approach
and landing
Figure 2. - XB-70 flight profile and flight regions.

h, ft 0
lo r r Percent of
occurrence of entire flight 5L L
0 1 2 3 0 5 10 15 20 xld M h, m
(a) Climbout. h, ft
0 25 50 75 xld
Percent of occurrence of entire flight
10 l5 c r
5k 0 1 2 3 0 LL 5 10 15 20 xld
M h, m
(b) Transonic acceleration. h, ft
0 25 50 ';5 x I d I
Percent of r r occurrence of entire flight
0 I 3 1 I 1 W 2 b x l d M h, m
(c) Supersonic climb. h, ft
0 25 50 75 xld
Percent of
entire flight Occurrence of 5
0 1 2 M
(d) Cruise.
Figure 3. - Histograms of Mach number and altitude for the XB-70 airplane,
16

O h, ft
17
100
10-
P r o b bi I ity 10-
lo-,
10"
100
10-1
Probability 10-2
10-3
-0" Measured probability curve
Gaussian distribution ""
-6 -3 0 3 6 9 12 15 18 21 0. deg
'i \ \
(a) Pitch angle.
\ \ \ \ \
-
\ \
1 \ 1 1 J .4 .8 1.2 1.6 2.0 2.4
I q 1, deglsec
\ I \ ,
I I I 0 . 8 1.6 2.4 3.2 4.0 I 1, deglsec2
(c) Pitch angular acceleration.
\ \
I I I I I I I L -2 0 2 4 6 8 10 12 14
4 deg
(b) Pitch angular rate. (d) Angle of attack.
Figure 4. Exceedance curves for cumulation of regions 1 to 6.
18
-0- Measured probability curve
"" Gaussian distribution
10-1 -
Probability lom2 -
10-3 -
10-4 .5 . 7 . 9 1.1 1.3 1.5 1.7
a,, 9
100
10-1
Probability 10-2
10-3
Normal acceleration.
0, I \ \ \
\
i \ \ \ \ \ \ \
4 L - lo- -5 0 5 10 15 20 25
6, deg
( f ) Elevator position.
-5 0 5 10 15 20 6 , deg of 6,
eP (g) Control column input to elevator.
0 5 10 15 20 25 6 9 deg
(h) Trim input to elevator.
Figure 4. Continued.
19

+ Measured probability curve
"" Gaussian distribution
Probability
b e s A q d q
(i) Stability augmentation input to elevator.
Probability
IPI, deg
(j) Bank angle.
0 2 4 6 8 1 0 I P 1, deglsec
(k) Roll rate.
0 2 4 6 8 1 0 I p 1, deglsec2
(1) Roll acceleration.
Figure 4. Continued.
20

Probability
100
10-1
Probability 10-2
t
u Measured probability curve
- "- Gaussian distribution
(m) Aileron position. -
\
(0) Stability augmentation input to aileron.
t
(n) Control wheel input to aileron (p) Sideslip angle.
Figure 4. Continued.
21
t
+ Measured probability curve
"" Gaussian distribution
P robabi I ity
100
10-1
\ \ \ \
10-4 0 1 2 3 4
loo
10-1
Probability
10-4
I r 1, deglsec
(9) Yaw rate.
\ \ \ \ -
0 .5 1.0 1.5 2.0 2.5 i, deglsec2
\ - 0 1 2 3 4 5
p t - 1 1
(s) Rudder position. -
0 1 2 3 4 5
(r) Yaw acceleration. (t) Control pedal input to rudder.
Figure 4. Concluded.
22

100
10-1
Probability lo-'
10-3
-10 -5 0 5 10 15
emede df% o Climbout 10.9 0 Transonic acceleration 4.8 0 Supersonic climb 6.4 A Cruise 3.7 v Letdown 1.4 a Approach 5.6
(a) Pitch angle,
o Climbout 0 Transonic acceleration 0 Supersonic climb A Cruise v Letdown a Approach
Probability
(b) Pitch angular rate.
Figure 5. Exceedance curves for the six flight regions.
23

lo0
10-1
Probability 10-2
10-3
10-4 4 .4 .8 1.2 1.6 2.0 2.4
100
10-1
Probability 10-2
10-3
0 Climbout Transonic acceleration
0 Supersonic climb A Cruise v Letdown a Approach
1 ;I 1, deglsec'
(c) Pitch angular acceleration.
10-4 L -12 -8 -4 0 4 8
amed, deg 0 Climbout 6.5 0 Transonic acceleration 4.0 0 Supersonic climb 3.3 A Cruise 4.2 v Letdown 4.3 a Approach 7.3
(d) Angle of attack.
Figure 5. Continued.
24
I -
Probability
loo -
10-1 -
10-2 -
10-3 -
0 Climbout 0 Transonic acceleration 0 Supersonic climb A Cruise v Letdown a Approach
10-4 .5 . 7 .9 1.1 1.3 1.5 an, 9
(e) Normal acceleration.
100
10-1
Probability lo-*
10-3
hemed' deg 0 Climbout 7.2 0 Transonic acceleration 9.0 0 Supersonic climb 6.4 A Cruise 3.7 v Letdown 4.9 a Approach 10.6
10-4 L -15 -10 -5 0 5 10 I
(f) Elevator position.
Figure 5. Continued.
25
100
10-1
Probability
10-3
10-4 L -15
100
10-1
Probability lo-* 1
0 Climbout 6.9 0 Transonic acceleration 8.6 0 Supersonic cl imb 6.9 A Cru ise 3.4 v Letdown 4 . 3 a Approach 8.2
III -10 -5 0 5 10 15
(g) Control column input to elevator.
10-4 Irluu -15 -10 6 -5 - 6 0 5 10 15
et ( q)med dq
0 Climbout a. 2 Transonic acceleration 9.9
0 Supersonic cl imb 8.6 A Cru ise 3.9 v Letdown 5.2 a Approach 8.6
(h) Trim input to elevator.
Figure 5. Continued.
26

100
10-1
Probability
10-3
10-4 -15 -10 -5 0 5 10 15
0 Climbout 9.0 0 Transonic acceleration 7.3 0 Supersonic climb 6.9 A Cru ise 11.2 v Letdown 9.9 a Approach 10.7
(i) Stability augmentation input to elevator.
0 Climbout 0 Transonic acceleration 0 Supersonic climb A Cru ise v Letdown a Approach
10 20 30 40 50 I$ deg
(j) Bank angle.
Figure 5. Continued.
27

100
10-1
Probability 10-2
0 Climbout 0 Transonic acceleration 0 Supersonic climb A Cruise v Letdown a Approach
(k) Roll rate.
loo
10-1
Probability lo-'
t u 0 1 2 3 4 5
lpl , deglsec'
(1) Roll acceleration.
0 Climbout 0 Transonic acceleration 0 Supersonic climb A Cruise v Letdown a Approach ,
Figure 5. Continued.
28

Probability
100
10-1
10-2
10-3
0 2 4 6 8 1 0 1 4 3 1 ~ deg
(m) Aileron position.
0 Climbout 0 Transonic acceleration 0 Supersonic climb A Cruise v Letdown a Approach
0 Climbout 0 Transonic acceleration 0 Supersonic climb A Cruise v Letdown a Approach
0 2 4 6 8
(n) Control wheel input to aileron.
Figure 5. Continued.
29
0 Climbout 0 Transonic acceleration 0 Supersonic cl imb A Cru ise v Letdown a Approach
loo
10-1
Probability lo-*
10-3
10-4 0 1 2 3 4 5
IGSAS 1 ' deg
(0) Stability augmentation input to aileron.
Probability
100
10-1
10-2
10-4 10-3L 0 2 4 6 8
0 0
0 A V a
Climbout Transonic acceleration Supersonic climb Cru ise Letdown Approach
(p) Sideslip angle.
Figure 5. Continued.
30

100
10-1
Probability
b
u 1 2 3 4
I r I , deglsec
(9) Yaw rate.
100
10-1
Probability
0 Climbout 0 Transonic acceleration 0 Supersonic cl imb A Cru ise v Letdown Q Approach
10-4 L 1 2 3 4
I ; I , deglsec2
(r) Yaw acceleration.
0 Climbout 0 Transonic acceleration 0 Supersonic climb A Cru ise v Letdown a Approach
Figure 5. Continued,
31

100
10-1
Probability lo-'
10-4 0 1 2 3 4 L (s) Rudder position.
100
10-1
Probability lo-'
0 Climbout 0 Transonic acceleration 0 Supersonic climb A Cruise P Letdown a Approach
i 1 2 3 4
(t) Control pedal input to rudder,
0 Climbout 0 Transonic acceleration 0 Supersonic climb A Cruise v Letdown a Approach
Figure 5. Concluded.
32
Probability
100 -
10-1 -
10-2 -
10-3 -
100
10-1
Probability
I P - 1 4 8 1 2
8, deg
(a) Pitch angle.
3.2
0 2 4 6 8 1 4 1, deglsec 2
(c) Pitch angular acceleration.
(b) Pitch angular rate. (d) Angle of attack.
Figure 6. Exceedance curves for the final approach.
33

loo
10-1
Probability
I
10-4 .6 .8 1.0 1.2 1.4 1.6
a,, 9
100
10-1
Probability
(e) Normal acceleration.
I
(f) Elevator position.
0 8 16 24 be , deglsec
(g) Elevator rate.
-4 0 4 8 12 16 20 6, , deg of de
P
(h) Control column input to elevator,
Figure 6 . Continued,
34

I b
Probability
10-1
10-2
10-3
0 5 10 15 20 25
100 '
10-1
Probability lo-'
10-3
t
/ ' P I # deg
(i) Bank angle.
Figure 6. Continued.
0 4 8 12 16 20 1 p I , deg/sec2
(k) Roll acceleration.
0 4 8 12 16 I da I ' deg
(1) Aileron position.
35

Probability
100
10-1
Probability IO-’
10-3
4 8 12 16
(n) Control wheel input to aileron.
(0) Sideslip angle.
0 .8 1.6 2.4 3.2 4 . 0 I r I , deglsec
(p) Yaw rate.
Figure 6. Continued,
36

100
10-1
Probability
10-3
100
10-1
Probability lom2
10-3
1 2 3 4 I i 1, deglsec2
Yaw acceleration.
b
16rl* d q
(r) Rudder position.
4 8 12 16 I b, 1, deglsec
(9) Rudder rate.
I I I I I I 0 2 4 6 8 1 0 1 2
(t) Control pedal input to rudder.
Figure 6. Concluded.
37
40
30
Percent
mcurrence of 20
10
r -25 25 50
Figure 7. Histogram of bank angle for the cruise region.
38
Values of q for lo3 probability
Norma I acceleration change due
to elevator, g
‘ 2 L# Clirnbout Approach Final approach and landing I XB-70
0
O I//////////// 0 727-200 7200
CV -990 -. 2 -
-.4 -
-. 6 .
-.a 0 , 5 10 15 20 25
Pitch acceleration due to elevator, deglsec2
Figure 8. Comparison of the XB-70 responses with the maximum values available for the XB-70 and several subsonic jet transports.
39

4
1
Rol I
radlsecz acceleration, - 4
. l
0 Fl ight region "- Pi!ot rat ing of 3.5 (ref. 13) "- Pilot rat ing of 6.5 (ref. 13)
\ \ \ \ \ \ \ \
I I
\ \ \,
\ \ \ \
ROII rate,\ deglsec\
- 7x \ \
14.0
-
\
. 4 1 4 10
Roll mode time constant, sec
Figure 9. Comparison of the XB-70 roll rate and roll acceleration responses for the probability of exceedance with the roll criterion of reference 13.
40 NASA-Langley, 1972 - 2 H-663
N A T I O N A L A E R O N A U T I C S A N D S P A C E A D M I S T R A T I O N W A S H I N G T O N , D . C . 20546
POSTAGE AND FEES PAID
NATIONAL AERONAUTICS AND
SPACE ADMINISTRATION O F F I C I A L B U S I N E S S PENALTY FOR PRIVATE USE 1300
FIRST CLASS MAIL - NASA 451
015 001 Cl U 02 720630 SOO903DS OEPT OF THE A I R FORCE AF WEAPONS LA6 {AFSCI TECH LIBRARY/WLOL/
KIRTLAND AFB NM 87117 ATTN: E LOU 6OWMANq"CHIEF
If Undeliverable (Section 158 Portal Manual) Do Not Return
NASA
"The aeronatltical and space activities of the United States shall be conducted so as I O contribute . . . t o the expansion of hunzan knowl- edge of phefaontena i n the atmosphere and space. The Administration shall provide f o r the widest prncticable and appropriate dissemninarion of inforntation concerning its actizdies and the resdts thereof."
--NATIONAL AERONAUTICS AND SPACE ACT OF 1958
SCIENTIFIC' AND TECHNICAL PUBLICATIONS
TECHNICAL REPORTS: Scientific and technical information considered important, complete, and a lasting contribution to existing knowledge.
TECHNICAL NOTES: 1nformation.less broad in scope but nevertheless of importance as a contribution to existing knowledge.
TECHNICAL MEMORANDUMS: Information receiving limited distribution because of preliminary data, security classifica- tion, or other reasons.
CONTRACTOR REPORTS: Scientific and technical information generated under a NASA contract or grant and considered an important contribution to existing knowledge.
TECHNICAL TRANSLATIONS: Information published in a foreign language considered to merit NASA distribution in English.
SPECIAL PUBLICATIONS: Information derived from or of value to NASA activities. Publications include conference proceedings, monographs, data compilations, handbooks, sourcebooks, and special bibliographies.
TECHNOLOGY UTILIZATION PUBLICATIONS: Information on technology used by NASA that may be of particular interest in commercial and other non-aerospace applications. Publications include Tech Briefs, Technology Utilization Reports and Technology Surveys.
Details on the availability of these publications may be obtained from:
SCIENTIFIC AND TECHNICAL INFORMATION OFFICE
NATIONAL AERONAUTICS AND SPACE ADMINISTRATION Washington, D.C. 90546