Statistical Report 2012 Q4 - sio.gov.bh Report 2012Q4.pdf · Statistical Report 2012 - Quarter 4...
42
Th Statistical R eport 2012 Quarter 4 Civil & Private Sector Social Insurance Organization Kingdom of Bahrain
-
Upload
truongdien -
Category
Documents
-
view
215 -
download
0
Transcript of Statistical Report 2012 Q4 - sio.gov.bh Report 2012Q4.pdf · Statistical Report 2012 - Quarter 4...

The Social Insurance Organiz
Statistical Report 2012 Quarter 4
Civil & Private Sector
Social Insurance Organization
Kingdom of Bahrain

Statistical Report 2012 - Quarter 4
Page 2 of 42
Page
No. Table of Contents
3Summary Table
4Chapter 1 : Civil Sector
5Section 1: Contributors Statistics
11Section 2: Pensioners Statistics
317Section : Beneficiaries Statistics
22Chapter 2 : Private Sector
23Section 1: Contributors Statistics
30Section 2: Pensioners Statistics
336Section : Beneficiaries Statistics
41 Terms of reference

Statistical Report 2012 - Quarter 4
Page 3 of 42
CP0)Table Total Summary
Total Number of Employees Subject to the Provision of Law, Pensioners
and Beneficiaries as at Q4
2012
Civil & Private Sector
Civil Sector Private Sector Total Item
52,730
491,866
544,596
1. No. Contributors
52,730
83,492
136,222
1.1 Bah
408,374
408,374
1.2 Non-Bah
14,343
14,608
28,951
2. No. Alive Pensioners
3,660
4,112
7,772
3. No. Deceased Pensioners
7,188
7,382
14,570
4. No. of Beneficiaries

Statistical Report 2012 - Quarter 4
Page 4 of 42
Chapter 1 : Civil Sector

Statistical Report 2012 - Quarter 4
Page 5 of 42
Contents
Table No Title
Page No
C1
Contributors Data
5
C1.1
No of Employees by sex and Nationality 6
C1.2
Total & Average Monthly Salary of Employees by sex and Nationality 7
C1.3
No of Employees Classified by Age Group 8
C1.4
Average Monthly Salary of Employees Classified by Age Group 9
C1.5
No of Employees Classified By Monthly Salary 10
Section C1 Contributors' Statistics in the Civil Sector

Statistical Report 2012 - Quarter 4
Page 6 of 42
C1.1Table
Number of Employees Subject to the Provision of Law Classified According to Gender and
Nationality during 2008- Q4
2012
SectorCivil
Bahraini
Year Male Female Total GR
2008 30,486 21,432 51,918 NA
2009 30,446 22,077 52,523 1%
2010 29,264 22,332 51,596 -2%
2011 27,429 22,158 49,587 -3.9%
Quarter
Q1 27,259 22,270 49,529 -0.1%
Q2 27,892 24,545 52,437 5.7%
Q3 27,888 24,535 52,423 5.7%
Q4 28,044 24,686 52,730 6.3%
Note
Data of previous years was updated.

Statistical Report 2012 - Quarter 4
Page 7 of 42
C1.2Table
Total & Average Monthly Salary of Employees Subject to the Provision of Law Classified
According to Sex and Nationality during 2007- Q4
2012
SectorCivil
Bahraini
Total Monthly Salary
Average Monthly Salary
M F
M F
Year Male Female Total GR Male Female Total GR
2008 19,440,092
13,955,913
33,396,005
NA 638 651 643 NA 2009 20,007,923
14,902,538
34,910,461
5% 657 675 665 3% 2010 19,732,023
15,337,239
35,069,261
0.5% 674 687 680 2% 2011 21,177,320
17,314,070
38,491,389
10% 772 781 776 14% Quarter
Q1 21,024,870
17,533,491
38,558,361
0% 771 787 779 0.3% Q2 21,448,948
18,580,565
40,061,868
4% 769 757 764 -2% Q3 21,448,185
18,573,005
40,021,190
4% 769 757 763 -2% Q4 21,596,909
18,683,799
40,280,708
5% 770 757 764 -2%
Note
The growth rate in the average salary for Bahrainis Employees has reached 14% in 2011 due to the 15% approximate general increase in all government employees salary.

Statistical Report 2012 - Quarter 4
Page 8 of 42
C1.3Table
Number of Employees Subject to the Provision Of Law Classified by Age group, Sex &
Nationality as at Q4
2012
Civil Sector
Bahraini /
Age Group Male Female Total
%
< 20 81
36
117
0.2%
20-24 1,584
1,777
3,361
6%
25-29 3,459
4,438
7,897
15%
30-34 4,061
5,180
9,241
18%
35-39 4,274
4,487
8,761
17%
40-44 4,061
3,230
7,291
14%
45-49 4,534
2,715
7,249
14%
50-54 3,564
1,919
5,483
10%
55-59 1,821
748
2,569
5%
60-64 534
148
682
1%
65+ 71
8
79
0.1%
/Total 28,044
24,686
52,730
100%
Note
30-44 485149
3,3306
Age wise employees between 30-44 years constitute 48% of total employees, females represent 51% and males 49% at Q4 2012.
Number of employees with age 55 years and above equals to 3,330 and they constitute 6% of total employees. Those are entitled for a retirement pension in the event of ending their services subject to existence of years of service condition.

Statistical Report 2012 - Quarter 4
Page 9 of 42
C1.4Table
Average Monthly Salary of Bahraini Civil Servant Subject to the Provision Of Law
Classified by Age group, Sex & Nationality as at Q4
2012
Civil Sector
Average Monthly Salary
Bahraini
Age Group
Male Female Total
<20 355
357
355
20-24 418
429
423
25-29 529
565
550
30-34 626
679
656
35-39 710
781
747
40-44 783
888
829
45-49 866
954
899
50-54 977
1,016
991
55-59 1,126
1,041
1,101
60-64 1,369
1,191
1,331
65+ 1,795
1,633
1,778
/Total 770
757
764
Note
)
The highest average monthly salary for Bahrainis (1,778 BD) is in the age group 65+.

Statistical Report 2012 - Quarter 4
Page 10 of 42
C1.5Table
Number of Civil Servant Subject to the provision of Law Classified According to Monthly
Salary as at Q4
2012
Civil Sector
Number of Employee
Bahraini
Monthly Basic Salary Male Female Total %
<200 8
3
11
0.02%
200-400 4,116
2,688
6,804
12.90%
400-600 9,191
6,681
15,872
30.10%
600-800 6,012
6,713
12,725
24.13%
800-1000 3,581
3,950
7,531
14.28%
1000-1200 1,735
2,398
4,133
7.84%
1200-1400 1,035
1,017
2,052
3.89%
1400-1600 558
451
1,009
1.91%
1600-1800 454
287
741
1.41%
1800-2000 354
184
538
1.02%
2000-2200 261
140
401
0.76%
2200-2400 191
68
259
0.49%
2400-2600 118
21
139
0.26%
2600-2800 107
32
139
0.26%
2800-3000 58
19
77
0.15%
3000-3200 61
10
71
0.13%
3200-3400 65
8
73
0.14%
3400-3600 30
30
0.06%
3600-3800 21
2
23
0.04%
3800-4000 24
2
26
0.05%
>4000 64
12
76
0.14%
Total 28,044
24,686
52,730
100%
Note
304258
30% of total employees average salaries between 600-400 BD, female constitute 42% and male 58% of them at the end of Q4 2012.

Statistical Report 2012 - Quarter 4
Page 11 of 42
Section C
Pensioners Statistics in the Civil Sector
Contents
Table No Title
Page No
C2
Live Pensioners Data
11
C2.1
Number of Alive Pensioners & Dead Pensioners by Gender 12
C2.2
Total & Average Monthly Pension of Alive and Dead Pensioners by Gender
13
C2.3
Number of Alive Pensioners & Average Monthly Pension by Age Group
15
C2.4
Number of Alive Pensioners by Monthly Pension 16

Statistical Report 2012 - Quarter 4
Page 12 of 42
C2.1Table
Number of Bahraini Alive Pensioners & Dead Pensioners by Gender as at Q4
2012
SectorCivil
Number of AlivePensioners Number of Dead Pensioners
M F
M F
Year Male Female Total GR Male Female Total GR
Grand Total
2009 7,993
2,979
10,972
NA 2,840
265
3,105
NA 14,077
2010 8,805
3,508
12,313
12% 3,000
281
3,281
6% 15,594
2011 9,302
3,862
13,164
7% 3,152
299
3,451
5% 16,615
Quarter
Q1 9,451
4,039
13,490
2% 3,191
300
3,491
1% 16,981
Q2 9,646
4,162
13,808
5% 3,257
310
3,567
3% 17,375
Q3 9,790
4,226
14,016
6% 3,290
314
3,604
4% 17,620
Q4 9,952
4,391
14,343
9% 3,337
323
3,660
6% 18,003

Statistical Report 2012 - Quarter 4
Page 13 of 42
C2.2Table
Total & Average Monthly Pension of Bahraini Alive and Dead Pensioners by Gender as at Q4 2012
Civil Sector
Total Monthly Pension
Alive Pensioners Dead Pensioners
M F
M F
Year Male Female Total GR Male Female Total GR
Grand Total
2009 4,338,173
1,564,638
5,902,810
NA 829,280
75,260
904,540
NA 6,807,350
2010 5,044,944
1,949,518
6,994,463
18% 921,000
82,895
1,003,895
11% 7,998,358
2011 5,607,571
2,259,296
7,866,867
12% 1,011,792
89,102
1,100,894
10% 8,967,761
Quarter
Q1 5,892,122
2,445,558
8,337,679
6% 1,059,412
93,600
1,153,012
5% 9,490,691
Q2
6,034,895
2,525,522
8,560,417
9% 1,094,352
96,410
1,190,762
8% 9,751,179
Q3
6,145,937
2,562,910
8,708,847
11% 1,177,582
101,895
1,279,477
16% 9,988,324
Q4
6,301,281
2,705,857
9,007,138
14% 1,194,862
108,644
1,303,505
18% 10,310,644
Average Monthly Pension
Alive Pensioners Dead Pensioners
M F
M F
Year Male Female Average GR Male Female Average GR
Grand Total
2009 543
525
538
NA 292
284
291
NA 484
2010 573
556
568
6% 307
295
306
5% 513
2011 603
585
598
5% 321
298
319
4% 540
Quarter
Q1 623
605
618
3% 332
312
330
3.4% 559
Q2
626
607
620
4% 336
311
334
4.7% 561
Q3628
606
621
4% 358
325
355
11.3% 567
Q4
633
616
628
5% 358
336
356
11.6% 573
Note
Minimum pension increased to 200 in Aug 2011.

Statistical Report 2012 - Quarter 4
Page 14 of 42
C2.2Cont. Table

Statistical Report 2012 - Quarter 4
Page 15 of 42
C2.3Table
Number of Alive Pensioners & Average Monthly Pension Classified by Age group
& Sex as at Q4
2012
SectorCivil
Number of Alive Pensioners
Average Monthly Pension
Age Group
Male Female Total % Male Female Total
25-29 8
2
10
0.07%
207
189
203
30-34 29
6
35
0.2% 225
258
231
35-39 121
19
140
1% 237
271
241
40-44 372
117
489
3% 303
395
325
45-49 794
461
1,255
9% 373
457
404
50-54 1,136
866
2,002
14% 505
508
506
55-59 1,992
1,372
3,364
23% 767
718
747
60-64 2,116
872
2,988
21% 751
705
738
65-69 1,503
392
1,895
13% 720
656
707
70-74 1,103
186
1,289
9% 610
528
598
75-79 438
58
496
3% 535
472
527
80-84 233
29
262
2% 539
478
532
85 + 107
11
118
1% 477
487
478
/Total 9,952
4,391
14,343
100%
633
616
628
Note
The highest number of pensioner ( ,364) is in the age group 55-59, females represent 41% and males 59% of them at Q4 2012.

Statistical Report 2012 - Quarter 4
Page 16 of 42
C2.4Table
Number of alive Pensioners Classified According to the Monthly Pension
as at Q4
2012
SectorCivil
Number
Monthly Pension Male Female Total %
150-300 2,978
996
3,974
28%
300-450 1,706
653
2,359
16%
450-600 1,393
901
2,294
16%
600-750 953
557
1,510
11%
750-900 712
360
1,072
7%
900-1050 827
339
1,166
8%
1050-1200 417
284
701
5%
1200-1350 301
161
462
3%
1350-1500 149
51
200
1%
1500-1650 96
36
132
1%
1650-1800 80
15
95
1%
1800-1950 67
13
80
1%
1950-2100 66
10
76
0.53%
2100-2250 44
3
47
0.33%
2250-2400 44
4
48
0.33%
2400-2550 23
1
24
0.17%
2550-2700 26
3
29
0.20%
2700-2850 15
1
16
0.11%
2850-3000 6
1
7
0.05%
>3000 49
2
51
0.36%
Total 9,952
4,391
14,343
100%
Note
2 % of total alive pensioners average pension is between 150-300 BD, female constitute 2 % and male % of them at the end of Q4 2012.

Statistical Report 2012 - Quarter 4
Page 17 of 42
Section C 3 Beneficiaries Statistics in the Civil Sector
Contents
Table No Title
Page No
3
Beneficiaries Data
17
C3.1
Number, Total & average Monthly Pension of Beneficiaries by Gender 18
C3.2
Number of Beneficiaries Classified By Age Wise 20
C3.3
Number of Beneficiaries Classified By Monthly Pension 21

Statistical Report 2012 - Quarter 4
Page 18 of 42
C3.1Table
Number of Beneficiaries , Total & Average Monthly Pension by Gender as at Q4
2012
Civil Sector
Number of Beneficiaries
Total Monthly Pension
Year
Male Female Total GR Male Female Total GR
2009 1,365
5,215
6,580
NA 153,434
825,126
978,560
NA
2010 1,327
5,388
6,715
2% 162,752
920,390
1,083,142
11%
2011 1,316
5,629
6,945
3% 196,696
1,207,363
1,404,059
30%
Quarter
Q1 1,271
5,647
6,918
-0.4% 197,167
1,256,817
1,453,984
4%
Q2 1,299
5,736
7,035
1.3% 209,551
1,293,452
1,503,003
7%
Q3 1,297
5,770
7,067
1.8% 211,076
1,306,058
1,517,134
8%
Q4 1,330
5,858
7,188
3.5% 217,685
1,328,063
1,545,748
10%
Average Monthly Pension
Year
Male Female Total GR
2009 112
158
149
NA
2010 123
171
161
8%
2011 149
214
202
25%
Quarter
Q1 155
223
210
4%
Q2 161
225
214
6%
Q3 163
226
215
6%
Q4 164
227
215
6%

Statistical Report 2012 - Quarter 4
Page 19 of 42
C3.1Cont. Table

Statistical Report 2012 - Quarter 4
Page 20 of 42
C3.2Table
Number of Beneficiaries & Average Monthly Pension Classified by Age group & Sex
as at Q4 2012
Civil Sector
Number of Beneficiaries Average MonthlyPension
Age Group Male Female Total
Male Female Total
<25 1,083
1,211
2,294
32% 143
137
140
25-29 37
226
263
4% 251
187
196
30-34 16
204
220
3% 363
215
225
35-39 23
238
261
4% 237
185
190
40-44 12
266
278
4% 138
200
197
45-49 15
445
460
6% 167
213
211
50-54 14
532
546
8% 379
253
256
55-59 19
552
571
8% 428
281
286
60-64 15
504
519
7% 330
306
307
65-69 10
498
508
7% 241
324
322
70-74 25
476
501
7% 304
249
252
75-79 21
335
356
5% 215
243
241
80-84 22
226
248
3% 149
223
217
85 + 18
145
163
2% 133
199
192
Total 1,330
5,858
7,188
100% 164
227
215
Note
The highest number of Beneficiaries (2,294) is in the age group less than 25, females represent 53% and males 47% of them at Q4 2012.

Statistical Report 2012 - Quarter 4
Page 21 of 42
C3.3Table
Number of Beneficiaries and Amount of Pensions Paid Classified According
to the Monthly Pension as at Q4
2012
Civil Sector
Number
Monthly Pension Male Female Total %
<50 162
267
429
6%
50-150 684
1,781
2,465
34%
150-250 251
2,210
2,461
34%
250-350 116
819
935
13%
350-450 36
246
282
4%
450-550 34
210
244
3%
550-650 21
87
108
2%
650-750 6
77
83
1%
750-850 3
43
46
0.6%
850-950 1
34
35
0.5%
950-1050 2
18
20
0.3%
1050-1150 5
9
14
0.2%
1150-1250 2
15
17
0.2%
1250-1350 3
8
11
0.2%
1350-1450 2
9
11
0.2%
1450-1550 3
3
0.0%
>1550 2
22
24
0.3%
Total 1,330
5,858
7,188
100%
Note
692508119
69% of total Beneficiaries average pension is between 50-250 BD, female constitute 81% and male 19% of them at the end of Q4 2012.

Statistical Report 2012 - Quarter 4
Page 22 of 42
Chapter 2 : Private Sector
Statistical Report 2012 - Quarter 4
Page 23 of 42
Contents
Table No Title
Page No
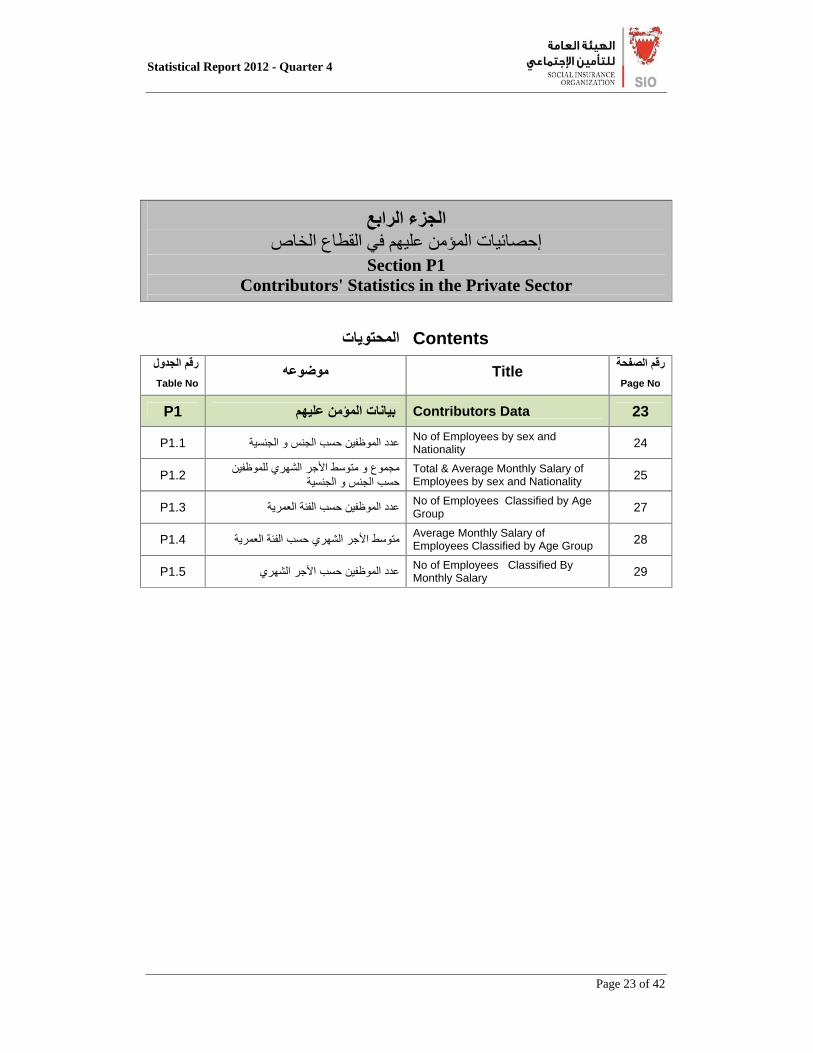
P1
Contributors Data
23
P1.1
No of Employees by sex and Nationality 24
P1.2
Total & Average Monthly Salary of Employees by sex and Nationality 25
P1.3
No of Employees Classified by Age Group 27
P1.4
Average Monthly Salary of Employees Classified by Age Group 28
P1.5
No of Employees Classified By Monthly Salary 29
Section P1 Contributors' Statistics in the Private Sector

Statistical Report 2012 - Quarter 4
Page 24 of 42
P1.1Table
Number of Employees Subject to the Provision of Law Classified According to Gender and
Nationality as at Q4
2012
SectorPrivate
Bahraini Non-Bahraini
Year Male Female Total GR Male Female Total GR Total
2007 52,060 20,026 72,086 NA 293,844
14,516 308,360 NA 380,446
2008 55,903 23,691 79,594 10% 340,632
17,632 358,264 16% 437,858
2009 55,994 24,127 80,121 1% 356,390
19,191 375,581 5% 455,702
2010 57,233 24,647 81,880 2% 348,547
20,792 369,339 -2% 451,219
2011 56,585 24,260 80,845 -1% 349,993
21,953 371,946 1% 452,791
Quarter
Q1 50,683 21,075 71,758 -11% 306,114
18,446 324,560 -13% 396,318
Q2 53,635 22,310 75,945 -6% 332,074
20,409 352,483 -5% 428,428
Q3 56,545 23,770 80,315 -1% 357,945
22,756 380,701 2% 461,016
Q4 58,675 24,817 83,492 3% 383,264
25,110 408,374 10% 491,866

Statistical Report 2012 - Quarter 4
Page 25 of 42
P1.2Table
Total & Average Monthly Salary of Employees Subject to the Provision of Law Classified
According to Sex and Nationality as at Q4
2012
SectorPrivate
Total Monthly Salary
Bahraini Non-Bahraini
Year
Male Female Total GR Male Female Total GR
Grand Total
2007 28,230,574 7,193,783 35,424,357 NA 47,478,544 3,915,101 51,393,646 NA 86,818,003
2008 33,629,177 9,105,419 42,734,596 21% 61,039,058 5,073,796 66,112,854 29% 108,847,450
2009 37,101,273 10,162,780 47,264,053 11% 67,584,633 5,754,535 73,339,168 11% 120,603,221
2010 38,657,481 10,710,165 49,367,646 4% 68,170,540 6,202,725 74,373,265 1% 123,740,912
2011 39,719,036 11,141,484 50,860,520 3% 70,698,806 6,579,791 77,278,598 4% 128,139,118
Quarter
Q1 38,331,351 10,388,851 48,720,203 -4.2% 64,212,862 5,789,067 70,001,929 -9% 118,722,131
Q2 39,755,750 10,867,326 50,623,076 -0.5% 68,734,713 6,277,151 75,011,864 -3% 125,634,940
Q3 41,067,977 11,444,233 52,512,210 3.2% 73,364,804 6,869,553 80,234,357 4% 132,746,567
Q4 41,882,999 11,806,604 53,689,603 2.2% 77,369,097 7,406,819 84,775,916 10% 138,465,518
Average Monthly Salary
Bahraini Non-Bahraini
Year
Male Female Total GR Male Female
Total GR
Total Aver.
2007 542 359 491 NA 162 270 167 NA 228
2008 602 384 537 9% 179 288 185 11% 249
2009 663 421 590 10% 190 300 195 6% 265
2010 675 435 603 2% 196 298 201 3% 274
2011 702 459 629 4% 202 300 208 3% 283
Quarter
Q1 756 493 679 7.9% 210 314 216 3.8% 300
Q2 741 487 667 6.0% 207 308 213 2.4% 293
Q3 726 481 654 3.9% 205 302 211 1.4% 288
Q4 714 476 643 2.2% 202 295 208 -0.1% 282

Statistical Report 2012 - Quarter 4
Page 26 of 42
P1.2Cont. Table

Statistical Report 2012 - Quarter 4
Page 27 of 42
P1.3Table
Number of Employees Subject to the Provision Of Law Classified by Age group, Sex &
Nationality as at Q4
2012
SectorPrivate
Number of Employee
Bahraini Non-Bahraini
Age Group
Male Female Total Male Female Total Total %
< 20 952
267
1,219
881
130
1,011
2,230
0.5%
20-24 9,476
3,306
12,782
27,700
2,506
30,206
42,988
8.7%
25-29 12,417
5,909
18,326
86,556
5,855
92,411
110,737
22.5%
30-34 10,591
5,185
15,776
85,484
5,868
91,352
107,128
21.8%
35-39 8,083
3,786
11,869
64,679
3,967
68,646
80,515
16.4%
40-44 5,383
2,427
7,810
50,168
2,887
53,055
60,865
12.4%
45-49 4,610
2,029
6,639
31,129
1,895
33,024
39,663
8.1%
50-54 3,713
1,268
4,981
20,471
1,212
21,683
26,664
5.4%
55-59 2,367
506
2,873
11,840
585
12,425
15,298
3.1%
60-64 795
104
899
3,559
176
3,735
4,634
0.9%
65+ 288
30
318
797
29
826
1,144
0.2%
Total 58,675
24,817
83,492
383,264
25,110
408,374
491,866
100%
Note
553268
4,0905
Age wise employees between 25-39 years constitute 55% of total employees, females represent 32% and males 68% at Q4 2012.
Number of employees with age 55 years and above equals to 4,090 and they constitute 5% of total employees. Those are entitled for a retirement pension in the event of ending their services subject to existence of years of service condition.

Statistical Report 2012 - Quarter 4
Page 28 of 42
P1.4Table
Average Monthly Salary of Employees Subject to the Provision Of Law in the Private
Sector Classified by Age group, Sex & Nationality as at Q4
2012
SectorPrivate
Average Monthly Salary
Bahraini Non-Bahraini
Age Group
Male Female Total Male Female Total Total Aver.
<20 258
239
254
76
87
77
174
20-24 332
341
334
93
155
98
168
25-29 486
468
480
113
219
120
180
30-34 646
511
602
157
276
164
229
35-39 749
466
659
207
326
213
279
40-44 984
494
832
246
369
253
327
45-49 1,098
524
923
299
413
305
409
50-54 1,309
600
1,129
370
438
374
515
55-59 1,333
707
1,223
460
522
463
606
60-64 1,190
453
1,105
692
605
688
769
65+ 808
383
768
1,295
752
1,276
1,135
/Total 714
476
643
202
295
208
282
Note
)
The highest average monthly salary for Bahrainis (1,223 BD) is in the age group 55-59.

Statistical Report 2012 - Quarter 4
Page 29 of 42
P1.5Table
Number of Employees Subject to the Provision Of Law in the Private Sector Subject to the
provision of Law Classified According to Monthly Salary as at Q4
2012
SectorPrivate
Number of Employee
Bahraini Non-Bahraini
Monthly Basic Salary Male Female Total % Male Female Total
Grand Total
<200 1,910
3,829
5,739
6.87%
305,540
14,481
320,021
325,760
200-400 28,265
11,425
39,690
47.54%
47,004
6,134
53,138
92,828
400-600 9,101
4,283
13,384
16.03%
10,346
1,841
12,187
25,571
600-800 5,071
1,757
6,828
8.18%
4,843
828
5,671
12,499
800-1000 3,251
1,054
4,305
5.16%
2,837
474
3,311
7,616
1000-1200 2,759
810
3,569
4.27%
2,604
376
2,980
6,549
1200-1400 1,848
447
2,295
2.75%
1,511
249
1,760
4,055
1400-1600 1,438
321
1,759
2.11%
1,336
157
1,493
3,252
1600-1800 808
219
1,027
1.23%
820
107
927
1,954
1800-2000 706
150
856
1.03%
728
82
810
1,666
2000-2200 642
112
754
0.90%
873
109
982
1,736
2200-2400 364
85
449
0.54%
567
42
609
1,058
2400-2600 372
53
425
0.51%
571
41
612
1,037
2600-2800 240
40
280
0.34%
353
23
376
656
2800-3000 250
41
291
0.35%
318
12
330
621
3000-3200 232
33
265
0.32%
425
26
451
716
3200-3400 146
22
168
0.20%
278
12
290
458
3400-3600 123
18
141
0.17%
261
10
271
412
3600-3800 108
17
125
0.15%
188
7
195
320
3800-4000 76
15
91
0.11%
154
6
160
251
>4000 965
86
1,051
1.26%
1,707
93
1,800
2,851
Total 58,675
24,817
83,492
100%
383,264
25,110
408,374
491,866
Note

Statistical Report 2012 - Quarter 4
Page 30 of 42
48% of total Bahraini employees average salaries between 200-400 BD, female constitute 29% and male 71% of them at the end of Q4 2012.
Section
Pensioners Statistics in the Private Sector
Contents
Table No Title
Page No
P2.1
Live Pensioners Data
30
P2.1
Number of Alive Pensioners & Dead Pensioners by Gender 31
P2.2
Total & Average Monthly Pension of Alive and Dead Pensioners by Gender
32
P2.3
Number of Alive Pensioners & Average Monthly Pension by Age Group
34
P2.4
Number of Alive Pensioners by Monthly Pension 35

Statistical Report 2012 - Quarter 4
Page 31 of 42
P2.1Table
Number of Bahraini Alive Pensioners & Dead Pensioners Classified According to Gender &
Nationality as at Q4
2012
SectorPrivate
Number of AlivePensioners Number of DeadPensioners
M F
M F
Year Male Female Total GR Male Female Total GR
Grand Total
2009 7,563
1,993
9,556
NA 3,679
139
3,818
NA 13,374
2010 8,650
2,328
10,978
15% 3,768
156
3,924
3% 14,902
2011 9,836
2,785
12,621
15% 3,863
171
4,034
3% 16,655
Quarter
Q1 10,504
2,950
13,454
7% 3,883
177
4,060
0.6% 17,514
Q2 10,811
3,091
13,902
10% 3,899
183
4,082
1.2% 17,984
Q3 11,086
3,255
14,341
14% 3,917
186
4,103
1.7% 18,444
Q4 11,256
3,352
14,608
16% 3,926
186
4,112
1.9% 18,720

Statistical Report 2012 - Quarter 4
Page 32 of 42
P2.2Table
Total and Average Monthly Pension of Bahraini alive and Dead Pensioners by
Gender as at Q4 2012
Private Sector
Total Monthly Pension
Alive Pensioners Dead Pensioners
M F
M F
Male Female Total GR Male Female
Total GR
Grand Total
2009 4,204,534
709,620
4,914,154
NA 1,057,353
30,405
1,087,758
NA 6,001,912
2010 4,963,556
838,746
5,802,302
18% 1,094,264
34,332
1,128,596
4% 6,930,898
2011 5,700,348
1,004,498
6,704,847
16% 1,131,202
38,187
1,169,389
4% 7,874,236
Quarter
Q1 6,193,600
1,065,787
7,259,387
8% 1,136,947
40,664
1,177,611
1% 8,436,998
Q2 6,376,676
1,111,789
7,488,465
12% 1,143,772
42,196
1,185,968
1% 8,674,433
Q3 6,527,635
1,160,954
7,688,589
15% 1,151,112
42,884
1,193,996
2% 8,882,585
Q4 6,614,298
1,187,330
7,801,628
16% 1,154,928
42,884
1,197,812
2% 8,999,440
Average Monthly Pension
Alive Pensioners Dead Pensioners
M F
M F
Male Female Total GR Male Female Total GR Average
2009 556
356
514
NA 287
219
285
NA 449
2010 574
360
529
3% 290
220
288
1% 465
2011 580
361
531
1% 293
223
290
0.79% 473
Quarter
Q1 590
361
540
1.6% 293
230
290
0.06% 482
Q2 590
360
539
1.4% 293
231
291
0.23% 482
Q3 589
357
536
0.9% 294
231
291
0.39% 482
Q4 588
354
534
0.5% 294
231
291
0.49% 481
Note
Minimum pension increased to 200 in Aug 2011.

Statistical Report 2012 - Quarter 4
Page 33 of 42
P2.2Cont. Table

Statistical Report 2012 - Quarter 4
Page 34 of 42
P2.3Table
Number of Alive Pensioners & Average Monthly Pension Classified by Age group
& Sex as at Q4
2012
SectorPrivate
Number of AlivePensioners AverageMonthly Pension
M F
M F
Age group
Male Female Total % Male Female Average
<24 4
4
0.03%
281
281
25-29 21
4
25
0.2%
294
281
292
30-34 48
66
114
1%
283
243
260
35-39 179
447
626
4%
281
262
267
40-44 650
582
1,232
8%
316
290
304
45-49 1240
743
1,983
14%
415
319
379
50-54 1732
741
2,473
16.9%
566
407
519
55-59 2029
474
2,503
17.1%
707
443
657
60-64 2043
221
2,264
15%
745
469
718
65-69 1238
42
1,280
9%
702
501
696
70-74 910
17
927
6%
599
363
594
75-79 564
5
569
4%
464
364
463
80-84 379
7
386
3%
378
347
378
85 + 219
3
222
2%
303
166
301
Total 11,256
3,352
14,608
100%
588
354
534
Note
5559,
The highest number of pensioner (2,503) is in the age group 55-59, females represent 19% and males 81% of them at Q4 2012.

Statistical Report 2012 - Quarter 4
Page 35 of 42
P2.4Table
Number of Bahraini alive Pensioners Classified According to the Paid Pension
as at Q4
2012
SectorPrivate
Number
Monthly Pension Male Female Total %
<150 212
54
266
2%
150-300 3,737
2,296
6,033
41%
300-450 2,474
501
2,975
20%
450-600 1,390
212
1,602
11%
600-750 960
106
1,066
7%
750-900 679
71
750
5%
900-1050 482
39
521
4%
1050-1200 324
35
359
2%
1200-1350 232
8
240
2%
1350-1500 151
6
157
1%
1500-1650 104
8
112
1%
1650-1800 110
1
111
1%
1800-1950 68
1
69
0.5%
1950-2100 47
1
48
0.3%
2100-2250 55
2
57
0.4%
2250-2400 41
2
43
0.3%
2400-2550 30
2
32
0.2%
2550-2700 17
1
18
0.1%
2700-2850 25
2
27
0.2%
2850-3000 28
3
31
0.2%
>3000 90
1
91
1%
Total 11,256
3,352
14,608
100%
Note
413862
41% of total alive pensioners average pension is between 150-300 BD, female constitute 38% and male 62% of them at the end of Q4 2012.

Statistical Report 2012 - Quarter 4
Page 36 of 42
Section P 3 Beneficiaries Statistics in the Private Sector
Contents
Table No Title
Page No
3
Beneficiaries Data
36
P3.1
Number, Total & average Monthly Pension of Beneficiaries by Gender 37
P3.2
Number of Beneficiaries Classified By Age Wise 39
P3.3
Number of Beneficiaries Classified By Monthly Pension 40

Statistical Report 2012 - Quarter 4
Page 37 of 42
P3.1Table
Number of Beneficiaries, Total & Average Monthly Pension by Gender as at Q4
2012
Private Sector
Number of Beneficiaries
Total Monthly Pension
Year
Male Female Total GR Male Female Total GR
2009 6,304
243
6,547
NA 1,055,701
30,405
1,086,107
NA
2010 6,546
286
6,832
4% 1,092,776
34,332
1,127,108
3.8%
6,819
319
7,138
4% 1,129,676
38,187
1,167,863
4%
Quarter
Q1 6,880
337
7,217
1% 1,135,421
40,664
1,176,085
0.7%
Q2 6,927
348
7,275
2% 1,142,246
42,196
1,184,442
1.4%
Q3 6,985
360
7,345
3% 1,149,586
42,884
1,192,470
2.1%
Q4 7,022
360
7,382
3% 1,153,402
42,884
1,196,286
2.4%
Average Monthly Pension
Year
Male Female Total GR
2009 167
125
166
NA
2010 167
120
165
-1%
2011 166
120
164
-1%
Quarter
Q1 165
121
163
-0.4%
Q2 165
121
163
-0.5%
Q3 165
119
162
-1%
Q4 164
119
162
-1%

Statistical Report 2012 - Quarter 4
Page 38 of 42
P3.1Cont. Table

Statistical Report 2012 - Quarter 4
Page 39 of 42
P3.2Table
Number of Beneficiaries & Average Monthly Pension Classified by Age group & Sex
as at Q4 2012 Private Sector
Number of Beneficiaries Average MonthlyPension
Age Group Male Female Total
Male Female Total
< 25 2,105
201
2,306
31% 129
123
128
25-29 222
12
234
3% 164
125
162
30-34 184
3
187
3% 158
142
158
35-39 248
5
253
3% 156
156
156
40-44 292
3
295
4% 166
172
166
45-49 435
4
439
6% 166
95
165
50-54 563
11
574
8% 182
264
184
55-59 593
19
612
8% 191
80
188
60-64 532
16
548
7% 214
82
211
65-69 533
21
554
8% 203
83
198
70-74 543
21
564
8% 180
98
177
75-79 391
17
408
6% 168
119
165
80-84 238
16
254
3% 156
124
154
85 + 143
11
154
2% 133
85
130
Total 7,022
360
7,382
100% 164
119
162
Note
.
The highest number of Beneficiaries (2,306) is in the age group less than 25, females represent 9% and males 91% of them at Q4 2012.

Statistical Report 2012 - Quarter 4
Page 40 of 42
P3.4Table
Number of Beneficiaries and Amount of Pensions Paid Classified According
to the Monthly Pension as at Q4
2012
Private Sector
Number
Monthly Pension Male Female Total %
<50 909
92
1,001
14%
0050 - < 0150 3,164
216
3,380
46%
0150 - < 0250 1,768
23
1,791
24%
0250 - < 0350 704
22
726
10%
0350 - < 0450 242
2
244
3%
0450 - < 0550 106
1
107
1%
0550 - < 0650 51
1
52
1%
0650 - < 0750 25
25
0.3%
0750 - < 0850 23
23
0.3%
0850 - < 0950 12
1
13
0.2%
0950 - < 1050 5
1
6
0.1%
1050 - < 1150 4
4
0.1%
1250 - < 1350 2
2
0.03%
1450 - < 1550 1
1
2
0.03%
>1550 6
6
0.1%
Total 7,022
360
7,382
100%
Note
46% of total Beneficiaries average pension is between 50-150 BD, female constitute 6% and male 94% of them at the end of Q4 2012.

Statistical Report 2012 - Quarter 4
Page 41 of 42

Statistical Report 2012 - Quarter 4
Page 42 of 42
Terms of reference
Definition Term Civil Sector: Employee subject to the provisions of law No. (13) for year 1975.
Private Sector: Worker subject to the provisions of law No. (24) for year 1976.
Employee
Civil Sector: Is salary received by the Employee who is subject to the provisions of law No. (13) for year 1975, based on the basic monthly salary without any other additions to it.
Private Sector: Salary will include allowances, bonuses and commission of permanent and continuous nature.
Salary
Is the number of full months spent by the Employee at the Service of the Government until reaching the age of sixty for men, and fifty five for women. This is calculated from the date of joining Government Service or from the date he reached the age of eighteen , whichever date comes last and to a maximum of 480 months. The month is a part of twelve months of a Gregorian year. Fractions of a month are considered as a full month.
The Service Period
Is the Employee who s service has terminated.
The Retired Person
Is the sum of money which is paid every month to the retired person or those entitled for him in accordance with this Law.
The Pension
Is the retired person for whom a pension has been decided in accordance with this law.
The Pensioner
Is the person for whom a pension has been decided because of his family relationship with the Pensioner.
The Entitled Person