
Statistical Projection of Global Climate Change Scenarios onto Hawaiian Rainfall Oliver Timm,...
37
Statistical Projection of Global Climate Change Scenarios onto Hawaiian Rainfall Oliver Timm, International Pacific Research Center, SOEST, University of Hawai'i at Manoa Henry Diaz, NOAA/ESRL/CIRES, Boulder, Colorado
-
date post
22-Dec-2015 -
Category
Documents
-
view
218 -
download
0
Transcript of Statistical Projection of Global Climate Change Scenarios onto Hawaiian Rainfall Oliver Timm,...

Statistical Projection of Global
Climate Change Scenarios onto
Hawaiian RainfallOliver Timm,
International Pacific Research Center, SOEST, University of
Hawai'i at Manoa
Henry Diaz, NOAA/ESRL/CIRES, Boulder, Colorado
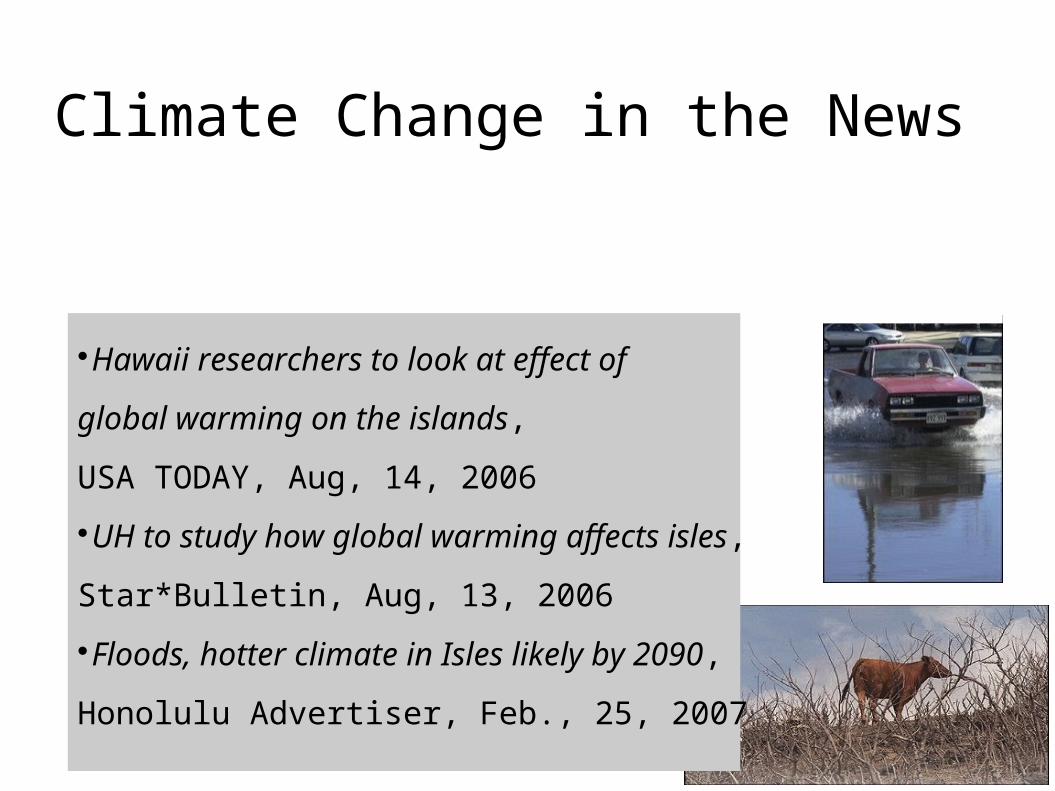
Climate Change in the News
Hawaii researchers to look at effect of
global warming on the islands,
USA TODAY, Aug, 14, 2006
UH to study how global warming affects isles,
Star*Bulletin, Aug, 13, 2006
Floods, hotter climate in Isles likely by 2090,
Honolulu Advertiser, Feb., 25, 2007
Presentation overview Introduction
What is the present knowledge of Hawaii's rainfall
changes during the 21st century?
Uncertainty in future climate change projections
The idea behind statistical downscaling
Results from the statistical downscaling Connection between large-scale circulation changes
and regional precipitation
Discussion & Outlook
Introduction:
What is the scientific information
behind our present understanding of rainfall changes
over Hawaii?
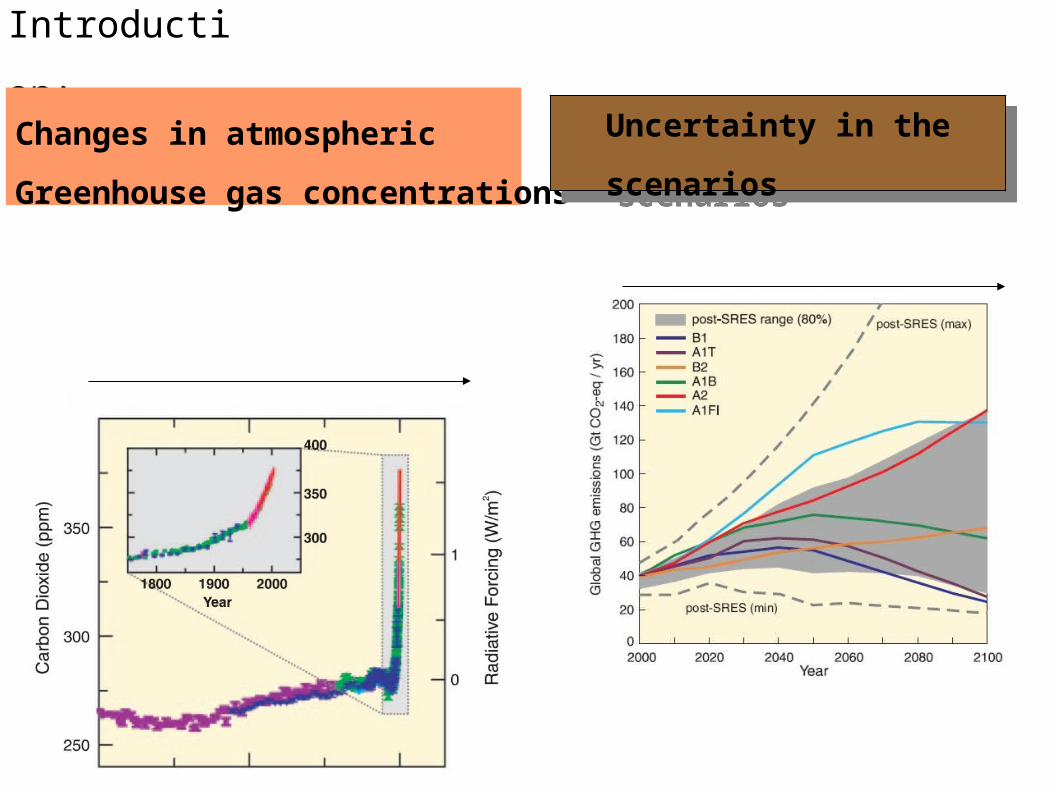
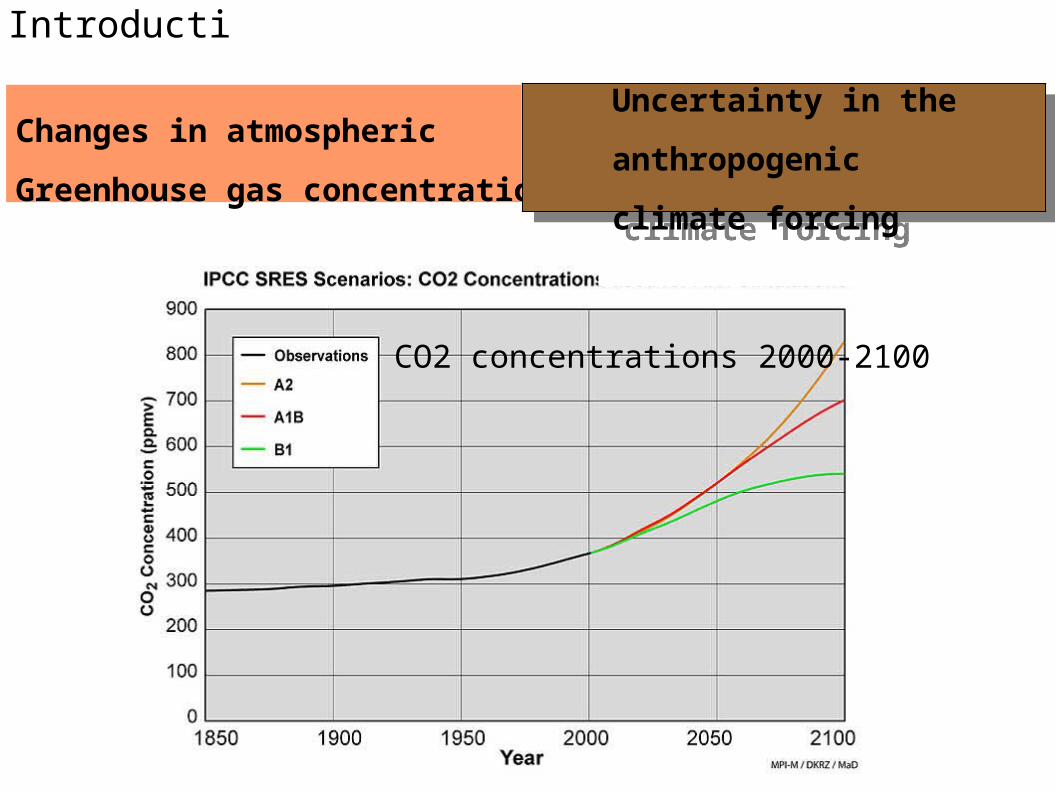
Introduction:
Changes in atmospheric
Greenhouse gas concentrations
CO2 during the last 1000 years
CO2 emission 2000-2100
Uncertainty in the scenariosUncertainty in the scenarios
Introduction:
Changes in atmospheric
Greenhouse gas concentrations
Uncertainty in the anthropogenic
climate forcing
Uncertainty in the anthropogenic
climate forcing
CO2 concentrations 2000-2100
CO2 concentrations 2000-2100
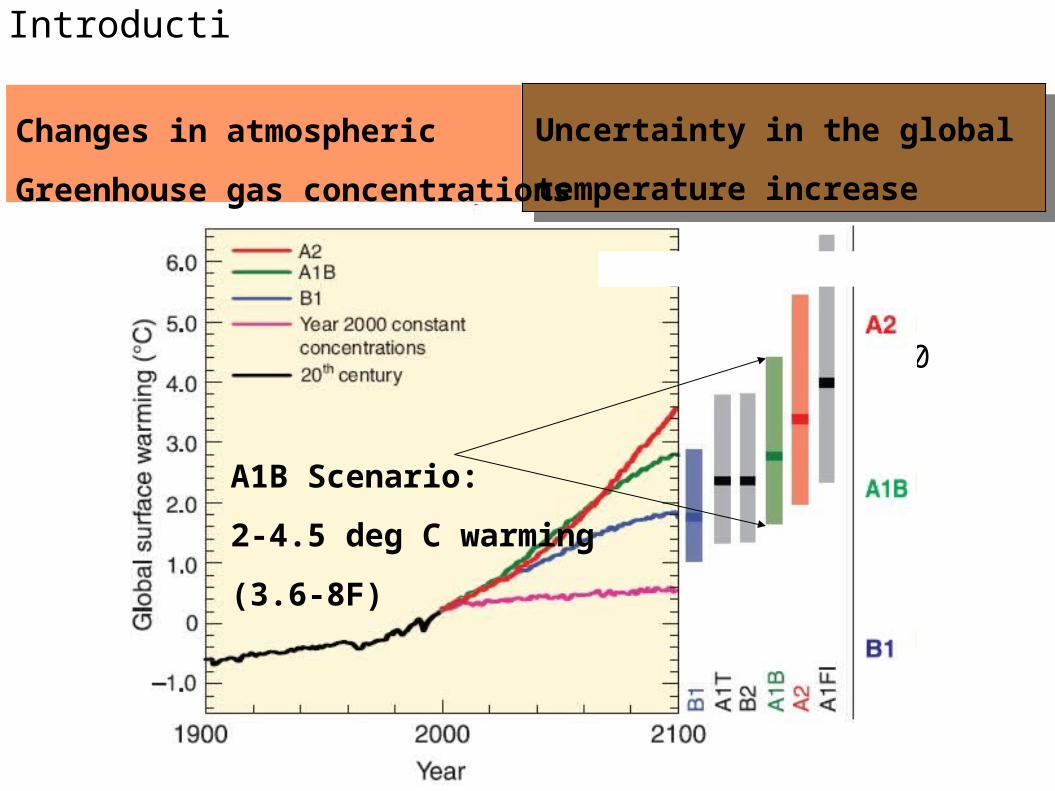
A1B Scenario:
2-4.5 deg C warming
(3.6-8F)
Introduction:
Uncertainty in the global
temperature increase
Uncertainty in the global
temperature increase
Changes in atmospheric
Greenhouse gas concentrations
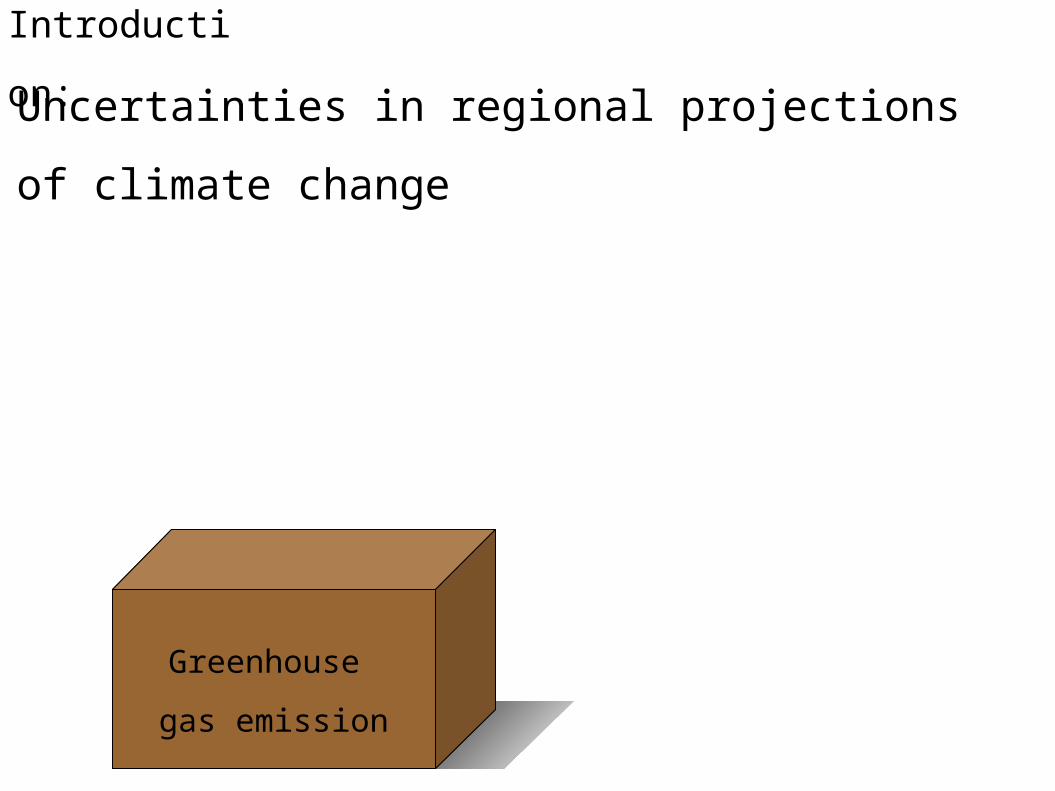
Introduction:
Dynamical or statistical
downscaling methodsGreenhouse
gas emission
Uncertainties in regional projections of climate change
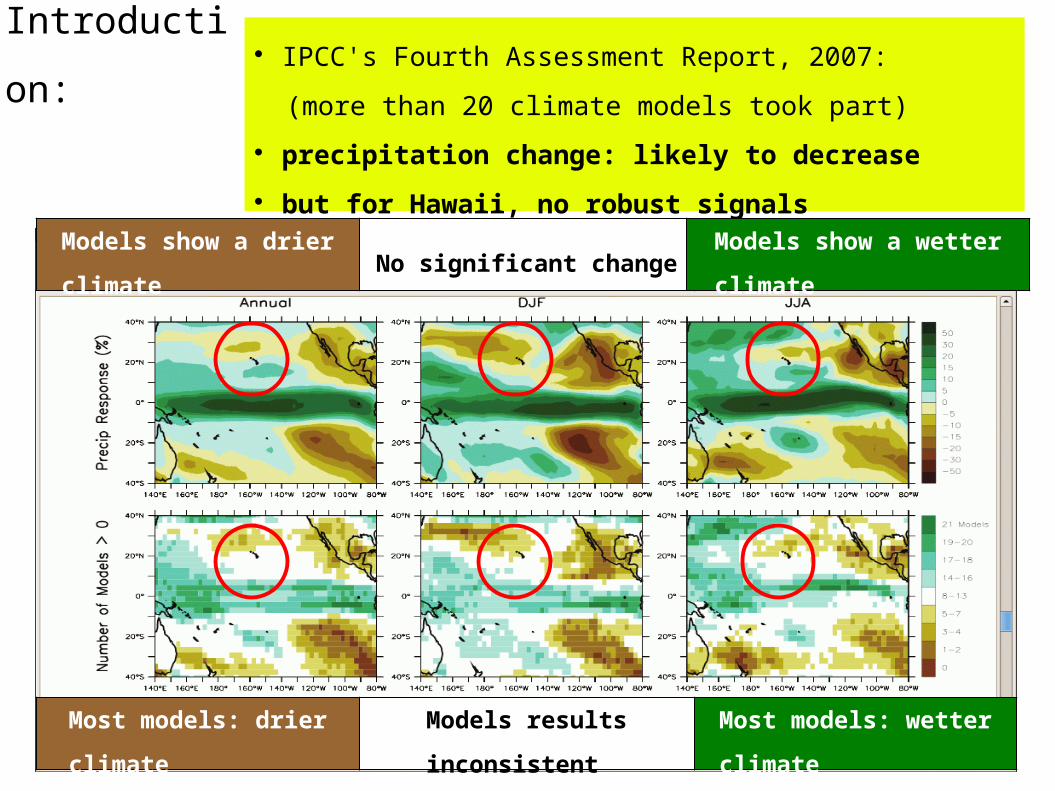
IPCC's Fourth Assessment Report, 2007:
(more than 20 climate models took part)
precipitation change: likely to decrease
but for Hawaii, no robust signalsModels show a drier
climate
Models results inconsistentMost models: drier climateMost models: wetter
climate
No significant changeModels show a wetter
climate
Introduction:
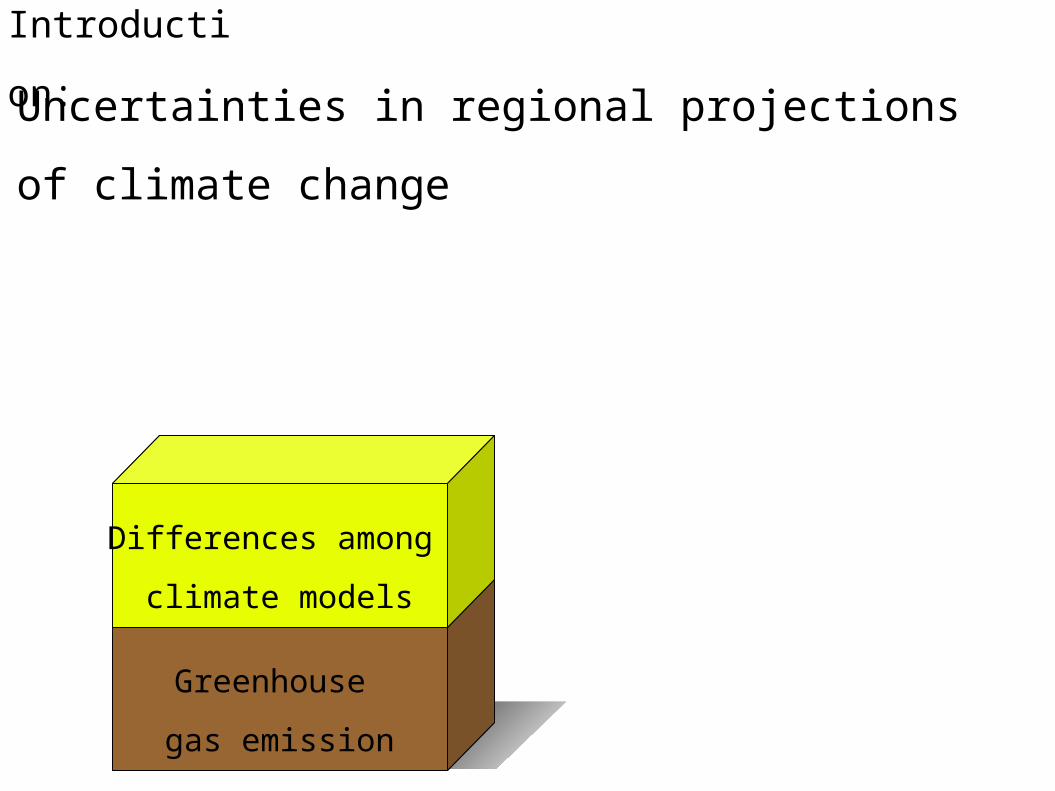
Uncertainties in regional projections of climate change
Introduction:
Dynamical or statistical
downscaling methodsGreenhouse
gas emission
Differences among
climate models
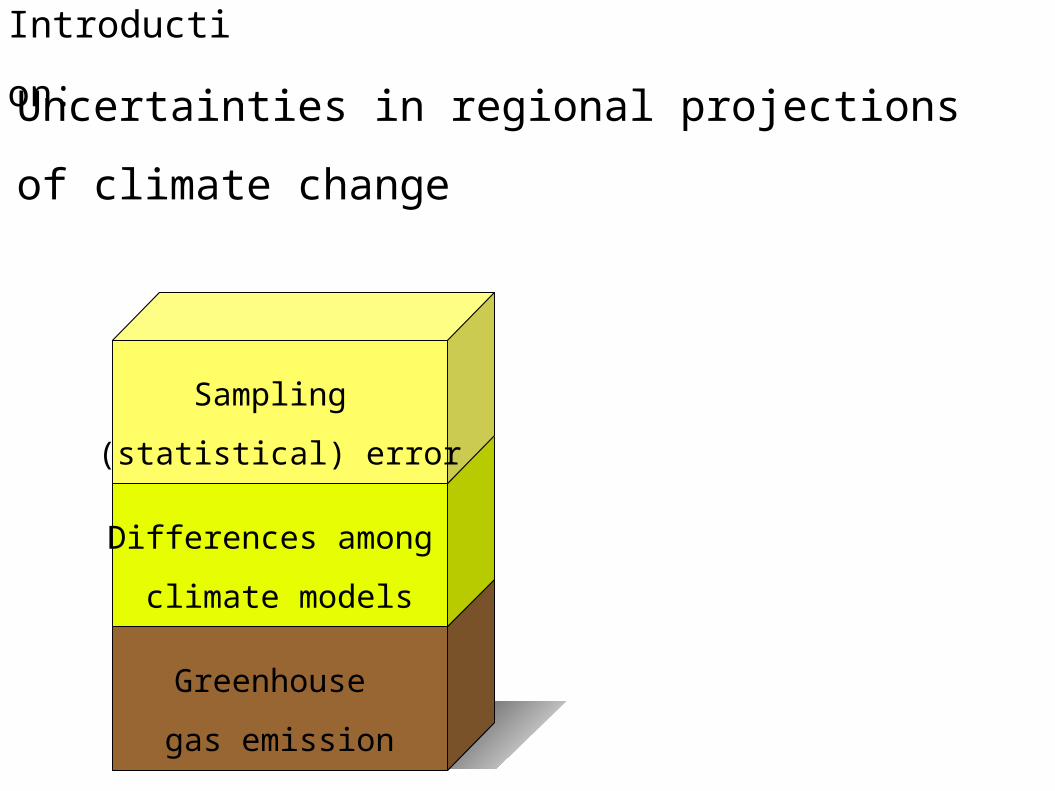
Uncertainties in regional projections of climate change
Introduction:
Dynamical or statistical
downscaling methodsGreenhouse
gas emission
Differences among
climate models
Sampling
(statistical) error
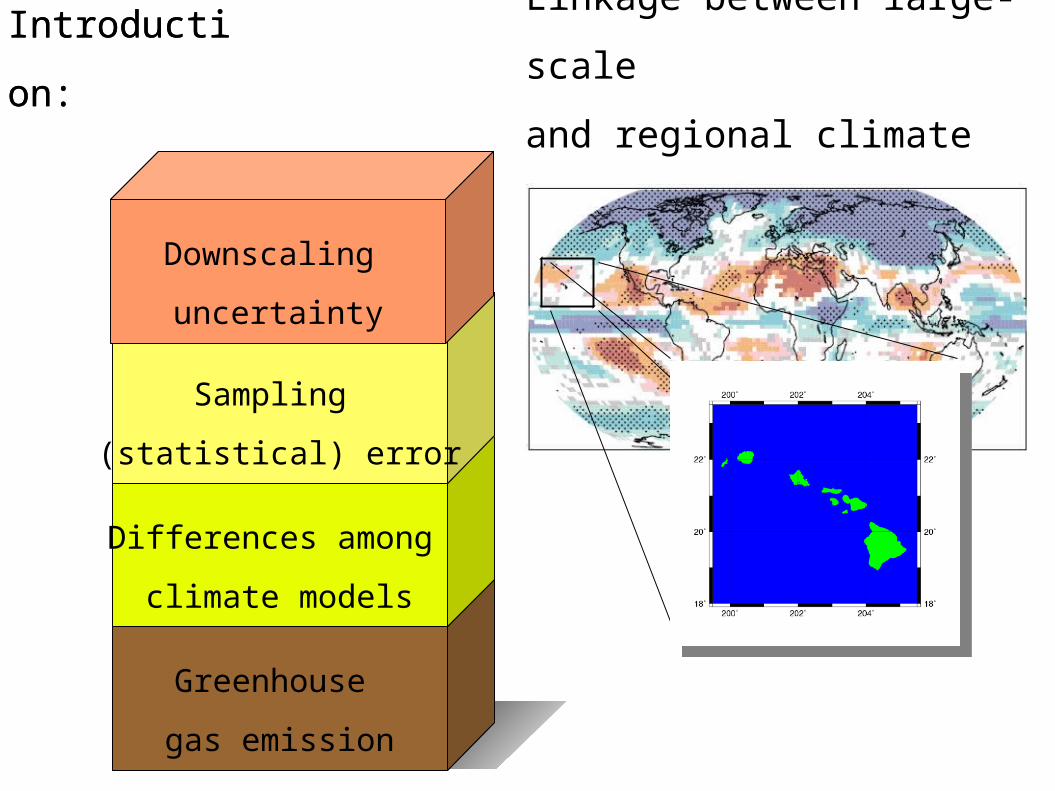
Linkage between large-scale
and regional climate changes
Introduction:
Dynamical or statistical
downscaling methodsGreenhouse
gas emission
Differences among
climate models
Sampling
(statistical) error
Downscaling
uncertainty
Introduction:
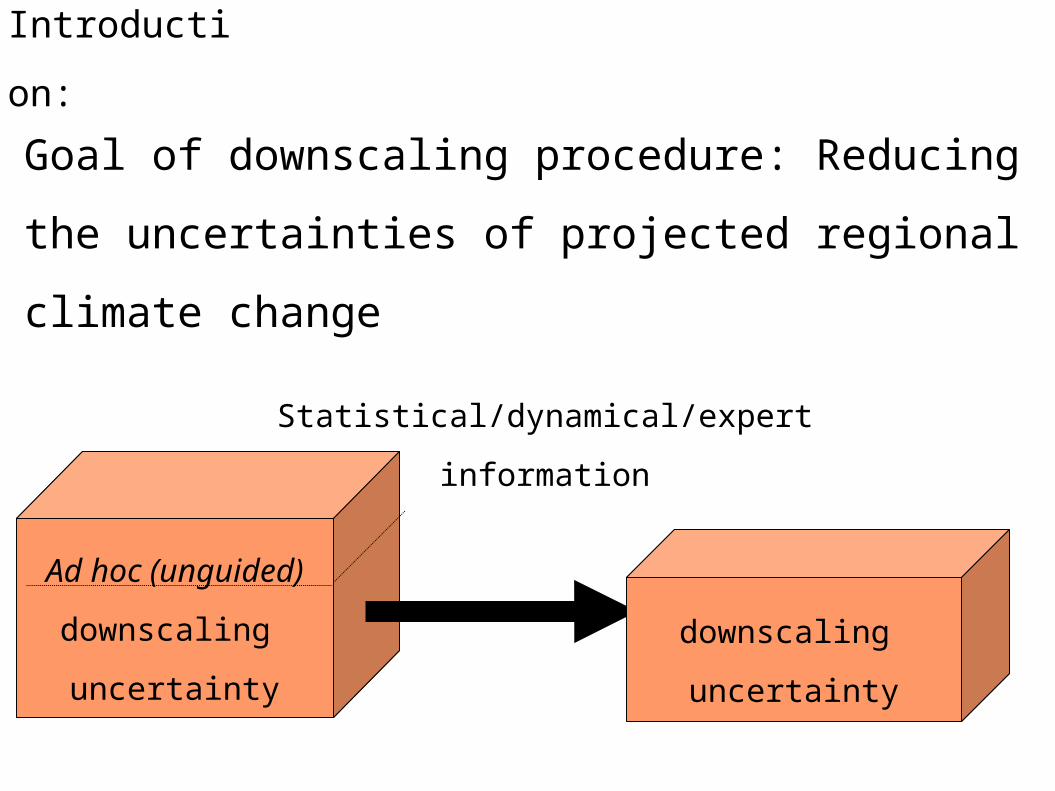
Goal of downscaling procedure: Reducing the
uncertainties of projected regional climate change
Statistical/dynamical/expert
information
Introduction:
Ad hoc (unguided)
downscaling
uncertainty
downscaling
uncertainty
Introduction:
What is the scientific information
behind our present understanding of rainfall changes
over Hawaii?
+
Statistical,
dynamical,
and elaborated
experts' estimates
Regional downscaling projects:
The Prediction of Regional scenarios and Uncertainties
for Defining Euorpean Climate change
risks and Effects (PRUDENCE)
Their goal: Provide a dynamically downscaled scenario for Europe
Huge project > 20 research groups!
Key steps in downscaling procedure:
1) Investigating the physical links between Hawaiian rainfall and
large-scale climate variability (diagnostic analysis)
2) Building a statistical transfer-model
3) Analysing the IPCC models (model analysis)
a) Comparison models' 20th century simulations with observations
b) Identification of circulation changes around Hawaii
c) Robustness of the projected changes
4) Application of the statistical transfer-model to the IPCC scenarios
(Statistical downscaling)
ERA-40
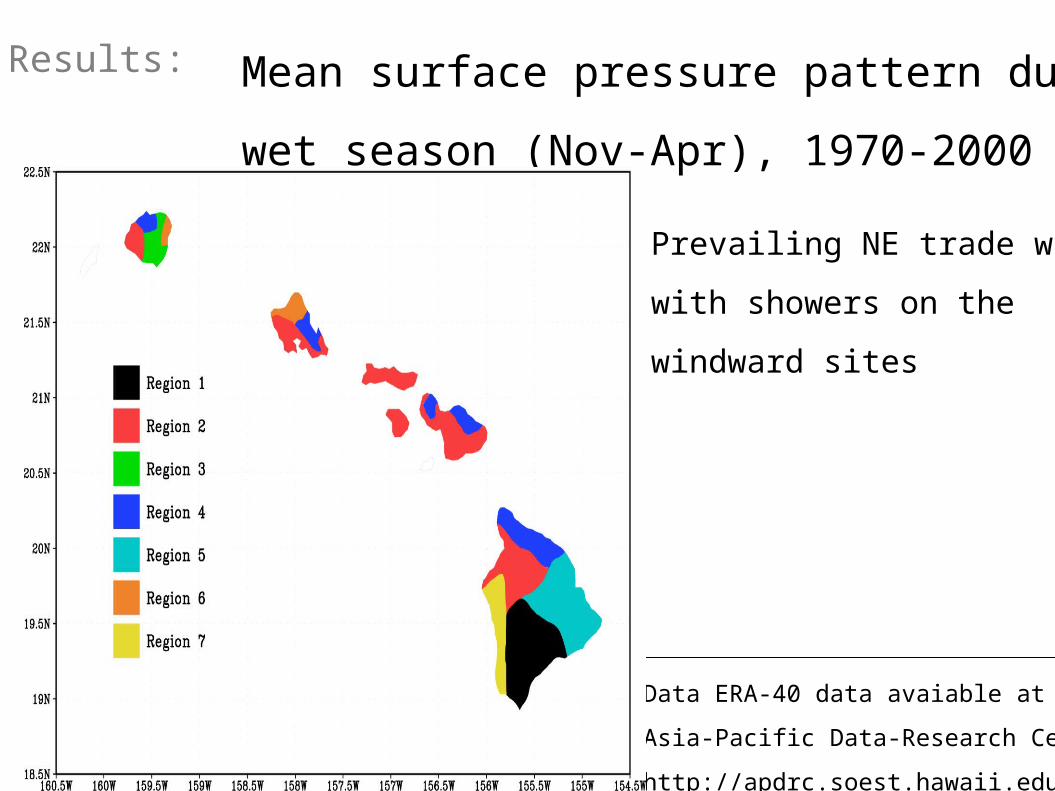
Results: Mean surface pressure pattern during the
wet season (Nov-Apr), 1970-2000
Data ERA-40 data avaiable at IPRC's
Asia-Pacific Data-Research Center
http://apdrc.soest.hawaii.edu/
H
L
Prevailing NE trade winds
with showers on the
windward sites
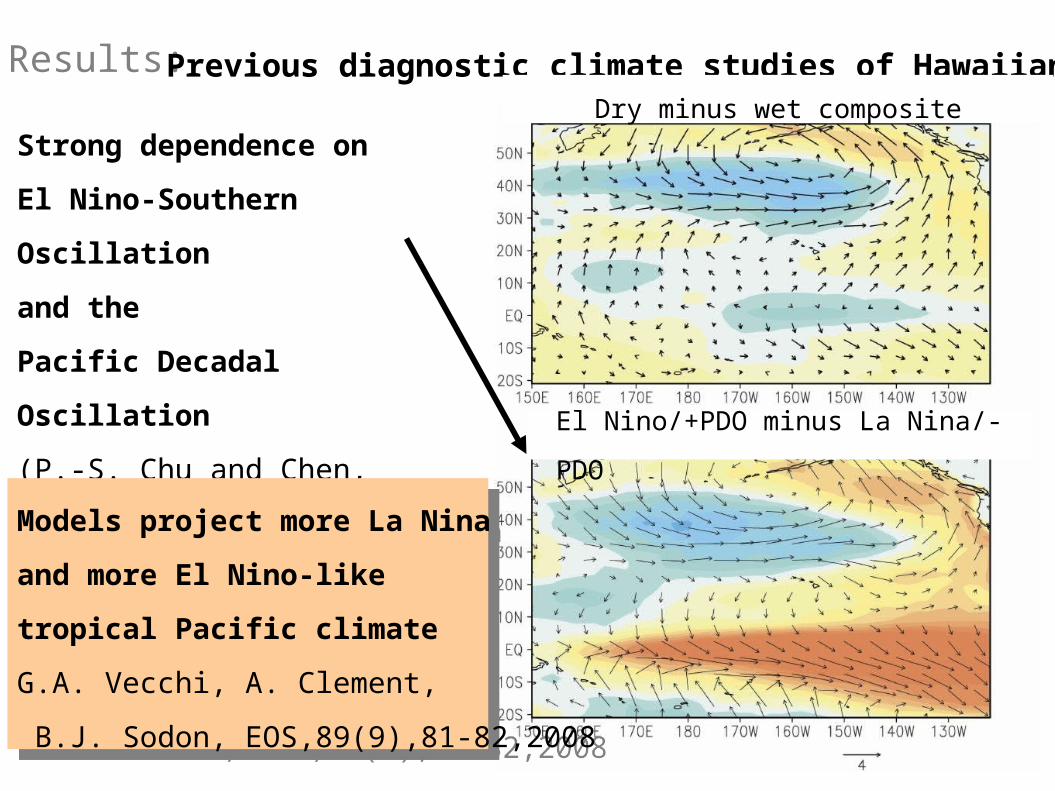
Results: Previous diagnostic climate studies of Hawaiian Rainfall
Strong dependence on
El Nino-Southern Oscillation
and the
Pacific Decadal Oscillation
(P.-S. Chu and Chen, Journal of
Climate, 18,4796- 4813, 2007)
Models project more La Nina
and more El Nino-like
tropical Pacific climate
G.A. Vecchi, A. Clement,
B.J. Sodon, EOS,89(9),81-82,2008
Models project more La Nina
and more El Nino-like
tropical Pacific climate
G.A. Vecchi, A. Clement,
B.J. Sodon, EOS,89(9),81-82,2008
Dry minus wet composite
El Nino/+PDO minus La Nina/-PDO
H
H
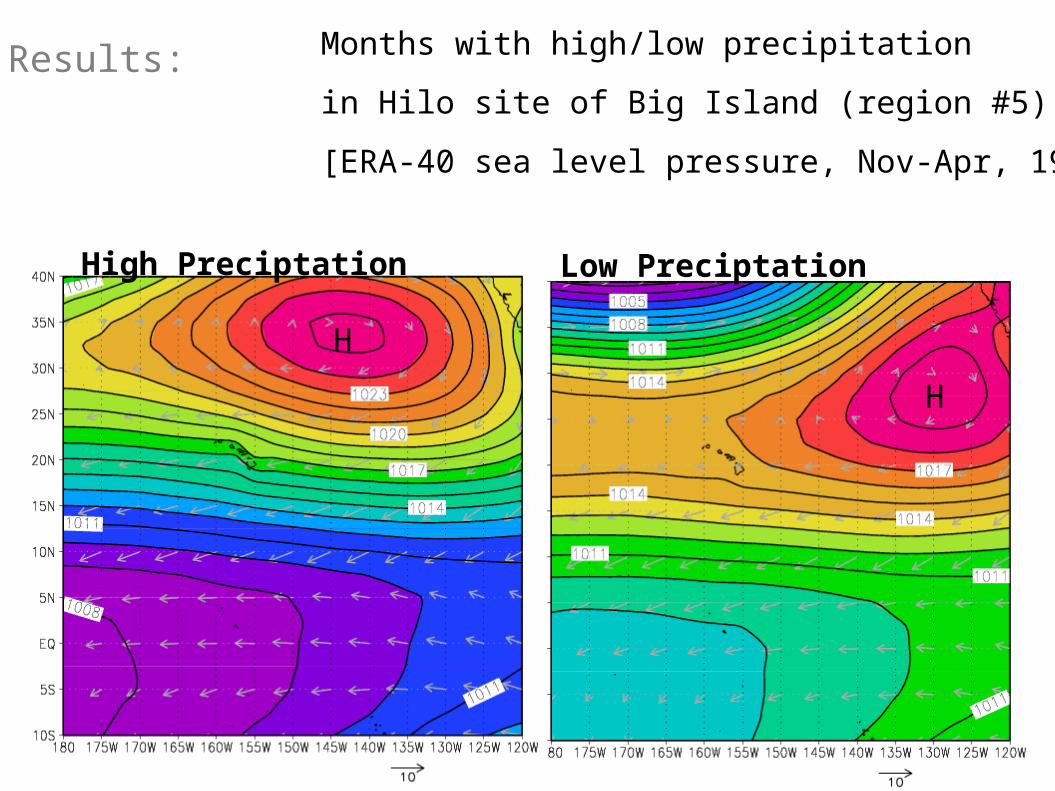
Months with high/low precipitation
in Hilo site of Big Island (region #5)
[ERA-40 sea level pressure, Nov-Apr, 1970-2000
Results:
High Preciptation Low Preciptation
2) Developing a statistical transfer model:
Hawaiian Rainfall as a function of large-
scale circulation changes
Results:
Results:
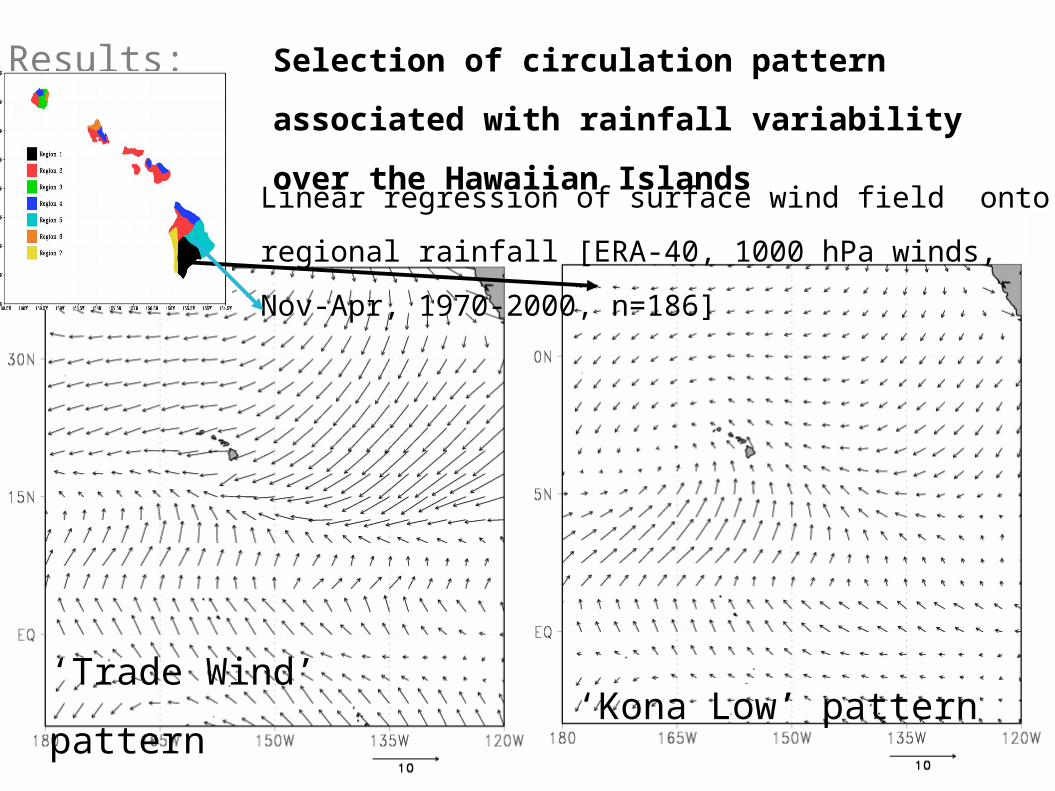
Linear regression of surface wind field onto regional rainfall
[ERA-40, 1000 hPa winds, Nov-Apr, 1970-2000, n=186]
Selection of circulation pattern associated with
rainfall variability over the Hawaiian Islands
‘Kona Low’ pattern ‘Trade Wind’ pattern
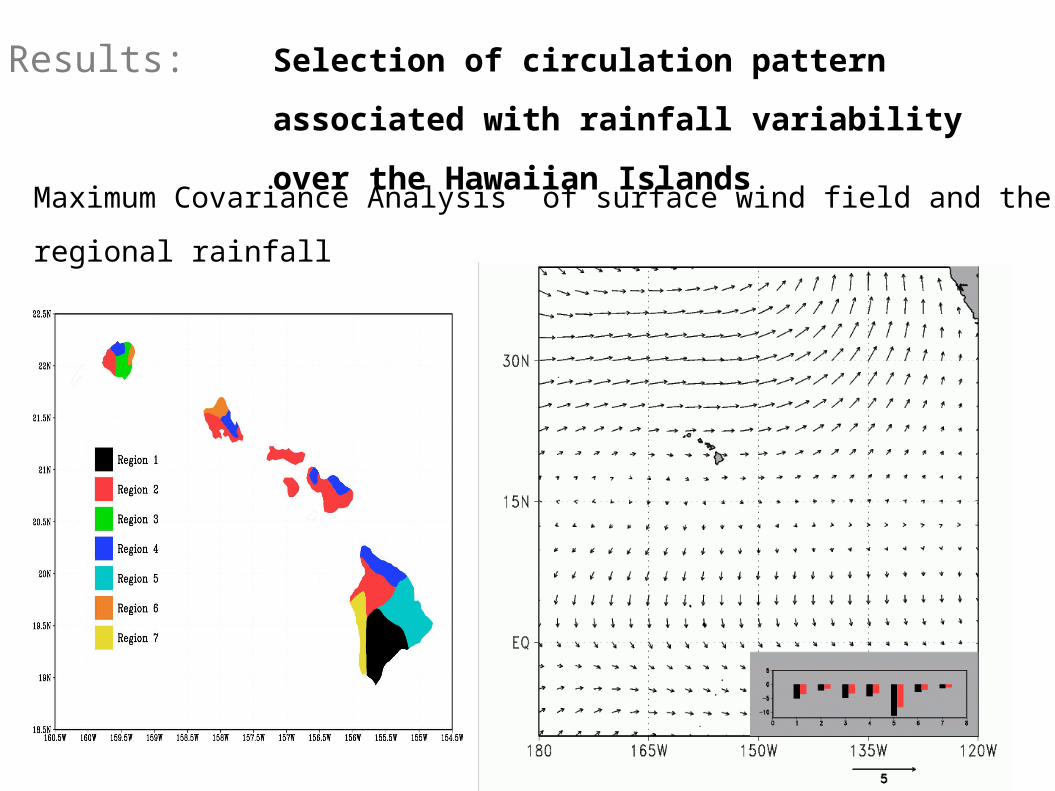
Results:
Maximum Covariance Analysis of surface wind field and the regional rainfall
Selection of circulation pattern associated with
rainfall variability over the Hawaiian Islands
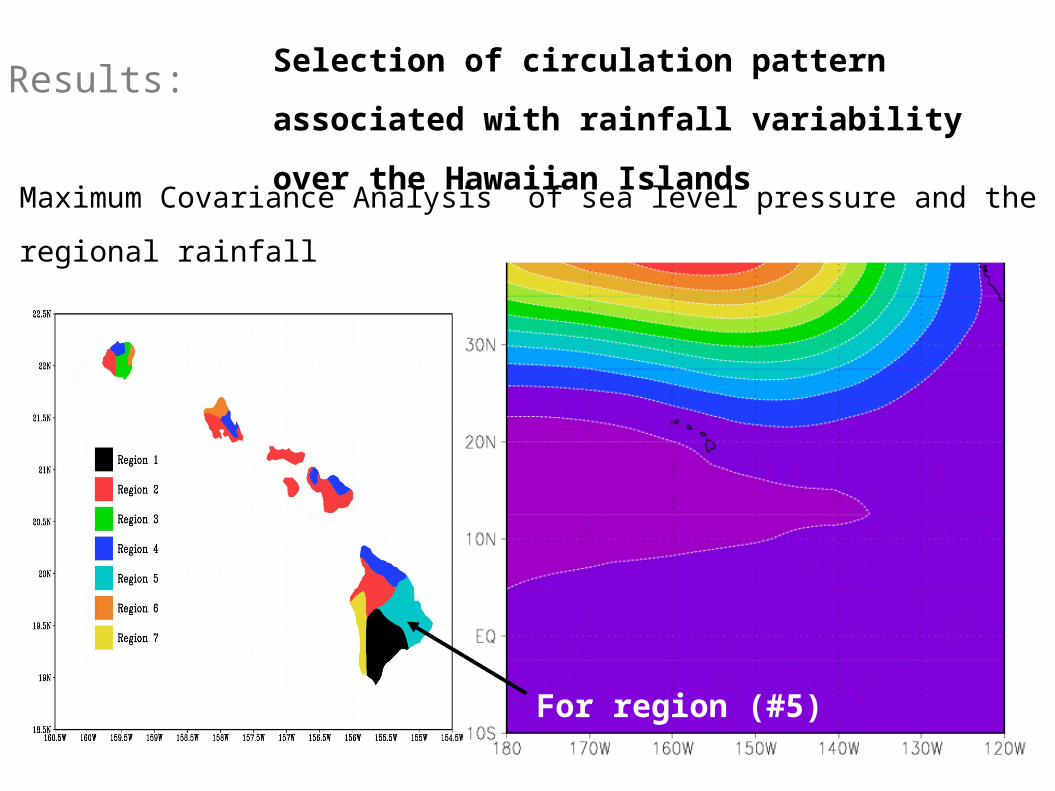
Results:
Maximum Covariance Analysis of sea level pressure and the regional rainfall
Selection of circulation pattern associated with
rainfall variability over the Hawaiian Islands
For region (#5)
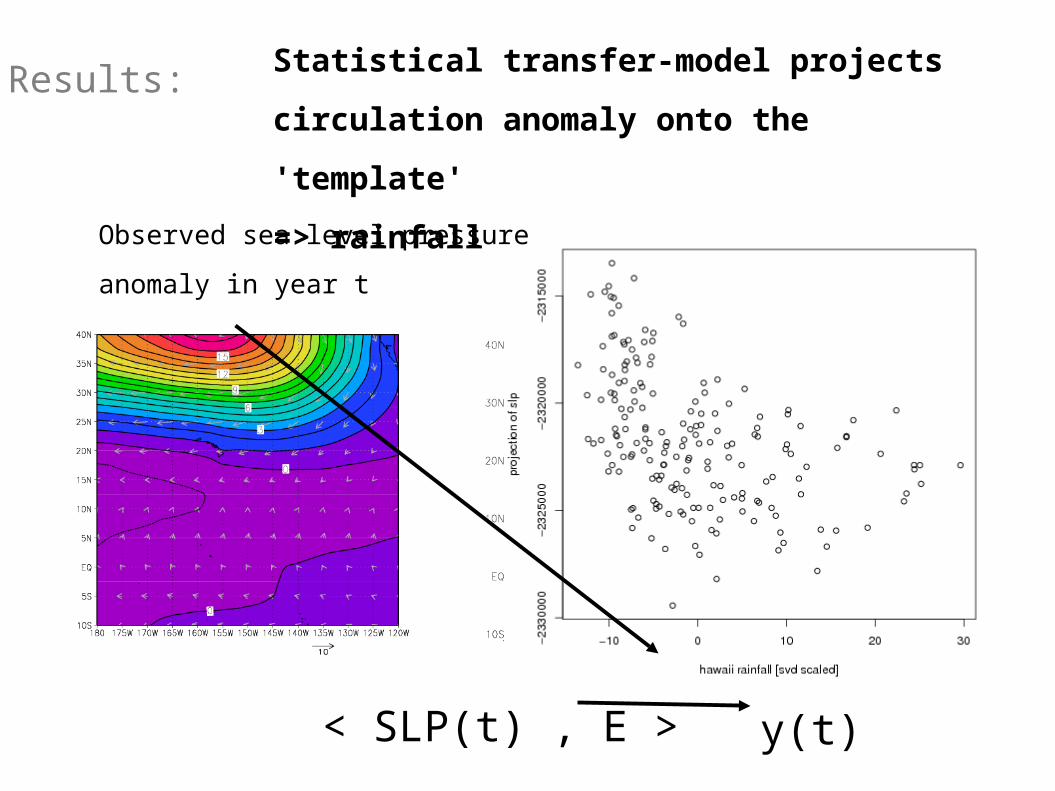
Results: Statistical transfer-model projects circulation
anomaly onto the 'template'
=> rainfall projection index
Observed sea level pressure
anomaly in year t
< SLP(t) , E > y(t)
2) How well do the IPCC models reproduce
the natural variability?
Results:
- Mean sea level pressure fields
- Decompostion of the interannual sea level pressure variability
into its dominant modes (Principal Component Analysis)
[ERA-40, Nov-Apr, 1970-2000, region 10S-40N/180W-120W]
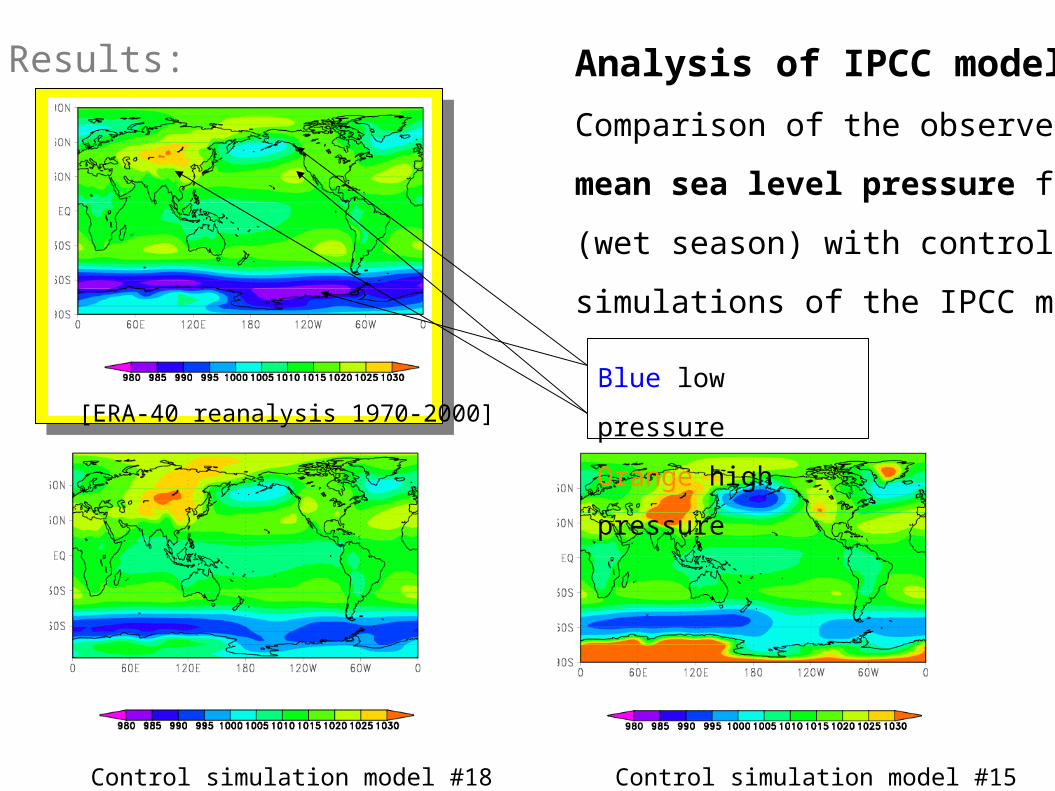
[ERA-40 reanalysis 1970-2000]
Control simulation model #18 Control simulation model #15
Comparison of the observed
mean sea level pressure field
(wet season) with control
simulations of the IPCC models
Blue low pressure
Orange high pressure
Results: Analysis of IPCC models
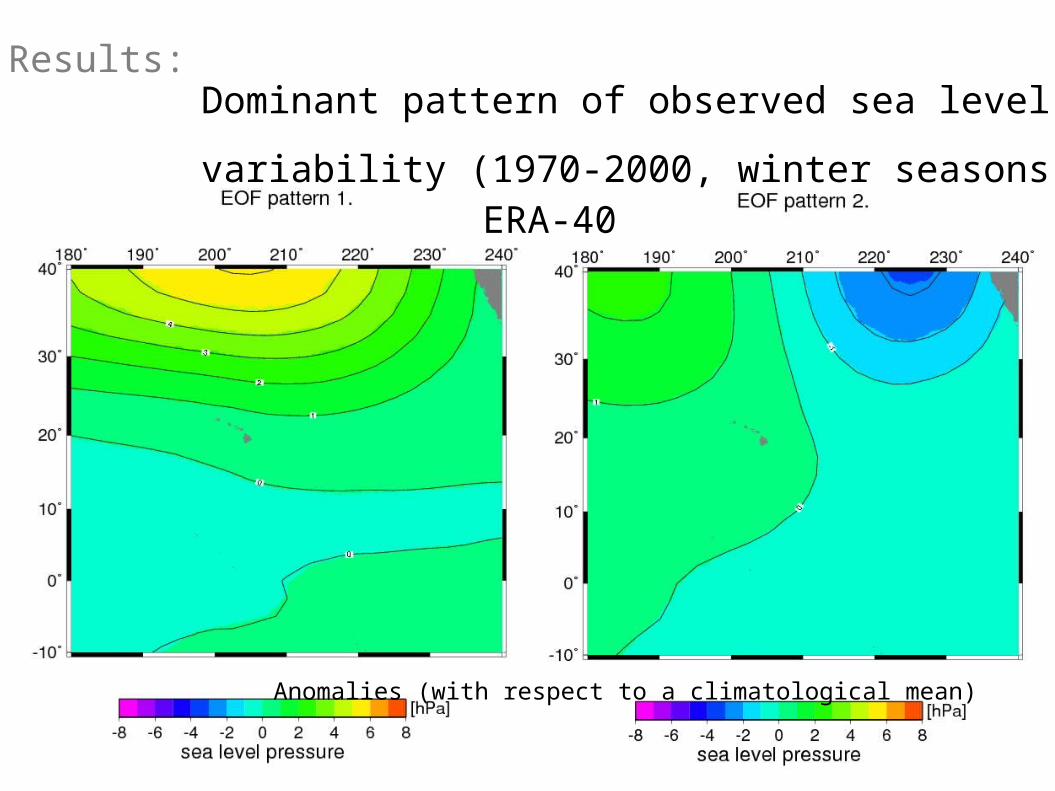
ERA-40
Dominant pattern of observed sea level pressure
variability (1970-2000, winter seasons)
Anomalies (with respect to a climatological mean)
Results:
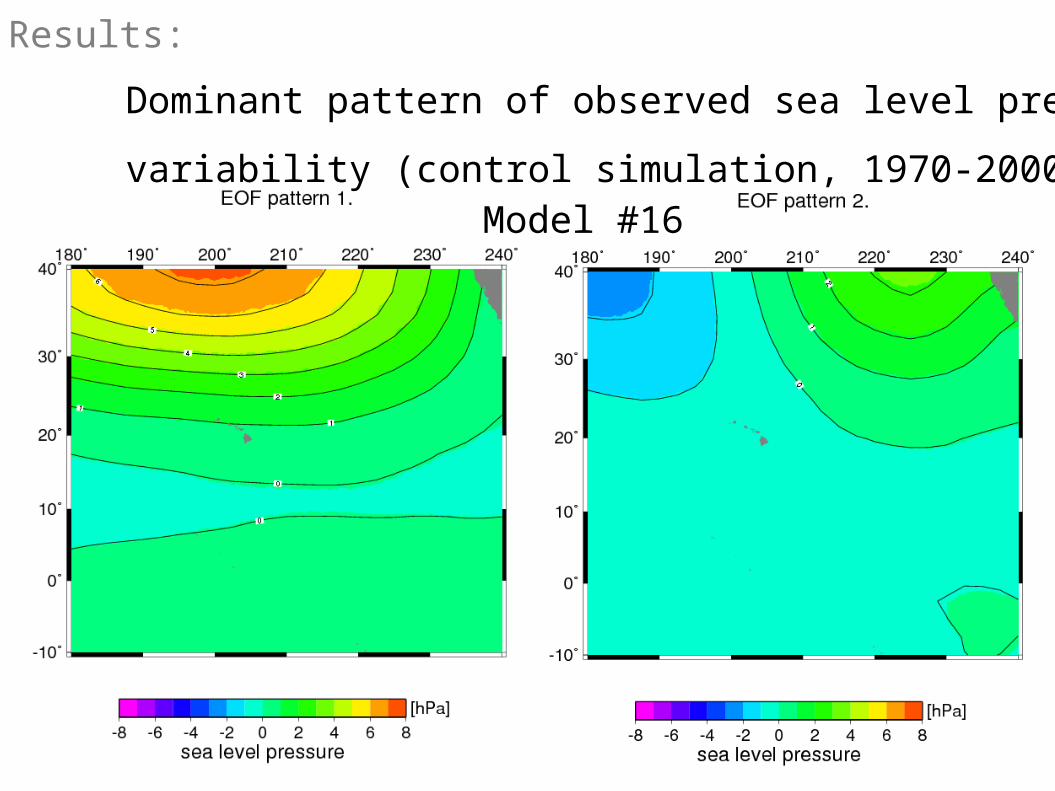
Model #16
Dominant pattern of observed sea level pressure
variability (control simulation, 1970-2000, wet season)
Results:
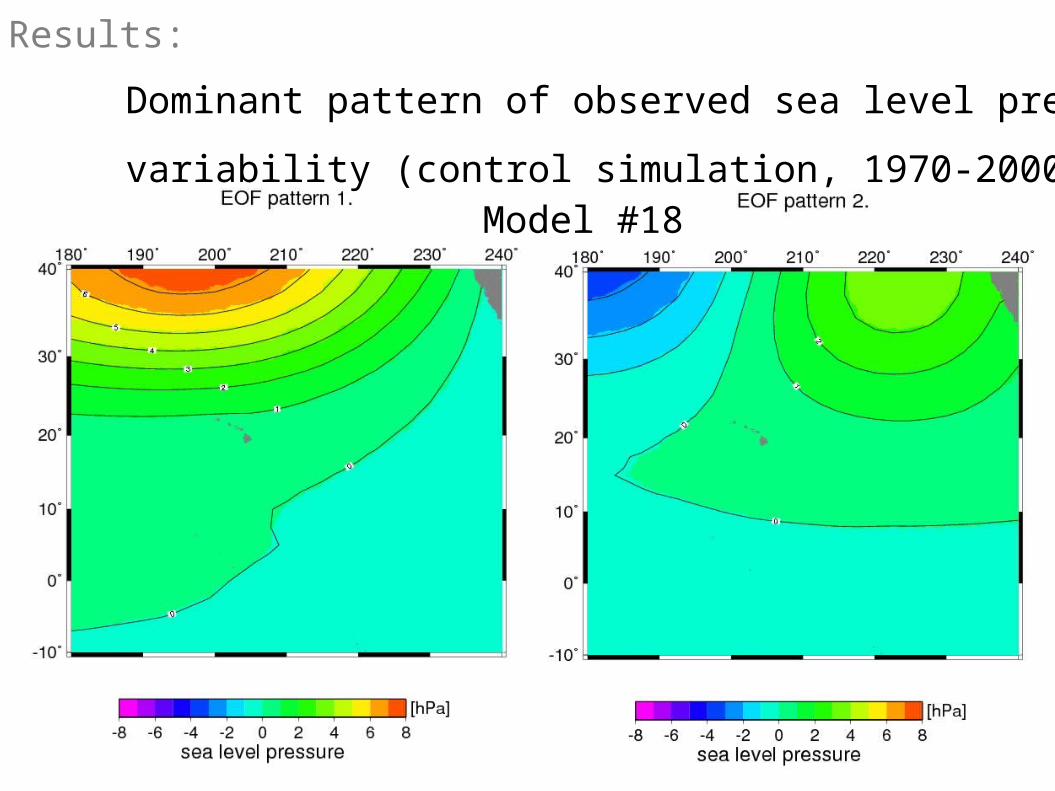
Model #18
Dominant pattern of observed sea level pressure
variability (control simulation, 1970-2000, wet season)
Results:
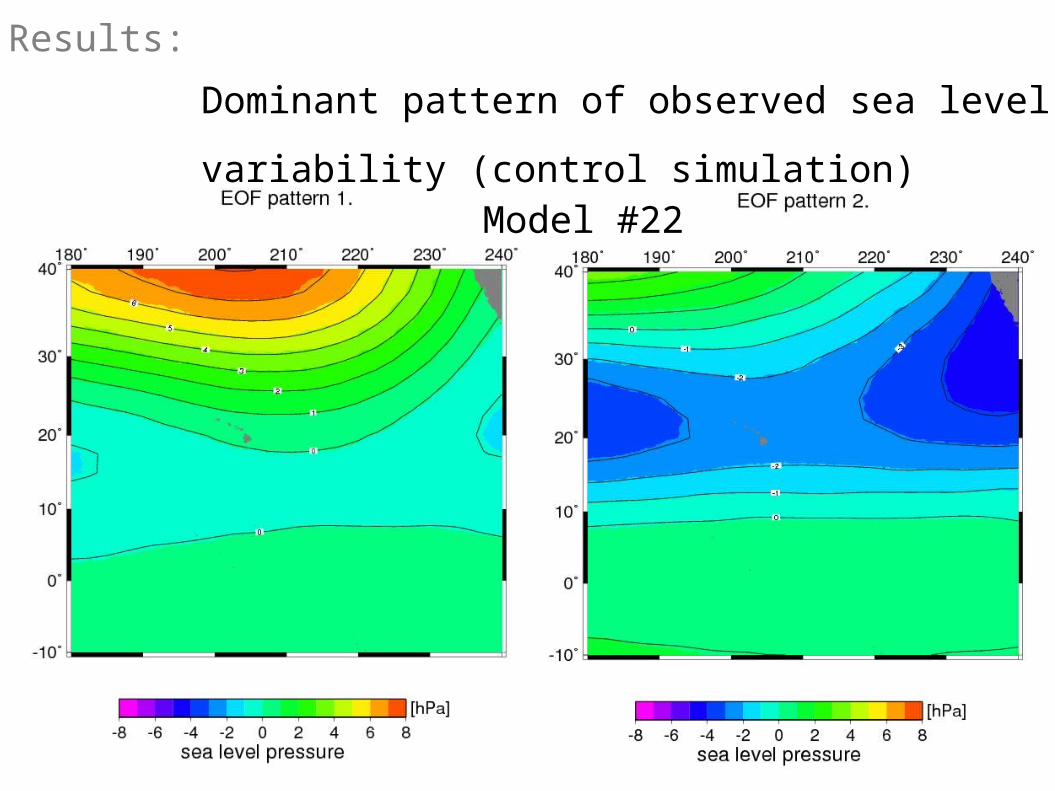
Model #22
Dominant pattern of observed sea level pressure
variability (control simulation)
Results:
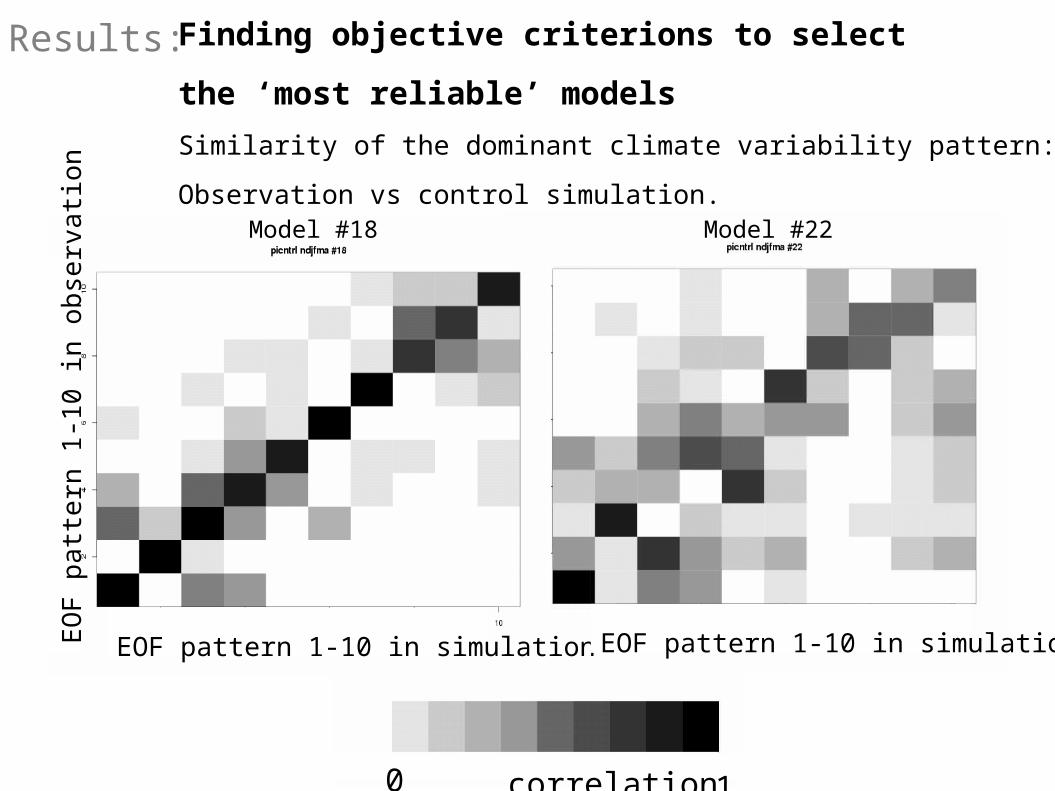
Finding objective criterions to select
the ‘most reliable’ models
Similarity of the dominant climate variability pattern:
Observation vs control simulation.
Results:
0 1 correlation
EOF pattern 1-10 in simulation EOF pattern 1-10 in simulationEO
F p
atte
rn 1
-10
in o
bse
rva
tion
Model #18 Model #22
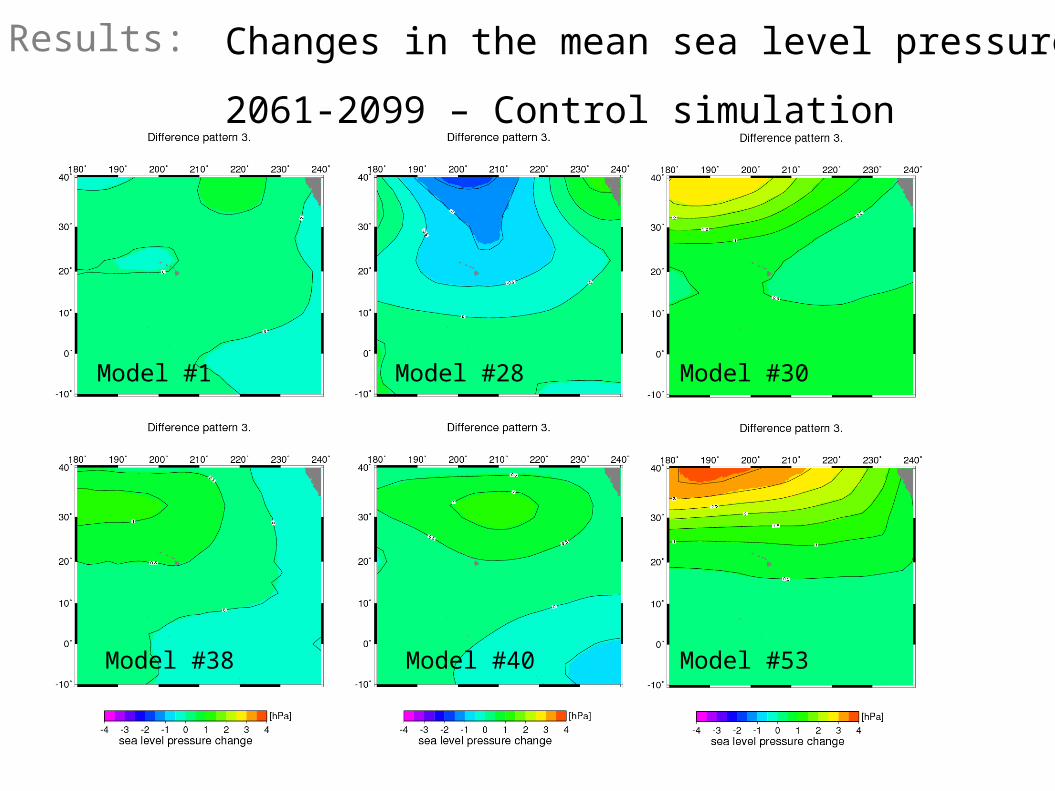
Results:
Model #1 Model #28 Model #30
Model #38 Model #40 Model #53
Changes in the mean sea level pressure
2061-2099 – Control simulation
4) Application of the transfer model
downscaled projection of rainfall changes
Results:
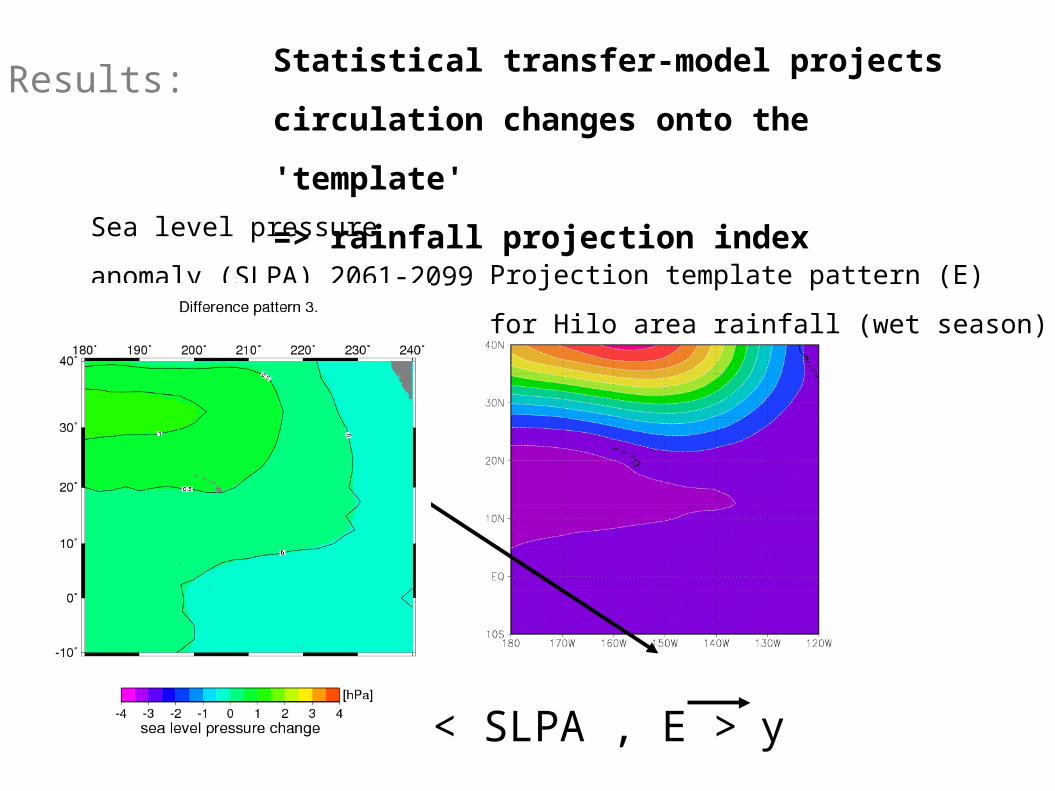
Results: Statistical transfer-model projects circulation
changes onto the 'template'
=> rainfall projection index
Sea level pressure
anomaly (SLPA) 2061-2099
< SLPA , E > y
Projection template pattern (E)
for Hilo area rainfall (wet season)
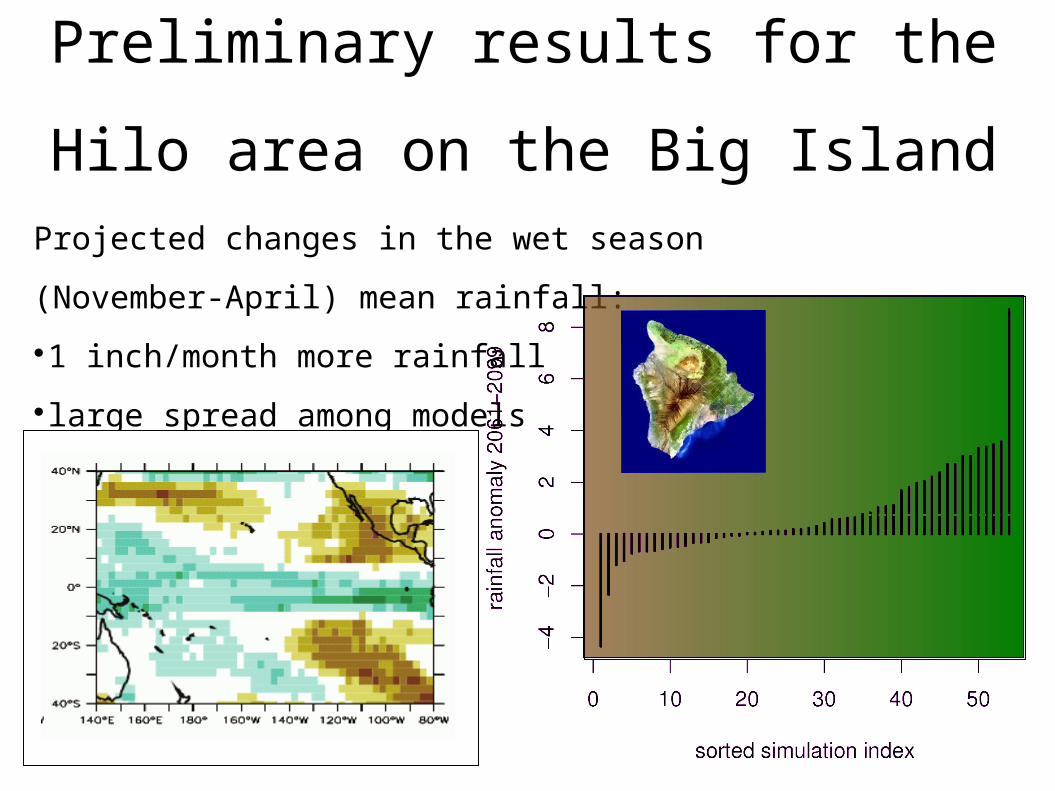
Preliminary results for the Hilo area
on the Big Island Projected changes in the wet season
(November-April) mean rainfall:
1 inch/month more rainfall
large spread among models
Summary rainfall in different Hawaiian regions are connected different large-scale
circulation pattern (‘Trade wind’, ’Kona Low’ pattern)
Statistical downscaling of sea level pressure allows first estimates for rainfall
changes
On average, small positive rainfall changes are associated with trade wind
changes
IPCC model uncertainty for Hawaii region is very large
=> downscaled uncertainty is also very large.
Future Research/Improvements Refining the regional structure of our diagnostic studies
Including other large-scale circulation information to improve the statistical
transfer model (e.g. wind field, stratification of the lower atmosphere)
Using model-weighted ensemble averages
Investigating changes in the extreme precipitation
(using daily data, instead of monthly /seasonal means)
Developing spatial maps of rainfall changes with confidence intervals.