3D Statistical Parametric Mapping of quiet sleep EEG in the first year ...

1584
INTRODUCTIONElephant feet (manus and pes) are fascinating structures becausethey combine very stiff and compliant tissues roughly distributedbetween the cranial and caudal portions of the foot, respectively(Fig.1). Thus, the mechanics of the foot should exhibit markedregional variations across a stance phase. Cranially, the five digits(as well as nails and sole/slipper) form a hoof-like structure aroundthe perimeter of the feet. Caudally and centrally, a highly compliantfibrous–fatty pad (comprising multiple connected cushions)dominates the foot area (Weissengruber et al., 2006). Furthermore,the orientations of the bones of elephant feet are highly unusual,again hinting at complex mechanical functions. The skeletal postureis best termed subunguligrade because only the tips of the phalanges(via their nails) are in approximate contact with the substrate. Yetthe functional posture is more plantigrade, especially in the morehorizontally oriented pes, because the massive foot pad andassociated structures (e.g. prepollex and prehallux or ‘predigits’)connect the proximal carpal/tarsal bones with the substrate. Thesestructures should direct some unknown portion of the groundreaction force (GRF) directly proximally rather than through thedistal phalanges, as in truly plantigrade animals (D’Aout et al., 2010;Michilsens et al., 2009; Miller et al., 2008).
Bizarre structural mechanics aside, elephant feet are interestingbecause they face extreme biomechanical constraints in order tosupport the weight of the largest land animal. Michilsens et al.presented a broad comparative dataset for mammalian foot pressuresand found that elephant feet closely fit the general trend of isometric
scaling, so their peak foot pressures should not be relatively greaterthan those of other animals (Michilsens et al., 2009). Surely theenlarged foot pad of elephants helps to distribute the pressures acrossthe foot and keep peak pressures low, but how? Are excessivelyhigh foot pressures, which may cause damage to the sole’s softtissues, mitigated more passively by the viscoelastic pad in the caudaland central parts of the elephant foot, or are they mitigatedbehaviourally, by more active control of regional foot loadingpatterns? Do foot pressure trajectories change with size, potentiallyto adapt to the scaling of pressures during growth, or do elephantsmaintain the same spatiotemporal mechanics across ontogeny?These questions are interesting from a pure scaling perspective –to understand one extreme example of how large animals supporttheir weight on their feet will improve understanding of how footsupport changes with size. Miller et al. showed that differentcomponents of the forefeet and hindfeet scale at different ontogeneticrates in elephants (Miller et al., 2008). The forefoot bones andtendons generally follow isometry or negative allometry (becomingmore slender) whereas the hindfoot bones and tendons tend to exhibitmore positive allometry (becoming more robust). Regions of thefeet also grow at different rates. The metapodial bones of the forefeet(manus) tend to grow the fastest laterally (digits 4 and 5), whereasthose of the hindfeet (pes) grow fastest medially (digit 1) andlaterally (digits 4 and 5). Based on these findings, Miller et al. (Milleret al., 2008) proposed that this scaling may indicate regional loadingon the feet and thereby differences in regional mechanics withinand between feet as well as across ontogeny.
The Journal of Experimental Biology 215, 1584-1593© 2012. Published by The Company of Biologists Ltddoi:10.1242/jeb.065862
RESEARCH ARTICLE
Statistical parametric mapping of the regional distribution and ontogenetic scaling offoot pressures during walking in Asian elephants (Elephas maximus)
Olga Panagiotopoulou1,*, Todd C. Pataky2, Zoe Hill1 and John R. Hutchinson1
1Structure and Motion Laboratory, Department of Veterinary Basic Sciences, The Royal Veterinary College, University of London,Hatfield, AL9 7TA, UK and 2Department of Bioengineering, Shinshu University, Ueda 386-8567, Japan
*Author for correspondence ([email protected])
Accepted 20 January 2012
SUMMARYFoot pressure distributions during locomotion have causal links with the anatomical and structural configurations of the foottissues and the mechanics of locomotion. Elephant feet have five toes bound in a flexible pad of fibrous tissue (digital cushion).Does this specialized foot design control peak foot pressures in such giant animals? And how does body size, such as duringontogenetic growth, influence foot pressures? We addressed these questions by studying foot pressure distributions in elephantfeet and their correlation with body mass and centre of pressure trajectories, using statistical parametric mapping (SPM), a neuro-imaging technology. Our results show a positive correlation between body mass and peak pressures, with the highest pressuresdominated by the distal ends of the lateral toes (digits 3, 4 and 5). We also demonstrate that pressure reduction in the elephantdigital cushion is a complex interaction of its viscoelastic tissue structure and its centre of pressure trajectories, because thereis a tendency to avoid rear ʻheelʼ contact as an elephant grows. Using SPM, we present a complete map of pressure distributionsin elephant feet during ontogeny by performing statistical analysis at the pixel level across the entire plantar/palmar surface. Wehope that our study will build confidence in the potential clinical and scaling applications of mammalian foot pressures, given ourfindings in support of a link between regional peak pressures and pathogenesis in elephant feet.
Supplementary material available online at http://jeb.biologists.org/cgi/content/full/215/9/1584/DC1
Key words: plantar pressure, locomotion, elephant, statistical parametric mapping, random field theory.
THE JOURNAL OF EXPERIMENTAL BIOLOGYTHE JOURNAL OF EXPERIMENTAL BIOLOGY

1585Foot pressures in walking elephants
Furthermore, elephant foot pressure mechanics have fundamentalimportance for the welfare of captive elephants worldwide. Anaccurate characterization of normal foot pressures in elephantsshould be pivotal for predicting and monitoring foot pathologiessuch as trauma, osteomyelitis, osteoarthritis and ankylosis of thejoints (Fowler and Mikota, 2006). Such pathologies are blamed forcausing 50% of mortalities in captive elephants (Csuti et al., 2001).A thorough description of foot pressures in elephants and theirrelationship with pathogenesis could also benefit the planning of
sole/nail trimming and substrate choice for elephant enclosures(Fowler and Mikota, 2006).
In this study we aimed to test four hypotheses by recording thepressure distributions on Asian elephant (Elephas maximus Linnaeus1758) feet during walking. Our study sample included an ontogeneticgrowth series of elephants to assess ontogenetic changes of footdynamics using statistical parametric mapping (SPM). Hypothesis1 addresses Miller et al.’s suggestion that the ontogenetic scalingof foot structures is correlated with pressure differences (Miller etal., 2008). If this is correct, the highest pressures should occur ondigits 4–5 in the manus and digits 1 and 4–5 in the pes, and thesepressure differences should become more pronounced withincreasing body mass.
Hypothesis 2 poses that peak pressures in the manus and pes aremaintained at a roughly constant level with increasing size, atdynamically similar speeds (normal walking; Froude number Fr~0.10 for Frv2/gl, where v is speed, g is acceleration due to gravityand l is hip height). This not only is an expectation of dynamicsimilarity theory (Alexander and Jayes, 1983) but also is expectedif material properties, especially strength, of foot sole tissues remainroughly the same across ontogeny (maintaining sufficient safetyfactors to avoid injury to the sensitive foot sole), although the scalingof pressures will be influenced by the differential growth of footsubregions (Miller et al., 2008).
Similar to the human heel fat pad, the elephant foot fat padpresumably functions as a shock absorber when the foot hits theground, as a result of its viscoelastic properties. Thus, it is expectedto reduce plantar/palmar pressures. Nevertheless, foot pressurereductions can also be achieved via increasing the surface area thatthe pressure is applied to, because pressure (P) equals force (F) persurface area (A). We thus propose hypothesis 3: reduction of pressureon the caudal and central aspect of the elephant foot fat pad is notsolely due to its viscoelastic nature but is likely to result from acomplex and dynamic interaction of behavioural preferences, asmanifested in centre of pressure (COP) trajectories and viscoelasticmaterial properties.
Finally, via hypothesis 4 we sought to determine whether theregional incidence of foot pathologies in elephants corresponds withhigh regional foot pressures. Anecdotal accounts from ourdiscussions with elephant keepers and from our post-mortem
Table 1. Subject characteristics (species: Elephas maximus) and number of experimental trials
Subject 1 Subject 2 Subject 3 Subject 4 Subject 5 Subject 6
Age 31 days 1 year 3 years 14 years 16 years 27 yearsSex M F M F F FBody mass (kg) 120 500 1042 2820 2920 3332Contact area (cm2)
Manus 198 334 559 902 933 949Pes 157 300 485 752 805 688
Mean mid-stance pressure (Ncm–2) Fore left 2.1 5.8 5.1 7.4Fore right 2.1 5.6 5.5 9.6 7.0Hind left 1.6 4.7 4.5 8.2 6.9Hind right 1.8 3.9 4.6 8.1 7.7 6.5
Total mid-stance force (% body weight)Fore left 24.9 30.9 23.1 22.9Fore right 24.3 29.7 25.8 30.0 16.9Hind left 14.1 20.6 17.9 18.0 17.4Hind right 15.5 17.3 17.3 19.0 17.4 9.3
Location Whipsnade Whipsnade Whipsnade Woburn Woburn WhipsnadeNumber of trials 104 43 33 28 32 104
Contact areas were measured from peak plantar pressure records thresholded at 0.05Ncm–2.Subjects 6 and 1 are mother and child and participated together.
Fig.1. Sagittal plane cross-section of an elephant left pes. Cranially, thefoot consists of five very stiff digits (as well as nails and sole/slipper), whichform a hoof-like structure around the perimeter of the foot. Caudally andcentrally, a highly compliant and viscoelastic fat pad dominates the footarea. For more information on elephant foot anatomy see Weissengruberet al. (Weissengruber et al., 2006).
THE JOURNAL OF EXPERIMENTAL BIOLOGYTHE JOURNAL OF EXPERIMENTAL BIOLOGY

1586
database on elephant cadaveric feet at The Royal Veterinary Collegesuggest that digits 3, 4 and 5 of the manus and pes are mostsusceptible to pathology, particularly degenerative joint disease(Csuti et al., 2001; Fowler and Mikota, 2006). If there is arelationship between pathologies and foot pressures, the highestpressures should occur in digits 3, 4 and 5 of the manus and pes,and the lowest pressures in digits 1 and 2. Our aim was not todetermine whether these pathologies truly do statisticallypredominate in digits 3, 4 and 5, which will be examined in anotherstudy, but to test whether there is an association between theseanecdotal accounts and rigorously quantified pressure patterns. Ifthe hypothesis is upheld, this will build confidence in the potentialclinical applications of elephant foot pressure analysis.
MATERIALS AND METHODSDesign
Six Asian elephants from two zoological parks in Bedfordshire, UK(the Zoological Society of London’s Whipsnade Zoo and WoburnSafari Park) were selected to participate in this study. They rangedin age and body mass from 31days and 120kg to 27years and3332kg (Table1), thus spanning an almost 28-fold range of bodymasses. Keepers gave clinically informed consent and the study wasapproved by The Royal Veterinary College’s Ethics Committee.
A 5m walkway was constructed on top of flat concrete withsufficient space for an elephant to turn at each end. A thin foampad 3m long and 0.4m wide was laid on top of the concrete at thestart of the walkway and was followed by a 1.0�0.4m pressureplate equipped with 8192 sensors (Footscan; RSscan, Olen, Belgium)and a final 1m length of foam pad. A thin black rubber coveringwas placed on top of the whole walkway to avoid recognition ofthe plate location by the elephants and their keepers. A Sony HDR(Sony, London, UK) high definition video camera was used to recordwalking speed. The camera faced perpendicular to the walkway andwas placed 5m from the COP plate. Sampling frequencies of thecamera and pressure plate were set at 25 and 250Hz, respectively.
Prior to each data collection session, the pressure plate wascalibrated with a person of known mass measured on a digital scale(±0.1kg), as per the manufacturer’s instructions. The elephants wereguided over the walkway at an overall mean steady speed of 1.0ms–1
(mean Fr 0.10) by park keepers, an average of 50 times each (seeTable1). Unsteady trials with apparent acceleration and decelerationwere excluded. The experimental techniques used did not involveor cause any discomfort to the elephants.
Data pre-processingAll subsequently described analyses were implemented in Python 2.7using NumPy 1.5.1, SciPy 0.9 and Matplotlib 1.0 (Enthought PythonDistribution version 7.0; Enthought Inc., Austin, TX, USA). The raw(x, y, time) pressure plate data were exported from the Footscan systemfor custom analysis. Single footsteps, i.e. stance phases, from eachtrial were isolated algorithmically using spatiotemporal gaps betweenclusters of non-zero pressure voxels (see supplementary materialMovie1). Henceforth, individual footsteps are referred to as ‘images’[note that these are 3D spatiotemporal images with two spatial andone temporal dimension(s)]. As the elephants’ feet were large withrespect to the size of the measurement plate and because dataacquisition (with a limited buffer size) could not always be triggeredappropriately, many images were spatially and/or temporallyincomplete. Individual images were thus manually assessed forspatiotemporal completeness according to four inclusion criteria (seeFig.2 and Table2). Images were discarded if they failed to meet eitherfull-spatial and half-temporal completeness or full-temporal and half-
O. Panagiotopoulou and others
spatial completeness (all criteria were judged qualitatively). Theremaining footsteps were manually identified as left/right andmanus/pes.
All images were spatially scaled in the direction of progressionby a factor of 1.5, using bilinear interpolation to compensate forthe non-square measurement grid of the RSscan system(7.62�5.08mm, manufacturer specified). To promote efficient andhigh-resolution homologous data comparison, the scaled imageswere spatially registered (Maintz and Viergever, 1998) within-subjects and within-feet (Fig.3). Registration aimed to re-align thefootsteps, which landed on the pressure plate in arbitrary postures,by transforming each footstep image into a standard homologous
A
B
C D
Time (frames)
5004003002001000 5004003002001000
2000
400600800
1000120014001600
2000
400600800
10001200140016001800
GR
F (
N)
Fig.2. Example image inclusion criteria. (A)Spatially complete pes (left),spatially incomplete manus (right). (B)Temporally complete ground reactionforce (GRF) vs time data from the pressure pad (left), temporallyincomplete GRF vs time data (right). (C)Rear contact of manus. (D)Forecontact of manus.
Table 2. Image inclusion criteria (see also Fig.2)
Criterion Description Notes
A Spatially complete Entire plantar surface visibleB Temporally complete Entire GRF trajectory intact; GRF
had to start and end at 0NC Rear contact Most posterior contact point visible D Fore contact Most anterior contact point visible
GRF, ground reaction force (foot area � foot pressure) extrapolated frompressure pad data.
Images that did not meet either A and 50% of B, or B and 50% of A werediscarded.
THE JOURNAL OF EXPERIMENTAL BIOLOGYTHE JOURNAL OF EXPERIMENTAL BIOLOGY

1587Foot pressures in walking elephants
space. We found that existing pedobarographic registrationalgorithms (e.g. Pataky et al., 2008; Oliveira et al., 2010) failed toperform consistently well on the elephant data, probably becausethese algorithms were developed for human feet, whose highlyasymmetric shapes offer valuable registration-relevant information.Rather than develop a new elephant-specific registration algorithm,we opted to register the images manually using a graphical-userinterface, an approach that has been shown to perform as well asoptimal algorithmic registration in humans (Pataky et al., 2008).The template foot image was presented as an isocontour (threshold0.05Ncm–2), and the source image was manually translated androtated. The template image selected for each subject and each footwas the chronologically first step that met both the A and Bspatiotemporal completion criteria (see above).
Between-subjects registration was computed by adding asymmetric spatial scaling transformation (dx, dy, d, ds where s isscale). The template foot image selected for the between-subjectsregistration was the largest and chronologically first step that metboth the A and B spatiotemporal completion criteria. Similar to thewithin-subject registration, qualitative optimal alignment acrosssubjects was conducted manually.
Following scaling and registration, all images were reduced to2D summary peak pressure (i.e. spatially maximal pressure overthe entire stance phase) images and seven homologous anatomicalregions of interest (ROI) were manually digitized (Fig.4). ROIs 1–5respectively represent digits 1–5. ROI 6 is located in the middle ofthe plantar/palmar foot surface whereas ROI 7 is located on thecaudal-most aspect of the sole (Fig.4). Peak pressures (Ncm–2) wereextracted from a 3-pixel neighbourhood surrounding each digitizedROI using a weighted Gaussian kernel mean window with astandard deviation of one pixel. SPM for hypotheses 1, 2 and 4 wasused to conduct statistical analyses at the pixel level, therebydescribing broad pressure distribution changes across the entiresurface of the sole. ROI procedures were subsequently used toexplicitly test the parts of the hypotheses that pertained to specificfoot regions. Finally, COP trajectories were used to infer behaviouralfoot-loading preferences.
Statistical analysisSPM
SPM is a digital imaging technique that is effective for analysingsmooth or piecewise-smooth dimensional field processes. Where
a single experimental observation is a lattice sample (e.g. footpressure distribution, measured over a spatial lattice), multipleobservations can, in general, be aligned such that homologousstructures overlap optimally. After such alignment, SPM conductsstatistical tests at each pixel (i.e. at each lattice node) in a mass-univariate manner (Friston et al., 2007). The result is an SPM, ora statistical parametric map, which is a lattice sampling of theunderlying statistical field. That is, just as each pixel (or latticenode) originally contained a single value of the measured variable(e.g. pressure), pixels in an SPM contain a single statistical value(usually t- or F-values). SPM has previously been used in
Original
Registered
Peak p
ressure
(N
cm
–2)
Fig.3. Example image registration for a subset of subject 3ʼs right pes steps. The grey outline indicates the orientation of the template image to which theothers were registered. Stray marks behind the heel in the second sample in particular are low-pressure records from skidding/skimming of the foot beforeheel strike.
Fore left
Hind left
Fore right
Hind right
Fig.4. Regions of interest (ROI) representing anatomical structures fromregistered images of elephant manus (fore left and right) and pedes (hindleft and right). ROIs 1–5 represent the five elephant foot digits. ROIs 6 and7 represent the middle and caudal-most aspects of the foot, respectively.Note the slight toeing-in of the manus and toeing-out of the pes.
THE JOURNAL OF EXPERIMENTAL BIOLOGYTHE JOURNAL OF EXPERIMENTAL BIOLOGY

1588
neuroimaging (Friston et al., 2007) and human foot studies(Pataky, 2008; Pataky and Goulermas, 2008; Pataky et al., 2008)but it has never been used for animal studies and in particularnever for the study of the foot pressure distribution of elephantsor across ontogeny in mammals.
Here, we used linear regression between ontogenetic factors(body mass) and pressure, so the present SPMs contain t-valuesthat represent the ratio between the regression slope and thevariance about that regression line. The significance of the SPMwas assessed using random field theory, which computes andassigns P-values to supra-threshold clusters (i.e. pixel clustersthat survived a t threshold) based on their spatial extent. Theclusters that exceeded the critical cluster size provided evidenceof non-random processes induced by experimental manipulation.Subsequent ROI analyses, which probed specific areas of the SPMbased on the present anatomically specific hypotheses, wereconducted using linear mixed models (SPSS 1.8, IBMCorporation, Armonk, NY, USA). Statistical significance was setat P0.05.
O. Panagiotopoulou and others
COPWe computed the resultant contact point, or COP, at foot strike byinitially computing the mean peak pressure image for each foot acrosssubjects and by thresholding these images at 0.5Ncm–2. We thenmanually digitized the cranial-most and caudal-most points along thefoot’s longitudinal axis and computed the whole COP trajectory asthe pressure-weighted image centroid. Lastly, we resolved the COPlocation at time0 (i.e. initial foot contact) into the percentage distancebetween the cranial- and caudal-most foot points.
RESULTSSPM
The distribution of the mean peak pressure for each subject andeach foot is shown in Fig.5. The youngest and smallest elephant(subject 1) has significantly lower mean whole-foot peak pressurevalues than all other elephants (P<0.05; Table1). Subjects 2 and 3,who were close in age and body mass, display significantly different(P<0.05) pressure values to subjects 1 and 6. Specifically, thepressure values of subjects 2 and 3 are higher than those of subject
Fore
left
Hin
d le
ftF
ore
rig
ht
Hin
d r
igh
t
Peak p
ressure
(N
cm
–2)
N=14 N=12 N=6 N=2
N=4 N=12 N=1
N=10 N=7 N=5
N=8 N=14 N=8 N=1
Mass
Age
120 kg
0.1 year
Subject 1
500 kg
1 year
Subject 2
1042 kg
3 years
Subject 3
2820 kg
14 years
Subject 4
2920 kg
16 years
Subject 5
3332 kg
27 years
Subject 6
Fig.5. Mean peak pressure images for each subject and each foot. The number of observations (N) meeting the ʻspatial and temporal completenessʼ criteriais indicated for each foot. Missing data are due to the lack of a large sample size, which is required to produce the mean peak pressure images.Nevertheless, peak pressure values were exported for all individuals and used for the statistical analysis.
THE JOURNAL OF EXPERIMENTAL BIOLOGYTHE JOURNAL OF EXPERIMENTAL BIOLOGY

1589Foot pressures in walking elephants
1, and lower than those of subject 6 (Table1). Subjects 4 and 5exhibit significant differences in pressure values from those of thesmallest elephants (higher than values for subjects 1, 2 and 3).
Ideally, for a comparative ontogenetic analysis of pressuredistributions, a larger sample size would be needed for subjects 4,5 and 6. Constraints due to the large size of the feet of adult elephantscoupled with the small size of the pressure pad prevented us fromcollecting more data for the adult elephants. Nevertheless, thislimitation should not have an effect on our general results becausepressures across the whole foot have a statistically significantpositive correlation with body mass (i.e. they increase with bodymass) (Figs6, 7), but pressure increases are not limited to aparticular area, spanning broadly over most of each foot’s surface(Figs6, 7).
Specifically, ROIs 3, 4 and 5 for the manus and pes exhibitsignificantly higher pressure values (P<0.05) than all other ROIs(Fig.8). In contrast, the medial aspects of the manus (Fig.8A) andpes (Fig.8B) (i.e. ROI 1 and 2) have the lowest pressure values,which are not significantly different in magnitude (P>0.9) from thoseof ROIs 6 and 7, located at the middle and caudal-most part of thefoot, respectively; this finding (Fig.8) is also reflected in the SPMresults (Figs6, 7). However, limiting analysis to specific pointsneglects neighbouring regions, which may reach significance. Thus,contrary to SPM, which provides a complete reflection ofplantar/palmar pressure distributions across the entire foot, ROIanalysis can be biased if used independently and not as a supplementto SPM results.
SPM whole-foot peak pressure magnitudes are, on average, notsignificantly different (P>0.05) between feet. While the pressurehistograms have highly positive skewness (i.e. many low-pressurevalues, fewer mid-range values, and even fewer high-pressurevalues), the mean metric is presently used because of its physicalas opposed to its statistical meaning. That is, this metric representsthe ratio of the instantaneous vertical GRF to the instantaneouscontact area, and this physical concept is independent of theunderlying distribution. In general, the right feet show higher
Fore left
Hind left
Fore right
Hind right
SP
M(t)
0
10
–10
Fore left
Hind left
Fore right
Hind right
SP
M(t)P<0.005
P<0.05
Fig.6. The raw statistical parametric mapping (SPM)(t) results usingrandom field theory. SPM(t) values represent the ratio between theregression slope and the variance about that regression line. Warm colours(red/yellow) display a positive correlation between body mass andpressure; cold colours (blue/black) show a negative correlation.
Fig.7. SPM(t) with cluster-specific P-values. Here P-valuesindicate the probability with which a supra-threshold cluster(|t |>3.0) of a given size could have occurred by chance,given the foot size and the pressure field smoothness.Clusters with P>0.05 have been removed.
THE JOURNAL OF EXPERIMENTAL BIOLOGYTHE JOURNAL OF EXPERIMENTAL BIOLOGY

1590
mean peak pressure magnitudes (by about 10%) than the left feetbut this difference is not significant (P>0.05) and there isconsiderable intraspecific variation (Table3). The manus exhibitsignificantly higher (P<0.05) mean peak pressure magnitudes thatthe pedes (by about 5%) for all subjects (Table3). Also, asexpected the total mid-stance force as a percentage of body weight
O. Panagiotopoulou and others
is greater for the manus than for the pedes of all subjects; butnote that these values do not generally add up to 100% of bodyweight (26–78% total for percentage force data in Table1; exceptfor subject 2, 98.5%) because of incomplete and variable data,so generalizations are difficult to establish. The statistical analysisfrom ROI (zone-based) data agrees with the SPM analysis in thatmean regional peak pressure values are significantly higher(P<0.05) for the manus than the pes. However, in contrast to theforefoot vs hindfoot pressure difference of 5% found in the SPManalysis, our ROI analysis finds an average difference of 73%(mean ± s.e.m.: manus 18±13Ncm–2, pes 10.4±6.7Ncm–2), whichis largely explained by higher mean pressures in the manual digits,especially ROIs 3–5 (Fig.8).
The SPM and the supplementary ROI results of our study partiallysupport hypothesis 1 because although there is a positive correlationbetween body mass and pressure magnitudes, the highest pressuresare encountered in ROIs (digits) 3 and 5 and to a lesser degree 4,and the lowest pressures are displayed in ROIs 1, 2, 6 and 7. Theseresults also agree with hypothesis 4: greater peak pressures in ROIs3–5 correspond with supposedly greater foot pathologies in digits3–5 for the manus and the pes. Hypothesis 2 is rejected becausepeak pressures increase with body mass.
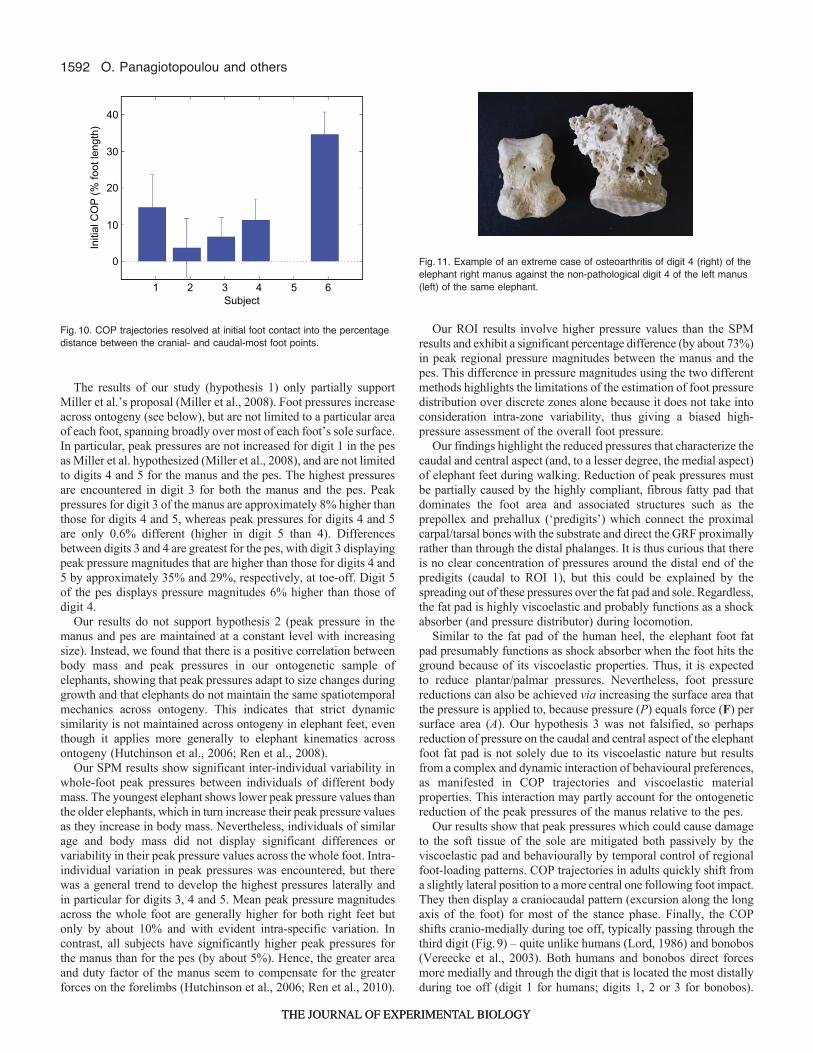
COPFig.9 shows COP trajectories for each subject and each foot. COPlocations at initial foot contact, relative to foot length, are displayedin Fig.10. Aside from the youngest elephant (subject 1), thereappears to be an increasing tendency to avoid rear ‘heel’ contact asan elephant grows. Instead, a more anterior initial contact point ingrowing elephants (Fig.9) implies that the foot is closer to horizontalat initial contact, and thus that contact pressures are dissipated overa larger area during very early stance. This may represent aprotective adaptation to avoid high focal tissue stresses. Subject 1displays COP trajectories different from those of the rest of thesubjects, probably as a result of its somewhat awkward gait (visuallyapparent during experiments, and attributed to its young age).Overall, our results are consistent with hypothesis 3.
DISCUSSIONFoot pressure distributions in elephants were examined in a previousstudy using traditional statistical approaches of a very limited dataset (2 individuals, 3 footsteps) as part of a comparative analysis ofmammalian foot pressures (Michilsens et al., 2009). Whilst thatstudy advanced our understanding of peak pressure distribution in
log Body mass
2.8 3.0 3.2 3.4 3.62.0 2.2 2.4 2.60
0.2
0.4
0.6
0.8
1.0
1.2
1.4
1.6 B2.8 3.0 3.2 3.4 3.62.0 2.2 2.4 2.6
0
0.2
0.4
0.6
0.8
1.0
1.8
2.0
1.2
1.4
1.6
A
log
Pre
ssu
re
ROI 1
ROI 2
ROI 3
ROI 4
ROI 5
ROI 6
ROI 7
Table 3. Pairwise comparisons of mean peak pressure between feet
Mean peak pressure Pairwise Mean differenceFoot (±s.e.m.) (Ncm–2) comparisons between feet (±s.e.m.) Significance†
Fore left 6.2±0.15 Fore right –0.065±0.161 1.000Hind left 0.689±0.175* 0.001
Hind right 0.867±0.153* 0.000Fore right 6.3±0.12 Fore left 0.065±0.161 1.000
Hind left 0.755±0.165* 0.000Hind right 0.932±0.141* 0.000
Hind left 5.5±0.14 Fore left –0.689±0.175* 0.001Fore right –0.755±0.165* 0.000Hind right 0.178±0.157 1.000
Hind right 5.4±0.11 Fore left –0.867±0.153* 0.000Fore right –0.932±0.141* 0.000Hind left –0.178±0.157 1.000
*Mean difference significant at the 0.05 level.†Adjustment for multiple comparisons was conducted using Bonferroni corrections.
Fig.8. Linear regressions (with r2 values) for log pressures (Ncm–2) of allROIs against log body mass (kg) for elephant manus (A) and pes (B). Allregressions were significant at P<0.05. (A)Manus: ROI 1,y0.4763x–0.5098, r20.75; ROI 2, y0.5248x–0.7504, r20.91; ROI 3,y0.359x+0.431, r20.75; ROI 4, y0.3877x+0.1552, r20.82; ROI 5,y0.3742x+0.2741, r20.94; ROI 6, y0.4485x–0.5023, r20.84; ROI 7,y0.3983x–0.5452, r20.92. (B)Pes: ROI 1, y0.3675x–0.638, r20.77; ROI2, y0.3629x–0.3927, r20.91; ROI 3, y0.2961x+0.4546, r20.87; ROI 4,y0.2863x+0.1247, r20.58; ROI 5, y0.2585x+0.2735, r20.45; ROI 6,y0.4131x–0.4449, r20.79; ROI 7, y0.3442x–0.1446, r20.86.
THE JOURNAL OF EXPERIMENTAL BIOLOGYTHE JOURNAL OF EXPERIMENTAL BIOLOGY

1591Foot pressures in walking elephants
mammalian feet during walking, such approaches have theirlimitations. Characterization of foot pressure distribution wasconducted over discrete zones, assuming that these are functionallyindependent, and thus overlooking intra-zone variability. Such alimitation could be vital for studies with clinical, or very specific,applications, such as when the link between pathogenesis or otherbiomechanical factors and peak pressure distribution is assessed.
Here, we studied the distribution and scaling of foot sole pressuresand their possible links to pathologies in walking elephants usingSPM. In contrast to traditional statistical approaches, SPM allowsone to conduct statistical tests at the same spatial resolution as theoriginal dataset, thereby avoiding the assumption that anatomicalregions within elephant feet are functionally independent. Instead,SPM takes into account the statistical correlation amongstneighbouring pixels and summarizes complex pressure field changesas a field-wide statistical map, thereby maintaining anatomicalobjectivity. This objectivity is a crucial element for thoroughlyunderstanding the mechanical variation of elephant feet duringontogeny and to examine the almost unstudied potential linkbetween foot pressures and pathogenesis in large mammals.Furthermore, a pixel-level statistical analysis for the quantificationof plantar/palmar pressure distributions in elephants, as the largest
living land mammals, is essential for a more complete understandingof the correlation between ontogenetic scaling of foot structures andregional pressure variations. It could even aid predictions of howthe feet of large extinct animals (e.g. sauropod dinosaurs) may havefunctioned or how elephant foot mechanics evolved, and thus couldtest how well the general principles formulated for extant cladesapply to other lineages (Alexander et al., 1986); how reliably canfoot function be reconstructed from form?
Miller et al. quantified the shape changes in elephant feet withincreasing body mass, showing that different components of the manusand pes scale at different ontogenetic rates (Miller et al., 2008). Themanual bones follow isometry or negative allometry (becoming moreslender), whilst the pedal bones tend to exhibit more positiveallometry (Miller et al., 2008). Their study also showed that regionsof the feet grow at different rates. The manual bones tend to growfastest laterally (digits 4 and 5), whilst the pedal bones grow fastestmedially (digit 1) and laterally (digits 4 and 5). Miller and colleaguesattributed such growth differences to the variations in the mechanicsthat elephant feet experience during locomotion, and speculated thatwhilst regional pressure differences should increase with body mass,the highest pressures should occur on digits 4 and 5 in the manus anddigits 1, 4 and 5 in the pes (Miller et al., 2008).
Fore
left
Hin
d le
ftF
ore
rig
ht
Hin
d r
igh
t
N=14 N=11 N=4 N=2
N=3 N=12 N=1
N=10 N=7 N=4
N=8 N=14 N=8 N=1
Mass
Age
120 kg
0.1 year
Subject 1
500 kg
1 year
Subject 2
1042 kg
3 years
Subject 3
2820 kg
14 years
Subject 4
2920 kg
16 years
Subject 5
3332 kg
27 years
Subject 6
Fig.9. Centre of pressure (COP) trajectories for each subject and each foot. Red lines indicate COPs from individual steps, and green lines indicate themean COP trajectory. The number of observations meeting the spatial and temporal completeness criteria (N) is indicated for each foot. Missing data aredue to the lack of a large sample size, which is required to produce the average peak pressure images. Nevertheless, peak pressure values were exportedfor all individuals and used for the statistical analysis.
THE JOURNAL OF EXPERIMENTAL BIOLOGYTHE JOURNAL OF EXPERIMENTAL BIOLOGY
1592
The results of our study (hypothesis 1) only partially supportMiller et al.’s proposal (Miller et al., 2008). Foot pressures increaseacross ontogeny (see below), but are not limited to a particular areaof each foot, spanning broadly over most of each foot’s sole surface.In particular, peak pressures are not increased for digit 1 in the pesas Miller et al. hypothesized (Miller et al., 2008), and are not limitedto digits 4 and 5 for the manus and the pes. The highest pressuresare encountered in digit 3 for both the manus and the pes. Peakpressures for digit 3 of the manus are approximately 8% higher thanthose for digits 4 and 5, whereas peak pressures for digits 4 and 5are only 0.6% different (higher in digit 5 than 4). Differencesbetween digits 3 and 4 are greatest for the pes, with digit 3 displayingpeak pressure magnitudes that are higher than those for digits 4 and5 by approximately 35% and 29%, respectively, at toe-off. Digit 5of the pes displays pressure magnitudes 6% higher than those ofdigit 4.
Our results do not support hypothesis 2 (peak pressure in themanus and pes are maintained at a constant level with increasingsize). Instead, we found that there is a positive correlation betweenbody mass and peak pressures in our ontogenetic sample ofelephants, showing that peak pressures adapt to size changes duringgrowth and that elephants do not maintain the same spatiotemporalmechanics across ontogeny. This indicates that strict dynamicsimilarity is not maintained across ontogeny in elephant feet, eventhough it applies more generally to elephant kinematics acrossontogeny (Hutchinson et al., 2006; Ren et al., 2008).
Our SPM results show significant inter-individual variability inwhole-foot peak pressures between individuals of different bodymass. The youngest elephant shows lower peak pressure values thanthe older elephants, which in turn increase their peak pressure valuesas they increase in body mass. Nevertheless, individuals of similarage and body mass did not display significant differences orvariability in their peak pressure values across the whole foot. Intra-individual variation in peak pressures was encountered, but therewas a general trend to develop the highest pressures laterally andin particular for digits 3, 4 and 5. Mean peak pressure magnitudesacross the whole foot are generally higher for both right feet butonly by about 10% and with evident intra-specific variation. Incontrast, all subjects have significantly higher peak pressures forthe manus than for the pes (by about 5%). Hence, the greater areaand duty factor of the manus seem to compensate for the greaterforces on the forelimbs (Hutchinson et al., 2006; Ren et al., 2010).
O. Panagiotopoulou and others
Our ROI results involve higher pressure values than the SPMresults and exhibit a significant percentage difference (by about 73%)in peak regional pressure magnitudes between the manus and thepes. This difference in pressure magnitudes using the two differentmethods highlights the limitations of the estimation of foot pressuredistribution over discrete zones alone because it does not take intoconsideration intra-zone variability, thus giving a biased high-pressure assessment of the overall foot pressure.
Our findings highlight the reduced pressures that characterize thecaudal and central aspect (and, to a lesser degree, the medial aspect)of elephant feet during walking. Reduction of peak pressures mustbe partially caused by the highly compliant, fibrous fatty pad thatdominates the foot area and associated structures such as theprepollex and prehallux (‘predigits’) which connect the proximalcarpal/tarsal bones with the substrate and direct the GRF proximallyrather than through the distal phalanges. It is thus curious that thereis no clear concentration of pressures around the distal end of thepredigits (caudal to ROI 1), but this could be explained by thespreading out of these pressures over the fat pad and sole. Regardless,the fat pad is highly viscoelastic and probably functions as a shockabsorber (and pressure distributor) during locomotion.
Similar to the fat pad of the human heel, the elephant foot fatpad presumably functions as shock absorber when the foot hits theground because of its viscoelastic properties. Thus, it is expectedto reduce plantar/palmar pressures. Nevertheless, foot pressurereductions can also be achieved via increasing the surface area thatthe pressure is applied to, because pressure (P) equals force (F) persurface area (A). Our hypothesis 3 was not falsified, so perhapsreduction of pressure on the caudal and central aspect of the elephantfoot fat pad is not solely due to its viscoelastic nature but resultsfrom a complex and dynamic interaction of behavioural preferences,as manifested in COP trajectories and viscoelastic materialproperties. This interaction may partly account for the ontogeneticreduction of the peak pressures of the manus relative to the pes.
Our results show that peak pressures which could cause damageto the soft tissue of the sole are mitigated both passively by theviscoelastic pad and behaviourally by temporal control of regionalfoot-loading patterns. COP trajectories in adults quickly shift froma slightly lateral position to a more central one following foot impact.They then display a craniocaudal pattern (excursion along the longaxis of the foot) for most of the stance phase. Finally, the COPshifts cranio-medially during toe off, typically passing through thethird digit (Fig.9) – quite unlike humans (Lord, 1986) and bonobos(Vereecke et al., 2003). Both humans and bonobos direct forcesmore medially and through the digit that is located the most distallyduring toe off (digit 1 for humans; digits 1, 2 or 3 for bonobos).
Initia
l C
OP
(%
fo
ot le
ng
th)
1 2 3 4 5 6
Subject
0
10
20
30
40
Fig.10. COP trajectories resolved at initial foot contact into the percentagedistance between the cranial- and caudal-most foot points.
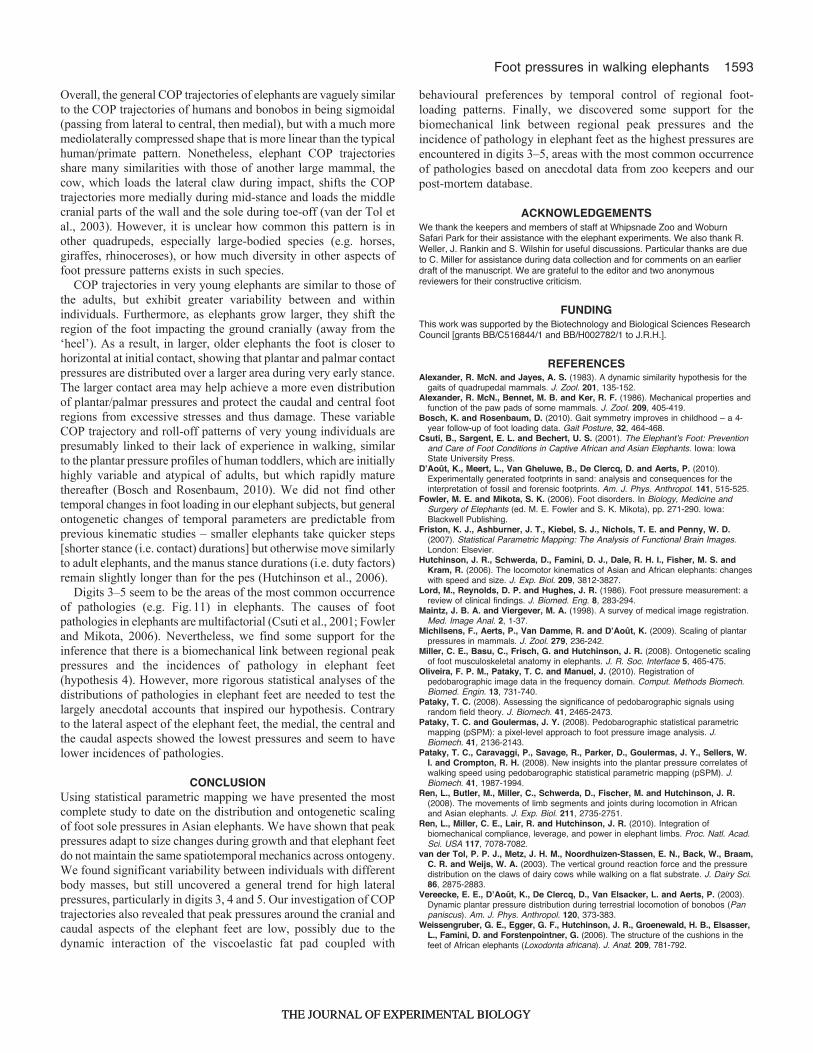
Fig.11. Example of an extreme case of osteoarthritis of digit 4 (right) of theelephant right manus against the non-pathological digit 4 of the left manus(left) of the same elephant.
THE JOURNAL OF EXPERIMENTAL BIOLOGYTHE JOURNAL OF EXPERIMENTAL BIOLOGY
1593Foot pressures in walking elephants
Overall, the general COP trajectories of elephants are vaguely similarto the COP trajectories of humans and bonobos in being sigmoidal(passing from lateral to central, then medial), but with a much moremediolaterally compressed shape that is more linear than the typicalhuman/primate pattern. Nonetheless, elephant COP trajectoriesshare many similarities with those of another large mammal, thecow, which loads the lateral claw during impact, shifts the COPtrajectories more medially during mid-stance and loads the middlecranial parts of the wall and the sole during toe-off (van der Tol etal., 2003). However, it is unclear how common this pattern is inother quadrupeds, especially large-bodied species (e.g. horses,giraffes, rhinoceroses), or how much diversity in other aspects offoot pressure patterns exists in such species.
COP trajectories in very young elephants are similar to those ofthe adults, but exhibit greater variability between and withinindividuals. Furthermore, as elephants grow larger, they shift theregion of the foot impacting the ground cranially (away from the‘heel’). As a result, in larger, older elephants the foot is closer tohorizontal at initial contact, showing that plantar and palmar contactpressures are distributed over a larger area during very early stance.The larger contact area may help achieve a more even distributionof plantar/palmar pressures and protect the caudal and central footregions from excessive stresses and thus damage. These variableCOP trajectory and roll-off patterns of very young individuals arepresumably linked to their lack of experience in walking, similarto the plantar pressure profiles of human toddlers, which are initiallyhighly variable and atypical of adults, but which rapidly maturethereafter (Bosch and Rosenbaum, 2010). We did not find othertemporal changes in foot loading in our elephant subjects, but generalontogenetic changes of temporal parameters are predictable fromprevious kinematic studies – smaller elephants take quicker steps[shorter stance (i.e. contact) durations] but otherwise move similarlyto adult elephants, and the manus stance durations (i.e. duty factors)remain slightly longer than for the pes (Hutchinson et al., 2006).
Digits 3–5 seem to be the areas of the most common occurrenceof pathologies (e.g. Fig.11) in elephants. The causes of footpathologies in elephants are multifactorial (Csuti et al., 2001; Fowlerand Mikota, 2006). Nevertheless, we find some support for theinference that there is a biomechanical link between regional peakpressures and the incidences of pathology in elephant feet(hypothesis 4). However, more rigorous statistical analyses of thedistributions of pathologies in elephant feet are needed to test thelargely anecdotal accounts that inspired our hypothesis. Contraryto the lateral aspect of the elephant feet, the medial, the central andthe caudal aspects showed the lowest pressures and seem to havelower incidences of pathologies.
CONCLUSIONUsing statistical parametric mapping we have presented the mostcomplete study to date on the distribution and ontogenetic scalingof foot sole pressures in Asian elephants. We have shown that peakpressures adapt to size changes during growth and that elephant feetdo not maintain the same spatiotemporal mechanics across ontogeny.We found significant variability between individuals with differentbody masses, but still uncovered a general trend for high lateralpressures, particularly in digits 3, 4 and 5. Our investigation of COPtrajectories also revealed that peak pressures around the cranial andcaudal aspects of the elephant feet are low, possibly due to thedynamic interaction of the viscoelastic fat pad coupled with
behavioural preferences by temporal control of regional foot-loading patterns. Finally, we discovered some support for thebiomechanical link between regional peak pressures and theincidence of pathology in elephant feet as the highest pressures areencountered in digits 3–5, areas with the most common occurrenceof pathologies based on anecdotal data from zoo keepers and ourpost-mortem database.
ACKNOWLEDGEMENTSWe thank the keepers and members of staff at Whipsnade Zoo and WoburnSafari Park for their assistance with the elephant experiments. We also thank R.Weller, J. Rankin and S. Wilshin for useful discussions. Particular thanks are dueto C. Miller for assistance during data collection and for comments on an earlierdraft of the manuscript. We are grateful to the editor and two anonymousreviewers for their constructive criticism.
FUNDINGThis work was supported by the Biotechnology and Biological Sciences ResearchCouncil [grants BB/C516844/1 and BB/H002782/1 to J.R.H.].
REFERENCESAlexander, R. McN. and Jayes, A. S. (1983). A dynamic similarity hypothesis for the
gaits of quadrupedal mammals. J. Zool. 201, 135-152.Alexander, R. McN., Bennet, M. B. and Ker, R. F. (1986). Mechanical properties and
function of the paw pads of some mammals. J. Zool. 209, 405-419.Bosch, K. and Rosenbaum, D. (2010). Gait symmetry improves in childhood – a 4-
year follow-up of foot loading data. Gait Posture, 32, 464-468.Csuti, B., Sargent, E. L. and Bechert, U. S. (2001). The Elephantʼs Foot: Prevention
and Care of Foot Conditions in Captive African and Asian Elephants. Iowa: IowaState University Press.
DʼAoût, K., Meert, L., Van Gheluwe, B., De Clercq, D. and Aerts, P. (2010).Experimentally generated footprints in sand: analysis and consequences for theinterpretation of fossil and forensic footprints. Am. J. Phys. Anthropol. 141, 515-525.
Fowler, M. E. and Mikota, S. K. (2006). Foot disorders. In Biology, Medicine andSurgery of Elephants (ed. M. E. Fowler and S. K. Mikota), pp. 271-290. Iowa:Blackwell Publishing.
Friston, K. J., Ashburner, J. T., Kiebel, S. J., Nichols, T. E. and Penny, W. D.(2007). Statistical Parametric Mapping: The Analysis of Functional Brain Images.London: Elsevier.
Hutchinson, J. R., Schwerda, D., Famini, D. J., Dale, R. H. I., Fisher, M. S. andKram, R. (2006). The locomotor kinematics of Asian and African elephants: changeswith speed and size. J. Exp. Biol. 209, 3812-3827.
Lord, M., Reynolds, D. P. and Hughes, J. R. (1986). Foot pressure measurement: areview of clinical findings. J. Biomed. Eng. 8, 283-294.
Maintz, J. B. A. and Viergever, M. A. (1998). A survey of medical image registration.Med. Image Anal. 2, 1-37.
Michilsens, F., Aerts, P., Van Damme, R. and DʼAoût, K. (2009). Scaling of plantarpressures in mammals. J. Zool. 279, 236-242.
Miller, C. E., Basu, C., Frisch, G. and Hutchinson, J. R. (2008). Ontogenetic scalingof foot musculoskeletal anatomy in elephants. J. R. Soc. Interface 5, 465-475.
Oliveira, F. P. M., Pataky, T. C. and Manuel, J. (2010). Registration ofpedobarographic image data in the frequency domain. Comput. Methods Biomech.Biomed. Engin. 13, 731-740.
Pataky, T. C. (2008). Assessing the significance of pedobarographic signals usingrandom field theory. J. Biomech. 41, 2465-2473.
Pataky, T. C. and Goulermas, J. Y. (2008). Pedobarographic statistical parametricmapping (pSPM): a pixel-level approach to foot pressure image analysis. J.Biomech. 41, 2136-2143.
Pataky, T. C., Caravaggi, P., Savage, R., Parker, D., Goulermas, J. Y., Sellers, W.I. and Crompton, R. H. (2008). New insights into the plantar pressure correlates ofwalking speed using pedobarographic statistical parametric mapping (pSPM). J.Biomech. 41, 1987-1994.
Ren, L., Butler, M., Miller, C., Schwerda, D., Fischer, M. and Hutchinson, J. R.(2008). The movements of limb segments and joints during locomotion in Africanand Asian elephants. J. Exp. Biol. 211, 2735-2751.
Ren, L., Miller, C. E., Lair, R. and Hutchinson, J. R. (2010). Integration ofbiomechanical compliance, leverage, and power in elephant limbs. Proc. Natl. Acad.Sci. USA 117, 7078-7082.
van der Tol, P. P. J., Metz, J. H. M., Noordhuizen-Stassen, E. N., Back, W., Braam,C. R. and Weijs, W. A. (2003). The vertical ground reaction force and the pressuredistribution on the claws of dairy cows while walking on a flat substrate. J. Dairy Sci.86, 2875-2883.
Vereecke, E. E., DʼAoût, K., De Clercq, D., Van Elsacker, L. and Aerts, P. (2003).Dynamic plantar pressure distribution during terrestrial locomotion of bonobos (Panpaniscus). Am. J. Phys. Anthropol. 120, 373-383.
Weissengruber, G. E., Egger, G. F., Hutchinson, J. R., Groenewald, H. B., Elsasser,L., Famini, D. and Forstenpointner, G. (2006). The structure of the cushions in thefeet of African elephants (Loxodonta africana). J. Anat. 209, 781-792.
THE JOURNAL OF EXPERIMENTAL BIOLOGYTHE JOURNAL OF EXPERIMENTAL BIOLOGY