Statistical Overview of the Canadian Honey and Bee Industry and ...

Statistical Overview of the Canadian Honey and Bee Industry 2019 Prepared by: Crops and Horticulture Division Agriculture and Agri-Food Canada June 2020

ii
© Her Majesty the Queen in Right of Canada, represented by the Minister of Agriculture and Agri-Food, (2020). Electronic version available at www.agr.gc.ca/horticulture_e ISSN: 2562-8828 AAFC No. 13034E Paru également en français sous le titre Aperçu statistique de l’industrie apicole canadienne, 2019 ISSN: 2562-8836 no d’AAC: 13034F For more information, reach us at www.agr.gc.ca or call us toll-free at 1-855-773-0241.

iii
Table of Contents Overview ....................................................................................................................................................... 1 1. Production ................................................................................................................................................. 3
1.1. Number of beekeepers by province ................................................................................................... 3 1.2. Number of beekeepers by province – percent share, 2019 ............................................................... 3 1.3. Number of colonies by province ......................................................................................................... 4 1.4. Number of colonies by province – percent share, 2019 ..................................................................... 4 1.5. Number of beekeepers and number of colonies by province ............................................................ 5 1.6. Total honey production by province – thousands of pounds ............................................................. 6 1.7. Total honey production by province – percent share, 2019 ............................................................... 6 1.8. Production value of honey by province – thousands of Canadian dollars ......................................... 7 1.9. Production value of honey by province – percent share, 2019 .......................................................... 7
2. Trade ......................................................................................................................................................... 8 2.1. Trade balance .................................................................................................................................... 8
2.1.1. Canada’s honey trade balance – thousands of Canadian dollars ............................................... 8 2.2. Exports ............................................................................................................................................... 9
2.2.1. Canada’s honey exports by province – value (thousands of Canadian dollars) ......................... 9 2.2.2. Canada’s honey exports by province – percent share, 2019 ...................................................... 9 2.2.3. Canada's honey exports by province - quantity (metric tonnes)................................................ 10 2.2.4. Canada’s top 10 honey export destinations – value (thousands of Canadian dollars) ............. 10 2.2.5. Canada’s top honey export destinations by country – percent share, 2019 ............................. 11 2.2.6. Canada’s top 10 honey export destinations – quantity (metric tonnes)..................................... 11
2.3. Imports ............................................................................................................................................. 12 2.3.1. Canada’s honey imports by province – value (Canadian dollars) ............................................. 12 2.3.2. Canada’s honey imports by province – percent share, 2019 .................................................... 12 2.3.3. Canada’s honey imports by province – quantity (kilograms) ..................................................... 13 2.3.4. Canada’s top 10 sources of honey imports – value (Canadian dollars) .................................... 13 2.3.5. Canada’s top sources of honey imports by country – percent share, 2019 .............................. 14 2.3.6. Canada’s top 10 sources of honey imports – quantity (kilograms) ............................................ 14 2.3.8. Canada's sources of queen bee imports – value (Canadian dollars) ........................................ 15
3. Consumption ........................................................................................................................................... 16 3.1. Honey available for consumption in Canada – kilograms per person .............................................. 16
4. World data ............................................................................................................................................... 17 4.1. Top 10 producers of honey worldwide – quantity ( metric tonnes) .................................................. 17 4.2. Top 10 honey-producing countries, 2018......................................................................................... 17 4.3. Top 10 exporters of honey worldwide – value (thousands of Canadian dollars) ............................. 18 4.4. Top 10 honey-exporting countries, 2019.......................................................................................... 18 4.5. Top 10 importers of honey worldwide – value (thousands of Canadian dollars) ............................. 19 4.6. Top 10 honey-importing countries, 2019.......................................................................................... 19
6. Key Resources ........................................................................................................................................ 20


1
Overview Beekeeping is an important agricultural industry in Canada, producing honey and other hive products, and delivering valuable pollination services to farmers of orchard fruits, many berries, vegetables, forage, and the production of hybrid canola seed. In 2017, AAFC estimated that the total annual economic contribution of honey bee pollination through direct additional harvest value was about $2.57 billion. When the estimated contribution of honey bee pollination to the production of hybrid canola seed is added, the total estimated contribution ranges from $4.0 to $5.5 billion per year. Looking forward to the 2020 beekeeping season, the disruptions in travel and transportation related to COVID-19 will negatively affect the beekeeping industry in Canada. Limited or non-existent travel options for Seasonal and Temporary Foreign Workers prevented or delayed the arrival of the workforce critical to beekeeping operations. COVID-related transportation disruptions affected the supply of replacement queen and package bees. These important supplies are shipped from a limited number of approved places including Australia, New Zealand, California and Hawaii, and arrive in the early spring to address hive losses and replace weak queen bees after the winter has passed. More details will be available in the 2020 Statistical Overview of the Canadian Honey and Bee Industry. After a steady increase over the past 5 years, the number of beekeepers in Canada fell 3% from a year earlier to 10,344 in 2019. Beekeepers with operations of all sizes are counted, including those with as few as one hive (or colony). British Columbia (2,763) and Ontario (2,506) have the highest numbers of beekeepers. Alberta leads in the average number of hives per beekeeper, with 206, almost three times the national average of 75 hives per beekeeper. After more than a decade of steady growth in total honey bee colony numbers, the number of colonies in Canada declined 2.1% from a year earlier to 773,182 in 2019. The contraction was primarily due to sustained weather unfavourable to honey bees including a cold wet spring in many parts of Canada. The majority of honey bee colonies are kept in the Prairies, where long summer days and a favourable crop mix are ideal for foraging. Alberta, Saskatchewan, and Manitoba collectively accounted for 69% of the country’s total honey bee colonies and for 79% of total honey production. Alberta contributed the most to Canada’s overall honey production (31%), followed by Saskatchewan (25%) and Manitoba (23%). Total honey production in Canada fell 15.4% from a year earlier to 80.4 million pounds in 2019 in the wake of a cold, wet spring and summer on the Prairies. Cold wet weather affects the availability of honey bee forage such as canola flowers, and limits the numbers of dry warm days in which bees can fly and gather nectar and pollen. Because of this, the industry produced its lowest total quantity of honey in seven years. For example, Alberta, the largest honey-producing province, production fell 35.0% to 25.1 million pounds, the lowest level in the province since 2000. Despite relatively higher prices for honey produced in Canada in 2019, the total estimated value of the honey produced in Canada was down 14% from 2018 to $173.0 million in 2019, its lowest total value in three years. While Canadian beekeepers routinely produce more honey than can be consumed domestically, a growing proportion of Canadian production is consumed domestically, reducing surpluses available for export. With a reduced total harvest in 2019, this further reduced the volume of honey available for export. In 2019, exports of Canadian honey totaled nearly $54 million, down 31% from 2018. Exports to the United States, the largest export destination for Canadian honey, fell 46% from a year earlier to $34 million in 2019. The second and third largest honey export destinations are Japan (33%) and China (3%), respectively. Canada imported $45 million worth of honey by value in 2019, up 23% from 2018. Honey from New Zealand topped the list of imported honey by value with a total import value of $17.5 million. Most imports from New

2
Zealand are high-priced Manuka honey. Brazil was the second largest source of imported honey, primarily certified organic honey, valued at $6.9 million.

3
1. Production
1.1. Number of beekeepers1 by province
2015 2016 2017 2018 2019
Prince Edward Island 45 40 46 50 50
Nova Scotia 395 451 604 631 690
New Brunswick 291 351 374 388 415
Quebec 333 384 402 425 440
Ontario 2,562 2,896 3,331 3,026 2,506
Manitoba 607 662 746 834 905
Saskatchewan 955 1,150 1,044 1,059 1,101
Alberta 1,064 1,453 1,402 1,572 1,474
British Columbia 2,363 2,640 2,640 2,676 2,763
Canada2 8,615 10,027 10,589 10,661 10,344
Source: Statistics Canada. Table 32-10-0353-01 Production and value of honey
Notes:
1. Beekeeper numbers may include providers of pollination services.
2. Newfoundland and Labrador is excluded since the province has no honey production to report.
1.2. Number of beekeepers by province – percent share, 2019
British Columbia27%
Ontario24%Alberta
14%
Saskatchewan11%
Manitoba9%
Others15%
Source: Statistics Canada. Table 32-10-0353-01 Production and value of honey
4
1.3. Number of colonies1 by province
2015 2016 2017 2018 2019
Prince Edward Island 4,005 4,920 6,300 4,453 4,453
Nova Scotia 25,504 31,080 26,426 25,446 20,805
New Brunswick 6,710 7,000 7,100 8,141 6,300
Quebec 54,294 64,426 61,020 60,439 62,000
Ontario 101,135 97,342 105,244 100,413 90,675
Manitoba 90,909 102,030 111,802 114,098 114,668
Saskatchewan 101,000 112,000 115,000 114,000 115,000
Alberta 296,880 309,000 317,000 311,000 303,500
British Columbia 45,571 39,885 40,776 52,033 55,781
Canada2
726,008 767,683 790,668 790,023 773,182
Notes:
1. Colony numbers may include providers of pollination services.
2. Newfoundland and Labrador is excluded since the province has no honey production to report.
Source: Statistics Canada. Table 32-10-0353-01 Production and value of honey
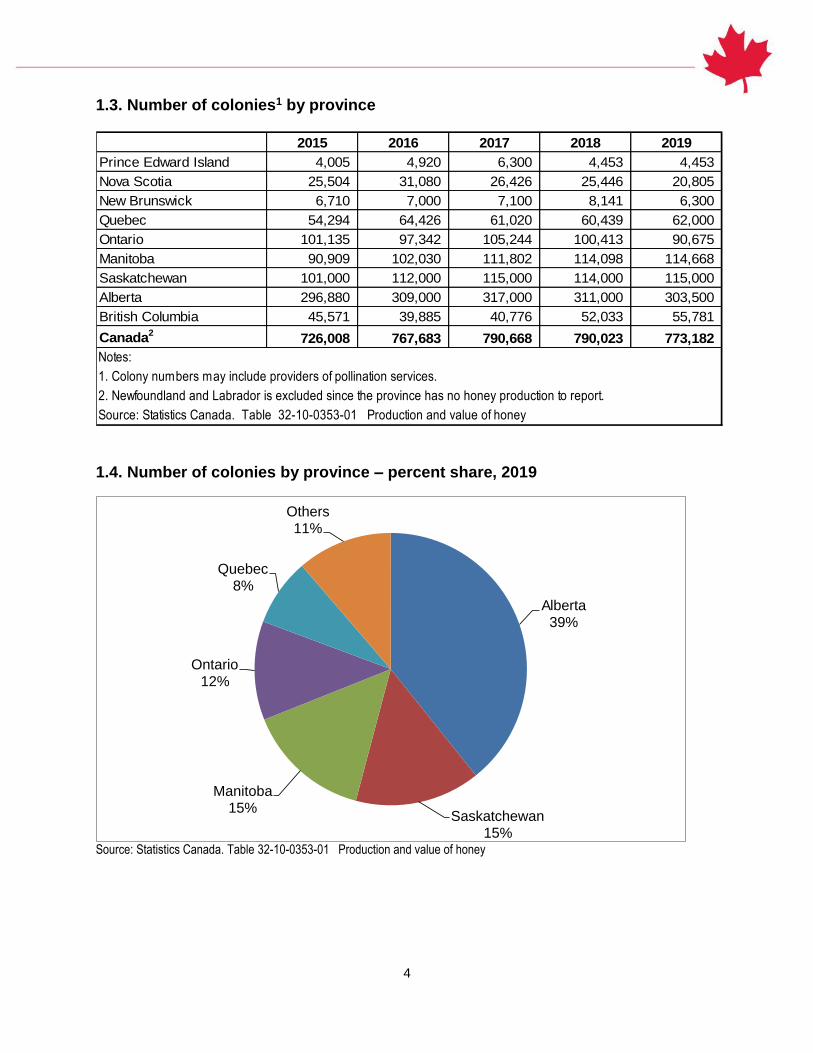
1.4. Number of colonies by province – percent share, 2019
Alberta39%
Saskatchewan15%
Manitoba15%
Ontario12%
Quebec8%
Others11%
Source: Statistics Canada. Table 32-10-0353-01 Production and value of honey

5
1.5. Number of beekeepers and number of colonies by province
0
50,000
100,000
150,000
200,000
250,000
300,000
350,000
0
500
1,000
1,500
2,000
2,500
3,000
Nu
mb
er
of
co
lon
ies
Nu
mb
er o
f bee
keep
ers
Beekeepers 2019 Colonies 2019
Source: Statistics Canada. Table 32-10-0353-01 Production and value of honey

6
1.6. Total honey production1 by province – thousands of pounds
2015 2016 2017 2018 2019
Prince Edward Island 168 162 231 168 225
Nova Scotia 411 588 553 522 418
New Brunswick 276 287 201 469 285
Quebec 4,194 4,507 3,723 4,472 4,408
Ontario 8,972 8,880 6,087 8,174 7,445
Manitoba 16,000 15,202 19,120 18,710 18,350
Saskatchewan 18,837 22,848 21,965 20,520 20,240
Alberta 39,461 40,170 40,576 38,564 25,067
British Columbia 3,692 1,934 3,556 3,397 3,907
Canada2
92,011 94,578 96,012 94,996 80,345
Notes:
1. Production excludes inventory.
2. Newfoundland and Labrador is excluded since the province has limited beekeeping.
Source: Statistics Canada. Table 32-10-0353-01 Production and value of honey
1.7. Total honey production by province – percent share, 2019
Alberta31%
Saskatchewan25%
Manitoba23%
Ontario9%
Quebec6%
Others6%
Source: Statistics Canada. Table 32-10-0353-01 Production and value of honey

7
1.8. Production value1 of honey by province – thousands of Canadian dollars
2015 2016 2017 2018 2019
Prince Edward Island 579 445 666 393 524
Nova Scotia 1,343 1,686 1,586 1,574 1,117
New Brunswick 740 661 511 1,430 869
Quebec 13,905 15,074 15,120 16,655 16,500
Ontario 31,119 31,966 20,257 34,329 31,643
Manitoba 32,400 21,000 32,268 32,786 32,997
Saskatchewan 26,372 27,418 34,045 33,858 32,384
Alberta 84,555 62,388 71,359 66,472 45,962
British Columbia 19,471 8,622 14,292 13,320 11,040
Canada2
210,483 169,260 190,104 200,816 173,036
Notes:
1. Value excludes inventory sales except for in Quebec.
2. Newfoundland and Labrador is excluded since the province has limited beekeeping.
Source: Statistics Canada. Table 32-10-0353-01 Production and value of honey
1.9. Production value of honey by province – percent share, 2019
Alberta27%
Manitoba19%
Saskatchewan19%
Ontario18%
Quebec9%
Others8%
Source: Statistics Canada. Table 32-10-0353-01 Production and value of honey

8
2. Trade
2.1. Trade balance
2.1.1. Canada’s honey trade balance – thousands of Canadian dollars
2015 2016 2017 2018 2019
Export 64,883 71,838 76,986 78,018 53,827
Import 41,214 38,064 41,284 36,996 45,394
Trade Balance
(Exports - Imports) 23,669 33,774 35,702 41,023 8,433
Source: Statistics Canada. (CATSNET, March 2020)

9
2.2. Exports
2.2.1. Canada’s honey exports by province1 – value (thousands of Canadian dollars)
2015 2016 2017 2018 2019
Prince Edward Island 34 78 0 0 0
Nova Scotia 2 61 126 15 60
Quebec 6,480 6,158 5,446 4,602 4,098
Ontario 2,735 2,212 3,864 6,367 5,722
Manitoba 17,745 17,060 19,310 13,033 11,943
Saskatchewan 15,640 11,346 19,928 20,511 11,097
Alberta 20,499 33,433 27,150 31,751 19,735
British Columbia 1,748 1,490 1,160 1,739 1,172
Canada 64,883 71,838 76,986 78,018 53,827
Note:
1. Exports may include honey not produced in that province.
Source: Statistics Canada. (CATSNET, March 2020)
2.2.2. Canada’s honey exports by province – percent share, 2019
Alberta37%
Manitoba22%
Saskatchewan21%
Ontario11%
Quebec7%
Others2%
Source: Statistics Canada. (CATSNET, March 2020)

10
2.2.3. Canada's honey exports by province - quantity (metric tonnes)
2015 2016 2017 2018 2019
Prince Edward Island 6 14 0 0 0
Nova Scotia 0 7 22 2 7
Québec 1,116 1,021 1,006 838 611
Ontario 360 378 828 1,219 1,006
Manitoba 3,316 4,580 5,242 3,160 2,957
Saskatchewan 2,999 3,551 5,541 5,127 2,735
Alberta 3,640 8,113 6,372 7,959 4,358
British Columbia 264 215 186 284 171
Total 11,701 17,879 19,196 18,589 11,845
Source: Statistics Canada. (CATSNET, March 2020)
2.2.4. Canada’s top 10 honey export destinations – value (thousands of Canadian dollars)
2015 2016 2017 2018 2019
United States 44,541 50,894 60,878 62,012 33,615
Japan 16,176 17,045 12,432 12,643 17,884
China 2,522 2,396 1,981 1,903 1,403
South Korea 751 559 550 696 503
Hong Kong 287 271 460 347 154
Barbados 55 56 63 25 62
Taiwan 23 54 20 30 48
Belgium 0 0 0 0 37
Lebanon 32 20 28 19 25
Jordan 0 64 14 0 20
Others 496 480 560 343 76
Total 64,883 71,838 76,986 78,018 53,827
Source: Statistics Canada. (CATSNET, March 2020)

11
2.2.5. Canada’s top honey export destinations by country – percent share, 2019
United States62%
Japan33%
China3%
Others2%
Source: Statistics Canada. (CATSNET, March 2020)
2.2.6. Canada’s top 10 honey export destinations – quantity (metric tonnes)
2015 2016 2017 2018 2019
United States 8,234 13,553 15,762 15,222 7,870
Japan 2,810 3,719 2,799 2,785 3,575
China 402 323 323 326 209
Korea, South 116 105 109 124 128
Hong Kong 43 40 72 55 19
Barbados 9 10 11 4 11
Taiwan 5 10 4 5 9
Jordan 0 12 3 0 5
Belgium 0 0 0 0 5
Lebanon 4 2 4 3 3
Others 77 104 110 65 12
Total 11,701 17,879 19,196 18,589 11,845
Source: Statistics Canada. (CATSNET,March 2020)

12
2.3. Imports
2.3.1. Canada’s honey imports by province – value (Canadian dollars)
2015 2016 2017 2018 2019
Nova Scotia 408 2,062 8,467 2,151 73,381
New Brunswick 113 216 7,236 30,121 6,999
Quebec 14,004,883 13,932,715 12,355,678 10,782,711 10,816,955
Ontario 21,683,754 17,958,821 24,630,510 19,892,413 27,542,742
Manitoba 453,018 305,147 71,679 15,403 44,322
Saskatchewan 53,687 13,854 4,800 20,361 69,443
Alberta 813,019 1,165,645 27,557 838,835 737,141
British Columbia 4,205,137 4,685,144 4,178,387 5,413,726 6,102,715
Total 41,214,019 38,063,604 41,284,314 36,995,721 45,393,989
Source: Statistics Canada. (CATSNET, March 2020
2.3.2. Canada’s honey imports by province – percent share, 2019
Ontario61%
Quebec24%
British Columbia13%
Others2%
Source: Statistics Canada. (CATSNET, March 2020)

13
2.3.3. Canada’s honey imports by province – quantity (kilograms)
2015 2016 2017 2018 2019
Nova Scotia 60 317 790 420 21,805
New Brunswick 9 51 291 3,193 316
Québec 3,219,694 3,417,813 2,633,238 2,501,290 2,964,758
Ontario 3,552,517 2,476,506 3,585,028 2,400,182 3,155,120
Manitoba 53,698 39,739 9,204 1,176 5,224
Saskatchewan 5,583 936 313 1,359 2,333
Alberta 99,573 223,966 3,407 24,344 24,643
British Columbia 384,940 400,887 418,136 369,514 409,796
Canada 7,316,074 6,560,215 6,650,407 5,301,478 6,584,014
Source: Statistics Canada. (CATSNET, March 2020)
2.3.4. Canada’s top 10 sources of honey imports – value (Canadian dollars)
2015 2016 2017 2018 2019
New Zealand 7,483,814 7,120,281 9,560,170 12,799,222 17,470,382
Brazil 7,307,083 10,515,234 7,384,459 4,226,571 6,882,630
Thailand 2,585,800 808,688 1,855,794 4,011,223 3,476,340
India 1,036,187 1,550,297 2,017,945 2,315,223 3,397,364
Australia 4,249,661 3,629,420 3,102,488 2,996,890 3,110,225
Spain 3,270,807 3,024,203 3,120,697 1,490,462 2,606,030
United States 6,161,862 4,207,803 2,667,256 3,285,023 2,537,365
Saudi Arabia 366,877 780,354 951,138 958,894 1,297,348
Greece 1,399,416 1,171,384 1,226,620 1,290,162 1,282,118
Ukraine 607,767 858,053 1,075,002 152,312 448,530
Others 6,744,745 4,397,887 8,322,745 3,469,739 2,885,657
Total 41,214,019 38,063,604 41,284,314 36,995,721 45,393,989
Source: Statistics Canada. (CATSNET, March 2020)

14
2.3.5. Canada’s top sources of honey imports by country – percent share, 2019
New Zealand39%
Brazil15%
Thailand8%
India7%
Australia7%
Others 24%
Source: Statistics Canada. (CATSNET, March 2020)
2.3.6. Canada’s top 10 sources of honey imports – quantity (kilograms)
2015 2016 2017 2018 2019
Brazil 1,528,830 2,134,017 1,279,957 968,574 1,877,520
India 222,511 429,116 505,506 745,286 1,091,658
Thailand 764,835 230,849 483,515 970,078 891,102
United States 938,727 652,406 468,534 586,715 574,500
Spain 766,116 646,681 734,823 314,974 529,098
New Zealand 292,186 298,498 346,451 349,397 412,172
Australia 506,390 393,654 333,891 323,392 279,490
Greece 253,231 164,416 177,721 137,907 142,340
Ukraine 155,262 325,126 352,820 39,568 137,674
Saudi Arabia 36,484 79,207 103,937 101,790 129,518
Others 1,851,502 1,206,245 1,863,252 763,797 518,942
Total 7,316,074 6,560,215 6,650,407 5,301,478 6,584,014
Source: Statistics Canada. (CATSNET, March 2020)

15
2.3.7. Canada's sources of honey bee imports – value (Canadian dollars)
2015 2016 2017 2018 2019
New Zealand 3,601,795 2,752,912 1,510,369 1,278,340 1,988,220
Australia 1,275,366 559,584 331,206 853,887 1,255,269
Chile 0 0 316,067 651,930 167,180
Denmark 0 9,428 0 0 0
United States 223942 249614 0 0 0
Total 5,101,103 3,571,538 2,157,642 2,784,157 3,410,677
Notes:
Package bees are sold in a variety of sizes typically one pound, two pound and three pound packages. No detail on
the individual numbers of different package sizes is available.
Does not include queen bees and live bees that are not honey bees.
Source: Statistics Canada. (CATSNET, March 2020)
2.3.8. Canada's sources of queen bee imports – value (Canadian dollars)
2015 2016 2017 2018 2019
United States 6,416,761 6,316,094 7,152,289 7,180,608 7,233,949
Chile 128,051 91,396 217,937 225,279 504,080
Australia 56,248 145,681 265,108 212,140 191,143
New Zealand 108,924 81,787 63,232 884,234 103,034
Ecuador 0 0 7,551 28000 5620
Others 0 0 319,688 32320 5573
Total 6,709,984 6,634,958 8,025,805 8,562,581 8,043,399
Source: Statistics Canada. (CATSNET, March 2020)

16
3. Consumption
3.1. Honey available1 for consumption in Canada – kilograms per person
2015 2016 2017 2018 2019
Honey2
1.10 0.93 0.90 0.86 0.87
Source: Statistics Canada. Table 32-10-0054-01 Food available in Canada
Notes:
2. Does not adjust for losses, such as waste and/or spoilage in stores, households, private institutions or restaurants or
losses during preparation.
1. Food available per person is calculated by dividing the domestic disappearance by the Canadian population as of
July 1st of the reference year, at the retail level.
Total Supply = Beginning stocks + Production + Imports
Domestic Disappearance = Total supply – Exports – Manufacturing - Waste - Ending stocks
Domestic disappearance represents the total food available for human consumption from the Canadian food supply
chain.

17
4. World data
4.1. Top 10 producers of honey worldwide – quantity ( metric tonnes)
2014 2015 2016 2017 2018
China 462,028 473,000 555,000 543,000 446,900
Turkey 103,525 108,128 105,727 114,471 114,113
Argentina 60,000 52,600 68,123 76,379 79,468
Iran 77,800 72,803 67,783 71,187 77,567
Ukraine 66,521 63,615 59,294 66,231 71,279
United States 80,862 71,008 73,429 67,576 69,104
India 61,938 62,472 64,899 66,415 67,442
Russia 74,868 67,736 69,764 65,167 65,006
Mexico 60,624 61,881 55,358 51,066 64,253
Ethiopia 50,000 59,161 47,706 50,000 50,000
Others1
665,579 731,623 695,589 707,722 745,741
Total 1,763,745 1,824,027 1,862,672 1,879,214 1,850,873
Note:
1. In 2018, Canada ranked 12th globally with an estimated total honey production of 39,116 tonnes.
Source: Food and Agriculture Organization (FAO) of the United Nations | © FAO Statistics Division 2020
4.2. Top 10 honey-producing countries, 2018
-
50,000
100,000
150,000
200,000
250,000
300,000
350,000
400,000
450,000
500,000
Pro
du
cti
on
(in
me
tric
to
nn
es
)
Source: Food and Agriculture Organization (FAO) of the United Nations | © FAO Statistics Division 2020

18
4.3. Top 10 exporters of honey worldwide – value (thousands of Canadian dollars)
2015 2016 2017 2018 2019
China 370,299 367,884 350,287 322,762 311,714
New Zealand 253,729 271,606 348,666 317,420 304,314
Argentina 208,015 223,089 238,189 226,370 194,508
Germany 168,799 181,575 182,095 182,512 174,523
Ukraine 108,802 129,046 172,619 127,788 134,398
India 155,276 93,744 135,573 132,635 134,046
Spain 129,985 144,399 142,967 137,123 117,471
Hungary 96,714 91,497 116,502 111,907 100,611
Brazil 103,934 121,581 158,802 123,790 90,021
Mexico 196,692 123,115 136,753 156,140 87,042
Others1
1,003,071 871,918 983,438 952,412 808,922
Total 2,795,317 2,619,454 2,965,893 2,790,858 2,457,570
Source: Global Trade Tracker (March 2020)
Note:
1. In 2019, Canada ranked 13th globally with exports totaling $54,828 thousands.
4.4. Top 10 honey-exporting countries, 2019
-
50,000
100,000
150,000
200,000
250,000
300,000
350,000
Ca
na
dia
n d
olla
rs (
in t
ho
us
an
ds
)
Source: Global Trade Tracker (March 2020)

19
4.5. Top 10 importers of honey worldwide – value (thousands of Canadian dollars)
2015 2016 2017 2018 2019
United States 770,164 559,415 739,701 645,977 570,863
Germany 425,046 370,790 406,723 396,781 331,100
Japan 150,898 209,152 185,433 188,619 191,603
France 165,264 168,814 169,487 168,204 157,167
United Kingdom 168,236 158,725 169,545 166,461 147,529
China 96,064 96,505 118,605 91,170 112,618
Italy 108,883 96,028 106,654 130,572 107,746
Belgium 115,356 98,383 103,310 94,858 83,113
Poland 62,920 67,407 76,031 81,355 79,938
Spain 93,012 86,542 99,535 87,984 76,217
Others1
755,583 728,602 819,685 769,968 623,114
Total 2,911,427 2,640,364 2,994,709 2,821,949 2,481,008
Source: Global Trade Tracker (March 2020)
Note:
1. In 2019, Canada ranked 14th globally with imports totaling $45,394 thousands.
4.6. Top 10 honey-importing countries, 2019
-
100,000
200,000
300,000
400,000
500,000
600,000
Can
adia
n D
olla
rs (i
n T
ho
usa
nd
s)
Source: Global Trade Tracker (March 2020)

20
6. Key Resources
Food and Agriculture Organization of the United Nations, Statistics Division
Global Trade Tracker
Statistics Canada. Table 32-10-0353-01 Production and value of honey
Statistics Canada. Table 32-10-0054-01 Food available in Canada
Statistics Canada. CATSNET
Import and export data is based on the following Harmonized System Codes (H.S. Codes):
Honey for import: 0409000010; 0409000021; 0409000022; 0409000023; 0409000024; 0409000025; 0409000026; 0409000029; 0409000090
Honey for export: 04090000
Honey Bees for import: 0106410010; 0106410011; 0106410012; 0106900011; 0106900012
Queen Bees for import: 0106410020