Brennan Kirwan Redmond Accountability Processes in Boardrooms

1
Statistical note on gender balance in corporate boardrooms: current situation and trends October 2018
Executive summary The persistent gender imbalance amongst key decision-makers in large corporations remains a cause for
concern. The European Institute for Gender Equality (EIGE) monitors the situation in the largest listed companies
in each of the EU Member States on a biannual basis and the latest data collected in October 2018 have just
been released on the EIGE Gender Statistics Database. Key findings are:
The proportion of women on the boards of the largest listed companies in EU Member States has reached
26.7%, an increase of 0.5 percentage points (pp) since the last update in April 2018;
France remains the only Member State with at least 40% of each gender on the combined boards of the
companies covered1. Women account for at least a third of board members in Italy, Sweden, Finland and
Germany, but still less than 10% in Malta, Greece and Estonia.
The share of women on the boards of large companies across the EU has more than doubled since October
2010 (from 11.9% to 26.7%), when the European Commission brought the issue to the fore, but progress
has been concentrated in just a few countries where governments have taken legislative or other forms of
action. Elsewhere there has been little improvement and now that the main drivers of progress have
reached or are close to their national targets, progress at EU level has slowed down.
The increased level of female representation in boardrooms is not feeding through to the executive
hierarchy. Women account for just 16.6% senior executives compared to 29.3% of non-executives and
progress at board level is not feeding through to the executive hierarchy.
Less than a quarter (24.3%) of the largest companies in EU Member States have at least 40% of each gender
amongst non-executives and more than one in five (21.3%) have no women non-executives at all. Moreover,
well over half (57.1%) of the companies with at least 40% women non-executives are concentrated in just
four countries: France, Italy, the United Kingdom, and Sweden.
The top positions are still largely occupied by men. Although numbers have more than doubled since 2012,
women still account for just 6.7% of board chairs and 6.5% of CEOs.
1 The share of women on boards in France first reached 40% in October 2016, driven by a law introduced in 2011 that required all large companies (more than 500 employees or turnover of over €50 million) to have at least 40% of each gender on boards by January 2017.

2
Introduction Despite political and media attention, pressure from shareholders, and an ever-increasing body of knowledge
showing the performance benefits of gender-balanced decision-making, women remain substantially under-
represented in boardrooms. The European Commission brought the issue to the fore of the political agenda in
2010 by hinting at possible legislative action2, and followed this though in 2012 with a proposed Directive to
improve the gender balance among non-executive directors of listed companies, targeting at least 40% of the
under-represented sex3. More recently, actions to tackle vertical (gender) segregation in companies, sectors and
occupations form a key part of the Commission’s 2017-2019 Action Plan to tackle the gender pay gap4.
2 Strategy for equality between women and men: 2010-2015, European Commission http://ec.europa.eu/justice/gender-equality/files/strategy_equality_women_men_en.pdf 3 http://europa.eu/rapid/press-release_IP-12-1205_en.htm 4 EU Action Plan 2017-2019: Tackling the gender pay gap, COM(2017) 678 final: https://eur-lex.europa.eu/legal-content/EN/TXT/?uri=CELEX:52017DC0678

3
The European Institute for Gender Equality (EIGE) actively monitors progress in achieving gender balance in the
boardroom5. The institute’s Gender Statistics Database includes data on the representation of women and men
in key decision-making positions in the largest publicly listed companies in the 28 EU Member States and seven
other European countries. There is an annual time-series from 2003 and biannual data from 2012.
5 EIGE took over responsibility for this task from the European Commission in January 2017.
Notes about the data
Publicly listed means that the shares of the company are traded on the stock exchange. The "largest"
companies in each country are taken to be the members (max.50) of the primary blue-chip index
maintained by the national stock exchange, which covers the largest companies by market
capitalisation and/or volume of market trades. Only companies registered in the country concerned
(according to the ISIN code) are taken into account.
EIGE’s Gender Statistics Database shows two sets of data related to large companies. The first covers
the president and members of the “board” – i.e. the highest decision-making body in each company,
while the second takes into account members of the two highest decision-making bodies in order to
cover both executive and non-executive positions and overcome differences in corporate governance
systems:
- Presidents, board members and employee representatives (note that the count of members
includes the president, employee representatives are a subset of members and do not exist in
all countries)
- CEOs, executives and non-executives (this dataset covers the two highest decision-making
bodies in each company; any person that is a member of both bodies is counted only once)
The two highest decision-making bodies are usually referred to as the “supervisory board” and the
“management board” in a two-tier governance system, or the “board of directors” and an informal
body usually called the executive/management committee in a unitary governance system.
Data are mostly collected from company websites but other sources include annual reports or other
formal documents of companies, websites of stock exchanges, and direct contacts with companies.

4
The latest data on women and men in decision-making positions of largest listed companies were collected in
October 2018 and cover 736 companies, 605 of which were registered in the EU Member States. This note
analyses the current situation, trends and developments in the gender balance amongst key decision-makers in
large corporations at EU and Member State level.
Women account for just over a quarter of board members in large corporations In October 2018, the share of women on boards of the largest publicly listed companies registered in the EU
Member States reached 26.7%. France (44.0%) remains the sole EU Member State with at least 40% of each
gender at board level. In four further countries, women account for at least a third of board members (Italy,
Sweden, Finland, and Germany), but the stark reality is that much more still needs to be done. In just under half
of Member States (12) men still outnumber women by at least 4 to 1 (i.e. <20 % women), and in Malta, Greece
and Estonia, women account for less than 10% of board members (Figure 1).
Figure 1: Share of women and men on the boards of the largest listed companies in the EU, October 2018
Source: European Institute for Gender Equality, Gender Statistics Database. Legislative gender quota targets: FR (40%), BE, IT & PT (33%), DE & AT (30%).
Six Member States have introduced legislative gender quotas in order to address the gender imbalance in boardrooms: Belgium, Italy and Portugal (33%), Germany and Austria (30%), and France (40%). Based on the companies covered by EIGE’s sample, the respective legislative targets have been fulfilled in France (reached in October 2016), Germany and Italy (both met the targets in October 2017), whilst Belgium still has a little way to go, 1 percentage point (pp), although the target was set for the end of the 2017-2018 financial year. The legislative targets in Austria and Portugal have only been enforced since January 2018 so no major improvements are expected so far. However, it is notable that Austria is already closer to its legislated target (26.1% c.f. 30%) than Portugal (21.6% c.f. 33%).

5
Slowdown in progress continues; 10 years to achieve at least 40% of each gender The October 2018 EU-28 figure for women on boards (26.7%) represents an increase of just 0.5 pp from the
previous update in April 2018 (26.2%), a result that reiterates the slowdown in progress seen since 2015.
Between October 2010 and October 2015, the share of women on company boards increased at an average rate
of 2.2 pp per year, but since then the annual rate of change has slipped to just 1.3 pp (Figure 2). Moreover, there
has not been a 6-monthly increase of over 1 percentage point since October 2015. The slowdown reflects the
fact that the key drivers of progress over the earlier period have now reached or are close to targets and
highlights the limited progress being made elsewhere. If the current rate of progress (since 2015) is maintained
– which will demand progress in countries that have not contributed much to date - it will still take another 10
years to achieve gender balance (at least 40% of each gender) in boardrooms across the EU.
Figure 2: Share of women on the boards of the largest listed companies in the EU, 2003-October 2018 (%)
Source: European Institute for Gender Equality, Gender Statistics Database
Progress varies between Member States Since 2010, the representation of women in corporate boards has improved in most EU Member States but the
extent of progress varies considerably. Italy and France continue to stand out with increases of more than 30
pp. Belgium and Germany are the only other countries to have seen the level of female representation increase

6
by more than 20 pp. At the other end of the spectrum, there has been no significant progress (less than 2 pp) in
Croatia, Czech Republic, Hungary6 and Estonia and even some decline in Romania and Lithuania (Figure 3).
Note that the companies included in the samples for each country may vary over time as the samples are based
on the constituents of the main blue-chip indices, which are reviewed regularly to reflect changes in the market
capitalisation of companies and/or volume of shares traded. In Member States where the blue-chip index (and
therefore the sample) has relatively few constituents, a change of one company for another can sometimes
affect results as much as changes in the board composition of constant member companies. In the October 2018
data, there were four Member States in which the sample covered less than 15 companies: Czech Republic (11),
Luxembourg (10), Romania (13) and Slovakia (10).
Figure 3: Change in the share of women on the boards of the largest listed companies in the EU, October 2010 – October 2018 (percentage points)
Source: European Institute for Gender Equality, Gender Statistics Database
Legislative and other government action drives progress The most significant improvements in the representation of women on boards of listed companies have
occurred in countries that have either taken or considered legislative action and/or had an intensive public
debate on the issue. France, Italy, Belgium, and Germany have been applying binding quotas. A softer approach
is preferred in 13 other Member States (DK, IE, EL, ES, LU, NL, AT, PL, PT, SI, FI, SE, UK)7 including legislative
6 The small change in Hungary is partly linked to a methodological review which resulted in a change in the bodies covered by the data collection. 7 Austria and Portugal have not been included under the binding quotas group despite the fact that both countries have been enforcing legislative quotas since January 2018. The quotas are fairly recent and will take some time to show any

7
quotas that are restricted to state-owned companies or applied without sanctions in Greece, Slovenia, and Spain
whilst others have preferred to encourage companies to self-regulate in order to redress the gender balance in
boardrooms. In the remaining 11 Member States (BG, CZ, EE, HR, CY, LV, LT, HU, MY, RO, SK) governments have
not taken any substantial action.
The difference between action and inaction is striking (Figure 4). The four countries with binding quotas
currently have 37.5% women on boards (aggregate of all companies covered in those countries) and have seen
this proportion rise by 27.6 pp since 2010 at an average rate of 3.5 pp/year. The countries in which governments
have taken soft measures have 25.6% women, an increase of 12.8 pp at 1.6 pp/year. In stark contrast, the no-
action Member States have just 14.3% women on boards and the level of female representation has risen just
1.5 pp over the period at an average of just 0.2 pp/year. The differences show a clear stagnation in the number
of women on boards correlating with inaction. This evidence, combined with the recent slowdown in progress
– which is likely to continue since the three countries that have contributed most to recent progress (France,
Italy and Germany) have now surpassed their respective legislative targets, and Belgium is only 1 pp away from
reaching its 33% target. The current situation and slowdown in progress should be a strong message to policy
makers that further action is necessary in countries that have so far done little to promote balanced
representation in the boardroom.
Figure 4: Changes in the share of women on boards 2010-2018 by type of action taken
Source: European Institute for Gender Equality, Gender Statistics Database * The legislative quotas applied to listed companies in AT and PT were adopted in 2017 and only enforced in January 2018. They are included under soft measures (see Footnote 7).
impact. They are included instead under the soft measures: Austria already had a quota applicable to state-owned companies and Portugal had government resolution (but not legislation) targeting 30% women by 2018.
EU
-28
Quo
ta
So
ftM
ea
sure
s
No
act
ion

8
Progress amongst executives continues to lag behind In October 2018, women held 29.3% of non-executive positions in the top two decision-making bodies of large
companies compared to just 16.6% of executive positions. This disparity (fewer women executives than non-
executives) holds in the majority of Member States (20 of 28), and the exceptions mostly relate to countries
with particularly low levels of female representation amongst non-executives (Figure 5).
Figure 5: Share of women amongst executive and non-executive members of the two highest decision-making bodies of large companies in the EU-28, October 2018
Source: European Institute for Gender Equality, Gender Statistics Database
Current legislative and other actions have no impact on executives As shown above, legislative and other actions aimed at improving female representation at board level have
produced significant improvements compared to inaction. This is not the case, however, for executives. (Note
that data on executives have only been collected since 2012 so the time period available for analysis is shorter.)
Across the EU, the percentage of women in executive positions has risen at a steady rate of 1 pp/year, from
10.4% in October 2012 to 16.6% in October 2018. However, when countries are grouped by type of action (as
per the previous analysis), there is virtually no difference in the rate of change (all around 1 pp/year) and the
countries with binding quotas for non-executives actually have the lowest level of female representation
amongst executives (Table 4 in annex and Figure 5 ). This is in stark contrast to the situation amongst non-
executives. Over the same period, the proportion of women non-executives has increased by an average of 3.9
pp/year in countries with binding quotas and 1.9 pp/year in countries applying soft measures – respectively 4
and 2 times as fast as for executives in the same countries – and in the no-action countries there has been
virtually no change at all. The implication is that action, particularly in the form of binding quotas, is having a
clear positive effect on the representation of women in the positions it targets (i.e. non-executive directors) but

9
that this does not translate at all to progress within the executive hierarchy. Research has shown similar findings
in Norway, which was the first country to introduce a gender quota for company boards8. If progress is to be
made amongst executives then policy makers probably have to rethink their strategy.
Figure 6 - Changes in the share of women amongst executives and non-executives by type of action, Oct-2012 to Oct-2018
Source: European Institute for Gender Equality, Gender Statistics Database
More companies have all-male executives than non-executives The gender imbalance amongst senior executives and non-executives is further highlighted by the fact that just
under two in five of the companies covered by the sample in October 2018 (235 of 605 or 38.8%) do not have a
single woman in their executive management team (Figure 8). This is almost double the number that still have
no female non-executive directors (129 or 21.3%). There is a similar difference between the number of
companies having more than one woman non-executive (357 or 59.0%) compared to those with more than one
female senior executive (185 or 30.6%).
8 https://www.economist.com/business/2018/02/17/ten-years-on-from-norways-quota-for-women-on-corporate-boards
+6.2 pp
+6.3 pp
+6 pp
+6.8 pp
EU-28
Quota
Soft Measures
No action
Executives
+12.2 pp
+23.5 pp
+11.2 pp
+0.3 pp
0% 5% 10% 15% 20% 25% 30% 35% 40% 45% 50%
EU-28
Quota
Soft Measures
No action
Non-Executives

10
Figure 8: Distribution of companies by the number of women amongst executives and non-executives, EU-28, October 2018
Source: European Institute for Gender Equality, Gender Statistics Database
World-wide research on the asset management industry shows that gender distribution plays an important role in
behavioural dynamics. The industry is characterised by risk-taking to increase profit and it seems that male-only teams
take more risks than female-only teams while mixed-gender management teams take a balanced approach and achieve
higher returns. Currently women account for just 10.3% of fund managers.
Less than a quarter of companies meet the Commission’s 40% target The Commission’s proposed Directive targets at least 40% of each gender amongst non-executive directors. In
October 2018, less than a quarter (147 of 605, 24.3%) of the largest listed companies in EU Member States met
this target. Although this represents a significant improvement compared to the figure recorded in October
2012 (8.4%) it still means that compliance with the target is the exception rather than the rule.
The situation varies considerably by country. Notably, France leads the way with 88.9% of the companies
covered reaching the target, a country which has consistently achieved the highest levels due to a law requiring
all companies to have at least 40% of each gender on their board by January 2017. Elsewhere, more than half
of the companies covered were compliant in Italy (64.7%) and 50.0% in Sweden whilst in Greece, Czech Republic,
Luxembourg and Hungary, none of the companies covered met the 40% target (Figure 9). In Estonia, Cyprus,
and Lithuania more than 60% of the companies covered have no women non-executives.
9 Citywire Alpha Female 2018: https://citywire.co.uk/Publications/WEB_Resources/Creative/Global/Alpha-Female-2018.pdf

11
Figure 9: Share of largest listed companies with at least 40% of each gender amongst non-executives, EU-28,
October 2018 Source: European Institute for Gender Equality, Gender Statistics Database
In practice, well over half (57.1%) of the largest
listed companies with at least 40% of each
gender amongst non-executives are found in just
four countries: France (32 companies), Italy (22),
Sweden (13), and the UK (17) (Figure 10).
No other EU Member State has more than eight
large companies meeting the target even though
this group includes Spain (8), Germany (5),
Netherlands (4), and Denmark (4) which have
relatively large samples10 (Table 5 in Annex).
Figure 10: Distribution of largest listed companies with at least 40% of each gender amongst non-executives by country, EU-28, October 2018
Source: European Institute for Gender Equality, Gender Statistics Database
Women remain highly underrepresented in top positions Despite the progress at board level, it remains the case that very few women reach the highest positions
in large companies: less than 1 in 10 companies has a female chair or CEO. Nonetheless, some gradual
10 In October 2018, 34 companies were covered in Spain, 30 in Germany and 25 in both the Netherlands and Denmark.
FR
IT
SE
UK
All other countries

12
progress can be observed, as the proportions of women occupying board chair and CEO positions have
both more than doubled since October 201211. In October 2018, women accounted for 6.7% of board
chairs (up from 3.3% in October 2012, but down by 0.9pp compared to 7.5% in April 2018) and 6.5% of
CEOs (up from 2.5%) (Figure 7).
Figure 7: Share of women amongst board chairs and CEOs in largest publicly listed companies in the EU, 2003-2018
Source: European Institute for Gender Equality, Gender Statistics Database
11 Data on CEOs were not collected before October 2012.

13
Annex Table 1 – Proportion of women board chairs, board members and employee representatives (highest decision-making body), October 2018
Board chairs Board members Employee representatives
Women (%) Men (%) Women (%) Men (%) Women (%) Men (%)
6.7% 93.3% 26.7% 73.3% 32.6% 67.4%
Belgium 6.3% 93.8% 32.0% 68.0% - -
Bulgaria 0.0% 100.0% 14.5% 85.5% 0.0% 100.0%
Czech Republic 0.0% 100.0% 13.8% 86.2% 22.2% 77.8%
Denmark 0.0% 100.0% 27.7% 72.3% 31.3% 68.8%
Germany 3.3% 96.7% 33.8% 66.2% 35.0% 65.0%
Estonia 0.0% 100.0% 8.0% 92.0% - -
Ireland 5.3% 94.7% 18.7% 81.3% - -
Greece 0.0% 100.0% 9.1% 90.9% 0.0% 100.0%
Spain 6.1% 93.9% 23.7% 76.3% - -
France 2.8% 97.2% 44.0% 56.0% 40.3% 59.7%
Croatia 0.0% 100.0% 17.2% 82.8% 42.9% 57.1%
Italy 11.8% 88.2% 36.4% 63.6% - -
Cyprus 0.0% 100.0% 11.2% 88.8% - -
Latvia 15.8% 84.2% 29.0% 71.0% - -
Lithuania 5.6% 94.4% 10.8% 89.2% - -
Luxembourg 0.0% 100.0% 13.3% 86.7% - -
Hungary 20.0% 80.0% 14.9% 85.1% - -
Malta 0.0% 100.0% 9.5% 90.5% - -
Netherlands 0.0% 100.0% 30.7% 69.3% - -
Austria 15.0% 85.0% 26.1% 73.9% 30.4% 69.6%
Poland 35.0% 65.0% 21.0% 79.0% 0.0% 100.0%
Portugal 5.9% 94.1% 21.6% 78.4% - -
Romania 7.7% 92.3% 11.0% 89.0% - -
Slovenia 20.0% 80.0% 27.9% 72.1% 34.1% 65.9%
Slovakia 22.2% 77.8% 24.1% 75.9% 26.7% 73.3%
Finland 0.0% 100.0% 34.5% 65.5% 33.3% 66.7%
Sweden 11.5% 88.5% 36.1% 63.9% 26.7% 73.3%
United Kingdom 4.1% 95.9% 29.9% 70.1% - -
Montenegro 20.0% 80.0% 22.4% 77.6% - -
former Yugoslav Republic of Macedonia, the
30.0% 70.0% 19.7% 80.3% - -
Turkey 6.1% 93.9% 15.3% 84.7% - -
Serbia 27.3% 72.7% 21.2% 78.8% - -
Bosnia and Herzegovina 10.0% 90.0% 14.8% 85.2% - -
Iceland 33.3% 66.7% 45.2% 54.8% - -
Liechtenstein - - - - - -
Norway 13.6% 86.4% 40.2% 59.8% 33.3% 66.7%

14
All countries 8.4% 91.6% 26.3% 73.7% 32.7% 67.3%
“-“: Not applicable
Table 2 – Number of companies covered and % of companies by number of women on board, October 2018 Number of companies
Covered No women on board 1 woman on board >1 woman on board
EU-28 605 17.0% 18.3% 64.6%
Belgium 16 0.0% 0.0% 100.0%
Bulgaria 15 46.7% 40.0% 13.3%
Czech Republic 11 36.4% 54.5% 9.1%
Denmark 23 8.7% 8.7% 82.6%
Germany 30 0.0% 0.0% 100.0%
Estonia 17 64.7% 29.4% 5.9%
Ireland 19 10.5% 36.8% 52.6%
Greece 23 34.8% 39.1% 26.1%
Spain 34 0.0% 11.8% 88.2%
France 36 0.0% 0.0% 100.0%
Croatia 19 36.8% 31.6% 31.6%
Italy 34 0.0% 0.0% 100.0%
Cyprus 20 45.0% 30.0% 25.0%
Latvia 20 20.0% 45.0% 35.0%
Lithuania 20 60.0% 35.0% 5.0%
Luxembourg 10 40.0% 30.0% 30.0%
Hungary 15 40.0% 20.0% 40.0%
Malta 23 52.2% 30.4% 17.4%
Netherlands 20 0.0% 15.0% 85.0%
Austria 20 5.0% 10.0% 85.0%
Poland 20 20.0% 20.0% 60.0%
Portugal 17 11.8% 11.8% 76.5%
Romania 13 38.5% 53.8% 7.7%
Slovenia 20 5.0% 25.0% 70.0%
Slovakia 10 20.0% 40.0% 40.0%
Finland 24 0.0% 0.0% 100.0%
Sweden 26 0.0% 3.8% 96.2%
United Kingdom 50 0.0% 6.0% 94.0%
Montenegro 10 40.0% 20.0% 40.0%
former Yugoslav Republic of Macedonia, the
10 20.0% 50.0% 30.0%
Turkey 50 26.0% 36.0% 38.0%
Serbia 11 27.3% 36.4% 36.4%
Bosnia and Herzegovina 10 40.0% 40.0% 20.0%
Iceland 18 0.0% 0.0% 100.0%
Liechtenstein - - - -
Norway 22 0.0% 0.0% 100.0%
All countries 736 17.5% 19.6% 62.9%
“-“: Not applicable

15
Table 3 – Proportion of women CEOs, senior executives and non-executives (two highest decision-making bodies), October 2018
CEOs Executives Non-executives
Women (%) Men (%) Women (%) Men (%) Women (%) Men (%)
EU-28 6.5% 93.5% 16.6% 83.4% 29.3% 70.7%
Belgium 6.3% 93.8% 14.4% 85.6% 34.9% 65.1%
Bulgaria 13.3% 86.7% 26.5% 73.5% 13.8% 86.2%
Czech Republic 0.0% 100.0% 6.1% 93.9% 13.8% 86.2%
Denmark 4.3% 95.7% 11.0% 89.0% 27.7% 72.3%
Germany 0.0% 100.0% 13.8% 86.2% 33.8% 66.2%
Estonia 5.9% 94.1% 23.4% 76.6% 8.0% 92.0%
Ireland 15.8% 84.2% 15.5% 84.5% 22.6% 77.4%
Greece 4.3% 95.7% 18.1% 81.9% 9.6% 90.4%
Spain 2.9% 97.1% 14.3% 85.7% 27.7% 72.3%
France 2.8% 97.2% 17.0% 83.0% 46.7% 53.3%
Croatia 5.3% 94.7% 20.6% 79.4% 17.2% 82.8%
Italy 2.9% 97.1% 9.4% 90.6% 43.3% 56.7%
Cyprus 5.9% 94.1% 15.2% 84.8% 9.8% 90.2%
Latvia 0.0% 100.0% 27.3% 72.7% 29.0% 71.0%
Lithuania 11.1% 88.9% 28.4% 71.6% 11.5% 88.5%
Luxembourg 0.0% 100.0% 12.7% 87.3% 16.9% 83.1%
Hungary 13.3% 86.7% 13.3% 86.7% 16.7% 83.3%
Malta 13.0% 87.0% 18.8% 81.2% 10.1% 89.9%
Netherlands 5.0% 95.0% 16.5% 83.5% 31.7% 68.3%
Austria 5.0% 95.0% 5.1% 94.9% 26.1% 73.9%
Poland 10.0% 90.0% 13.0% 87.0% 21.0% 79.0%
Portugal 0.0% 100.0% 10.0% 90.0% 29.1% 70.9%
Romania 8.3% 91.7% 25.4% 74.6% 12.3% 87.7%
Slovenia 20.0% 80.0% 24.7% 75.3% 26.9% 73.1%
Slovakia 20.0% 80.0% 20.0% 80.0% 24.1% 75.9%
Finland 8.3% 91.7% 18.0% 82.0% 34.7% 65.3%
Sweden 7.7% 92.3% 23.6% 76.4% 38.2% 61.8%
United Kingdom 6.1% 93.9% 18.7% 81.3% 36.5% 63.5%
Montenegro 30.0% 70.0% 36.7% 63.3% 22.4% 77.6%
former Yugoslav Republic of Macedonia, the
10.0% 90.0% 26.2% 73.8% 20.0% 80.0%
Turkey 0.0% 100.0% 10.3% 89.7% 16.3% 83.7%
Serbia 0.0% 100.0% 21.7% 78.3% 21.7% 78.3%
Bosnia and Herzegovina 0.0% 100.0% 20.8% 79.2% 14.8% 85.2%
Iceland 0.0% 100.0% 23.7% 76.3% 45.2% 54.8%
Liechtenstein - - - - - -
Norway 4.5% 95.5% 24.0% 76.0% 40.4% 59.6%

16
All countries 6.1% 93.9% 17.0% 83.0% 28.7% 71.3%
“-“: Not applicable
Table 4 – Changes in the share of women executives and non-executives, Oct-2012-Oct-2018 Executives Non-executives
Oct-12 Oct-18 Change (pp)
Rate (pp/yr)
Oct-12 Oct-18 Change (pp)
Rate (pp/yr)
EU28 10.4% 16.6% +6.2 1.0 16.7% 28.9% +12.2 2.0
Binding quotas
7.2% 13.5% +6.3 1.1 17.8% 41.3% +23.5 3.9
Soft measures
10.7% 16.8% +6.0 1.0 17.4% 28.6% +11.2 1.9
No action 13.7% 20.5% +6.8 1.1 13.9% 14.2% +0.3 0.0
Source: European Institute for Gender Equality, Gender Statistics Database
17
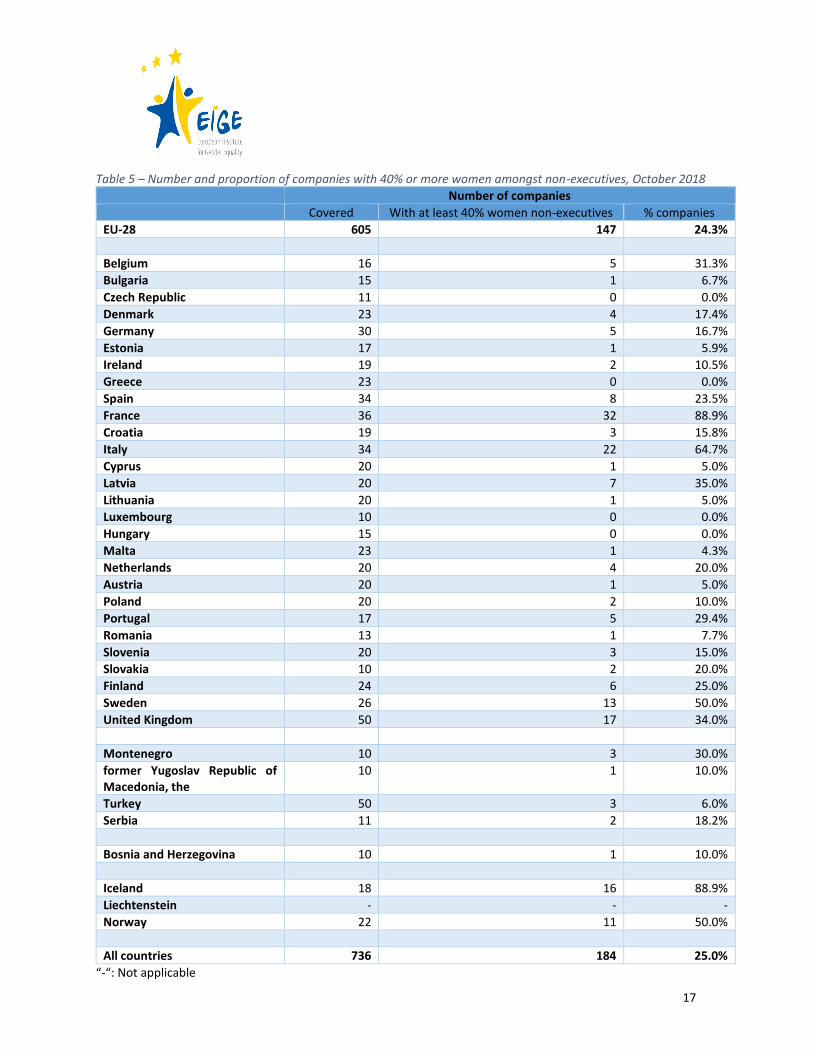
Table 5 – Number and proportion of companies with 40% or more women amongst non-executives, October 2018
Number of companies
Covered With at least 40% women non-executives % companies
EU-28 605 147 24.3%
Belgium 16 5 31.3%
Bulgaria 15 1 6.7%
Czech Republic 11 0 0.0%
Denmark 23 4 17.4%
Germany 30 5 16.7%
Estonia 17 1 5.9%
Ireland 19 2 10.5%
Greece 23 0 0.0%
Spain 34 8 23.5%
France 36 32 88.9%
Croatia 19 3 15.8%
Italy 34 22 64.7%
Cyprus 20 1 5.0%
Latvia 20 7 35.0%
Lithuania 20 1 5.0%
Luxembourg 10 0 0.0%
Hungary 15 0 0.0%
Malta 23 1 4.3%
Netherlands 20 4 20.0%
Austria 20 1 5.0%
Poland 20 2 10.0%
Portugal 17 5 29.4%
Romania 13 1 7.7%
Slovenia 20 3 15.0%
Slovakia 10 2 20.0%
Finland 24 6 25.0%
Sweden 26 13 50.0%
United Kingdom 50 17 34.0%
Montenegro 10 3 30.0%
former Yugoslav Republic of Macedonia, the
10 1 10.0%
Turkey 50 3 6.0%
Serbia 11 2 18.2%
Bosnia and Herzegovina 10 1 10.0%
Iceland 18 16 88.9%
Liechtenstein - - -
Norway 22 11 50.0%
All countries 736 184 25.0%
“-“: Not applicable


![Beyond the Numbers: Substantive Gender Diversity in Boardrooms Files... · 3/8/2017 · 2 BEYOND THE NUMBERS [2018] company performance,7 the push for diversity has gained traction](https://static.fdocuments.us/doc/165x107/5f54f964aebf4b068d400af9/beyond-the-numbers-substantive-gender-diversity-in-boardrooms-files-382017.jpg)