Statistical methods for the meta-analysis of full ROC curves · Statistical methods for the...
38
Statistical methods for the meta-analysis of full ROC curves Oliver Kuss (joint work with Stefan Hirt and Annika Hoyer) German Diabetes Center, Leibniz Institute for Diabetes Research at Heinrich Heine University D ¨ usseldorf, Institute for Biometry and Epidemiology May 4, 2016 1 / 35 Kuss/ Hoyer May 4, 2016
Transcript of Statistical methods for the meta-analysis of full ROC curves · Statistical methods for the...

Statistical methods for the meta-analysis offull ROC curves
Oliver Kuss (joint work with Stefan Hirt and Annika Hoyer)
German Diabetes Center,Leibniz Institute for Diabetes Research at Heinrich Heine
University Dusseldorf,Institute for Biometry and Epidemiology
May 4, 2016
1 / 35 Kuss/ Hoyer May 4, 2016

Outline
Introduction
Bivariate time-to-event model for interval-censored data
Discussion
2 / 35 Kuss/ Hoyer May 4, 2016

Introduction
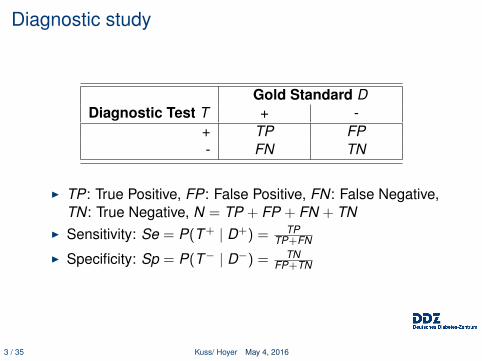
Diagnostic study
Gold Standard DDiagnostic Test T + -
+ TP FP- FN TN
I TP: True Positive, FP: False Positive, FN: False Negative,TN: True Negative, N = TP + FP + FN + TN
I Sensitivity: Se = P(T+ | D+) = TPTP+FN
I Specificity: Sp = P(T− | D−) = TNFP+TN
3 / 35 Kuss/ Hoyer May 4, 2016

Diagnostic study
Gold Standard DDiagnostic Test T + -
+ 392 1130- 267 5015
I Sensitivity: Se = P(T+ | D+) = 392392+267 = 59%
I Specificity: Sp = P(T− | D−) = 50151130+5015 = 82%
4 / 35 Kuss/ Hoyer May 4, 2016

Meta-analysis
I ’Meta-analysis is a quantitative, systematic summary of acollection of separate studies for the purpose of obtaininginformation that cannot be derived from any of the studiesalone’ (Boissel et al., 1988)
5 / 35 Kuss/ Hoyer May 4, 2016

Meta-analysis of diagnostic studies
I Meta-analysis for intervention studies is well establishedtoday
I In contrast, meta-analysis of diagnostic studies has been avivid research area in recent years
I Reason: Increased complexity of diagnostic trials with theirbivariate outcome of sensitivity and specificity
6 / 35 Kuss/ Hoyer May 4, 2016

Meta-analysis of diagnostic studies
Study Sensitivity Specificity
1 392/659 5015/6145
2 207/252 2704/5865
... ... ...
SeMA=... SpMA=...
generally negativelycorrelated
7 / 35 Kuss/ Hoyer May 4, 2016

Meta-analysis of diagnostic studies
I Additional challenge: Single studies report a full ROCcurve with several pairs of sensitivity and specificity, eachone for a different threshold
I Still greater challenge: Values and numbers of thresholdscan vary between single studies
8 / 35 Kuss/ Hoyer May 4, 2016
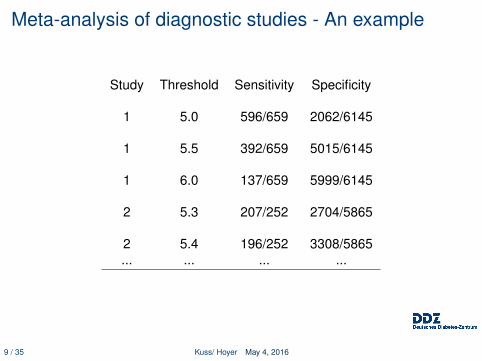
Meta-analysis of diagnostic studies - An example
Study Threshold Sensitivity Specificity
1 5.0 596/659 2062/6145
1 5.5 392/659 5015/6145
1 6.0 137/659 5999/6145
2 5.3 207/252 2704/5865
2 5.4 196/252 3308/5865... ... ... ...
9 / 35 Kuss/ Hoyer May 4, 2016
Meta-analysis of diagnostic studies - An example
10 / 35 Kuss/ Hoyer May 4, 2016
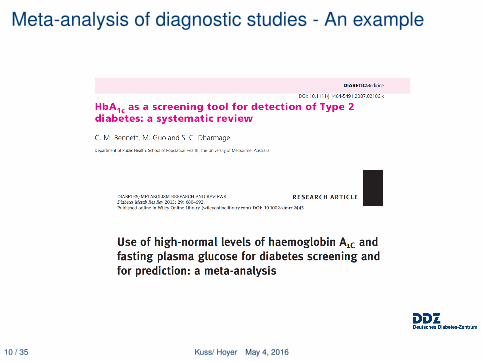
Meta-analysis of diagnostic studies - An example
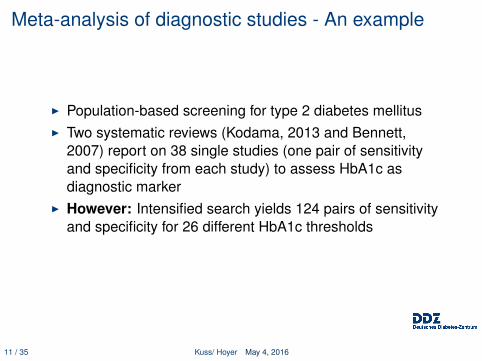
I Population-based screening for type 2 diabetes mellitusI Two systematic reviews (Kodama, 2013 and Bennett,
2007) report on 38 single studies (one pair of sensitivityand specificity from each study) to assess HbA1c asdiagnostic marker
I However: Intensified search yields 124 pairs of sensitivityand specificity for 26 different HbA1c thresholds
11 / 35 Kuss/ Hoyer May 4, 2016

Meta-analysis of diagnostic studies - An example
0.0 0.2 0.4 0.6 0.8 1.0
1-Specificity
0.0
0.2
0.4
0.6
0.8
1.0
Sensitivity
12 / 35 Kuss/ Hoyer May 4, 2016
Meta-analysis of diagnostic studies - An example
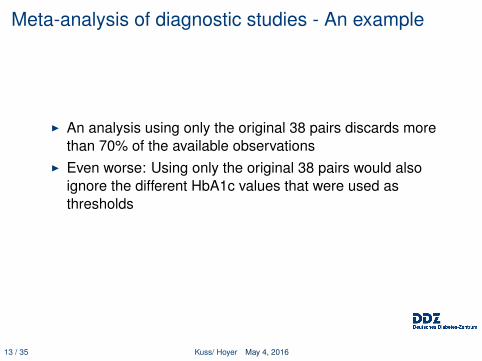
I An analysis using only the original 38 pairs discards morethan 70% of the available observations
I Even worse: Using only the original 38 pairs would alsoignore the different HbA1c values that were used asthresholds
13 / 35 Kuss/ Hoyer May 4, 2016

Meta-analysis of diagnostic studies - The paradox ofthe standard SROC
I A summary ROC curve from the original 38 pairs explicitlyignores the ROC information from the single studies and. . .
I ’. . . is in principle unidentifiable’ [Rucker/Schumacher,2010]’
I ’. . . cannot be interpreted as a kind of average curve or acurve typical for the study-specific ROC curves. It can havea shape that is very different from the study-specificshapes.’ [Arends et al., 2008]
14 / 35 Kuss/ Hoyer May 4, 2016

Meta-analysis of diagnostic studies - The paradox ofthe standard SROC
[Chu/Guo, 2009]15 / 35 Kuss/ Hoyer May 4, 2016
Meta-analysis of diagnostic studies -Recommendations
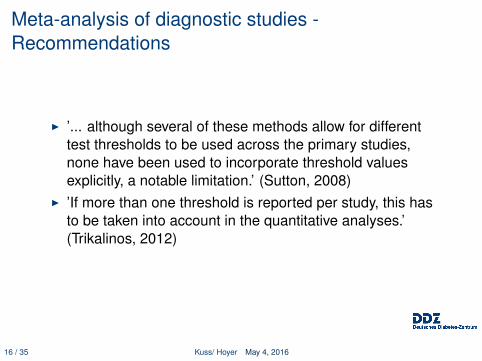
I ’... although several of these methods allow for differenttest thresholds to be used across the primary studies,none have been used to incorporate threshold valuesexplicitly, a notable limitation.’ (Sutton, 2008)
I ’If more than one threshold is reported per study, this hasto be taken into account in the quantitative analyses.’(Trikalinos, 2012)
16 / 35 Kuss/ Hoyer May 4, 2016
Meta-analysis of diagnostic studies - Currentapproaches using the full information from each study
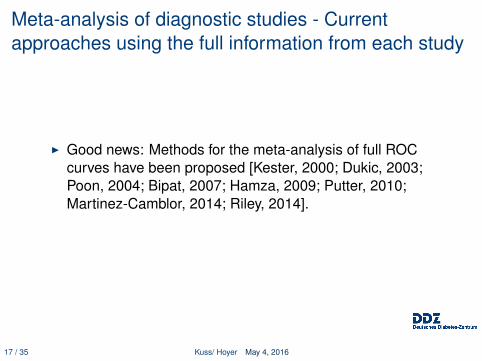
I Good news: Methods for the meta-analysis of full ROCcurves have been proposed [Kester, 2000; Dukic, 2003;Poon, 2004; Bipat, 2007; Hamza, 2009; Putter, 2010;Martinez-Camblor, 2014; Riley, 2014].
17 / 35 Kuss/ Hoyer May 4, 2016
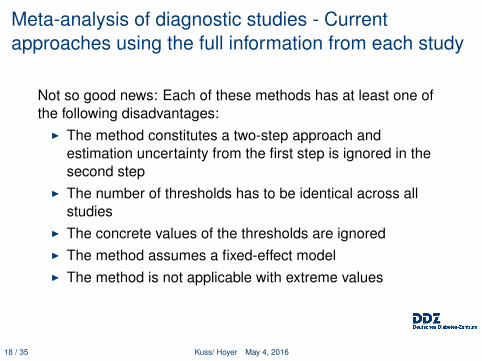
Meta-analysis of diagnostic studies - Currentapproaches using the full information from each study
Not so good news: Each of these methods has at least one ofthe following disadvantages:
I The method constitutes a two-step approach andestimation uncertainty from the first step is ignored in thesecond step
I The number of thresholds has to be identical across allstudies
I The concrete values of the thresholds are ignoredI The method assumes a fixed-effect modelI The method is not applicable with extreme values
18 / 35 Kuss/ Hoyer May 4, 2016

Meta-analysis of diagnostic studies - A boring solution
Extend current standard model (Bivariate logistic regressionmodel with random effects) to a meta-regression by adding acovariate for the threshold (under review at ’Statistical Methodsin Medical Research’)
19 / 35 Kuss/ Hoyer May 4, 2016
Bivariate time-to-event model forinterval-censored data

ROC from Sato et al.
0.0 0.2 0.4 0.6 0.8 1.0
1-Specificity
0.0
0.2
0.4
0.6
0.8
1.0
Sens
itivi
ty
5.0
5.5
6.0
20 / 35 Kuss/ Hoyer May 4, 2016

ROC from Sato et al.
0.0 0.2 0.4 0.6 0.8 1.0
1-Specificity
0.0
0.2
0.4
0.6
0.8
1.0
Sens
itivi
ty
0 659
267
659
522
596 63
392
137
0
21 / 35 Kuss/ Hoyer May 4, 2016

’Life-table’ estimator from Sato et al.
0 1 2 3 4 5 6
HbA1c
0.2
0.4
0.6
0.8
1.0Se
nsiti
vity
5.0
5.5
6.0
63/659
267/659
22 / 35 Kuss/ Hoyer May 4, 2016

Fundamental insight
An ROC curve can be considered abivariate time-to-event model for
interval-censored data!
23 / 35 Kuss/ Hoyer May 4, 2016

Bivariate time-to-event model for interval-censoreddata - Notation
I Given K observations from a continuous variable Y (in ourcase: HbA1c) as lying in intervals (yL
k , yRk ] with
∆k = yRk − yL
kI Y has density f (y , µ, θ) with corresponding cdf F (y , µ, θ); µ
is a location and φ a scale parameterI In general, three types of censoring can occur:
Type of Censoring Interval Contribution to LogLLeft yL
k = 0, yRk 6=∞ F (yR
k ;µ, φ)
Interval yLk 6= 0, yR
k 6=∞ [f (yk ;µ, φ)∆k ]
Right yLk 6= 0, yR
k =∞ [1− F (yLk ;µ, φ)]
24 / 35 Kuss/ Hoyer May 4, 2016

Bivariate time-to-event model for interval-censoreddata - Densities
We consider three densities for Y :
Weibull f (y ;µ, φ) = φyφ−1exp(−(y/µ)φ)µφ
Log-normal f (y ;µ, φ) = exp(−[log(y)−µ]2/(2φ))y√
2πφ
Log-logistic f (y ;µ, φ) = πexp(−π[log(y)−µ]/(√
3φ))y√
3φ(1+exp(−π[log(y)−µ]/(√
3φ)))
(See Lindsey, 1998 for more densities)
25 / 35 Kuss/ Hoyer May 4, 2016

Bivariate time-to-event model for interval-censoreddata - Final model
After a log transformation, the diagnostic test values Y0 and Y1for non-diseased and diseased probands are allowed to varybetween studies and are linked by a bivariate normaldistribution with correlation ρ.
log(y0) = b0 + ε0 + u0i , (1)
log(y1) = b1 + ε1 + u1i , (2)
and (u0i
u1i
)∼ N
[(00
),
(σ2
0 ρσ0σ1ρσ0σ1 σ2
1
)]. (3)
26 / 35 Kuss/ Hoyer May 4, 2016

Parameter estimation
I The following parameters have to be estimated:b0,b1, ε0, ε1, σ
20, σ
21, and ρ.
I Estimation method: Gaussian quadrature (SAS PROCNLMIXED)
I We are not interested in the model parameters, but in thesummary ROC curve
I That is, predict sensitivity and specificity at giventhresholds by the BLUP principle (PREDICT statement,NLMIXED)
27 / 35 Kuss/ Hoyer May 4, 2016

Results for the HbA1c example
0.0 0.2 0.4 0.6 0.8 1.0
1-Specificity
0.0
0.2
0.4
0.6
0.8
1.0
Sensitivity
Log-logisticLog-normalWeibull
28 / 35 Kuss/ Hoyer May 4, 2016

Results for the HbA1c example - Estimated densitites
29 / 35 Kuss/ Hoyer May 4, 2016

Discussion

Summary
We proposed an approach for the meta-analysis of full ROCcurves that use the information for all thresholds.It avoids the problems of previous methods and comes with thefollowing advantages:
I Constitutes a one-step approachI Allows varying numbers and varying values of thresholdsI Explicitly models the value of the diagnostic testI Allows heterogeneity of sensitivity and specificity across
studiesI Accounts for correlation within studies
30 / 35 Kuss/ Hoyer May 4, 2016
Summary
I Ensures proper weighting of studies’ sample sizeI Works well in simulationsI Can be generalized to compare two (or even more)
diagnostic tests to a common gold standard
31 / 35 Kuss/ Hoyer May 4, 2016
Limitations
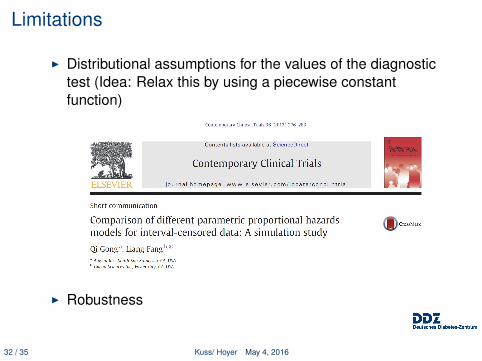
I Distributional assumptions for the values of the diagnostictest (Idea: Relax this by using a piecewise constantfunction)
I Robustness
32 / 35 Kuss/ Hoyer May 4, 2016

Thank you!
View from the IBE on ”Rheinisches Braunkohlerevier”
33 / 35 Kuss/ Hoyer May 4, 2016

BibliographyBennett CM, Guo M, Dharmage SC. HbA1c as a screening tool for detection of Type 2 diabetes: asystematic review.Diabetic Medicine. 2007;24:333-343.
Kodama S, Horikawa C, Fujihara K, Hirasawa R, Yachi Y, Yoshizawa S, Tanaka S, Sone Y, Shimano H, IidaKT, Saito K, Sone H. Use of high-normal levels of haemoglobin A1C and fasting plasma glucose for diabetesscreening and for prediction: a meta-analysis.Diabetes/ Metabolism Research and Reviews. 2013;29(8):680-692.
Rucker G, Schumacher M. Summary ROC curve based on a weighted Youden index for selecting an optimalcutpoint in meta-analysis of diagnostic accuracy.Statistics in Medicine. 2010; 29(30):3069-3078.
Arends LR, Hamza TH, van Houwelingen JC, Heijenbrok-Kal MH, Hunink MG, Stijnen T. Bivariate randomeffects meta-analysis of ROC curves.Medical Decision Making. 2008;28(5):621-38.
Chu H, Guo H. Letter to the editor.Biostatistics. 2009;10(1):201-203.
Kester AD, Buntinx F. Meta-analysis of ROC curves.Medical Decision Making. 2000;20(4):430-9.
Dukic V, Gatsonis C. Meta-analysis of diagnostic test accuracy assessment studies with varying number ofthresholds.Biometrics. 2003;59:936-46.
Poon WY. A latent normal distribution model for analysing ordinal responses with applications inmeta-analysis.Statistics in Medicine. 2004;23(14):2155-72.
34 / 35 Kuss/ Hoyer May 4, 2016

BibliographyBipat S, Zwinderman AH, Bossuyt PM, Stoker J. Multivariate random-effects approach: for meta-analysis ofcancer staging studies.Academic Radiology. 2007;14(8):974- 84.
Hamza TH, Arends LR, van Houwelingen HC, Stijnen T. Multivariate random effects meta-analysis ofdiagnostic tests with multiple thresholds.BMC Medical Research Methodology. 2009;9:73.
Putter H, Fiocco M, Stijnen T. Meta-analysis of diagnostic test accuracy studies with multiple thresholdsusing survival methods.Biometrical Journal. 2010;52(1):95-110.
Martinez-Camblor P. Fully non-parametric receiver operating characteristic curve estimation forrandom-effects meta-analysis.Statistical Methods in Medical Research. 2014 May 28.
Riley RD, Takwoingi Y, Trikalinos T, Guha A, Biswas A, Ensor J, Morris RK, Deeks JJ. Meta-Analysis of TestAccuracy Studies with Multiple and Missing Thresholds: A Multivariate-Normal Model.Journal of Biometrics & Biostatistics. 2014;5:196.
Zhang J, Yang Q, Zhang JA, Chen Y, Qin Q, Yang J, Yan N. The value of HbA1c for diagnosing type 2diabetes in high-risk population.Journal of Xian Jiaotong University (Medical Sciences). 2010;31(4):512514.
Lindsey JK. A study of interval censoring in parametric regression models.Lifetime Data Analysis. 1998;4(4):329-54.
Gong Q, Fang L. Comparison of different parametric proportional hazards models for interval-censored data:a simulation study.Contemporary Clinical Trials. 2013;36(1):276-83.
35 / 35 Kuss/ Hoyer May 4, 2016