Statistical Methods for NLP - Columbia Universitysmaskey/CS6998/slides/statnlp_week1.pdf ·...
49
Statistical Methods for NLP Introduction, Text Mining, Linear Methods of Regression Sameer Maskey Week 1, January 19, 2010
Transcript of Statistical Methods for NLP - Columbia Universitysmaskey/CS6998/slides/statnlp_week1.pdf ·...

Statistical Methods for NLP
Introduction, Text Mining, Linear Methods of Regression
Sameer Maskey
Week 1, January 19, 2010

Course Information
Course Website: http://www.cs.columbia.edu/~smaskey/CS6998
Discussions in courseworks Office hours Tues: 2 to 4pm, Speech Lab (7LW1), CEPSR Individual appointments in person or in phone can be set
by emailing the instructor : [email protected] Instructor: Dr. Sameer Maskey Prerequisites
Probability, statistics, linear algebra, programming skill CS Account

Grading and Academic Integrity
3 Homework (15% each) Homework due dates are available in the class webpage You have 3 ‘no penalty’ late days in total that can be used during
the semester Each additional late day (without approval) will be penalized, 20%
each day No midterm exam Final project (40%)
It is meant for you to explore and do research NLP/ML topic of your choice
Project proposal due sometime in the first half of the semester Final Exam (15%) Collaboration allowed but presenting someone else’s work
(including code) will result in automatic zero

Textbook
For NLP topics we will use the following book: Speech and Language Processing (2nd Edition) by Daniel
Jurafsky and James H Martin
For statistical methods/ML topics we will partly use Pattern Recognition and Machine Learning by Christopher
Bishop There are also two online textbooks which will be available
for the class, some readings may be assigned from these Other readings will be provided for the class online

Goal of the Class
By the end of the semester You will have in-depth knowledge of several NLP and ML topics
and explore the relationship between them
You should be able to implement many of the NLP/ML methods on your own
You will be able to frame many of the NLP problems in statistical framework of your choice
You will understand how to analytically read NLP/ML papers and know the kind of questions to ask oneself when doing NLP/ML research

Topics in NLP (HLT, ACL) Conference Morphology (including word segmentation) Part of speech tagging Syntax and parsing Grammar Engineering Word sense disambiguation Lexical semantics Mathematical Linguistics Textual entailment and paraphrasing Discourse and pragmatics Knowledge acquisition and representation Noisy data analysis Machine translation Multilingual language processing Language generation Summarization Question answering Information retrieval Information extraction Topic classification and information filtering Non-topical classification (sentiment/genre analysis) Topic clustering Text and speech mining Text classification Evaluation (e.g., intrinsic, extrinsic, user studies) Development of language resources Rich transcription (automatic annotation) …

Topics in ML (ICML, NIPS) Conference Reinforcement Learning Online Learning Ranking Graphs and Embeddding Gaussian Processes Dynamical Systems Kernels Codebook and Dictionaries Clustering Algorithms Structured Learning Topic Models Transfer Learning Weak Supervision Learning Structures Sequential Stochastic Models Active Learning Support Vector Machines Boosting Learning Kernels Information Theory and Estimation Bayesian Analysis Regression Methods Inference Algorithms Analyzing Networks & Learning with Graphs …

Morphology (including word segmentation) Part of speech tagging Syntax and parsing Grammar Engineering Word sense disambiguation Lexical semantics Mathematical Linguistics Textual entailment and paraphrasing Discourse and pragmatics Knowledge acquisition and representation Noisy data analysis Machine translation Multilingual language processing Language generation Summarization Question answering Information retrieval Information extraction Topic classification and information filtering Non-topical classification (sentiment/genre analysis) Topic clustering Text and speech mining Text classification Evaluation (e.g., intrinsic, extrinsic, user studies) Development of language resources Rich transcription (automatic annotation) …
Reinforcement Learning Online Learning Ranking Graphs and Embeddding Gaussian Processes Dynamical Systems Kernels Codebook and Dictionaries Clustering Algorithms Structured Learning Topic Models Transfer Learning Weak Supervision Learning Structures Sequential Stochastic Models Active Learning Support Vector Machines Boosting Learning Kernels Information Theory and Estimation Bayesian Analysis Regression Methods Inference Algorithms Analyzing Networks & Learning with Graphs …
NLP ML Many Topics Related Tasks Solutions
Combine Relevant Topics
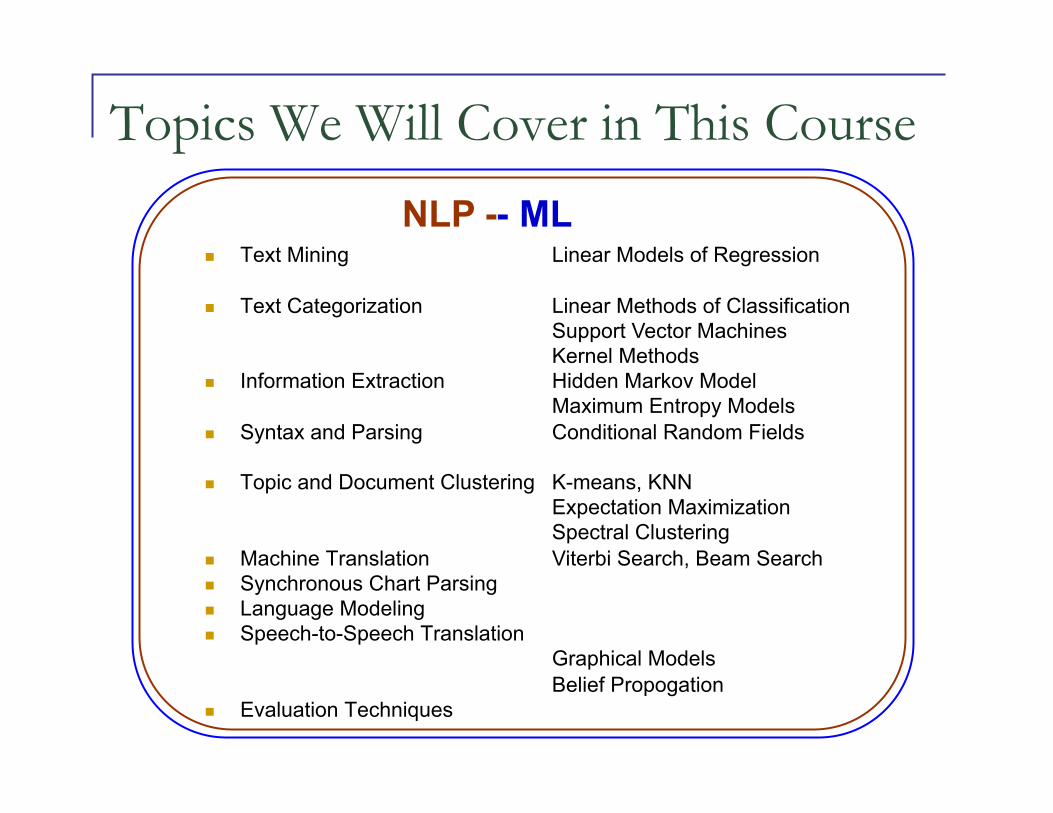
Topics We Will Cover in This Course
NLP - - ML Text Mining
Text Categorization
Information Extraction
Syntax and Parsing
Topic and Document Clustering
Machine Translation Synchronous Chart Parsing Language Modeling Speech-to-Speech Translation
Evaluation Techniques
Linear Models of Regression
Linear Methods of Classification Support Vector Machines Kernel Methods Hidden Markov Model Maximum Entropy Models Conditional Random Fields
K-means, KNN Expectation Maximization Spectral Clustering Viterbi Search, Beam Search
Graphical Models Belief Propogation

Text Mining
Data Mining: finding nontrivial patterns in databases that may be previously unknown and could be useful
Text Mining: Find interesting patterns/information from unstructured text Discover new knowledge from these patterns/information
Information Extraction, Summarization, Opinion Analysis, etc can be thought as some form of text mining
Let us look at an example

Patterns in Unstructured Text
Patterns may exist in unstructured text
Some of these patterns could be exploited to discover knowledge
All Amazon reviewers may not rate the product, may just
write reviews, we may have to infer the rating based on text review
Review of a camera in Amazon

Text to Knowledge
Text Words, Reviews, News Stories, Sentences,
Corpus, Text Databases, Real-time text, Books
Knowledge Ratings, Significance, Patterns, Scores, Relations
Many methods to use for discovering
knowledge from text

Unstructured Text Score Facebook’s “Gross National Happiness Index”
Facebook users update their status “…is writing a paper” “… has flu ” “… is happy, yankees won!”
Facebook updates are unstructured text Scientists collected all updates and analyzed them
to predict “Gross National Happiness Index”

Facebook’s “Gross National Happiness Index”
How do you think they extracted this SCORE from a TEXT collection of status updates?

Facebook Blog Explains
“The result was an index that measures how happy people on Facebook are from day-to-day by looking at the number of positive and negative words they're using when updating their status. When people in their status updates use more positive words - or fewer negative words - then that day as a whole is counted as happier than usual.”
Looks like they are COUNTING! +ve and –ve words in status updates

Let’s Build Our NLP/ML Model to Predict Happiness
Simple Happiness Score Our simpler version of happiness index compared to
facebook Score ranges from 0 to 10
There are a few things we need to consider We are using status updates words We do not know what words are positive and
negative We do not have any training data

Our Prediction Problem
Training data Assume we have N=100,000 status updates Assume we have a simple list of positive and negative words Let us also assume we asked a human annotator to read each of
the 100,000 status update and give a happiness Score (Yi) between 0 to 10 “…is writing a paper” (Y1 = 4) “… has flu ” (Y2 = 1.8) . . . “… is happy, game was good!” (Y100,000 = 8.9)
Test data “… likes the weather” (Y100,001 = ? )
Given labeled set of 100K Status updates, how do we build
Statistical/ML model that will predict the score for a
new status update

What kind of feature can we come up with that would relate well with happiness score
How about represent status update as Count (+ve words in the sentence) (not the ideal
representation, will better representation letter)
For the 100,000th sentence in our previous example: “…is happy, game was good.” Count is 2 Status Update 100,000th is represented by
(X100000 = 2, Y100000 = 8.9)
Representing Text of Status Updates As a Vector
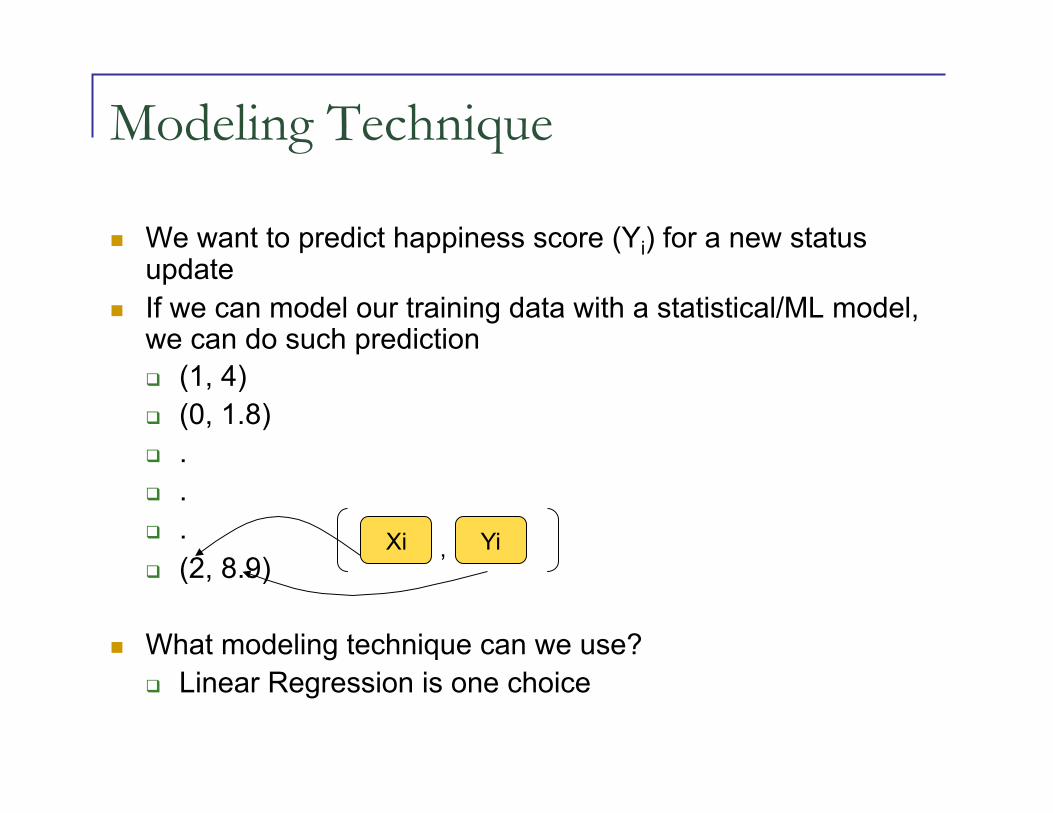
Modeling Technique
We want to predict happiness score (Yi) for a new status update
If we can model our training data with a statistical/ML model, we can do such prediction (1, 4) (0, 1.8) . . . (2, 8.9)
What modeling technique can we use? Linear Regression is one choice
Xi Yi ,

Linear Regression
We want to find a function that given our x it would map it to y One such function :
Different values of thetas give different functions What is the best theta such that we have a function that makes least error on predictions when compared with y

Predicted vs. True

Sum of Squared Errors
Plugging in f(x) and averaging the error across all training data points we get the empirical loss
f(xi)
yi
xi
y

Finding the Minimum We can (but not always) find a minimum of a function by setting the derivative or partial derivatives to zero Here we can take partials on thetas and set them to zero

Solving for Weights

Empirical Loss is Minimized With Given Values for the Parameters
Solving the previous equations we get following values for the thetas
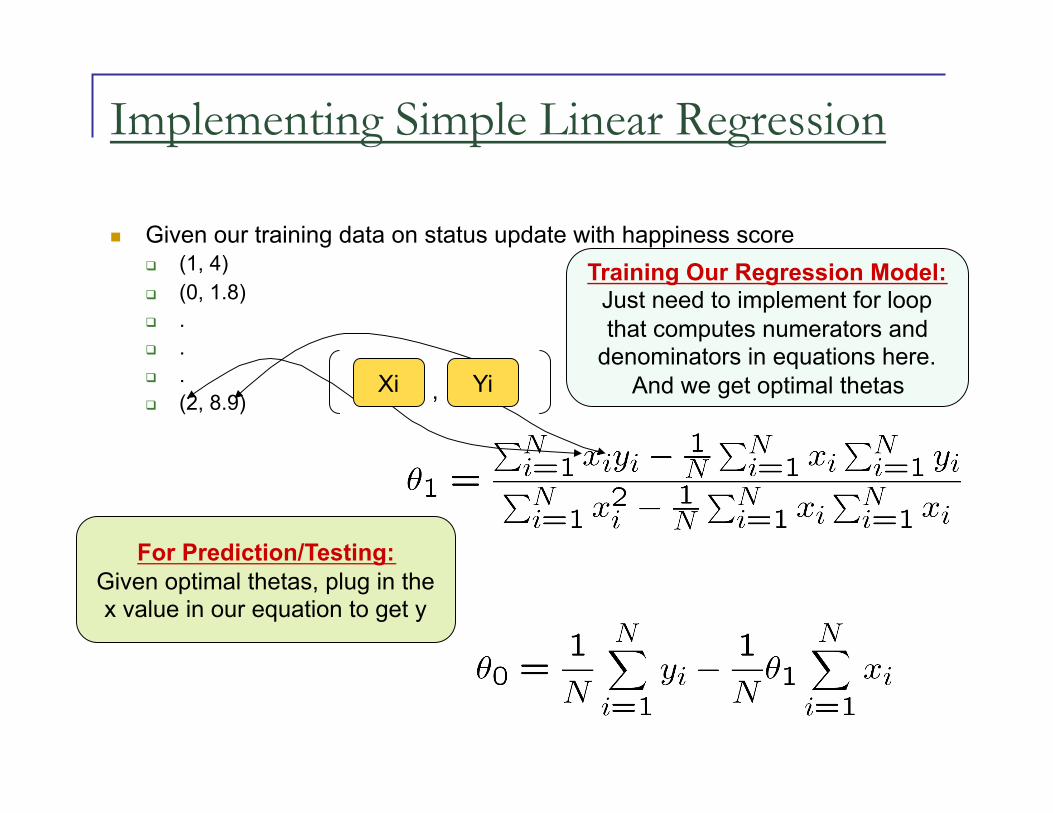
Implementing Simple Linear Regression
Given our training data on status update with happiness score (1, 4) (0, 1.8) . . . (2, 8.9)
Xi Yi ,
Training Our Regression Model: Just need to implement for loop that computes numerators and
denominators in equations here. And we get optimal thetas
For Prediction/Testing: Given optimal thetas, plug in the x value in our equation to get y

Simple Happiness Scoring Model too Simple? So far we have a regression model that was
trained on a training data of facebook status updates (text) and labeled happiness score
Status updates words were mapped to one feature Feature counted number of +ve words
Maybe too simple? How can we improve the model? Can we add more features?
How about count of –ve words as well

Let Us Add One More Feature
Adding one more feature Zi representing count of –ve words, now training data will look like the following (1, 3, 4) (0, 6,1.8) . . . (2, 0, 8.9)
What would our linear regression function would look like
Xi Zi , Yi ,
Estimation of y i.e. f(x,z) is now a plane instead of a line
[3]

Regression Function in Matrix Form
Remember our regression function in 2D looked like
Representing in Matrix form we get,
And empirical loss will be

Adding Features
In K dimensions the regression function f(x) we estimate will look like
So the empirical loss would
Representing with matrices

Empirical Loss with K Features and N Data Points in Matrix Representation Representing empirical loss in Matrix form
Y X θ

Solve by Setting Partial Derivatives to Zero Remember, to find the minimum empirical loss we set the
partial derivatives to zero We can still do the same in matrix form, we have to set the
derivatives to zero
Solving the above equation we get our best set of parameters

Implementation of Multiple Linear Regression
Given out N training data points we can build X and Y matrix and perform the matrix operations
Can use MATLAB Or write your own, Matrix multiplication implementation Get the theta matrix For any new test data plug in the x values (features) in our
regression function with the best theta values we have

Back to Our Happiness Prediction Regression Model Xi1 represented count of +ve words (Xi1, Yi) pair were used to build simple linear regression model We added one more feature Xi2, representing count of –ve words (Xi1, Xi2, Yi) can be used to build multiple linear regression model
Our training data would look like (1, 3, 4) (0, 6,1.8) . . . (2, 0, 8.9)
From this we can build X and Y Matrix and find the best theta values For N Data points, we will get Nx3 X matrix, Nx1 Y matrix and 3X1 θ matrix
Xi1 Xi2 , Yi ,

More Features? Feature Engineering
So far we have only two features, is it good enough? Should we add more features? What kind of features can we add?
Ratio of +ve/-ve words Normalized count of +ve words Is there a verb in the sentence?
We need to think what are the kinds of information that may better estimate the Y values
If we add above 3 features, what is the value of K?
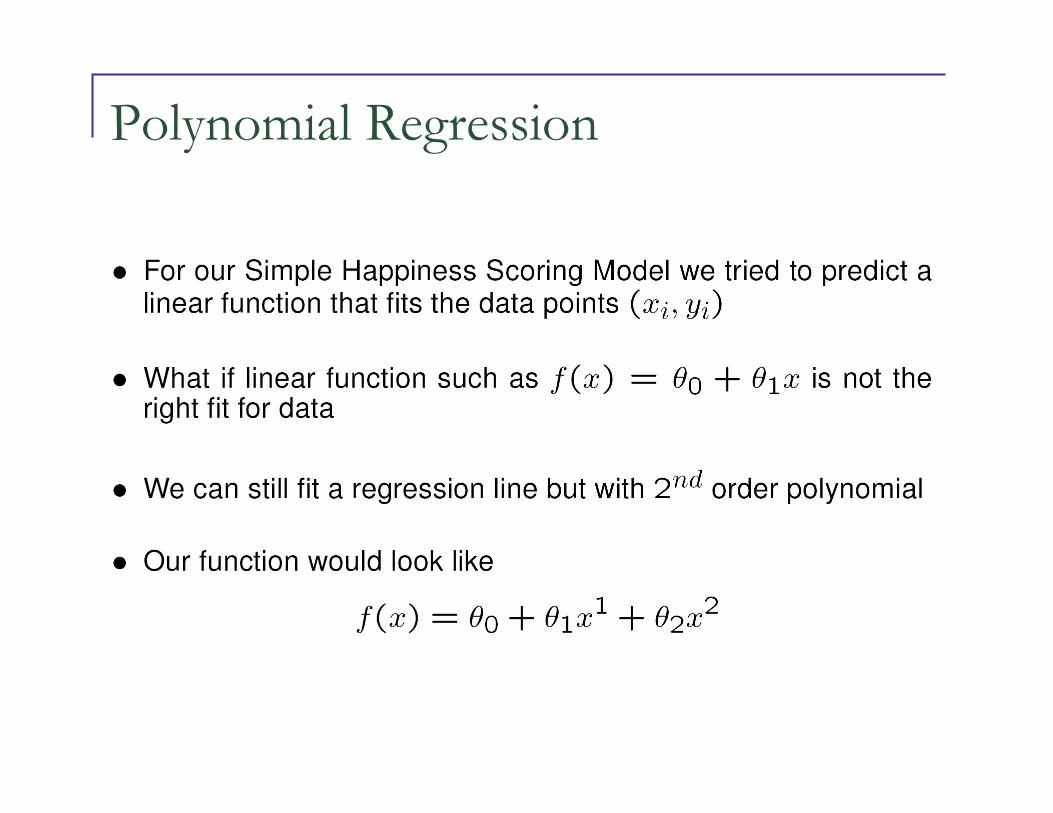
Polynomial Regression

Polynomial Regression

K Features, M Order Polynomial and N Data Points
With K=1, we get a regression line, with K=2 we get a plane
With M=1 we get a straight line or plane With M=2 we get a curved line or plane So with K=2 and M=2 ?

Trend Surface
Trend Surfaces for different orders of polynomial [1]

Overfitting Higher order of polynomial should be used with caution though Higher order polynomial can fit the training data too closely
especially when few training points, with the generalization error being high
Leave one out cross validation allows to estimate generalization error better If N data points use N-1 data points to train and use 1 to test
Higher order of polynomial overfitting with few data points [2]

Testing Our Model
Our goal was to build the best statistical model that would automate the process of scoring a chunk of text (Happiness Score)
How can we tell how good is our model? Remember previously we said let us assume we
have 100,000 status updates Instead of using all 100K sentences let use the first
90K to build the model Use rest of 10K to test the model

10-fold Cross Validation 10 fold cross validation
We trained on first 90K (1 to 90,000) Tested on (90,001 to 100,000) But we can do this 10 times if we select different 10K of test data
point each time 10k 10k 10k 10k 10k 10k 10k 10k 10k 10k
10k 10k 10k 10k 10k 10k 10k 10k 10k 10k
10k 10k 10k 10k 10k 10k 10k 10k 10k 10k
…
10 experiments, build model and test times with 10 different sets of training and test data
Average the accuracy across 10 experiments We can do any N-fold cross validation to test our model
Exp1
Exp2
Exp10

Scores from Text, What Else Can They Represent? Given a facebook status update we can predict
happiness score But we can use the same modeling technique in
many other problems Summarization: Score may represent importance Question Answering: Score may represent relevance Information extraction : Score may represent relation
We need to engineer features according to the problem
Many uses of the statistical technique we learned today
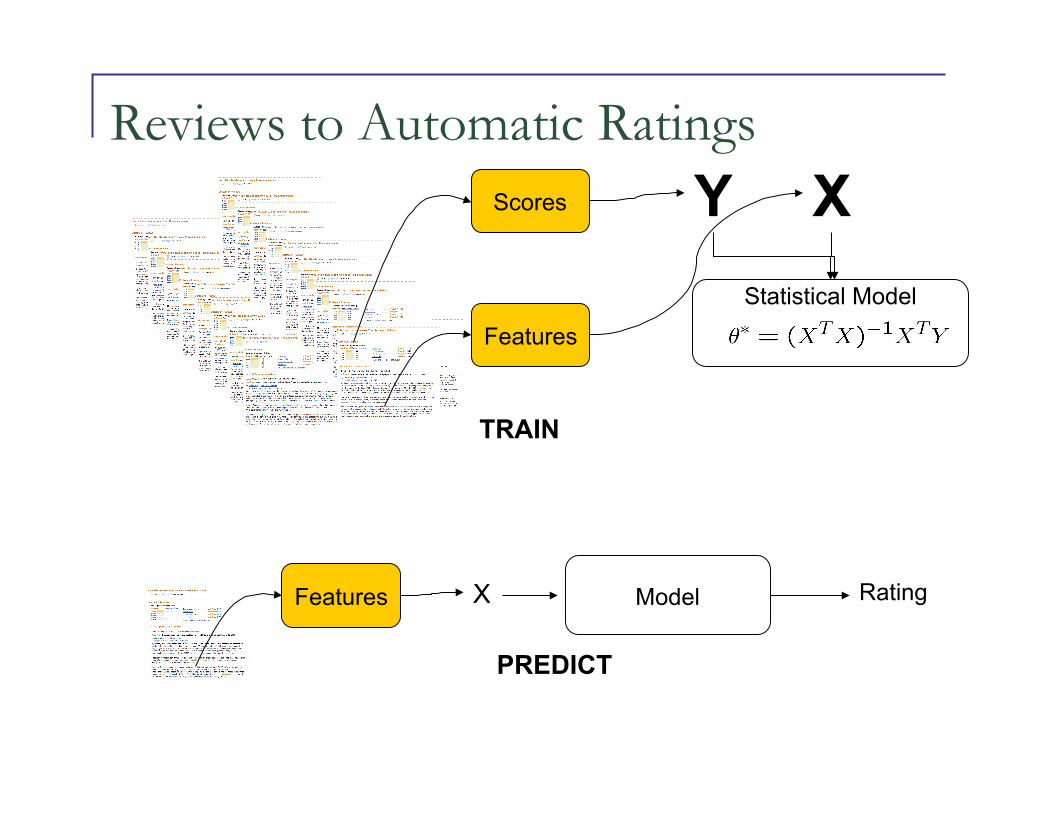
Reviews to Automatic Ratings
Model Rating
Features
Scores Y X Statistical Model
Features X
TRAIN
PREDICT

Unstructured Text to Binary Labels
Let us change the type of problem a bit Instead of a real valued happiness score between 0 and 10,
let us assume our annotators just provide unhappy (0) or happy (1) Or it can be Amazon review for a product dislike (0) and like (1)
Can we and should we still model this kind data with regression?

Gaussian Noise

Class Prediction from Text
If ‘y’ outputs are binary classes we may want to use a different modeling technique
Binary classifiers could model such data We need to chose our models according to
the problem we are handling We probably need better representation of
text as well

Readings
1.1, 3.1, 4.1 Bishop Book 23.1.1, 23.1.2, 23.1.3 Jurafsky & Martin Book

References
[1] http://biol09.biol.umontreal.ca/PLcourses/Polynomial_regression.pdf [2] Christopher Bishop, Pattern Recognition and Machine Learning, Springer, 2006 [3] Hastie, Tibshirani and Friedman, Elements of Statistical Learning, 2001