Statistical Literacy: A Study of Confounding
30
Statistical Literacy: A Study of Confounding Milo Schield, Augsburg University. Minneapolis, MN Abstract: Confounding is playing a pivotal role in the evolution of statistical literacy. This paper reviews the status of confounding in some of the leading articles on statistical literacy in three time periods: the confounder absent years (1997-2005), the confounder-present years (2013—2016) and the subsequent confounder-absent years (2017-now). This paper provides explanations for the prior omission of confounding, the dramatic increase and the subsequent lapse. This paper argues that we need agreement on the necessary components for a statistical literacy course and we need a way to distinguish a confounder-based statistical literacy course. This paper proposes that the phrase "confounder-based" statistical literacy course be reserved for a statistical literacy course in which confounding is featured at least as often as statistical inference. Keywords: statistical education 1. Statistical Literacy: Agreement and Disagreement Almost everyone who writes about statistical literacy views it as being important. And there is general agreement on two components: (1) statistical literacy is the statistical knowledge and skills needed by consumers and (2) statistical literacy must emphasize concepts and critical thinking over formula and computation. Beyond that there is little agreement. Schield (2017). Confounding is the component on which there is arguably the biggest lack of agreement. Confound- ing is absent in major papers on statistical literacy between 1997 and 2012; massively present be- tween 2013 and 2016. And generally absent thereafter. What explains the initial situation and the sudden increase and the subsequent decrease? Is there hope? What will it take? 2. Confounding-Absent Years (1997 – 2005) 2.1 Moore (1997, 1998). Moore (1997) authored "New Pedagogy and New Content: The Case of Statistics". ResearchGate says the article has 436 citations. The article had one match for statistical thinking and no matches for statistical literacy, confound, lurking variable, statistical reasoning or critical thinking. In "Statistics as a Liberal Art", Moore (1998) argued that the first course is not intended to develop statisticians. He noted the importance of big ideas such as association versus causation, However, the phrase 'statistical literacy' and 'lurking variable' never appeared not did any word involving the root 'confound' such as confounding, confounded or confounder. Neither Google Scholar nor Re- searchGate have tabulated the citations for this article. See Appendix A. 2.2 Anne Hawkins (1997) Hawkins, Head of the RSS Centre for Statistical Education and President of the IASE, was one of the earliest proponents of statistical literacy for all. Hawkins (1997a) authored "R is for Reasoning" where she said, "'Statistics for All' does not neces- sarily yield 'Statistical Literacy for All'." It contained 11 references to statistical literacy, one to statistically literate, and one to critical, but no references to confound or lurking variable. Hawkins (1997b) responded to Moore's 2003 New Pedagogy and New Content. Her response had 16 references to statistical literacy and 3 to statistically literate, but none to confound or lurking variable. See Appendix B. 2945
Transcript of Statistical Literacy: A Study of Confounding

Statistical Literacy: A Study of Confounding
Milo Schield, Augsburg University. Minneapolis, MN
Abstract: Confounding is playing a pivotal role in the evolution of statistical literacy. This paper reviews the status of confounding in some of the leading articles on statistical literacy in three time periods: the confounder absent years (1997-2005), the confounder-present years (2013—2016) and the subsequent confounder-absent years (2017-now). This paper provides explanations for the prior omission of confounding, the dramatic increase and the subsequent lapse. This paper argues that we need agreement on the necessary components for a statistical literacy course and we need a way to distinguish a confounder-based statistical literacy course. This paper proposes that the phrase "confounder-based" statistical literacy course be reserved for a statistical literacy course in which confounding is featured at least as often as statistical inference.
Keywords: statistical education
1. Statistical Literacy: Agreement and Disagreement Almost everyone who writes about statistical literacy views it as being important. And there is general agreement on two components: (1) statistical literacy is the statistical knowledge and skills needed by consumers and (2) statistical literacy must emphasize concepts and critical thinking over formula and computation. Beyond that there is little agreement. Schield (2017). Confounding is the component on which there is arguably the biggest lack of agreement. Confound-ing is absent in major papers on statistical literacy between 1997 and 2012; massively present be-tween 2013 and 2016. And generally absent thereafter. What explains the initial situation and the sudden increase and the subsequent decrease? Is there hope? What will it take?
2. Confounding-Absent Years (1997 – 2005) 2.1 Moore (1997, 1998). Moore (1997) authored "New Pedagogy and New Content: The Case of Statistics". ResearchGate says the article has 436 citations. The article had one match for statistical thinking and no matches for statistical literacy, confound, lurking variable, statistical reasoning or critical thinking. In "Statistics as a Liberal Art", Moore (1998) argued that the first course is not intended to develop statisticians. He noted the importance of big ideas such as association versus causation, However, the phrase 'statistical literacy' and 'lurking variable' never appeared not did any word involving the root 'confound' such as confounding, confounded or confounder. Neither Google Scholar nor Re-searchGate have tabulated the citations for this article. See Appendix A. 2.2 Anne Hawkins (1997) Hawkins, Head of the RSS Centre for Statistical Education and President of the IASE, was one of the earliest proponents of statistical literacy for all.
Hawkins (1997a) authored "R is for Reasoning" where she said, "'Statistics for All' does not neces-sarily yield 'Statistical Literacy for All'." It contained 11 references to statistical literacy, one to statistically literate, and one to critical, but no references to confound or lurking variable.
Hawkins (1997b) responded to Moore's 2003 New Pedagogy and New Content. Her response had 16 references to statistical literacy and 3 to statistically literate, but none to confound or lurking variable. See Appendix B.
2945

2.3 Gal (2002) In a 27 page paper (12,000 words), Gal (2002) set the stage for how statistical educators should view statistical literacy. Appendix B. According to ResearchGate it has 1,189 citations. The phrase sta-tistical literacy appeared 98 times. In the 44 instances of critical, he emphasized the need to adopt a critical stance, to critically evaluate, to ask critical questions and to think critically. In the eight instances of consumer, he emphasized the need to focus on consumers rather than producers. The root word confound (which includes confounding, confounded and confounder) and the phrase 'lurk-ing variable' are never mentioned. In the five responses and in Gal's reply, statistical literacy was used 137 times. The word confound does not appear. See Appendix D. However the phrase 'lurking variable' appears in Weller's re-sponse: "the potential deception of lurking variables illustrated by Simpson's paradox." 2.4 Ben-Zvi and Garfield (2004) Ben Zvi and Garfield (2004) edited The Challenge of Developing Statistical Literacy, Reasoning and Thinking. ResearchGate finds 350 citations. In the 13 chapters (175,000 words), statistical literacy appears 185 times, confounding twice and lurking variable once. See Appendix E. Confound appears twice. In chapter 2, Pfannkuch and Wild note that "Without randomization, con-founding factors would give biased estimates." In chapter 9, Reading and Shaughnessy note that averages are "used for prediction; and comparison and the incorporation of spreads, or variation, into the process only confounds the issue. Lurking variable appears once. In chapter 10: Reasoning about Covariation by Jonathan Moritz. Moritz notes that "the complexity of the data cases, the number of variables given, the topic of variables, and possible lurking variables can affect judgments of covariation." It seems amazing that 10 of the 13 articles never mention confounding or lurking variable. This may be due to the particular three-level classification introduced by the editors. (1) It does not distinguish between producer and consumer. (2) Critical thinking about statistics is reserved for the highest level (statistical thinking). (3) Causation is limited: "designed experiments are needed in order to establish causation". Given their three-level hierarchy of statistical literacy, reasoning and thinking, it seems that their version of statistical literacy would easily be seen as material for a middle school curriculum, but not worthy of being taught for college credit. If statistical literacy is reserved for students in middle school, then the absence of confounding might very well be appropriate. 2.5 GAISE: College and Pre-K-12 (2005) In 2005, the ASA endorsed the Guidelines for Assessment and Instruction in Statistics Education (GAISE). See Appendix F. In the two reports combined, statistical literacy was used 16 times while variations on confound appeared four times. Neither Google Scholar nor ResearchGate have tabu-lated the citations to these two reports.
2946
3 Confounding-Present Years (2013-2016) The status of confounding increased dramatically between 2013 and 2016. Confounding became massively present. 3.1 Tintle et al (2013) Challenging the State of the Art in Post-Introductory Statistics: Preparation, Concepts, and Peda-gogy was authored by Tintle, Chance, Cobb, Rossman, Roy, Swanson and VanderStoep in 2013. See Appendix G. This article has three references to statistical literacy and 27 to confound. Neither Google Scholar nor ResearchGate have tabulated the citations for this paper. Here are two excerpts:
In multivariable datasets, confounding between measured (and unmeasured) variables be-comes increasingly prominent, with a host of statistical techniques (models) attempting to evaluate the extent of the confounding.
We suggest that students should better understand how confounding and variability are two major obstacles to learning from data, and that design and analysis decisions can limit the ef-fect of these obstacles.
3.2 GAISE Update (2016) The 2016 GAISE update called for a multivariate focus in introductory statistics. Confounding cannot be understood in a bivariate context. The GAISE update also highlighted confounding as a topic that could and should be taught in introductory statistics. See Appendix H. According to ResearchGate (B. Wood), this report has been cited 35 times. Statistical thinking ap-peared 42 times, statistical literacy appeared only three times and statistically literate appeared just once. But the GAISE 2016 update mentioned confound 20 times. More importantly it highlighted confounding as a secondary goal. Yes, this 2016 update eliminated statistical literacy as a stated goal. But Schield (2016) said:
By introducing multivariate thinking and, more importantly, confounding, the GAISE revision committee has accepted – and greatly advanced – statistical literacy in the process. The revised guideline (GAISE, 2016) is the most important institutional paper advancing statistical literacy to date
4 What Explains the Increase?
4.1 What explains the early absence? Confounding was not mentioned by Moore (1997, 1998), Hawkins (1997) or by Gal (2002). It was not listed as one of the 30 important topics in introductory statistics by McKenzie (2004). It was mentioned just once in the five replies to Gal (2002). It was mentioned three times in the major compendium by Ben-Zvi and Garfield (2005). It was mentioned four times in the two reports for the 2005 GAISE guidelines. Why not? Here are four plausible explanations: 1. Gal provided one explanation. In discussing the statistical knowledge entailed in Statistical Lit-
eracy, Gal noted that "no comparative analysis has so far systematically mapped the types and relative prevalence of statistical and probabilistic concepts and topics across the full range of statistically related messages or situations that adults may encounter and have to manage in any particular society. Hence, no consensus exists on a basis for determining the statistical demands of common media-based messages." He then proposed "five key parts of the statistical knowledge base". None of these involved confounding.
2947

Let's accept Gal's claim that no analysis has mapped the relative prevalence of statistical con-cepts. It doesn't follow that confounding should be excluded from any proposed knowledge base. Every teacher of statistics has said 'association is not causation' and then probably used an example involving confounding. To exclude confounding when almost confounding is used by all teachers in the introductory course seems to require a suspension of one's knowledge.
2. A most-cynical explanation is that statistical education is dysfunctional. As a discipline, there
are certain subjects that are off-limits and remain unspoken. Confounding is too close to cau-sation in an observational study. If observational causation is off-limits, then so is confounding.
3. A less-cynical explanation is that there isn't much to say about a potential confounder. There
is no test. There is no mathematical calculation. We may calculate the interaction between measured variables, but we can only speak loosely about a variable that is unmeasured.
4. Another explanation is that confounding is often viewed as an instance of sampling bias. As
such, it just another form of bias that needs to be avoided by a proper study design. Confound-ing doesn't deserve any more attention than sampling bias. Yes, sampling bias can create con-founding, but not all confounding is due to sampling bias. Confounding can exist in a popula-tion. Confounding is not a subset of sampling bias. Confounding needs its own category outside bias.
4.2 What explains the sudden increase? Part 1 Confounding was strongly featured by Tintle et al (2013) and the 2016 GAISE update. Going from rarely mentioning confounding (GAISE 2005) to saying that confounding is central to all statistical investigations (Tintle et al., 2013) in less than 10 years is a truly massive change for statistical education. One explanation is that what statistical educators had been saying for years finally became manifest in the GAISE 2016 update. Let's look more closely at what they have been saying about statistical literacy and about an increasing emphasis on concepts: the non-algebraic aspects. 4.3 David Moore (1997, 1978) Moore may never have defined statistical literacy in his major papers, but he did so in his talks and slides. See Appendix A. This author heard David's talk in Iowa City in 1998. In the abstract for his talk, Moore (1998b) distinguished statistical literacy from statistical competence:
Educated people face a new environment at century's end: work is becoming intellectualized, formal higher education more common, technology almost universal, and information (as well as mis- and dis-information) a flood. In this setting, what is statistical literacy, what every edu-cated person should know? What is statistical competence, roughly the content of a first course for those who must deal with data in their work? One might define competence as what we hope a business statistics student will retain five years later."
In his slides (1997b, 1998), Moore presented "Statistical Literacy versus Statistical Competence" where he argued that statistical educators should "think broadly" with "big ideas" such as "Beware the lurking variable". In his slides he raised three pertinent questions: Is this a stat course? Is this utopian? Does statistics retain a core? (Is quantitative literacy our turf?) Unfortunately his distinc-tion between statistical literacy and statistical competence, the importance of the lurking variable as a big idea, and his three questions about statistical literacy never emerged in his major papers.
2948

4.4. Others Supporting a Confounder-Based Statistical Literacy Schield (Appendix I) has long argued the need to attend to confounding. Confounding is present in all but one of Schield's invited papers between 1999 and 2018. He averaged 32 references to con-found per invited paper. In one of them, variations of confound appeared over 100 times. In "Statistical Literacy, Numeracy and The Future" Holmes (2003) reviewed the materials being used to teach Statistical Literacy at Augsburg College and made some comments. Matches included statistical literacy (36), numeracy (23), confounding (11), statistical thinking (1), and statistical rea-soning (1). There were no references to critical or lurking variable. In "What educated citizens should know about statistics and probability", Jessica Utts (2003) iden-tified seven important topics. Here are the matches: confounding (5), statistical literacy (4), criti-cally (1) and statistical inference (1). There were no matches for lurking variable, statistically lit-erate, statistical thinking or statistical reasoning. Even though the paper had five references to con-founding, none of them were contained in the summary list of the seven topics. They were detail items in the body of the paper. Indeed the first topic seemed to presume that one could not identify a relationship as one of case and effect in an observational study. Confounding and lurking variable are mentioned prominently in the seventh edition of Statistics: Concepts and Controversies, by Moore and Notz (2008). Moore noted that he had limited involve-ment in this book after the third edition. Lurking variable (71), confound (41 including 26 con-founding, 13 confounded and two confound), comparison (30), statistical thinking (3). There was no mention of statistical literacy, statistical reasoning, covariation or confounder. The Statistical Literacy: Seeing the Story behind the Story by Milo Schield (2008) had 344 matches for confound (255 for confounder, 69 for confounding), 89 matches for statistical literacy, and 28 for Simpson's paradox. The index had just six page references to confound (two to Simpson's par-adox). This shows the vast difference between index entries and actual content matches. 4.5 Index Entries These tabulations from hard-copy textbooks are taken from Schield (2018b). The number of page references isn't nearly as indicative as the number of matches in the textbook. But without a search-able pdf, getting the number of matches is practically impossible. Schield (2018b) provided the following: The index of the third edition (1998) of Statistics by Freed-man, Pisani and Purves had 21 page references to confounding. The index of the third edition (2004) of Seeing Thought Statistics by Jessica Utts had 51 page references to confound (14 to Simpson's paradox). The fourth edition (2014) had 60 page references to confound (15 to Simpson's paradox). What Explains the Increase? Part 2 Despite these ongoing calls for change, none of these efforts seem to have had any effect by 2012. Going from never mentioning confounding to saying that confounding is central to statistical inves-tigations in less than 10 years is a truly massive change for statistical education. It takes a change to explain a change. There have been changes in pedagogy: flipped classrooms, from sage on the stage to guide on the side, from fixed transparencies to dynamic PowerPoint slides to classroom videos. But none of these involved a change in content. Computers have changed how statistics is taught. Randomi-zation has provided alternative ways of generating statistical inferences. But neither has involved the kind of change involved in accepting confounding as central to statistics.
2949

So what explains this change? The fact that confounding was almost universally ignored indicates the presence of a very large influence. The fact that the change occurred so quickly means it is most explained by the sudden arrival of a new very-large influence. This paper makes two claims.
1. Our ongoing blindness to confounding and observational causation is due to the stance taken by our statistical founder (Karl Pearson) and due to our steadfast – if not stubborn – allegiance to mathematics. Schield (2013) and Northcutt (2005)
2. Our awakening to multivariate data, confounding and observational causation is due to the dramatic rise of big data: observational data where almost every association is statistically significant but where confounding remains a perennial problem. Schield (2014)
Big data was arguably the tsunami that broke the dam of confounder resistance. Big data required attention to multivariate data. Multivariate data is a necessary condition for dealing with confound-ing. There is no way to discuss confounding with just two variables. Having viewed the confounder-absent years and the confounder-present years, we now turn to the subsequent confounding-absent years.
4 Confounding-Absent Years (2017 – Present) Despite the sudden increase in the emphasis on confounding, confounding is not firmly ensconced. 5.1 SERJ Special issue on Statistical Literacy (2017) In 2017, the Statistical Education Research Journal published a special issue on statistical literacy. Borovcnik (2017). Of the 15 papers focused on that topic, only three included the word confound. In two, it appeared just twice. In the third (Schield), it appeared 28 times. See Appendix J. The fact that 12 of the 15 invited papers on statistical literacy did not mention confounding is strong evidence that confounding has not been accepted as an integral component of statistical literacy. Indeed, statistical educators may be actively resisting the inclusion of confounding. 5.2 Sharma (2018) and U. Minnesota (2019) Sharma (2018) reviewed statistical literacy with just one mention of confounding. Appendix K. In 2019, researchers from the Univ. of Minnesota asked statistical educators to participate in a sur-vey on what they taught in introductory statistics. When questioned about their omission of any question involving confounding, they replied that this topic had never come up in their planning. See Appendix K.
6 Why did it stop? Why did the emphasis on confounding stop? One explanation is that the two documents cited as embracing confounding did so in very specific ways. Neither did so in the context of defining statistical literacy. In the GAISE 2016 update the references to confounding was somewhat inci-dental to multivariable thinking. In the Tintle et al paper, confounding was limited to just the post-introductory course. One can embrace multivariate data (big data) without embracing confounding. Confounding is
not a problem in predicting. Adding another variable may reverse the signs of the preceding predictors, but so long as it improves the accuracy of the prediction, who cares. Confounding is a problem in explaining, in searching for causation. But using associations as evidence for causation is central to science and life. It may take a future update to the GAISE guidelines to firmly set confounding as an essential topic of statistical education.
2950

Even though Tintle et al., noted the centrality of confounding, they situated that claim in the context of the post-introductory course. Perhaps they felt that confounding could not be properly addressed until one had a full course on statistical inference. In any case, they never asserted that confounding should be part of the introductory course.
7 Hope for the Future (2019)
There may be hope! In Rossman's 2019 interview with Jeff Witmer, Witmer emphasized the grow-ing importance of causation in observational data and of understanding Simpson's paradox. Matches included caus (25 after omitting 12 because) observational (7), confound (5) and lurking variable (1). There were none for statistical literacy, statistical reasoning, statistical thinking or critical. Witmer is the new editor of the Journal of Statistics Education (JSE). As such, he is in a position to encourage a greater focus on confounding than has been the case in the past.
8 What Will It Take? What will it take for statistical educators to accept the centrality of confounding in teaching statis-tical literacy? First, there must be some agreement on the necessary conditions for a course to be designated as a statistical literacy course. This paper argues the following:
To be designated as a statistical literacy course it should satisfy these conditions. It is driven by the statistical needs of consumers. It recognizes that (1) the statistics most commonly seen by consumers are social statistics, (2) these statistics are typically based on observational stud-ies, (3) these statistics are easily influenced by a variety of factors, and (4) consumers use these statistics as evidence for causation and decision making despite their limitations.
Secondly, there must be some way to identify how extensive confounding is in a statistical literacy course. Here is one way:
A statistical literacy course would be designated as "confounder-based" only if it has at least as much content on confounding as on statistical inference.
Any statistical literacy course that is silent or minimalistic on confounding cannot be viewed as a "confounder-based" statistical literacy course. Perhaps, someday all statistical literacy courses will be confounder-based and a new distinction will be needed.
9 Conclusion It seems that the recent advances highlighting the importance of confounding by Tintle et al (2012), in the 2016 update to the GAISE guidelines, and in Schield's many papers have been for naught. But, the more abstract the discipline, the further it is conceptually from reality, the longer it takes to bring about change. A much longer time may be needed before confounding is accepted as an important – if not essential – component of statistical literacy. If leaders in statistical education are reluctant to endorse confounding as essential to statistical lit-eracy, how else could this change come about? One way would be the development of a working model: a confounder-based statistical literacy course offered by a major university; a statistical lit-eracy course that is valued by students and that is teachable and valued by the faculty. Having such a working model might help statistical educators overcome their steadfast – if not stubborn – alle-giance to mathematics and Pearson and thereby fully accept that statistics are numbers in context.
10 Acknowledgment Thanks to Professor Marc Isaacson for his comments and recommendations.
2951

11 REFERENCES Ben-Zvi, Dani and Joan Garfield (2004) editors. The Challenge of Developing Statistical Literacy,
Reasoning and Thinking. Borovcnik, Manfred (2017). Special Issue: Statistical Literacy. Statistical Education Research
Journal Vol 16 Num 1, May 2017. https://iase-web.org/Publications.php?p=SERJ_issues GAISE (2005). Guidelines for Assessment and Instruction in Statistics Education (GAISE) Reports.
College report. Copy at www.amstat.org/asa/files/pdfs/GAISE/2005GaiseCollege_Full.pdf Pre-K-12 report: www.amstat.org/asa/files/pdfs/GAISE/GAISEPreK-12_Full.pdf
GAISE (2016). Guidelines for Assessment and Instruction in Statistics Education (GAISE) Reports. www.amstat.org/asa/files/pdfs/GAISE/GaiseCollege_Full.pdf
Gal, Iddo (2002). Adults’ statistical literacy: Meaning, components, responsibilities. International Statistical Review, 70(1), 1-25. https://iase-web.org/Publications.php?p=Int_Stat_Review
Hawkins, Anne (1997). The First R – for Reasoning! 1997 Annual Mathematics Teachers' Confer-ence. Northern Ireland. www.statlit.org/pdf/1997HawkinsRSSCSE.pdf
Hawkins, Anne (1998). Response to Moore's essay: New Pedagogy and New Content Copy at www.StatLit.org/pdf/1997-Hawkins-ISI.pdf
Holmes, Peter (2003). Statistical Literacy, Numeracy and the Future. Augsburg College. Copy at http://www.statlit.org/pdf/2003HolmesAugsburg.pdf
McKenzie, John (2004). Conveying the Core Concepts. ASA Proceedings of the Section on Statis-tical Education, P 2755-2757. Copy at www.statlit.org/pdf/2004McKenzieASA.pdf
Moore, David (1997). New pedagogy and new content: The case of statistics (with Discussion) International Statistical Review, 65(2), 123-165. Copy with discussion at https://iase-web.org/documents/intstatreview/97.Moore.pdf?1402524917
Moore, David (1997b). Statistical Literacy and Statistical Competence in the 21st Century. Slides. Copy at http://www.statlit.org/pdf/1997MooreASAslides.pdf
Moore, David (1998). Statistics among the Liberal Arts. Journal of the American Statistical Asso-ciation. 1998, V93, N444, p. 1253-1259. www.stat.purdue.edu/~dsmoore/articles/LibArts.pdf
Moore, David (1998b). Statistical Literacy and Statistical Competence in the 21st Century. Abstract. MSMESB, Iowa City Iowa. Copy at http://www.statlit.org/pdf/1997MooreASAslides.pdf
Moore, David (2001). Statistical Literacy and Statistical Competence in the 21st Century. Slides. IASE, Korea. Copy at http://iase-web.org/documents/papers/sat2001/Moore.pdf
Moore, David and William Notz (2008). Statistics: Concepts and Controversies. PDF at http://doc-share01.docshare.tips/files/24753/247538667.pdf
Northcutt, Robert (2005). Pearson’s Wrong Turning: Against Statistical Measures of Causal Effi-cacy. Philosophy of Science, 72 (December 2005) pp. 900–912. 0031-8248/2005/7205-0021. Copy at http://philsci-archive.pitt.edu/15411/1/PhilSci%202005.pdf
Rossman, Alan (2019). Interview with Jeff Witmer. Journal of Statistical Education, Vol 27, No. 1. P 48-57. https://www.tandfonline.com/doi/full/10.1080/10691898.2019.1603506
Schield, Milo (1999). Simpsons Paradox and Cornfield's Conditions. ASA Proceedings of the Sec-tion on Statistical Education. www.statlit.org/pdf/1999SchieldASA.pdf
Schield, Milo (2008). Statistical Literacy: Seeing the Story behind the Story. Instant Publisher. Schield, Milo (2013). Statistical Education: Steadfast or Stubborn. ASA Proceedings of the Section
on Statistical Education. www.statlit.org/pdf/2013-Schield-ASA.pdf Schield, Milo (2014). Two Big Ideas for Teaching Big Data: Coincidence and Confounding.
ECOTS 14. Copy at www.statlit.org/pdf/2014-Schield-ECOTS.pdf Schield, Milo (2018). Confounding and Cornfield: Back to the Future. Invited paper for the Inter-
national Conference on Teaching Statistics. www.statlit.org/pdf/2018-Schield-ICOTS.pdf Schield, Milo (2018b). Confounding and Cornfield: Back to the Future. Appendix Copy at:
www.statlit.org/pdf/2018-Schield-ICOTS2.pdf Sharma, Sashi (2017). Definitions and models of statistical literacy: literature review. Open Review
of Educational Research. www.tandfonline.com/doi/full/10.1080/23265507.2017.1354313 Tintle, Chance, Cobb, Rossman, Roy, Swanson and VanderStoep (2013). Challeng the State of the
Art in Post-Introductory Statistics: Preparation, Concepts, and Pedagogy. ISI Hong Kong (2013). www.statistics.gov.hk/wsc/IPS032-P1-S.pdf
Utts, Jessica (2003). What Educated Citizens Should Know about Statistics and Probability. The American Statistician, May 2003, Vol. 57, No. 2. www.ics.uci.edu/~jutts/AmerStat2003.pdf
2952

STATISTICAL LITERACY APPENDICES
A: David Moore (1997, 1998)
B: Anne Hawkins on Statistical Literacy for All (1997)
C: Adults' Statistical Literacy: Meanings, Components, Responsibilities. By Iddo Gal (2002)
D: Responses to Adults' Statistical Literacy. By Watson et al.
E: The Challenge of Developing Statistical Literacy, Reasoning and Thinking (2005). Edited by Ben Zvi and Garfield
F: GAISE Guidelines (2005)
G: Challenging the State of the Art in Post-Introductory Statistics. By Tintle et al. (2013)
H: Guidelines for Assessment and Instruction in Statistics Education (GAISE) College Report. American Statistical Association (2016)
I: Schield Invited Papers on Statistical Literacy (1999 -2018)
J: Others Supporting a Confounder-Based Statistical Literacy
K: Statistical Literacy: Special Issue of the Statistical Education Research Journal. (2017)
L: Sharma (2017), Univ. Minnesota (2019) and Witmer (2019)
2953
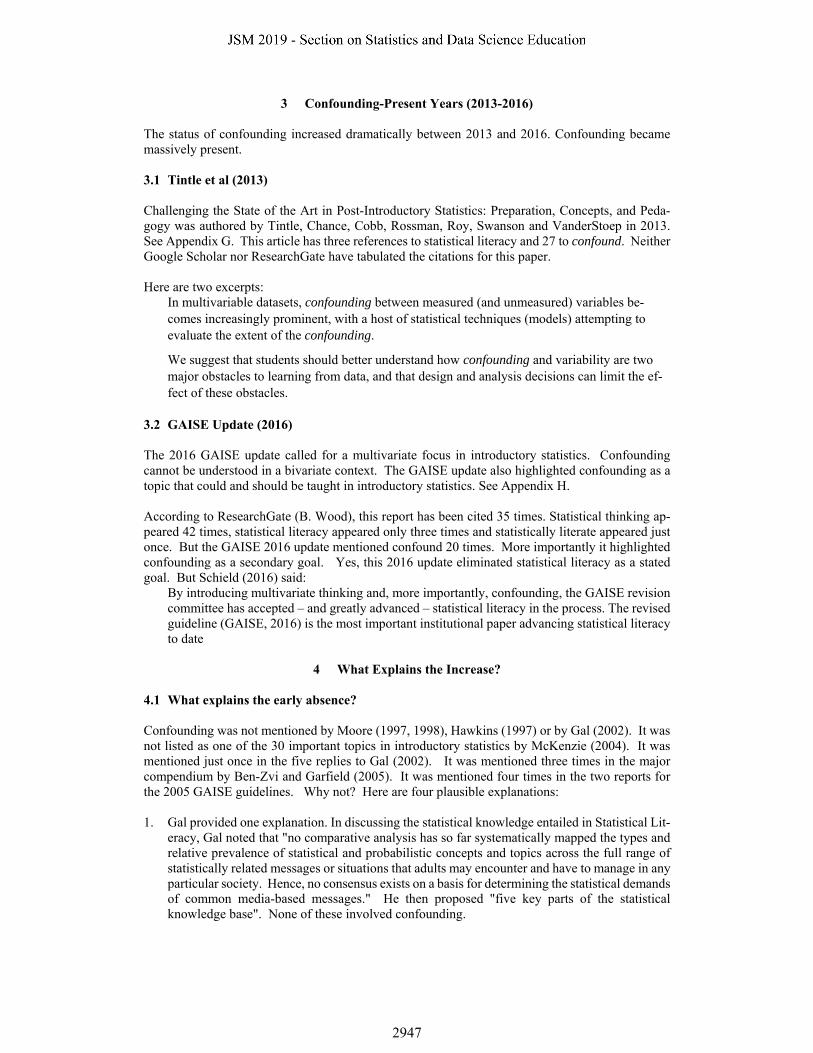
Appendix A: David Moore (1997, 1998 and 2001)
David Moore gave many talks and papers on the need to update statistical education. This author is unaware of any paper in which he defined the phrase statistical literacy. But the author heard David Moore's talk in Iowa City in 1998 where Moore (1998b) distinguished statistical literacy from statistical competence. Here is the abstract for that talk:
Educated people face a new environment at century's end: work is becoming intellectualized, formal higher education more common, technology almost universal, and information (as well as mis- and dis-information) a flood. In this setting, what is statistical literacy, what every educated person should know? What is statistical competence, roughly the content of a first course for those who must deal with data in their work? One might define competence as what we hope a business statistics student will retain five years later."
In his slides (1997b1 and 20012), Moore presented "The New Statistical Literacy".
Think Broadly: Strategies and big ideas (details automated); Communication and problem solv-ing; Filters for nonsense
Big Ideas: Some Examples: Data beat anecdotes; Is this the right question? Beware the lurking variable; Association is not causation; Observation versus experiment; The importance of study design; and Conclusions are uncertain.
Moore then raised three questions? Is this a stat course? Is this utopian? (No one ever went broke by underestimating the motivation of The American Freshman) Does statistics retain a core? (Is quantitative literacy our turf?) Moore did not include his distinction between statistical literacy and statistical or the role of con-founding in statistical literacy in two of his major papers. New Pedagogy and New Content: The Case of Statistics.3 ISR 65, (1997), 123-165. Matches
include statistical thinking (1). There were no matches for confound, lurking variable, statistical literacy, statistical reasoning or critical thinking. According to ResearchGate, this article has 436 citations.
Statistics Among the Liberal Arts. ASA JASA (1998).4 Matches include reasoning (21), statis-tical thinking (13), statistical reasoning (6), literacy (3) and statistical literacy (1). There were no references to confound, lurking variable, critical thinking, thinking critically or covariation. Moore highlighted the recommendations for any first course in statistics: "emphasize statistical concepts, e.g., causation vs. association, experimental vs. observational and longitudinal vs. cross-sectional studies" Moore noted that "the first course in statistics is not primarily intended to develop statisticians" and "even the most basic aspects of "statistical literacy" require the regularity of a civilized environment." Note that Moore took many of his "Big Ideas" from his slides, but omitted the reference to "Beware the lurking variable." "A student who emerges from a first statistics course without an appreciation of the distinction between observation and experiment and of the importance of randomized comparative experiments, for example, has been cheated." He concluded by saying, "Statistics as a liberal art is in the longer run the most useful and most practical form our discipline takes." Neither Google Scholar nor ResearchGate tabulated citations for this article.
However, confounding is mentioned prominently in 7th edition of Statistics: Concepts and Contro-versies 7th ed. shown as being authored by Moore and Notz.5 [Moore notes that he had limited involvement in this book after the third edition]. Lurking variable (71), confound (41 including 26 confounding, 13 confounded and two confound), comparison (30), statistical thinking (3). No men-tion of statistical literacy, statistical reasoning, covariation or confounder.
1 Slides only at www.statlit.org/pdf/1997MooreASAslides.pdf 2 Slides only: http://iase-web.org/documents/papers/sat2001/Moore.pdf 3 https://iase-web.org/documents/intstatreview/97.Moore.pdf 4 PDF at http://www.stat.purdue.edu/~dsmoore/articles/LibArts.pdf 5 PDF at http://docshare01.docshare.tips/files/24753/247538667.pdf
2954

Appendix B: Anne Hawkins (1997)
In 1997, Anne Hawkins, the Director of the RSS Centre for Statistical Education wrote this paper: The First R – For Reasoning.6 It contained 11 references to statistical literacy, one to statistically literate, and one to critical, but no references to confound or lurking variable.
"Statistics for All" policies tend to emphasise knowledge of techniques, while what we really need to develop are the skills, understanding and inclination to use such techniques, i.e. "Sta-tistical Literacy for All". My two criteria for assessing whether statistical education has suc-ceeded would be that its recipient was able to function effectively in a world of uncertainty, and had the skills to summarise and represent information (be it qualitative or quantitative) for him/herself and others.
Reading, writing and arithmetic are of little or no use if they are not underpinned with reasoning. This first R -- for reasoning -- is what makes statistics more than just meaningless 'rithmetic, but the "back to basics" approach tends to highlight, and reward, just those activities that are outside the realms of reason! Once we add in reasoning, though, we have the beginnings of statistical literacy, an obvious application of the three, or rather four, R's. Conversely, in teach-ing and developing statistical literacy, we contribute much to the proper development of the individual activities of reading, 'riting and 'rithmetic -- the literacy and numeracy that Society demands. Statistical literacy certainly requires a synergy of all the 4 R's, but these must be manifest in a rather broader range of activities….
it is time for us to stop hitting our heads against a brick wall, and to engage in more radical rethinking about our approach to statistical education.
The really big research question that faces us, though, is how to produce statistically literate citizens.
In 1997, Anne Hawkins, President of the IASE, gave her response to David Moore's New Pedagogy and New Content.7 Her response had 16 references to statistical literacy and three to statistically literate, but none to confound or lurking variable.
I remain somewhat sceptical that we should be satisfied with Statistics for All policies. Our true objective should rather be Statistical Literacy for All.
[We] should take account of the extent to which we are aiming to produce specialists or non-specialists.
Statistics for All, in the absence of literacy, is worthless. If we cannot guarantee that the dosage of 'plus' administered to make 'statistical experts' will also make them statistically literate, what price their expertise? Statistical Literacy for All must be the bread on which some may spread butter, jam, or even caviar. Without the bread, however, there is nothing to support these op-tional toppings.
In its simplest terms, statistical literacy can be interpreted as meaning an ability to interact ef-fectively in an uncertain (non-deterministic) environment. A statistically literate person must understand the strategies for data collection and analysis, as well as the nature of chance pro-cesses and their relevance to data collection, and the assumptions that underlie statistical rea-soning.
The 'numeracy' with which mathematics educators concern themselves rarely includes thoughts of statistics and probability. It seems that statistical literacy falls between a number of stools, and does not receive the widespread consideration that it should.
a move towards statistical literacy for all should be accompanied by a move towards making statistical language intelligible to all.
6 www.statlit.org/pdf/1997HawkinsRSSCSE.pdf 7 www.StatLit.org/pdf/1997-Hawkins-ISI.pdf
2955
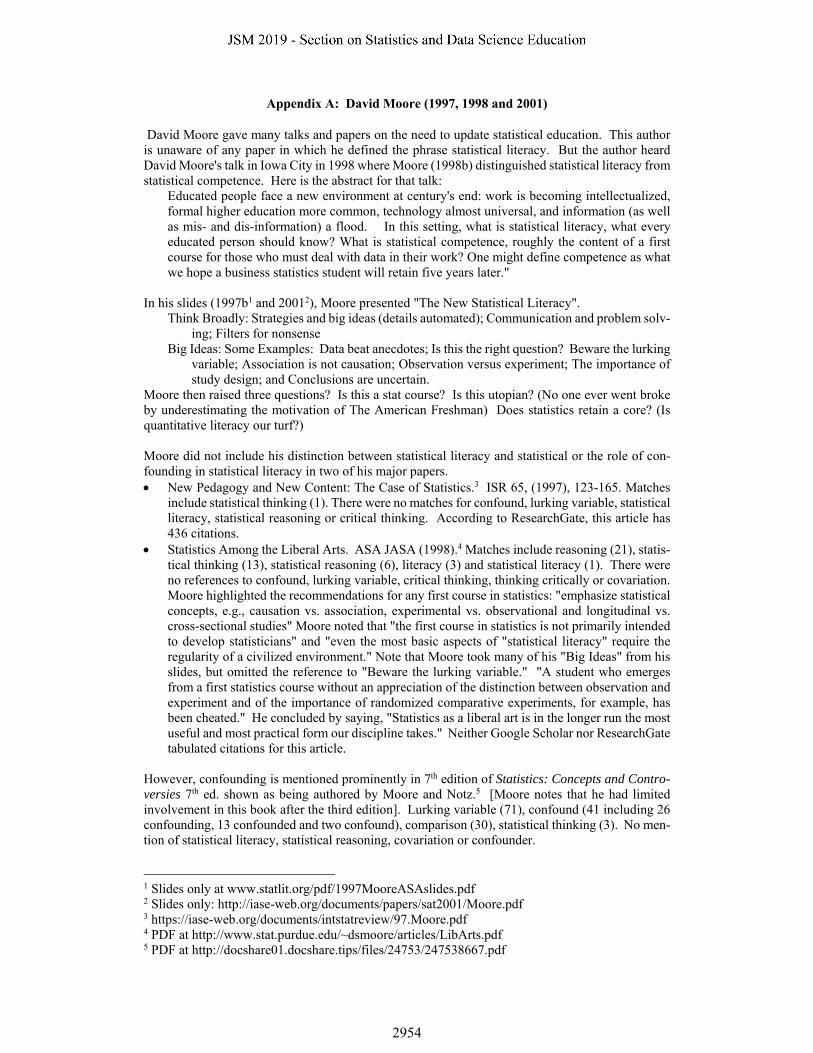
Appendix C: Iddo Gal (2002)
Adults' Statistical Literacy: Meanings, Components, Responsibilities by Iddo Gal (2002).8 According to ResearchGate it has 1,189 citations. Here are the matches for various words and phrases: statistical literacy (98), percent (44: percentage 35 and percentages 24), critical (44: critical stance 13, critically evaluate 7, critical evaluation 4, critical perspective 1, and think critically 1), inference (19), association (9 excluding Association), random (8), consumer (8), cause (4), variation (6), margin of error (6), alternative interpretations (4), statistical inference (3), statistical thinking (3), statistical reasoning (2), confidence interval (2), correlation (1), causation (1), critical thinking (0), statistical significance (0), confounding (0), lurking (0). Here are some relevant excerpts:
Statistical literacy: one critical but often neglected skill area that needs to be addressed if adults (or future adults) are to become more informed citizens and employees." the term statistical literacy refers broadly to two interrelated components, primarily (a) people’s ability to interpret and critically evaluate statistical information, data-related arguments, or sto-chastic phenomena, which they may encounter in diverse contexts, and when relevant (b) their ability to discuss or communicate their reactions to such statistical information, such as their understanding of the meaning of the information, their opinions about the implications of this information, or their concerns regarding the acceptability of given conclusions. The many examples of contexts where statistical literacy may be activated indicate that most adults are consumers (rather than producers) of statistical information. Yet, despite the central-ity of statistical literacy in various life contexts, the nature of the skills and dispositions that comprise adults’ statistical literacy have not received detailed discussion in the literature (Gal, 1994; Watson, 1997), and are thus the focus of this paper. Clarity on the characteristics of the building blocks of statistical literacy is needed before other questions can be addressed in ear-nest regarding assessment and instruction focused on statistical literacy. Statistical literacy involves both a knowledge component (comprised of five cognitive ele-ments: literacy skills, statistical knowledge, mathematical knowledge, context knowledge, and critical questions) and a dispositional component (comprised of two elements: critical stance, and beliefs and attitudes). Knowledge Component: 2 Statistical Knowledge: no comparative analysis has so far systematically mapped the types and relative prevalence of statistical and probabilistic concepts and topics across the full range of statistically related messages or situations that adults may encounter and have to manage in any particular society. Hence, no consensus exists on a basis for determining the statistical demands of common media-based messages. Five key parts of the statistical knowledge base required for statistical literacy are proposed....
1. Knowing why data are needed and how data can be produced 2. Familiarity with basic terms and ideas related to descriptive statistics 3. Familiarity with basic terms and ideas related to graphical and tabular displays 4. Understanding basic notions of probability 5. Knowing how statistical conclusions or inferences are reached
This paper argued that a view of statistical literacy as an action-oriented set of interrelated knowledge bases and skills, one which people will actually use in everyday contexts, must consider people’s inclination to apply a critical stance and the motivations, beliefs, and attitudes that affect or support statistically literate behavior.
8 International Statistical Review. Pdf at http://iase-web.org/documents/intstatreview/02.Gal.pdf
2956

Appendix D: Discussion and Response of Gal (2002) paper
Discussants and their papers included:
Watson, Jane. Discussion: Statistical Literacy before Adulthood
Rumsey, D. J. Discussion: Statistical Literacy: Implications for Teaching, Research and Practice.
Ahlgren, Andrew. Discussion
Weldon, K.L. Discussion
Snell, J. Laurie. Discussion: But How Do You Teach It?
Gal, Iddo. Response: Developing Statistical Literacy: Towards Implementing Change
Here are the number of matches for various words and phrases: statistical literacy (137 plus 21 Statistical Literacy), critical thinking (7), inference (7 including one statistical inference), statisti-cal reasoning (6), statistical thinking (5), margin of error (1), confidence interval (1), lurking varia-ble (1), statistical significance (0) and confound (0).
Here are some relevant excerpts from each of the discussants and the respondent:
Watson:
it may be attractive to find a place for statistical literacy within the domain of quantitative lit-eracy. Quantitative literacy as envisaged by Steen (1997) in the subtitle of his book Why Num-bers Count: Quantitative Literacy for Tomorrow's America, is a complex concept, sometimes equated with numeracy.
one thing is certain in the school curriculum: statistical literacy should not be considered the respon-sibility of mathematics teachers to the exclusion of teachers in other curriculum areas. Getting people to understand and accept this statement is perhaps the most difficult task for statistics educators. linking statistical literacy with current events covered in the news media is an effective way of motivating interest in the issue. One of the methods for convincing other educators of the value of statistical literacy is to demonstrate explicitly the hierarchy of skills that make it useful.
it is important to appreciate the distinction between statistical education research that focuses on students' basic understanding of the foundational ideas in chance and data, and research which goes further to study the critical thinking that allows these ideas to be applied in con-texts associated with other areas of the curriculum and/or areas outside of the school experi-ence in wider society.
Ottaviani:
Gal's paper focuses attention on numbers, tables, graphs, data collection methods and the drawing of statistical conclusions or inference. However, statistics, particularly official statis-tics, does not only involve techniques and/or numbers, it involves problems of definition.
People are not always aware that some words are only a label hiding a definition. Further-more, adults need critical skills when processing statistical information,
2957

Rumsey:
Statistical literacy is an extremely important topic to address for a variety of masons. First, from an educational standpoint, statistical literacy is (or at least most agree should be) the foundation of the first statistics course, which is experienced by more students than any other statistics course offered (Moore, 1998). Yet, statistical literacy is probably the most nebulous and abstract of all statistical topics. It typically does not even appear as a standard topic on our introductory statistics syllabus, resulting in an inconsistent treatment of md level of atten-tion paid to statistical literacy in the introductory course (not to mention other statistics courses).
Secondly, statistical literacy has become a requirement to function in today's age of infor-mation, both for everyday life and for effective participation in the workforce. Yet, there is no "Statistical Literacy for Dummies" textbook for the public to purchase to be brought up to speed on the statistical necessities and nuances needed to consume and critically digest the wealth of information being produced in today's society. However even if there did exist such a book, it is doubtful that the public would recognize the need to read it, presenting a more fundamental educational challenge: motivating awareness and desire on behalf of the individ-ual to become statistically literate.
Third, there is a critical need to increase public awareness regarding the quality of much of the information they are being asked to consume.
Gal separates the public into two groups: data producers (who engage in the production and analysis of data); and data consumers (who participate in reading, listening, or viewing statis-tical results and interpretations given to them from various sources, including the media). I would argue that there is yet another group deserving of their own place within the chain of statistical information: data communicators.
One might suspect that statistical literacy, more than any of the topics that actually are listed on the introductory statistics syllabus, is the single most important, and perhaps most well re-tained topic. It should be a staple item on the syllabus, indeed the mindset, of the introductory course and beyond.
Batanero:
It is clear, however, that we have not yet reached a general consensus about what are the basic building blocks that constitute statistics literacy or about how we can help citizens construct and acquire these abilities.
While his [Gal's] model can be useful at a macro-level of analysis for understanding what is meant by statistical literacy, and to help curricula designers to take decisions about the "big'' content areas that should be taught at different educational levels, I will argue that a system-atic programme to develop adults' statistics literacy also needs more specific micro-level mod-els that can be used to analyse statistics/mathematics concepts and to guide a systematic re-search programme in statistics education.
It is clear, from Gal's paper that much research is needed in the field of statistical literacy. As suggested by the author, there are no systematic studies of the types and frequency of statisti-cal concepts that an adult might encounter in the media and professional life.
Ahlgren:
this reviewer regrets the absence of specific reference to Science for All Americans (AAAS, 1990) in which adult literacy – in science, mathematics, and technology – is depicted and the subsequent Benchmark for Science Literacy (AAAS. 1993) that proposes plausible steps for progression of understanding toward those adult goals. Missing from Gal's paper is attention to coherence in an instructional program, to where ideas come from, where they support one another, and where they lead.
2958

Atlas includes the conceptual strand maps "Statistical Reasoning", "Averages and Compari-son", and "Correlation". In these maps explicit relationships are indicated to other Atlas maps: 'Evidence and Reasoning in Inquiry", "Mathematical Models", "Graphic Representa-tion", "Ratios and Proportionality", and "Describing Change".
The value of Atlas for statistical literacy is obviously not that its recommendations are unique, but that the sequences and connections specified can be used scaffolding to build curriculum, instruction, and assessment to promote adult literacy.
Weldon:
In this paper (Weldon, 1986), I argue that the treatment of statistics as a sub-discipline of mathematics has led to the generally dismal view of statistics, and 1 describe several exam-ples of concepts that are important pillars of statistics that have little to do with mathematics. Some examples are the difference between causation and association, the potential deception of lurking variables illustrated by Simpson's paradox, and the logical links between the pur-pose of an analysis and the use of prior information.
[I] suggest that calculation skill will often divert attention from the importance of intuitive un-derstanding.
Snell:
But how do you teach it?
It is natural to ask what kind of a course would best achieve these goals? We had Gal's goals in mind when we developed a course called "Chance" at Dartmouth College.
Gal:
Adults' Statistical Literacy suggested that, in thinking about educating future adults, educators have to distinguish between teaching more statistics (or teaching it better), and teaching statis-tics for a different or additional purpose, i.e., statistical literacy.
those interested in promoting statistical literacy of all citizens can pose three related but sepa-rate questions to help focus efforts:
1. How can we improve statistics instruction within formal education systems (i.e., schools, colleges) so that students already studying statistics also reach adequate levels of statistical literacy?
2. How can we expand statistics education within formal educational systems (schools, colleges) so as to reach and develop the statistical literacy of all students enrolled, in-cluding the many who do not receive any instruction related to statistics or statistical literacy?
3. How can we reach, and educate or enrich, the general adult population in order to de-velop the statistical literacy of all citizens?
2959

Appendix E: Ben-Zvi and Garfield (2004)
The Challenge of Developing Statistical Literacy, Reasoning and Thinking (2004) Chapter 3 on Statistical Literacy by Iddo Gal is a reprint of his 2003 article (Appendix A). According to ResearchGate, this book has 350 citations. The 13 chapters involve 175,000 words excluding the table of contents and index. This book is available as a pdf.9 The following are the number of matches in the body for various words and phrases:
Reasoning (998 including 327 statistical reasoning), thinking (486 including 208 statistical thinking), literacy (319 including 185 statistical literacy), covariation (168), comparison (124), association (119 including 65 Association), causation (22), correlation (16), consumer (11), common cause (8), alternative explanations (5), confound (2) and lurking variable (1). There was no match for confounder.
The following are the number of pages referenced in the index for various words and phrases:
Causation (11), correlation (10), covariation (9) and lurking variable (3). There was no index entry for confounder, confounding or association.
Although three instances of lurking variable are shown in the index, only one of these had a match in the document. See the following excerpt with emphasis added. Ch 10: Reasoning about Covariation by Jonathan Moritz.
the complexity of the data cases, the number of variables given, the topic of variables, and possible lurking variables can affect judgments of covariation. P. 235
The two indexed instances of confound are shown in the following excerpts with emphasis added. Ch 2: Towards an Understanding of Statistical Thinking by Maxine Pfannkuch and Chris Wild
Fisher also played a pivotal role in the actual use of randomization in controlled agricultural experiments (Fienberg and Tanur, 1996). Randomization was described by Fisher as a method that was necessary for the validity of any test of significance, since it “affords the means, in respect of any particular body of data, of examining the wider hypothesis in which no normality of distribution is implied” (1935; cited in Box, 1978, p. 151). Without randomization, confound-ing factors would give biased estimates. Fisher’s work contributed to the recognition that un-certainty could be captured by quantifiable measures that led to a deeper appreciation and un-derstanding of its nature (Box, 1997). Porter (1986) also observed that Fisher’s integration of statistics with experimental design essentially changed the character of statistics by moving it beyond observing patterns in data to demonstrating the existence of causal relationships.
Ch 9: Reasoning about Variation by Chris Reading and J. Michael Shaughnessy
Another reason may be that statisticians have traditionally been very enamored with standard deviation as the measure of spread or variability; teachers and curriculum developers may tend to avoid dealing with spread because they feel they would have to introduce standard deviation, which is computationally complex and perhaps difficult to motivate in school mathematics. Still another reason may be that centers, or averages, are often used for prediction; and comparison and the incorporation of spreads, or variation, into the process only confounds the issue. People are comfortable predicting from centers—it feels like firm ground compared to variability is-sues. Finally, the whole concept of variability may just be outside of many people’s comfort zone, perhaps even outside their zone of belief.
9 www.academia.edu/5734290/The_challenge_of_developing_statistical_literacy_reasoning_and_thinking
2960

ANALYSIS: The omission of confound may be related to the three level classification provided by Garfield, delMas and Chance (2003):
Statistical literacy includes basic and important skills that may be used in understanding statistical information or research results. These skills include being able to organize data, construct and display tables, and work with different representations of data. Statistical literacy also includes an understanding of concepts, vocabulary, and symbols, and includes an understanding of probability as a measure of uncertainty.
Statistical reasoning may be defined as the way people reason with statistical ideas and make sense of statistical information. This involves making interpretations based on sets of data, representations of data, or statistical summaries of data. Statistical reasoning may involve connecting one concept to another (e.g., center and spread), or it may combine ideas about data and chance. Reasoning means understanding and being able to explain statistical processes and being able to fully interpret statistical results.
Statistical thinking involves an understanding of why and how statistical investigations are conducted and the “big ideas” that underlie statistical investigations. These ideas include the omnipresent nature of variation and when and how to use appropriate methods of data analysis such as numerical summaries and visual displays of data. Statistical thinking in-volves an understanding of the nature of sampling, how we make inferences from samples to populations, and why designed experiments are needed in order to establish causation. It includes an understanding of how models are used to simulate random phenomena, how data are produced to estimate probabilities, and how, when, and why existing inferential tools can be used to aid an investigative process. Statistical thinking also includes being able to understand and utilize the context of a problem in forming investigations and draw-ing conclusions, and recognizing and understanding the entire process (from question pos-ing to data collection to choosing analyses to testing assumptions, etc.). Finally, statistical thinkers are able to critique and evaluate results of a problem solved or a statistical study.
Here are three things related to this three-level classification:
1. This classification does not distinguish between producer and consumer. 2. Critical thinking about statistics (the big ideas that underlie statistical investigations) is
reserved for the highest level (statistical thinking) and is all but absent from the lowest level (statistical literacy.
3. Causation is limited: "designed experiments are needed in order to establish causation Given this hierarchy, it seems that this version of statistical literacy might be seen as material that might be useful in a high school or middle school curriculum, but not worthy of being taught for college credit. Given this view of statistical literacy, the omission of confounding is totally justified.
2961

Appendix F: GAISE Guidelines (2005)
In 2005, the ASA endorsed the Guidelines for Assessment and Instruction in Statistics Education (GAISE). This involved the 2005 College report and a K-12 report. According to ResearchGate (Beverly Wood), this report has been cited 35 times. The college report mentioned statistical thinking 14 times, statistical literacy eight times and statis-tical reasoning once. Confounding was mentioned twice. Critical thinking, thinking critically and lurking variable never appeared. Confounding did not appear in the main report. It appeared in Appendix B: Examples of Assessment Items. Here are the two references to confounding.
Item 10: You will want to select some of the following words in your critique: observational study, experiment, blind, double-blind, precision, bias, sample, spurious, confounding, causation, association, random, valid, reliable.
Item 31: List a potential confounding variable in this work. The K-12 report mentioned statistical literacy eight times, statistical thinking seven times, and sta-tistical reasoning seven times, while confounding was mentioned twice. Critical thinking, thinking critically and lurking variable are not mentioned. Here are references to confounding:
Experiments: Suppose a researcher decides to assign treatment A only to patients over the age of 60 and treatment B only to patients under the age of 50. If the treatment responses differ, it is impossible to tell whether the difference is due to the treatments or the ages of the patients. (This kind of bias in experiments and other statistical studies is called confound-ing.) The randomization process, if properly done, will usually balance treatment groups so this type of bias is minimized.
Observational studies: Random sampling is the only way to be confident of a representative sample for statistical purposes. Similarly, feeding your cats Diet A and your neighbor’s cats Diet B is not going to allow you to claim that one diet is better than the other in terms of weight control, because there was no random assignment of experimental units (cats) to treatments (diets). As a consequence, confounding may result. Studies of the type sug-gested above are merely observational; they may suggest patterns and relationships, but they are not a reliable basis for statistical inference.
ANALYSIS: Examples of confounding in the College Report:
The first example suggests the importance of confounding by being one of 14 items to be considered in critiquing a study.
The second example of confounding in the College Report is prescient. Whoever wrote the assessment question for Item 31 in the College Report should be commended. This is a perfect example of hypothetical thinking – a most important skill for statistical literacy.
Examples of confounding in the Pre-K-12 report:
The first example suggests that confounding makes it impossible to say anything about causation without random assignment. This level of perfection may be required in the case of science, but it is definitely not a requirement for most decision makers.
The second example describes confounding as a result of failing to randomly assign. As such, it fails to mention that confounding arises naturally. It also treats observational stud-ies as being 'merely observational.' By that standard, the classic study of smoking and lung cancer was 'merely observational.
2962

Appendix G: Tintle et al (2013)
Tintle, Chance, Cobb, Rossman, Roy, Swanson & VanderStoep (2013). Challenging the State of the Art in Post-Introductory Statistics: Preparation, Concepts, and Pedagogy. ISI Hong Kong (2013). https://www.statistics.gov.hk/wsc/IPS032-P1-S.pdf
Neither Google Scholar nor ResearchGate have tabulated the citations for this paper. These are the three uses of statistical literacy and 26 uses of confound in the Tintle et al (2013) pa-per. These are shown in the following excerpts. Italics added. 1. We have developed a preliminary version of an integrated one to two semester curriculum
which introduces students to the core logic of statistical inference through randomization-methods, and then introduces students to approaches for protecting against confounding and variability through multivariable statistical design and analysis techniques. P. 1
2. we will (1) Lay out an alternative conceptual goal of a second course in Statistics—to enhance students’ understanding of confounding and variability through an approach which is not model-centered, but is instead, meaning centered, (2) Present an outline for a curriculum that places conceptual understanding of variability and confounding at the center, P. 2
4. … we suggest that the goal of a second course in statistics should not be the models for con-ducting multivariable statistical inference, but should instead be the concepts that underlie the motivation and utility of such models: namely, confounding and variability. P. 3
5. In multivariable datasets, confounding between measured (and unmeasured) variables be-comes increasingly prominent, with a host of statistical techniques (models) attempting to evaluate the extent of the confounding.
7. We suggest that students should better understand how confounding and variability are two major obstacles to learning from data, and that design and analysis decisions can limit the ef-fect of these obstacles. P. 3
8. Topic Heading: An outline for a curriculum that places conceptual understanding of con-founding and variability at the center P. 3
9. If the conceptual goal of a second course in statistics is confounding and variability, the moti-vation for multivariable models, how does this impact curriculum design decisions? P. 3
10. In our preliminary version of Unit #4: Confounding and Variation—Two substantial hin-drances to drawing conclusions from data, we have developed the following 7 Chapters. P. 4
12. Ch 12: Stepping back and identifying the two major themes of statistical analysis (confound-ing and variation)- a review chapter which keys on the ideas of confounding and variation …. P. 4
14. Ch 13: Blocked study designs to assess confounding and variability- a chapter which intro-duces blocking as an explicit way to address confounding (by limiting within group variabil-ity) for measurable confounding variables, instead of leaving their values "up to chance"; re-views paired designs for observational data as a corollary to experimental blocking. P. 4
17. Ch 14: Analysis of confounding variables (simulation, ANOVA, and regression)- a chapter exploring simulation and theory-based approaches to comparing multiple groups in block de-signs; considers ANOVA as an approach to attribute variation to different variables; intro-duces indicator variables/regression model as an equivalent alternative to ANOVA, that also allows for analytic control of confounding variables in observational data. P. 4
2963

19. Ch 15: Factorial designs to address variability and confounding- a chapter extending the idea of designing randomized experiments and observational studies to situations with multiple ex-planatory variables of interest
20. Ch 16: Analysis of factorial designs and observational studies with confounding variables … . P. 4
21. Successful completion of the course as indicated by performance on a final exam, multiple class data design and analysis projects and a newly developed assessment test suggest that the curriculum has potential for preparing students well for the ideas of confounding and varia-tion, …. P 4.
22. We argue that the concepts of confounding and variation are multivariable concepts that stu-dents should deepen their understanding of, and that models are a tool to provide that en-hanced understanding. P. 4.
23. At the forefront of these questions is whether confounding and variation are, in fact the con-cepts most important for students in post-Stat 101 courses. P. 5.
24. Running counter to argument that they are, is recognition that for purposes of description or prediction, confounding and variation may not be the most important concepts. P. 5.
25. If the goal of the second course can be summarized by saying students should better under-stand confounding and variation, this presumes a basic level of understanding is obtained by students in the first course. P. 5.
26. We argue that the motivation for such models, addressing confounding and variation through design and analysis strategies should be the focus, with models as an end themselves. P. 5.
2964

Appendix H: GAISE 2016 Update
Guidelines for Assessment and Instruction in Statistics Education (GAISE) in Statistics Education (GAISE). College Report 2016. A pdf is available. 10 According to ResearchGate (B. Wood), this report has been cited 35 times.
Instances of the following words and phrases: data (474 including 9 large data and two big data), statistical thinking (42), association (17 plus 21 for Association), critical (10 including critical con-sumer 3), consumer (9), statistical reasoning (4), statistical literacy (3), statistically literate (1) and confound (20). In the Background for this update, the report noted that "The rapid increase in avail-able data has made the field of statistics more salient."
Here are excerpts containing the three instances of statistical literacy:
1: Scope: There is no single introductory statistics course. The variety of courses reflects a wide range of needs. Some introductory courses address statistical literacy, while others focus on statistical
methods. This distinction is sometimes referred to as courses for consumers versus those for producers of analyses.
2: Recommendation 1: Teach statistical thinking. As part of the development of statistical thinking skills, it is crucial to focus on helping students become better educated consumers of statistical information by introducing them to the basic language and the fundamental ideas of statistics, and by emphasizing the use and interpretation of statistics in everyday life. We want our students to become statistically literate (for more on statistical literacy, see Utts 2003, 2010, 2015).
3: References / Resources: St. Clair, K., and Chihara, L. (2012), “Team-Based Learning in a Statistical Literacy Class,” Journal of Statistics Education, 20.
Despite the demotion of statistical literacy, Schield (2016) claimed By introducing multivariate thinking and, more importantly, confounding, the GAISE revision committee has accepted – and greatly advanced – statistical literacy in the process. The revised guideline (GAISE, 2016) is the most important institutional paper advancing statistical literacy to date. Including multivariate thinking and confounding in introductory statistics courses and textbooks will be the biggest change in statistical education in decades. These are exciting times for statistical literacy and for statistics education.
Here are excerpts containing the 20 instances of confound. 1: Goal 9: Students should demonstrate an awareness of ethical issues associated with sound statis-tical practice.
With large datasets containing many variables, especially from observational studies, under-standing of confounding and multiple testing false positive rates becomes even more relevant. P 11.
2: Give students experience with multivariable thinking.
These examples also give rise to discussions of how confounding plays an important role in determining the appropriate scope of conclusions to be drawn from such data. P. 15
Appendix B: Multivariable Thinking
3: The 2014 ASA guidelines for undergraduate programs in statistics recommend that students obtain a clear understanding of principles of statistical design and tools to assess and account for the possible impact of other measured and unmeasured confounding variables (ASA 2014). P 34
10 https://www.amstat.org/asa/files/pdfs/GAISE/GaiseCollege_Full.pdf
2965

4: Simple methods such as stratification can allow students to think beyond two dimensions and reveal effects of confounding variables. P. 38 5: The net result is that the fraction taking the SAT is a confounding factor. P. 38 6: Statistical thinking with an appreciation of Simpson's paradox would alert a student to look for the hidden confounding variables. P. 38 7-8: Within an introductory statistics course, the use of stratification by a potential confounder is easy to implement. By splitting states up into groups based on the fraction of students taking the SAT it is possible to account for this confounder and use bivariate methods to assess the relationship for each of the groups. P. 39 9-10: It's important to have students look for possible confounding factors when the relationship isn't what they expect, but it is also important when the relationship is what is expected. It's not always possible to stratify by factors (particularly if important confounders are not collected). P. 40 11-13: Multivariable thinking is critical to make sense of the observational data around us. This type of thinking might be introduced in stages: P. 41
1. learn to identify observational studies, 2. explain why randomized assignment to treatment improves the situation, 3. learn to be wary of cause-and-effect conclusions from observational studies, 4. learn to consider potential confounding factors and explain why they might be con-
founding factors, and 5. use simple approaches (such as stratification) to address confounding.
Additional Examples of Good Assessment Items
14: For an observational study which assessed the association between coffee drinking and cancer, smoking status could mask (or ``confound") the relationship, since smoking could be associated with both coffee drinking and cancer. P. 105 footnote 15: Item 18: Use the language of statistics to critique the statement by Dr. Koenig and the claim, suggested by the article, that religious faith and practice help people fight depression. You will want to select some of the following words in your critique: observational study, ex-periment, blind, doubleblind, precision, bias, sample, spurious, confounding, causation, associ-ation, random, valid, and reliable. P. 113 16: Item 36:
1. Is this an observational study or experiment? Defend your answer. 2. What are the explanatory and response variables? 3. Identify a potential confounding variable in this work. 4. Is this a matched-pair design? Defend your answer.
17-18: ITEM 40: When conducting a randomized experiment, the original randomization of units to treatment groups breaks the association between
1. the explanatory variable and the response variable. 2. the explanatory variable and confounding variables. 3. the response variable and confounding variables.
19-20: ITEM 41 When conducting a randomization test, the simulated re-randomization of units to treatment groups breaks the association between
1. the explanatory variable and the response variable. 2. the explanatory variable and confounding variables. 3. the response variable and confounding variables.
2966

Appendix I: Schield Invited Papers (1999-2018)
Since his first invited paper in 1999, Schield has mentioned confound in all but one of his reviewed or invited statistical literacy papers. He averaged 32 references to confound in his eight invited papers. In one, he mentioned confound over 100 times. Here are each of his invited papers and the number of times confound appeared.
1999 APDU (17 times): Statistical Literacy: Thinking Critically About Statistics. Of Significance11
2004 AAC&U (7 times): Statistical Literacy and Liberal Education at Augsburg College.12
2004 IASE (48 times): Statistical Literacy Curriculum Design. Invited roundtable.13
2006 ASA Stats: (27 times): Understanding Confounding from Lurking Variables using Graphs14
2008 MAA (6 times): Quantitative Literacy and School Mathematics: Percentages and Fractions, Calculation vs. Context: Quantitative Literacy and Its Implications for Teacher Education.15
2010 Bidgood et al. (13 times in the excerpts). Assessing Statistical Literacy: TAKE CARE. Chap-ter 10 in Assessment Methods in Statistical Education: An International Perspective. Edited by Bidgood, Hunt and Joliffe.16
2011 SJIAOS (None): Statistical Literacy: A New Mission for Data Producers. Statistical Journal of the International Association of Official Statistics. Edited by N. Davies and J. Ridgway.17
2016 IASE (101 times): Stat 102: Social Statistics for Decision Makers. Invited roundtable.18
2017 SERJ (28 times): GAISE 2016 Promotes Statistical Literacy. Invited.19 See Appendix F.
2018 ICOTS (75 times). Confounding and Cornfield: Back to the Future)20
The following are Schield's definitive descriptions of statistical literacy in his 1999 paper:
1. Statistical literacy is the ability to read and interpret data: the ability to use statistics as evidence in arguments. Statistical literacy is a competency: the ability to think critically about statistics.
2. Statistical literacy is a basic skill: the ability to think critically about arguments using sta-tistics as evidence.
3. Being able to evaluate the plausibility and consequences of bias and confounding is essen-tial to being statistically literate.
4. SUMMARY: Statistical literacy focuses on understanding what is being asserted, asking good questions and evaluating evidence.
11 www.statlit.org/pdf/1999SchieldAPDU.pdf 12 www.statlit.org/pdf/2004Schieldaacu.pdf 13 www.statlit.org/pdf/2004SchieldIASE.pdf 14 www.statlit.org/pdf/2006SchieldStats.pdf 15 www.statlit.org/pdf/2007SchieldWingspread.pdf 16 www.statlit.org/pdf/2010SchieldExcerptsAssessingStatisticalLiteracy.pdf 17 www.statlit.org/pdf/2011schieldsjiaos.pdf 18 www.statlit.org/pdf/2016-Schield-IASE.pdf 19 www.statlit.org/pdf/2017-Schield-SERJ.pdf 20 www.statlit.org/pdf/2018-Schield-ICOTS.pdf
2967

Here are excerpts from Schield (1999) involving the 17 instances of confounding:
1. 'Confounder' in a graphic
2. But the evaluation was spurious: it didn’t take into account a confounding factor – a factor that was so influential that it would actually reverse the initial evaluation.
3. Eliminating the influence of confounding factors can be extremely difficult if not impos-sible in an observational study.
4. As the quality and quantity of data obtained in an observational study increases, the prob-lem of confounding becomes the central problem.
5. A spurious association is both true and ‘false’ – but in different ways. It is true given what one has (or has not) taken into account (controlled for). It is ‘false’ or at least accidental because it does not persist after one takes into account (controls for) a more important confounding factor.
6. Simpson's Paradox is a reversal of an association between two variables after a third vari-able (a confounding factor) is taken into account.
7. A confounding factor is a related factor: a factor that is found with (con) another.
8. An observed correlation may be spurious: due entirely to a confounding factor – a common cause.
9. At Berkeley, rejection for admission was more likely for women than for men at the college level. The confounding factor was the department.
10. This relation could be totally spurious if we have failed to take into account any confound-ing factors that are stronger.
11. In interpreting an observational association between A and B, the three causal explanations are (1) A causes B, (2) B causes A, and (3) C (some confounding factor) causes both A and B.
12. However there can be more than one confounding factor (more than one common cause).
13. There are no statistical tests for bias or for confounding factors.
14. There is no confidence interval for the probability of being free of bias or confounding. This is what makes statistical literacy an art.
15. Being able to evaluate the plausibility and consequences of bias and confounding is essen-tial to being statistically literate.
16-17: Without some measure of the strength of the association, without identifying what fac-tors might confound this relation and without seeing what strength remains in the association after controlling for these confounding factors, a statistically literate reader would say the ar-gument presented is very weak.
2968
Schield's argument for the importance of confounding was highlighted by his 1999 paper: Simpson's Paradox and Cornfield's Conditions. In that paper he reviewed the epic debate between Cornfield and Fisher. Fisher, a smoker, argued that the observed association between smoking and lung cancer might be confounded by genetics. Although there is not test for confounding, Cornfield derived a minimum effect size for a binary confounder to negate or reverse an observed association. Cornfield showed that Fisher's genetic association was inadequate to confound the observed association. Schield argued that "Cornfield's minimum effect size is as important to observational studies as is the use of randomized assignment to experimental studies." In spring 2018, Kaplan wrote:
For many years, Dr. Schield’s voice was pretty much the only one out there conveying the message that understanding and dealing with confounding needs to be core to the introductory curriculum. But, over the years, his patient and consistent advocacy and his articulate and schol-arly presentation kept the issue on the table. One sign of his cumulative effect is the appearance of a new emphasis in the 2016 ASA GAISE recommendations: “Give students experience with multivariable thinking.” Dr. Schield did not write the GAISE report, but he set the stage, moti-vated, and inspired the actors. For his important role in the evolution of statistics education, Dr. Schield’s has earned and warrants the honor of being designated an ASA Fellow.
This author believes that Kaplan is mistaken. Schield's emphasis on multivariate thinking was sec-ondary; his primary focus was confounding. One can do multivariate thinking in predicting, without thinking about confounding. In the 2016 GAISE update that order is reversed. Furthermore, Schield's 1999 paper was written 17 years before the 2016 GAISE update. Finally, none of Schield's papers were included in the 23 references for the body of that report or in the seven references for Appendix B on Multivariable Thinking. Schield (2018) argued that the Cornfield conditions are one of the three greatest contributions of statistics to human knowledge. In an ICOTS session, Nick Horton recommended that the attendees pay close attention to Schield's 2018 paper.
2969

Appendix J: Others Supporting a Confounder-Based Statistical Literacy
In 2003, Peter Holmes gave a talk at Augsburg College titled Statistical Literacy, Numeracy and the Future.21 Here are the matches: statistical literacy (20), Statistical Literacy (13) and confound-ing (10) but zero for lurking variable. In that talk, Holmes said,
"The issue of confounding variables is a major problem with all observational studies." "The Augsburg Course [by Milo] is different. It has a different emphasis from many other courses to establish statistical literacy. It comes from a different background, but that it has a lot of overlaps is what I’ve been trying to share. In many ways it reflects better the amount of the data that come as part of everyday life, certainly from large observational studies." In his approach, what he puts together is unique. That’s not to say that the individual things are necessarily unique, but the package as a whole comes off as a very different package. Be-cause it draws an existing work from different places, and from places that reputable statisti-cians rarely visit, he forced me to go there. I still think I’m fairly reputable and find that the course draws on ideas from areas which have not been in the traditional mainstream of statis-ticians. But they are there and they are statistical and we should be drawing on them. I think this course’s emphasis is much more in line with the sort of statistical literacy needed by most people in everyday life so you can read the news, those who are in business com-merce or management and for policy makers.
The traditional statistical literacy courses that are being developed are much more geared and have much more emphasis on the traditional sample to population (confidence intervals, sig-nificance tests and similar things). These are getting to be less and less a part of the sort of statistics that a lot of people meet in their everyday life.
In 2003, Jessica Utts authored "What Educated Citizens Should Know about Statistics and Proba-bility". Matches included confounding variables (5), statistical literacy (4), but no references to statistically literate, statistical thinking, statistical reasoning, consumer or lurking variable. In her paper, she identified seven important topics that had found "to be commonly misunderstood by cit-izens, including the journalists who present statistical studies to the public. Here is the first topic: 1. When it can be concluded that a relationship is one of cause and effect, and when it cannot,
including the difference between randomized experiments and observational studies.
Even though the paper had five references to confounding, none of them were contained in the summary list of the seven topics. They were detail items in the body of the paper. Indeed the first topic seemed to presume that one could not identify a relationship as one of case and effect in an observational study.
Resisting the temptation to make a causal conclusion is particularly difficult when a causal conclusion is logical, or when one can think of reasons for how the cause and effect mechanism may work. Therefore, when illustrating this concept for students, it is important to give many examples and to discuss how confounding variables may account for the relationship.
In 2018, Schield did a study of how often certain words and phrases were referenced in the index of various statistics textbooks. In a non-random sample of 100 books, he found that 10% had a modest to significant number of references to confound, Simpson's paradox or lurking variable. See Schield (2018b). Books in the 10% having a modest to significant amount included Utts, Moore, Agresti and Franklin, and Friedman, Pisani and Purves.
21
2970

Appendix K: Statistical Literacy SERJ Special Issue (2017)
This special edition involved 18 papers:
1. Statistical Literacy in the Data Science Workplace: Robert Grant
2. Data Literacy Is Statistical Literacy. Robert Gould
3. Interactive Visualisations and Statistical Literacy. Sinclair Sutherland and Jim Ridgway
4. Statistical Literacy as the Earth Moves. Chris J. Wild
5. Statistical Literacy in Data Revolution Era: Building Blocks and Instructional Dilemmas. Theodosia Prodromou and Tim Dunne
6. Statistical Literacy for Active Citizenship: A Call for Data Science Education. Joachim Engel
7. Gaise 2016 Promotes Statistical Literacy. Milo Schield
8. Against Inferential Statistics: How and Why Current Statistics Teaching Gets It Wrong. Patrick White and Stephen Gorard
9. A Response to White and Gorard: Against Inferential Statistics: How and Why Current Statistics Teaching Gets It Wrong. James Nicholson and Jim Ridgway
10. Still against Inferential Statistics: Rejoinder to Nicholson and Ridgway. Stephen Gorard and Patrick White
11. From the Classroom to the Workplace: How Social Science Students Are Learning to do Data Analysis for Real. Jackie Carter, Mark Brown, and Kathryn Simpson
12. Telling Stories, Landing Planes and Getting Them Moving – A Holistic Approach to De-veloping Students’ Statistical Literacy. Julie Scott Jones and John E. Goldring
13. Opening Real Science: Evaluation of an Online Module on Statistical Literacy for Pre-Service Primary Teachers. Ayse Aysin Bombaci Bilgin, Elizabeth Date-Huxtable, Carmel Coady, Vincent Geiger, Michael Cavanagh, Joanne Mulligan, and Peter Petocz
14. Developing Statistical Literacy in the Final School Year. Stephanie Budgett and Drusilla Rose
15. Interpretation of Statistical Data: The Importance of Affective Expressions. Tamires Quei-roz, Carlos Monteiro, Liliane Carvalho, and Karen François
16. The Development of Statistical Literacy at School. Rosemary Callingham and Jane M. Watson
17. Key Success Factors for Statistical Literacy Poster Competitions. Steve MacFeely, Pedro Campos, and Reija Helenius
18. Statistical Literacy in Public Debate – Examples from the UK 2015 General Election. Phoebe Arnold
The following is a summary of how often various words and phrases appeared in each of the 15 papers referenced. Papers 8, 9 and 10 were excluded since they focused on a very specific topic: the presentation and interpretation of p-value and statistical significance.
Words or phrases with less than 5 matches were not shown. These include think critically (3), covari (2), lurking variable (1), statistical significance (1) p-value (1) and coincidence (0).
2971

The number for each paper corresponds to its order of appearance in SERJ and is shown above.
Three of these papers (4, 6, 7) mentioned confound (confounding, confounded and or confounder).
Paper #4: Statistical Literacy: As the Earth Moves. Chris Wild: The three major reasons that we worry about in which data can mislead us are: bias, random error and confounding. These, and what we try to do to overcome them, must therefore play a central role in statistical literacy. There are always small biases in even the best studies but we never know how big they are.
Confounding is central for thinking about causal reasoning and inherently involves multivariate contexts.
Paper #6: Statistical Literacy for Active Citizenship: A Call for Data Science Education. J. Engel Exploring authentic data on topics about society provokes discussion and reflection about cen-tral statistical issues like operationalization of relevant variables and their measurement, meth-ods of data collection, the choice of relevant covariates and the role of potential confounders. P. 45
Making sense of multivariate data necessitates an awareness of other constructs that are seldom included in the introductory statistics materials at the high-school level, such as interactions, confounders, and non-linear relations. P. 46
Paper #7: GAISE 2016 Upholds Statistical Literacy. Milo Schield Excerpts containing the 28 uses of confound from this paper are shown here. Emphasis added.
1: The 2016 revision eliminated statistical literacy as a stated goal. Although this looks like a rejection, this paper argues that by including multivariate thinking and – more importantly – confounding as recommended topics in introductory statistics, statistical literacy has in fact been accepted if not promoted. P. 50
2: Keywords: Statistics education, Multivariable relationships, Confounding
3-5: According to Tintle et al. (2013), a main topic is “identifying the two major themes of statistical analysis (confounding and variation)” (p. 298). Utts (2003) noted that “it is important for students of statistics to understand the distinction between randomized experiments and observational studies, and to understand how the potential for confounding variables limits the
2972

conclusions that 52 can be made from observational studies” (p. 75). In order to study con-founding, one must study multivariate data.
6-10: So what does the GAISE revision say about multivariate thinking and confounding? With large datasets […] from observational studies, understanding of confounding
[…] becomes even more relevant (p. 11). […] how confounding plays an important role in determining the appropriate scope of
conclusions to be drawn from such data (p. 15). that students obtain a clear understanding of principles of statistical design and tools
to assess and account for the possible impact of other measured and unmeasured con-founding variables (p. 34).
Perhaps the best place to start is to consider how a third variable can change our un-derstanding of the relationship between two variables (p. 34).
Statistical thinking with an appreciation of Simpson’s paradox would alert a student to look for the hidden confounding variables (p. 38).
11-13: Those reading the new GAISE report (GAISE, 2016) may not realize how big of a change this revision is. Multivariate thinking and confounding were not even mentioned in the earlier report (GAISE, 2005), neither in McKenzie’s (2004) list of core concepts, nor in articles on statistical literacy by Watson (2003) and Gal (2002). But in the new version, multivariate and multivariable are mentioned 19 times and have a separate appendix. This is a big change. Simpson’s paradox is mentioned six times while variations on confound are mentioned 20 times. Mentioning Simpson’s Paradox and confounding is a much bigger change.
14-15: Statistical educators seem more comfortable dealing with multivariate than they are with confounding. In the entire JSM Program Book (2015), multivariate was mentioned in 14 papers; confound was mentioned in only one (which was by Schield). Why this difference?
16: Confounding is not a major issue in describing or predicting in the absence of a controlled intervention. P 52
17: In explaining, confounding is a major problem.
18-21: Focusing on confounding takes statistical education much closer to causation. Avoiding confounding allows statisticians to keep their ‘heads in the clouds’ and avoid dealing with the causal connections in the real world. If the goal of statistical literacy is to introduce citizens and decision-makers to the uses of – and influences on – a statistic, then statistical literacy must include confounding and the many ways confounders can be taken into account.
22: By including confounding, the GAISE (2016) revision upholds Moore’s (2001) claim that statistical literacy should focus on the difference between experiments and observational studies and teach students to “beware the lurking variable.”
23-24: Schield (2016a) argued that the revised guidelines supported – if not required – a new course, STAT 102: Social Statistics for Decision Makers, with a focus on confounding and the many devices used to take into account related factors. He argued that it takes time – weeks and months, not hours or days – for students to learn to think hypothetically about what might confound an observed association.
25-26: According to Schield (2016b), 61% of the students taking a STAT 102 compliant course at Augsburg College in the last two years agreed that it “should be required by all college stu-dents for graduation” (n = 105). These same students ranked confounding and hypothetical thinking as second among the most-important topics. It appears that statistical educators and students see value in focusing more on multivariate data and confounding in an introductory statistics course.
27-28: By introducing multivariate thinking and, more importantly, confounding, the GAISE revision committee has accepted – and greatly advanced – statistical literacy in the process. The revised guideline (GAISE, 2016) is the most important institutional paper advancing statistical literacy to date. Including multivariate thinking and confounding in introductory statistics courses and textbooks will be the biggest change in statistical education in decades. These are exciting times for statistical literacy and for statistics education.
2973

Appendix L: Sharma (2017), Univ. Minnesota (2019) and Witmer (2019)
Sashi Sharma (2017) Definitions and models of statistical literacy: a literature review, Open Review of Educational Research.
ANALYSIS: Matches: Statistical literacy (187), statistical thinking (24), statistical reasoning (11), critical think-ing (9), association (8), comparison (5), variation (4), statistically literate (3), chance (3), probability (2), social statistics (1) and confound (1). No match for covariation or lurking variable.
Unfortunately all of the questions involved just one or two variables. None of the four questions chosen seemed to allow for confounding to be a factor.
The following excerpt contains their single use of confound:
Introduction: citizens need to understand that headlines such as above were determined from a sample of the population under study and the conclusions may be subject to confounding variables and sam-pling error.
Univ. of Minnesota Statistics Education Survey (Sept 18, 2019)
Statistical educators were requested to participate in a survey on current pedagogical, assessment, and curricular trends. This survey was approved by the University Minnesota IRB. Schield noted that there were no questions on confounding. The respondent said (private conversation) that in the pilot testing we did, nobody brought those up as topics to consider. Witmer (2019)
In Rossman's 2019 interview with Jeff Witmer, Witmer downplayed the importance of statistical inference. He recalled being stunned when Harry Roberts said he spent "perhaps a week" on statis-tical inference. Matches in this interview included caus (25 after omitting 12 because) observational (7), confound (5) and lurking variable (1). There were none for statistical literacy, statistical rea-soning, statistical thinking or critical. In this interview, Witmer said:
I’m just learning how to dance to the music of causal inference. I love telling my students about Simpson’s Paradox, but for years I’ve only been telling part of the story. I see Danny Kaplan and a few others in the room, but there is a lot of open space on the dance floor and most statisticians are either outside, looking in through the window, or are outside and are intention-ally looking the other way.
Witmer is the new editor of the Journal of Statistics Education (JSE). As such, he is in a position to encourage a greater focus on confounding that has been the case in the past.
2974