Statistical Brief No. 6 Cifras Breves No. 6 · Statistical Brief No. 6 Cifras Breves No. 6...
19
Statistical Brief No. 6 Cifras Breves No. 6 Immigrants from Latin America and the Caribbean: A Socioeconomic Profile By Rubén G. Rumbaut, Ph.D. Professor of Sociology, Michigan State University April 1995 A Publication of Julian Samora Research Institute Michigan State University 112 Paolucci Building East Lansing, MI 48824-1110 Phone: (517) 432-1317 • Fax: (517) 432-2221 E-Mail: [email protected] Web Page: http//www.jsri.msu.edu Statistical Briefs of the Julian Samora Research Institute are designed to provide facts and figures on Latinos of the Midwest. The data presented are those of the author(s) and are intended for use in further public policy research. The Julian Samora Research Institute is a unit of the Colleges of Social Sciences and Agriculture & Natural Resources at Michigan State University.
Transcript of Statistical Brief No. 6 Cifras Breves No. 6 · Statistical Brief No. 6 Cifras Breves No. 6...

Statistical Brief No. 6Cifras Breves No. 6
Immigrants from Latin America andthe Caribbean: A Socioeconomic Profile
By
Rubén G. Rumbaut, Ph.D.Professor of Sociology, Michigan State University
April 1995
A Publication of
Julian Samora Research InstituteMichigan State University
112 Paolucci BuildingEast Lansing, MI 48824-1110
Phone: (517) 432-1317 • Fax: (517) 432-2221E-Mail: [email protected]
Web Page: http//www.jsri.msu.edu
Statistical Briefs of the Julian Samora Research Institute are designed to provide facts and figureson Latinos of the Midwest. The data presented are those of the author(s) and are intended for usein further public policy research.
The Julian Samora Research Institute is a unit of the Colleges of Social Sciences and Agriculture& Natural Resources at Michigan State University.
Michigan State UniversityEast Lansing, Michigan
Julian Samora Research InstituteRefugio I. Rochín, Director
Marcelo E. Siles, CIFRAS EditorDanny Layne, Layout Editor
SUGGESTED CITATION
Rumbaut, Rubén G. “Immigrants from Latin America and the Caribbean: A Socioeconomic Profile.” CIFRASNo. 6, the Julian Samora Research Institute. Michigan State University, East Lansing, Michigan. April 1995.
Related Reading from JSRI Publications
WP-02 Santos, Richard. “Hispanic Workers in the Midwest: A Decade of Economic Contrast, 1970-1980.” 28pp.(1989) $3.50
WP-15 Morales, Rebecca. “Redefining Borders: Labor Migration and National Sovereignty.” 35pp. (1992) $3.00
RR-05 Aponte, Robert and Marcelo Siles. “Latinos in the Heartland: The Browning of the Midwest.” 81pp. (1994)$6.00
CIFRAS-1 Aponte, Robert and Marcelo Siles. “Michigan Hispanics: A Socio-economic Profile.” 7pp. (1994)
CIFRAS-5 Aponte, Robert and Marcelo Siles. “Hispanics in the Midwest: A Socio-economic Profile.” (1995)
Related Reading by the Author
Rumbaut, Rubén G. and Wayne A. Cornelius, eds. California’s Immigrant Children: Theory, Research, and Implications forEducational Policy. (La Jolla: Center for U.S.-Mexican Studies, University of California, San Diego, 1995)
Rumbaut, Rubén G. “Origins and Destinies: Immigration to the United States Since World War II.” Sociological Forum,9,4 (December 1994), 583-621.
Rumbaut, Rubén G. “The Crucible Within: Ethnic Identity, Self-Esteem, and Segmented Assimilation Among Children ofImmigrants.” International Migration Review, 28,4 “Winter 1994”, 748-794.
Rumbaut, Rubén G. “The Americans: Latin American and Caribbean Peoples in the United States.” In Alfred Stepan, ed.,Americans: New Interpretive Essays, (NY: Oxford University Press, 1992), 275-307.
Rumbaut, Rubén G. “Passages to America: Perspectives on the New Immigration.” In Alan Wolfe, ed., America at Cen -tury’s End, (Berkeley: University of California Press, 1991), 208-244, 518-526.
Rumbaut, Rubén G. and Alejandro Portes. Immigrant America: A Portrait, (Berkeley: University of California Press, 1990;2nd Edition forthcoming).

Immigrants from Latin America andthe Caribbean: A Socioeconomic Profile
Table of Contents
Population and Settlement ......................................................................................................................2
Socioeconomic Characteristics of U.S. Hispanics and Non-Hispanics ................................................4
A Socioeconomic Portrait of Principal Immigrant Groups ..............................................................12
Figures
Fig. 1. Percent of U.S. Population by State, 1990 ................................................................................3
Fig. 2. Hispanic Settlement in the United States, 1990 ........................................................................4
Fig. 3. Education, Percent of College Graduates in the U.S. ..............................................................6
Fig. 4. Type of Occupation in the U.S. ..................................................................................................7
Fig. 5. Percent of Population Below Poverty Level and Receiving Public Assistance ......................7
Fig. 6. Per Capita income in the U.S. ....................................................................................................8
Fig. 7. Family Type. Percentage of Female-Headed Households in the U.S. ....................................8
Fig. 8. Foreign Born Persons in the U.S. ............................................................................................10
Fig. 9. Year of Immigration to the U.S. ..............................................................................................10
Fig. 10. Naturalized U.S. Citizens ........................................................................................................11
Fig. 11. Principal Immigrant Groups’ Educational Attainment in the U.S. ....................................12
Fig. 12. Labor Force Participation and Occupation of Principal Immigrant Groups ....................14
Fig. 13. English Proficiency of Persons Aged 5 Years and Older ....................................................15
Fig. 14. Persons 60 Years and Older of the Principal Immigrant Groups ......................................15
Tables
Table 1. States and Countries of Principal Hispanic Settlement in the U.S.......................................2
Table 2. Size, Nativity, and Socioeconomic Characteristics of Principal Groups ............................5
Table 3. Size, Year of Immigration, U.S. Citizenship, and Patterns of Concentration ....................9
Table 4. English Proficiency and Socioeconomic Characteristics ....................................................13
The Julian Samora Research Institute is a unit of the College of Social Scienceand is affiliated with the College of Agriculture and Natural Resources.

Immigrants From Latin America and the Caribbean:A Socioeconomic Profile
Contemporary immigration to the United States and the formation of new ethnic groups are the com-plex and unintended social consequences of the expansion of the nation to its post-World War II positionof global hegemony. Immigrant communities in the United States today are related to a history of Ameri-can military, political, economic, and cultural involvement and intervention in the sending countries, espe-cially in Asia and the Caribbean Basin, and to the linkages that are formed in the process that open a varietyof legal and illegal migration pathways. The 19.8 million foreign-born persons counted in the 1990 U.S.census formed the largest immigrant population in the world, though in relative terms, only 7.9% of theU.S. population was foreign-born, a lower proportion than earlier in this century. Today’s immigrants areextraordinarily diverse, a reflection of polar-opposite types of migrations embedded in very different his-torical and structural contexts. Also, unlike the expanding economy that absorbed earlier flows fromEurope, since the 1970’s new immigrants have entered an “hourglass” economy with reduced opportuni-ties for social mobility, particularly among the less educated, and new waves of refugees have entered awelfare state with expanded opportunities for public assistance. (Rubén G. Rumbaut, 1994)
This CIFRAS seeks to make sense of the new diversity, with a focus on immigrants from Latin Amer-ica and the Caribbean. Some key facts and figures about contemporary immigrants are presented, lookingat their patterns of settlement and comparing their distinctive social and economic characteristics to majorU.S. racial-ethnic groups. Their different modes of incorporation in - and consequences for - Americansociety are the subject matter of more extensive articles by the author, as noted in the references.
The information of this CIFRAS is conveyed in four data tables, drawn from the 1990 U.S. Census ofPopulation. Each table is designed to address separate but interrelated issues of today’s Latino population.In order, the tables cover:
* Patterns of Settlement of the U.S. Hispanic Population;
* A Socioeconomic Portrait of Major U.S. Ethnic Groups;
* Latin American and Caribbean Immigrants in the U.S. Today;
* A Socioeconomic Portrait of Principal Immigrant Groups.
In addition, several Figures are presented to highlight certain parts of the tables.
1

Population and Settlement
Of the 249 million people counted by the 1990 U.S. Census, Hispanics accounted for 22.4 million, or 9% ofthe total population; up 53% from the 14.6 million counted in 1980. The sharp increase in the Hispanic populationhas been largely due to recent and rapidly growing immigration from Latin America and the Caribbean, makingLatinos the largest immigrant population in the country. Only Mexico, Argentina, and Colombia have larger Span-ish-origin populations. If current trends continue, and there’s every reason to believe that they will, Hispanics asa whole will surpass African-Americans in population size sometime in the next decade.
As detailed in Table 1 and Figure 1, nearly three out of four Hispanics in the United States reside in just fourstates: California (with over a third of the total), Texas (nearly one-fifth), New York, and Florida (combining forone-sixth). By contrast, less than one-third of the total U.S. population resides in those states. Indeed, Hispanicsnow account for more than 25% of the populations of California and Texas.
2
Table 1. States and Counties of Principal Hispanic Settlement in the United States, 1990
State orCounty Total 1990 % Hispanic % Hispanic of % of U.S. PERCENT OF EACH GROUP’S POPULATION
Hispanic Pop. Growth, State or County Hispanic Puerto OtherN in 1,000s Population 1980-1990 Population Population Mexican Rican Cuban Hispanic
U.S. TOTALS (%) 100.0 53.0 9.0 100.0 60.4 12.2 4.7 22.8
States:
California 7,687,938 69.2 25.8 34.4 45.3 4.6 6.9 26.9Texas 4,339,905 45.4 25.5 19.4 28.8 1.6 1.7 7.6New York 2,214,026 33.4 12.3 9.9 0.7 39.8 7.1 18.9Florida 1,574,143 83.4 12.2 7.0 1.2 9.1 64.6 9.7Illinois 904,446 42.3 7.9 4.0 4.6 5.4 1.7 2.3New Jersey 739,861 50.4 9.6 3.3 0.2 11.7 8.2 6.0Arizona 688,338 56.2 18.8 3.1 4.6 0.3 0.2 1.2New Mexico 579,224 21.4 38.2 2.6 2.4 0.1 0.1 4.9Colorado 424,302 24.9 12.9 1.9 2.1 0.3 0.2 2.6
Counties:
Los Angeles, CA 3,351,242 62.2 37.8 15.0 18.7 1.5 4.4 14.5Dade (Miami), FL 953,407 64.1 49.2 4.3 0.2 2.7 54.0 5.8Cook (Chicago), IL 694,194 39.0 13.6 3.1 3.4 4.7 1.4 1.7Harris (Houston), TX 644,935 74.7 22.9 2.9 3.8 0.3 0.7 2.2Bexar (San Antonio), TX 589,180 27.8 49.7 2.6 4.0 0.2 0.1 0.8Orange (Santa Ana), CA 564,828 97.3 23.4 2.5 3.5 0.3 0.6 1.5The Bronx, NY 523,111 32.0 43.5 2.3 0.1 12.8 0.9 3.0San Diego, CA 510,781 85.6 20.4 2.3 3.3 0.4 0.3 1.1Kings (Brooklyn), NY 462,411 17.9 20.1 2.1 0.2 10.1 0.9 3.1El Paso, TX 411,619 38.6 69.6 1.8 2.9 0.1 0.0 0.3New York (Manhattan) 386,630 15.0 26.0 1.7 0.1 5.7 1.7 4.0Queens, NY 381,120 45.2 19.5 1.7 0.1 3.7 1.8 4.9San Bernardino, CA 378,582 128.2 26.7 1.7 2.4 0.3 0.3 0.9
Source: U.S. Bureau of the Census, “Persons of Hispanic Origin for the United States and States: 1990,” and “Hispanic Origin Population by County:1990 and 1980,” 1990 Census of Population (1991); and 1990 Census State Summary Tape Files STF-3 (1993).

Patterns of concentration are even more pronounced for specific groups: three-fourths of all Mexican-Ameri-cans are in California and Texas alone, half of the Puerto Ricans are in the New York-New Jersey area, and two-thirds of the Cubans are in Florida. Significant numbers of Mexican-Americans and Puerto Ricans are also inIllinois, overwhelmingly in Chicago. The category “Other Hispanic” used by the census includes both long-estab-lished groups who trace their roots to the region prior to the annexation of the Southwest after the U.S.-Mexico War(notably in New Mexico, where Hispanics still account for more than 38% of the state’s population despite com-paratively little recent immigration), and also recent immigrants from Central/South America and the SpanishCaribbean (with a quarter in California, another quarter in New York-New Jersey, and a tenth in Florida).
These patterns of concentration are more pronounced still in metropolitan areas within states, and in particularcommunities within metropolitan areas. The bottom panel of Table 1 lists the 13 largest counties in the U.S. of His-panic concentration (the “baker’s dozen” out of more than 1,200 counties in the U.S.) In 1990, there were 3.4 mil-lion in Los Angeles County alone, 15% of the national Hispanic population and 38% of the total population of LosAngeles. Three other adjacent areas in Southern California — Orange, San Diego, and San Bernardino Counties— reflected the highest rates of Hispanic population growth over the past decade and combine with Los Angelesto account for 22% of the U.S. total. Nearly 8% of the total Hispanic population resides in four boroughs of NewYork City: the Bronx, Brooklyn, Manhattan, and Queens. Half of the populations of Dade County (Miami) andBexar County (San Antonio) are Hispanic — principally of Cuban and Mexican origin, respectively — as are overtwo-thirds of the population of El Paso (on the Mexican border) and nearly a quarter of Houston’s.
Today, the Mexican-origin population of Los Angeles is exceeded only by Mexico City, Guadalajara, and Mon-terrey; Havana is the only city in Cuba larger than Cuban Miami; San Salvador and Santo Domingo are slightlylarger than Salvadoran Los Angeles and Dominican New York; and there are twice as many Puerto Ricans in NewYork City than in the capital of Puerto Rico, San Juan.
3
Figure 1. Percent of U.S. Hispanic Population by State, 1990
Source: Table 1.

Socioeconomic Characteristics of U.S. Hispanics and Non-Hispanics
About 60% of all U.S. Hispanics are of Mexican origin (13.5 million) and 12% are Puerto Ricans (2.7 millionon the mainland, excluding the 3.5 million in Puerto Rico), making them the nation’s second and third largest eth-nic minorities after African-Americans (29 million). By comparison, only four other groups had populations in 1990above 1 million: American-Indians; the Chinese (the nation’s oldest and most diversified Asian-origin minority, orig-inally recruited as laborers to California in the mid-19th Century until their exclusion in 1882); Filipinos (colonizedby the U.S. for the first half of this century and also recruited to work in plantations in Hawaii and California untilthe 1930’s); and Cubans (who account for 5% of all Hispanics and whose immigration is also tied closely to the his-tory of U.S.-Cuban relations). The original incorporation of all of these sizable groups, except the oldest (Ameri-can-Indians) and the newest (Cubans), was characterized by processes of labor importation. What is more, while thehistories of each took complex and diverse forms, the four largest ethnic minorities in the country — A f r i c a n - A m e r-icans, Mexican-Americans, Puerto Ricans, and American-Indians — are peoples whose incorporation originatedl a rgely involuntarily through conquest, occupation, and exploitation (followed, in the case of Mexicans and PuertoRicans, by mass immigration during the 20th Century, much of it initiated by active labor recruitment by U.S. com-panies), setting the foundation for subsequent patterns of social and economic inequality. These are reflected in thesocioeconomic profiles presented in Table 2 for all the major U.S. racial-ethnic groups. Note that the next threel a rgest groups — the Chinese, Filipinos, and Cubans — are today largely composed of immigrants who have cometo the U.S. since the 1960’s, but building on structural linkages established much earlier.
4
Figure 2. Hispanic Settlement in the United States, 1990PERCENT OF EACH GROUP’S U.S. POPULATION
Source: Table 1.

5
Table 2. Size, Nativity, and Socioeconomic Characteristics ofPrincipal Racial-Ethnic Groups in the United States, 1990
NATIVITY EDUCATION1 OCCUPATION2 INCOME3 TYPE4
Racial-Ethnic Foreign College UpperWhite LowerBlue Poverty % Public Per % FemaleGroups Born5 Grads (%) Collar(%) Collar(%) Rate (%) Assistance Capita ($) Households
Hispanics5 22,354,059 35.8 9.2 14.1 22.9 25.3 14.3 8,400 21.6
Mexican 13,495,938 33.3 6.3 11.6 24.9 26.3 12.5 7,447 18.2
Puerto Rican6 2,727,754 1.2 9.5 17.2 21.0 31.7 26.9 8,403 36.6
Cuban 1,043,932 71.7 16.5 23.2 16.5 14.6 15.2 13,786 16.3
Salvadoran 565,081 81.2 5.0 6.3 26.4 24.8 7.1 7,201 21.2
Dominican 520,151 70.6 7.8 11.1 29.4 33.0 27.1 7,381 41.2
Non-Hispanic
White 188,128,296 3.3 22.0 28.5 13.4 9.2 5.3 16,074 11.8
Black 29,216,293 4.9 11.4 18.1 20.8 29.5 19.7 8,859 43.2
Asian & Pacific
Islanders 6,968,359 63.1 36.6 30.6 12.1 14.1 9.9 13,638 11.3
Chinese 1,645,472 69.3 40.7 35.8 10.6 14.0 8.3 14,877 9.4
Filipino 1,406,770 64.4 39.3 26.6 11.0 6.4 10.0 13,616 15.1
Japanese 847,562 32.4 34.5 37.0 6.9 7.0 2.9 19,373 11.9
Asian Indian 815,447 75.4 58.1 43.6 9.4 9.7 4.6 17,777 4.5
Korean 798,849 72.7 34.5 25.5 12.8 13.7 7.8 11,178 11.3
Vietnamese 593,213 79.9 17.4 17.6 20.9 25.7 24.5 9,033 15.9
Pacific
Islanders6 365,024 12.9 10.8 18.1 16.3 17.1 11.8 10,342 18.4
Am. Indian, Eskimo,
& Aleut 1,793,773 2.3 9.3 18.3 19.4 30.9 18.6 8,367 26.2
Total Pop. 248,709,873 7.9 20.3 26.4 14.9 13.1 7.5 14,649 16.0
1 Education of persons aged 25 years or older.2 Employed persons age 16 or older;
“Upper White Collar” = professionals, executives, and managers; “Lower Blue Collar” = operators, fabricators, and laborers.3 Persons below the Federal poverty line, and households receiving public assistance income.4 Female Head-of-Household with no husband present.5 Hispanics may be of any “race,” as classified by the census.6 Puerto Ricans and Pacific Islanders residing in the 50 states.
Source: U.S. Bureau of the Census, 1990 Census of Population; Social and Economic Characteristics, 1990 CP-2-1, Nov. 1993; and1990 Census of Population: Persons of Hispanic Origin in the United States, 1990 CP-3-3, Aug. 1993.

While today’s immigrants come from over 100 different countries, the majority come from two small sets ofdeveloping countries located either in the Caribbean Basin or in Asia, all variously characterized by significant his-torical ties to the U.S. The former include Mexico (still by far the largest source of both legal and illegal immigra-tion), Cuba, the Dominican Republic, Jamaica, and Haiti, with El Salvador and Guatemala emerging prominently assource countries for the first time during the 1980’s; the latter include the Philippines, South Korea, Vietnam, China(including Taiwan), and India. In each set, their historical relationships with the U.S. have variously given rise toparticular social networks of family and friends that over time serve as bridges of passage to the United States, link-ing places of origin with places of destination, opening “chain migration” channels, and giving the process of immi-gration its cumulative and seemingly spontaneous character. To be sure, there are many factors — economic,political, cultural, geographic, demographic — that help explain contemporary immigration to and socioeconomicincorporation in the United States, but none can do so adequately outside of its historical context.
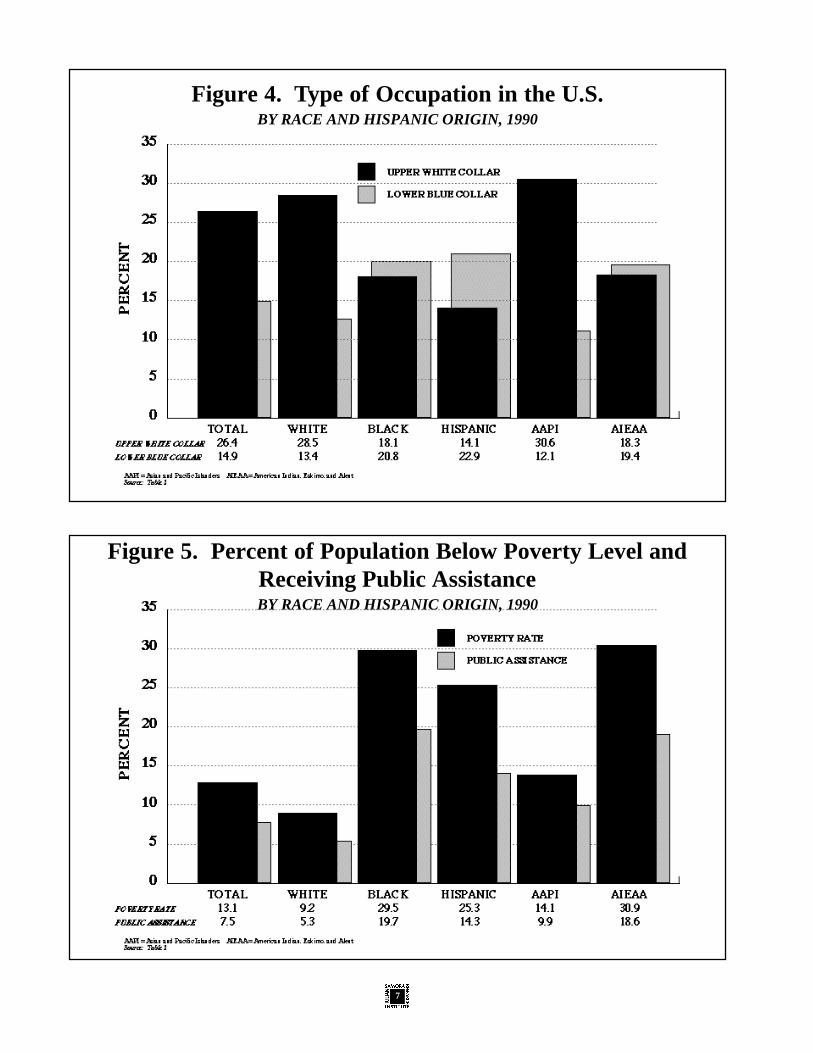
Table 2 compares the major Hispanic and non-Hispanic racial-ethnic groups in the U.S., including both the for-eign-born and the native-born. Hispanics differ sharply not only from non-Hispanics, but also among themselves,in terms of education, occupation, poverty, public assistance, per capita income, and family type. See Table 2 fordetails. In addition, these major differences are highlighted in Figures 3, 4, 5, 6, and 7. Note that the informationin Table 2 does not break down such differences by nativity within each ethnic group. For example, of the 13.5million persons of Mexican origin in the U.S., two-thirds are U.S.-born, while only one-third are immigrants(despite the enormous flow of recent Mexican immigration). The remaining sections of this report will focus solelyon the characteristics of the foreign-born.
6
Figure 3. Education, Percent of College Graduates in the U.S.BY RACE AND HISPANIC ORIGIN, 1990
7
Figure 4. Type of Occupation in the U.S.BY RACE AND HISPANIC ORIGIN, 1990
Figure 5. Percent of Population Below Poverty Level andReceiving Public AssistanceBY RACE AND HISPANIC ORIGIN, 1990

8
Figure 6. Per Capita Income in the U.S.BY RACE AND HISPANIC ORIGIN, 1990
Figure 7. Family Type, Percentage of Female-HeadedHouseholds in the U.S.
BY RACE AND HISPANIC ORIGIN, 1990

Immigrants in the United States Today
Table 3 provides a comparative portrait of the foreign-born population of the U.S. — at 19.8 million persons,the largest immigrant population in the world, although constituting only 8% of the total U.S. population, muchlower than its proportion at the turn of the century.
9
Table 3. Size, Year of Immigration, U.S. Citizenship, and Patterns of Concentration of Principal ImmigrantGroups in the U.S. in 1990, by Region & Selected Latin American/Caribbean Countries of Birth
YEAR OFIMMIGRATION NATURALIZED STATE OFPRINCIPALTO THE U.S. U.S. CITIZEN SETTLEMENT
Region/Country Foreign-Born 1980’s 1970’s 1960’s Pre-1960 Yes No Calif. NY/NJ Fla.of Birth Persons (N) (%) (%) (%) (%) (%) (%) (%) (%) (%)
REGION:
Latin America/Caribbean 8,416,924 50.0 28.0 15.0 7.0 27.0 73.0 38.7 17.9 12.8Asia 4,979,037 57.0 29.0 9.0 5.0 41.0 59.0 40.2 15.7 2.3Europe and USSR 4,350,403 20.0 13.0 19.0 48.0 64.0 36.0 15.4 27.2 6.9Canada 744,830 17.0 12.0 20.0 51.0 54.0 46.0 21.0 9.6 10.4Africa 363,819 61.0 28.0 7.0 4.0 34.0 66.0 18.1 22.2 4.1
LATIN AMERICAAND CARIBBEAN:
Spanish-Speaking Countries:Mexico 4,298,014 50.0 31.0 11.0 8.0 23.0 77.0 57.6 1.3 1.3Cuba 736,971 26.0 19.0 46.0 9.0 51.0 49.0 6.7 15.6 67.5El Salvador 485,433 76.0 19.0 4.0 1.0 15.0 85.0 60.3 10.5 2.1Dominican Republic 347,858 53.0 27.0 17.0 3.0 28.0 72.0 1.0 79.9 6.7Colombia 286,124 52.0 27.0 18.0 3.0 29.0 71.0 10.7 43.0 23.3Guatemala 225,739 69.0 22.0 7.0 2.0 17.0 83.0 60.2 10.7 5.1Nicaragua 168,659 75.0 16.0 5.0 4.0 15.0 85.0 34.6 7.1 42.7Perú 144,199 60.0 22.0 13.0 5.0 27.0 73.0 26.1 23.2 16.9Ecuador 143,314 40.0 33.0 22.0 5.0 26.0 74.0 13.6 63.1 7.7Honduras 108,923 64.0 19.0 12.0 5.0 26.0 74.0 24.0 25.2 19.1Argentina 92,563 39.0 24.0 28.0 9.0 44.0 56.0 29.1 27.6 14.2Panama 85,737 35.0 22.0 23.0 20.0 51.0 49.0 15.0 35.9 13.4Chile 55,681 37.0 39.0 16.0 8.0 33.0 67.0 26.1 23.2 16.9Costa Rica 43,530 44.0 26.0 21.0 9.0 33.0 67.0 30.0 26.6 15.7Venezuela 42,119 67.0 15.0 12.0 6.0 23.0 77.0 11.3 19.5 33.2Bolivia 31,303 50.0 23.0 18.0 10.0 30.0 70.0 22.5 16.6 9.7Uruguay 20,766 38.0 38.0 19.0 5.0 38.0 62.0 13.2 46.7 13.0Paraguay 6,057 41.0 40.0 14.0 5.0 33.0 67.0 15.4 37.9 5.6
English-Speaking Countries:Jamaica 334,140 47.0 33.0 15.0 5.0 38.0 62.0 3.4 50.2 22.1Guyana 120,698 63.0 27.0 8.0 2.0 40.0 60.0 3.5 75.6 6.5Trinidad and Tobago 115,710 38.0 37.0 22.0 3.0 32.0 68.0 4.9 59.6 10.5Barbados 43,015 34.0 37.0 19.0 10.0 46.0 54.0 2.9 68.1 5.9Belize 29,957 32.0 33.0 31.0 4.0 35.0 65.0 44.8 25.2 5.7Bahamas 21,633 39.0 32.0 8.0 21.0 33.0 67.0 2.1 12.5 66.6
Other-Language Countries:Haiti 225,393 61.0 26.0 11.0 2.0 27.0 73.0 1.2 45.7 36.9Brazil 82,489 56.0 15.0 18.0 11.0 24.0 76.0 15.8 27.9 11.3
Total Foreign-Born: 19,767,316 44.0 25.0 14.0 17.0 41.0 59.0 32.7 19.3 8.4Total Native-Born: 228,942,557 — — — — — — 10.2 9.6 4.9
Source: U.S. Bureau of the Census, 1990 Ethnic Profiles for States, CPH-L-136, 1993; The Foreign Born Population in the United States, 1990 CP-3-1,July 1993, Tables 1, 3; and The Foreign Born Population in the United States: 1990, CPH-L-98, 1993, Table 13. Data on year of immigrationare drawn from a 5% Public Use Microdata Sample (PUMS) of the 1990 Census, and subject to sample variability; decimals are rounded off.

Table 3 also presents information on the recency of immigration, the proportion of naturalized U.S. citizens,and the states of principal settlement, broken down by world region and for all of the major sending countries inLatin America and the Caribbean, in rank order by the size of the different national-origin groups.
As highlighted in Figure 8, Latin America and the Caribbean alone accounted for nearly 43%, 8.4 million offoreign-born persons in the U.S. in 1990, fully half of them coming just during the 1980’s. This meant that by 1990,for the first time in U.S. history, Latin American and Caribbean peoples comprised the largest immigrant popula-tion in the country.
10
Figure 8. Foreign Born Persons in the United StatesBY REGION, 1990
Figure 9. Year of Immigration to the United StatesBY REGION

As shown in Figure 9, there were also more residents of the U.S. in 1990 who were born in Asia than in Europe,and huge proportions of both Latinos and Asians had settled especially in California. The number of Asian andAfrican immigrants more than doubled during the last decade. In fact, over four-fifths of their 1990 populationshad arrived only since 1970, reflecting the fact that Asian and African immigration has largely taken place sincethe passage of the 1965 Immigration Act, which abolished racist national-origins quotas which had largelyexcluded non-Europeans from the Eastern Hemisphere. In sharp contrast, the Europeans and Canadians countedin the 1990 census consisted largely of aged and aging populations who had immigrated well before 1960, and theirimmigration patterns reflect a declining trend over the past three decades.
Mexico’s 1990 immigrant population in the U.S. (4.3 million, of whom over 2 million were formerly undocu-mented immigrants whose status was legalized under the amnesty provisions of the Immigration Reform and Con-trol Act of 1986) accounted for half of all immigrants from Latin America and the Caribbean, and indeed for nearlya quarter of the entire foreign-born population of the U.S. The Cuban-born population in 1990 (737,000) was byfar the next largest immigrant group, and the only one who arrived preponderantly during the 1960’s. However,the number of Cubans arriving during the 1980’s (including the 125,000 who came in the 1980 Mariel boatlift) wassurpassed by that of Salvadorans, Dominicans, Jamaicans, and Guatemalans, with Haitians, Colombians, andNicaraguans not far behind. (Among these many entered illegally during the decade, most after the 1981 daterequired to qualify for the amnesty provisions of IRCA.) From South America the largest flow remains that fromColombia, although significant numbers of Ecuadorans and Peruvians came during the 1980’s. The biggestincrease was registered by the Guyanese, making them, surprisingly, the fastest-growing immigrant group fromSouth America in recent years. Indeed, the Guyanese share a common pattern with other English-speaking groupsin the Commonwealth Caribbean (such as Jamaica, Trinidad, Barbados, and Belize); the percentage of immigrantsfrom these countries relative to their 1990 homeland populations is very high, most reaching double-digits.
Figure 10 provides data on the percentage of each group who had been naturalized as U.S. citizens as of 1990.As would be expected, those immigrant groups who had resided longer in the U.S. (Europeans and Canadians, mostof whom came before the 1960’s) had a higher proportion of naturalized citizens; recent arrivals (Asians, Africans,and Latin Americans, most of whom had come only in the 1980’s), who are just beginning to make their way inthe U.S., were much less likely to have initiated the process of citizenship acquisition. However, Latin Americanimmigrants as a whole had the lowest proportion of naturalized citizens (27%), despite the fact that Asians andAfricans were the most recently arrived groups. Clearly, time in the U.S. alone does not explain why differentgroups become U.S. citizens at different rates, but this is an important question since, along with higher numbers
11
Figure 10. Naturalized United States CitizensBY RACE AND HISPANIC ORIGIN, 1990

12
and greater concentration, citizenship acquisition, and effective political participation go to the heart of ethnic pol-itics and to the ability of these groups to make themselves heard in the larger society. Among legal immigrants,the research literature (see references at the end of the report) has shown that the motivation and propensity to nat-uralize is higher among upwardly-mobile younger persons with higher levels of education, occupational status,English proficiency, income and property, whose spouses or children are U.S. citizens. In fact, the combination ofthree variables alone — educational level, geographical proximity, and political origin of migration — largelyexplain differences in citizenship acquisition among immigrant groups. Undocumented immigrants, by definition,are ineligible for citizenship and remain permanently disenfranchised.
A Socioeconomic Portrait of Principal Immigrant Groups
Table 4 extends this general picture with detailed 1990 census information on social and economic character-istics for all of these immigrant groups, ranked in order of their proportion of college graduates (which, as noted,may serve as a proxy for their social class origins). These data, which are compared against the norms for the totalU.S.-born population, reveal the extraordinary socioeconomic diversity of immigrants to the U.S., in general, andof those from the Americas, in particular.
A first point that stands out in Table 4, and highlighted in Figure 11, is the extremely high degree of educa-tional attainment among immigrants from Asia and Africa: some 40% to 50% are college graduates, compared to20% for the total U.S. population, and they are well above average in their proportion of professionals. For somecountries such as India (not shown in the table), their proportions are much higher than the continental averageshown; for example, over 90% of Indian immigrants to the U.S. in the late 1960’s and early 1970’s had professionaland managerial occupations in India prior to immigration, as did four-fifths in the late 1970’s and two-thirds dur-ing the 1980’s, despite the fact that over time most of these immigrants have been admitted under family reunifi-cation preferences. By the mid-1970’s there were already more Filipino and Indian foreign medical graduates inthe U.S. than American black physicians; by the mid-1980’s one-fifth of all engineering doctorates awarded by U.S.universities went to foreign-born students from Taiwan, India, and South Korea alone; and by 1990 the U.S. Cen-sus showed that the most highly educated groups in the U.S. were immigrants from India, Taiwan, and Nigeria.
Figure 11. Principal Immigrant Groups’ Educational Attainmentin the United States, 1990
PERSONS AGED 30 YEARS OR OLDER

13
Table 4. English Proficiency and Socioeconomic Characteristics of Principal Immigrant Groups in the U.S.in 1990 in Rank Order of College Grad, By Region and Selected Latin American/Caribbean Countries of Birth
LABOR FORCESPEAKS ENGLISH EDUCATION AND OCCUPATION INCOME AGE
Region/Country Persons English Not Well or College In Labor Upper-White Lower-Blue Poverty 60 Years+of Birth (N) Only (%) Not At All (%) Grads (%) Force (%) Collar(%) Collar(%) (%) (%)
REGIONAfrica 363,819 25.0 5.0 47.1 75.1 37.0 12.0 15.7 6.0Asia 4,979,037 8 22.0 38.4 66.4 32.0 13.0 16.2 11.0Europe and Canada 5,095,233 45.0 9.0 18.6 52.2 32.0 12.0 9.3 40.0Latin America/Caribbean 8,416,924 13.0 40.0 9.1 70.7 12.0 26.0 24.3 10.0
LATIN AMERICAAND CARIBBEAN
Spanish-Speaking CountriesVenezuela 42,119 9.0 12.0 37.2 68.2 34.0 11.0 21.1 5.0Argentina 92,563 8.0 15.0 27.7 74.0 33.0 11.0 11.0 13.0Bolivia 31,303 5.0 16.0 26.1 76.3 22.0 12.0 13.8 7.0Chile 55,681 7.0 20.0 23.5 74.0 27.0 14.0 11.0 10.0Panama 85,737 26.0 7.0 20.5 69.3 24.0 10.0 15.7 13.0Perú 144,199 4.0 30.0 20.5 75.9 18.0 19.0 14.8 8.0Paraguay 6,057 5.0 28.0 18.9 75.2 18.0 16.0 13.7 5.0Uruguay 20,766 4.0 30.0 15.5 76.2 19.0 22.0 10.7 9.0Cuba 736,971 5.0 40.0 15.4 63.8 23.0 18.0 14.9 30.0Colombia 286,124 5.0 34.0 15.1 73.7 17.0 22.0 15.4 8.0Nicaragua 168,659 4.0 41.0 14.5 73.3 11.0 24.0 24.4 7.0Costa Rica 43,530 7.0 22.0 14.0 69.5 18.0 16.0 16.2 10.0Ecuador 143,314 4.0 39.0 11.4 73.9 14.0 27.0 15.3 9.0Honduras 108,923 6.0 37.0 8.1 71.0 9.0 24.0 28.4 6.0Dominican Republic 347,858 4.0 45.0 7.3 63.6 10.0 31.0 30.5 8.0Guatemala 225,739 3.0 45.0 5.8 75.9 7.0 28.0 26.0 4.0El Salvador 485,433 3.0 49.0 4.6 76.2 6.0 27.0 25.1 4.0Mexico 4,298,014 4.0 49.0 3.5 69.7 6.0 32.0 29.8 7.0
English-Speaking CountriesBahamas 21,633 80.0 1.0 18.0 54.8 13.0 10.0 23.6 19.0Guyana 120,698 94.0 1.0 15.8 74.2 19.0 12.0 11.9 9.0Trinidad and Tobago 115,710 94.0 0.0 15.6 77.2 20.0 10.0 14.9 9.0Jamaica 334,140 94.0 0.0 14.9 77.4 22.0 11.0 12.1 12.0Barbados 43,015 98.0 0.0 8.6 76.7 11.0 8.0 9.4 16.0Belize 29,957 88.0 0.0 8.0 77.0 17.0 9.0 15.5 8.0
Other-LanguageCountriesBrazil 82,489 16.0 23.0 34.2 71.6 20.0 12.0 10.8 11.0Haiti 225,393 6.0 23.0 11.8 77.7 14.0 21.0 21.7 7.0
Total Foreign-Born 19,767,316 21.0 26.0 20.4 64.3 22.0 19.0 18.2 18.0Total Native-Born 228,942,557 92.0 1.0 20.3 65.4 27.0 14.0 12.7 17.0
1 English proficiency of persons aged 5 years or older.2 Educational attainment for persons aged 25 years or older.3 Labor force participation and occupation for employed persons 16 years or older;
“upper white-collar” = professionals, executives, and managers; “lower blue-collar” = operators, fabricators, and laborers.4 Percent of persons below the federal poverty line.
Source: U.S. Bureau of the Census, The Foreign Born Population in the United States, CP-3-1, July 1993, Tables 1-5; Persons of Hispanic Origin in theUnited States, CP-3-3, August 1993, Tables 1-5; and data drawn from a 5% Public Use Microdata Sample (PUMS) of the 1990 U.S. Census,subject to sample variability.

These data document a classic pattern of “brain drain” immigration; indeed, although they come from developingcountries, these immigrants as a group are perhaps the most skilled ever to come to the United States, a fact thathelps explain the class origins of the recent popularization of Asians as a “model minority” and to debunk nativistcalls for restricting immigrants to those perceived to be more “assimilable” on the basis of language and culture.Canadians and Europeans, though they are much older resident groups (as reflected in their low rates of labor forceparticipation and high naturalization rates), show levels of education slightly below the U.S. average, an occupa-tional profile slightly above it, and lower poverty rates. (See Figure 12.) Latin Americans as a whole, by contrast,have high rates of labor force participation but well below-average levels of educational attainment, are concen-trated in lower blue-collar employment (operators, fabricators, and laborers), and exhibit higher poverty rates.
However, as shown in the bottom panel of Table 4, a different picture emerges when broken down by nationalorigin, underscoring the fact that these populations cannot sensibly be subsumed under the supranational rubic of“Hispanic” or “Latino” except as a catch-all category. Among Latin Americans, the highest “socioeconomic sta-tus” (SES) is reflected by Venezuelans, Argentineans, Bolivians, and Chileans (who are also among the smallest ofthe immigrant groups) — suggesting that these groups consist substantially of highly skilled persons who haveentered under the occupational preferences of U.S. immigration law. Brazilians also recently emerged in this lat-ter category. The lowest SES is found among Mexicans, Salvadorans, Guatemalans, and Dominicans (who werealso the largest groups of immigrants entering both legally and illegally in the 1980’s). Their socioeconomic char-acteristics approximate those of Puerto Ricans on the mainland (as seen earlier in Table 2), except that the povertyrate for the latter is much higher than that of any Latin American or Caribbean immigrant group (only Dominicanssimilarly exhibited poverty rates above 30%). Hondurans, Ecuadorans, and Nicaraguans also reflected a muchhigher ratio of lower-blue-collar to upper-white collar employment, as did to a lesser extent Haitians and Colom-bians. Panamanians, Peruvians, Paraguayans, Uruguayans, and Cubans reflected levels of educational attainmentnear the U.S. norm, and their occupational and income characteristics put them closer to the national average.Occupying an intermediate position were groups from the English-speaking Caribbean (Jamaica, Trinidad, Barba-dos, Guyana), with SES patterns quite similar to each other and somewhat below U.S. norms.
14
Figure 12. Labor Force Participation and Occupationof Principal Immigrant Groups
IN THE UNITED STATES IN 1990

Table 4 and Figure 13 also focus on the level of English language proficiency of the U.S. foreign-born popu-lation, by region and for all of the largest Latin American and Caribbean immigrant groups. The latter as a wholeexhibit a much lower degree of English proficiency than Asians, Africans, and Europeans, reflecting previouslynoted differences in socioeconomic status and time in the U.S. But again, even among “Hispanic” groups, there isas much diversity in their patterns of language competency as we saw with respect to other socioeconomic char-
15
Figure 13. English Proficiency of Persons Aged 5 Years and OlderBY WORLD’S REGION IN THE U.S., 1990
Figure 14. Persons 60 Years or Older of the Principal Immigrant GroupsIN THE U.S. IN 1990

acteristics. Quite obviously, nearly all immigrants from the Commonwealth Caribbean are English monolinguals(a much higher proportion than Canadians, in fact). Among all other Latinos, Panamanians (the oldest residentimmigrant group from Latin America, 20% of whom had arrived in the U.S. prior to 1960, as shown earlier in Table3) were the most English proficient (in fact, over a quarter were already English monolinguals), followed by immi-grants from Venezuela, Argentina, Bolivia, and Chile (the highest-SES groups from Latin America). The least pro-ficient, with approximately half reporting being unable to speak English well or at all, were immigrants fromMexico, El Salvador, Guatemala, and the Dominican Republic — who, as seen earlier, were also the largest immi-grant cohorts entering in the 1980’s as well as the lowest-SES groups from Latin America.
In addition to education and time in the U.S., age is also a key to the ability to develop proficiency in the Eng-lish language, as is residence within dense ethnic enclaves. (See Figure 14.) Cuban refugees, whose median ageis the oldest by far of any immigrant group from the Americas (about a third are over 60 years old), provide thebest example: 40% reported speaking English not well or at all, and on closer inspection these tend to be older orelderly persons residing in areas of high ethnic concentration such as Miami. Still, the data in Table 4 are remark-able in showing that even among the most recently arrived groups, large proportions already report being able tospeak English well or very well, and indeed that non-negligible proportions of the foreign-born speak English only.That fact notwithstanding, English language competency particularly among Hispanic immigrants in the U.S. —and their alleged Spanish “retentiveness” and “unwillingness” to assimilate — has become a highly chargedsociopolitical issue, with nativist organizations warning about cultural “Balkanization” and Quebec-like linguisticseparatism in region of high Hispanic concentration. Those fears are wholly misplaced. English fluency not onlyincreases over time in the U.S. for all immigrant groups, but English also becomes by far the preferred languageof use by the second generation. For children of immigrants, it is their mother tongue that atrophies over time, andquickly: the third generation typically has grown up speaking English only. This historical pattern explains whythe United States has been called a “language graveyard.”
16