
Cachet Technologies 1998 Cachet Technologies Technology Overview February 1998.
NATIONAL CENTER FOR EDUCATION STATISTICS
Statistical Analysis Report February 1998 Postsecondary Education Descriptive Analysis Reports
Postsecondary Financing Strategies: How Undergraduates Combine Work, Borrowing, and Attendance Stephanie Cuccaro-Alamin Susan P. Choy MPR Associates, Inc.
C. Dennis Carroll Project Officer National Center for Education Statistics Data Series: NPSAS93, BPS:90/94
U.S. Department of Education Office of Educational Research and Improvement NCES 98-088
U.S. Department of Education Richard W. Riley Secretary
Office of Educational Research and Improvement Ricky T. Takai Acting Assistant Secretary
National Center for Education Statistics Pascal D. Forgione, Jr. Commissioner
The National Center for Education Statistics (NCES) is the primary federal entity for collecting, analyzing, and reporting data related to education in the United States and other nations. It fulfills a congressional mandate to collect, collate, analyze, and report full and complete statistics on the condition of education in the United States; conduct and publish reports and specialized analyses of the meaning and significance of such statistics; assist state and local education agencies in improving their statistical systems; and review and report on education activities in foreign countries.
NCES activities are designed to address high priority education data needs; provide consistent, reliable, complete, and accurate indicators of education status and trends; and report timely, useful, and high quality data to the U.S. Department of Education, the Congress, the states, other education policymakers, practitioners, data users, and the general public.
We strive to make our products available in a variety of formats and in language that is appropriate to a variety of audiences. You, as our customer, are the best judge of our success in communicating information effectively. If you have any comments or suggestions about this or any other NCES product or report, we would like to hear from you. Please direct your comments to:
National Center for Education Statistics Office of Educational Research and Improvement U.S. Department of Education 555 New Jersey Avenue NW Washington, DC 20208–5574
February 1998
The NCES World Wide Web Home Page is http://nces.ed.gov Suggested Citation
U.S. Department of Education. National Center for Education Statistics. Postsecondary Financing Strategies: How Undergraduates Combine Work, Borrowing, and Attendance, NCES 98088, by Stephanie Cuccaro-Alamin and Susan P. Choy. Project Officer, C. Dennis Carroll. Washington, DC: 1998.
Contact: Aurora D’Amico 202-219-1356
HIGHLIGHTS
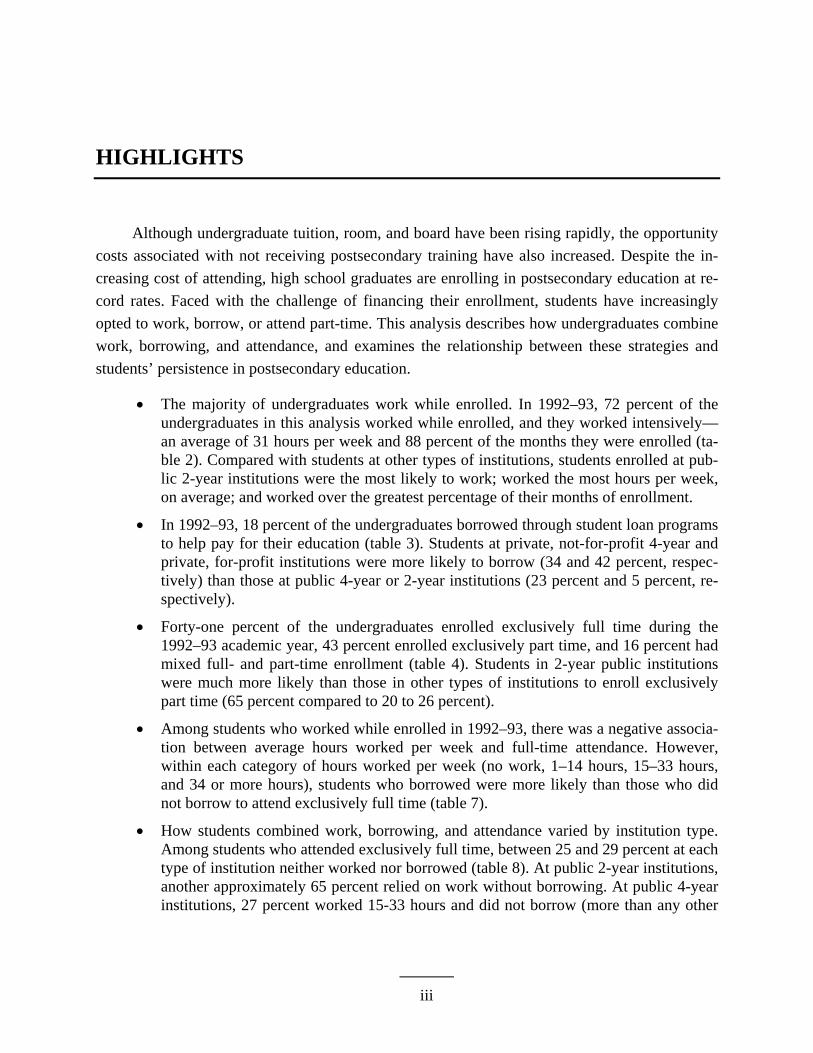
Although undergraduate tuition, room, and board have been rising rapidly, the opportunity costs associated with not receiving postsecondary training have also increased. Despite the in-creasing cost of attending, high school graduates are enrolling in postsecondary education at re-cord rates. Faced with the challenge of financing their enrollment, students have increasingly opted to work, borrow, or attend part-time. This analysis describes how undergraduates combine work, borrowing, and attendance, and examines the relationship between these strategies and students’ persistence in postsecondary education.
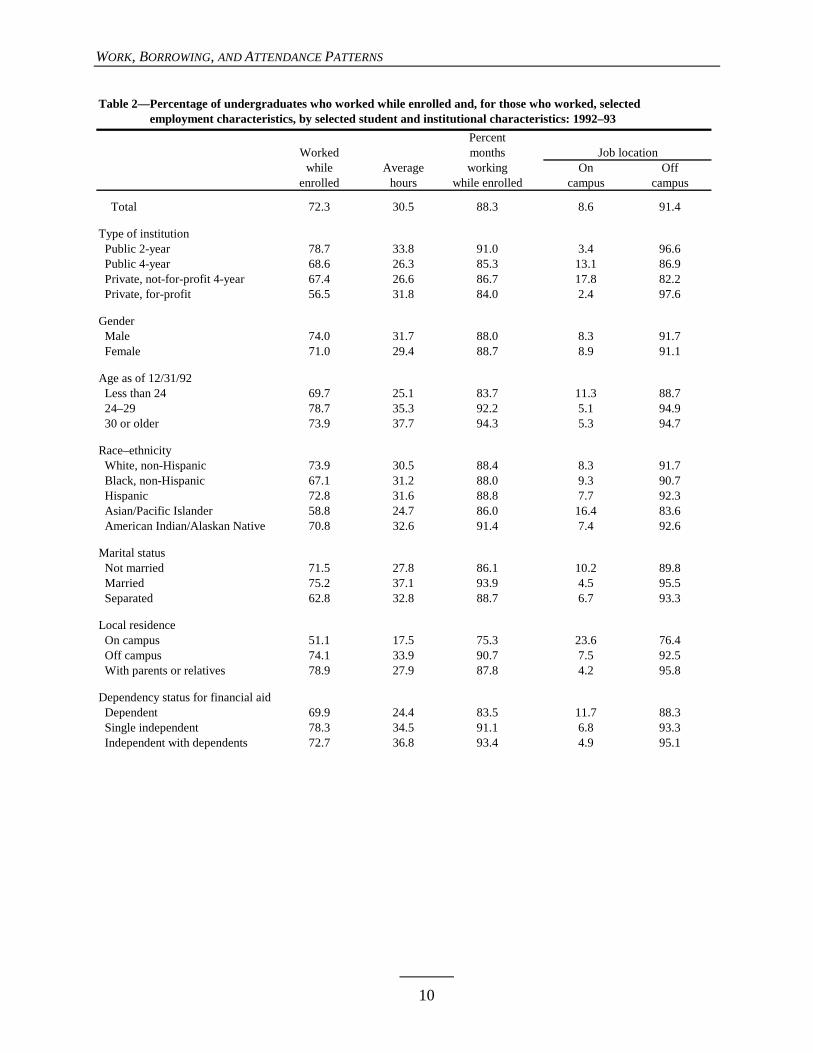
• The majority of undergraduates work while enrolled. In 1992–93, 72 percent of the undergraduates in this analysis worked while enrolled, and they worked intensively—an average of 31 hours per week and 88 percent of the months they were enrolled (ta-ble 2). Compared with students at other types of institutions, students enrolled at pub-lic 2-year institutions were the most likely to work; worked the most hours per week, on average; and worked over the greatest percentage of their months of enrollment.
• In 1992–93, 18 percent of the undergraduates borrowed through student loan programs to help pay for their education (table 3). Students at private, not-for-profit 4-year and private, for-profit institutions were more likely to borrow (34 and 42 percent, respec-tively) than those at public 4-year or 2-year institutions (23 percent and 5 percent, re-spectively).
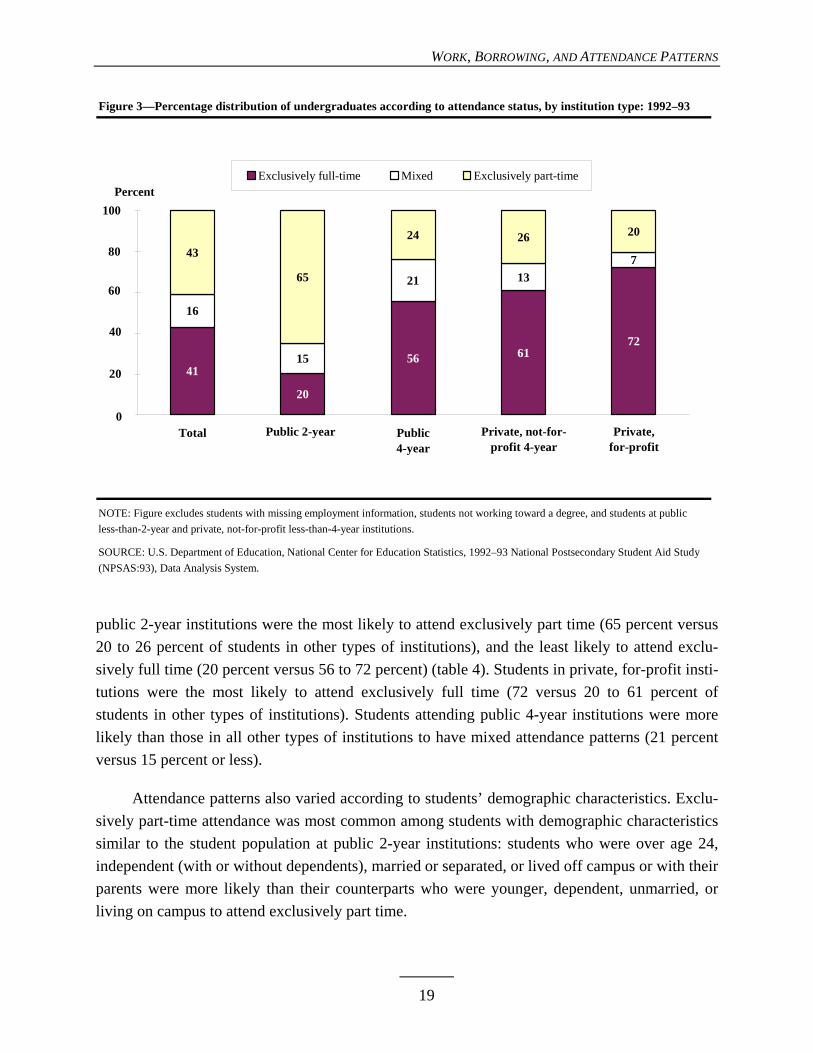
• Forty-one percent of the undergraduates enrolled exclusively full time during the 1992–93 academic year, 43 percent enrolled exclusively part time, and 16 percent had mixed full- and part-time enrollment (table 4). Students in 2-year public institutions were much more likely than those in other types of institutions to enroll exclusively part time (65 percent compared to 20 to 26 percent).
• Among students who worked while enrolled in 1992–93, there was a negative associa-tion between average hours worked per week and full-time attendance. However, within each category of hours worked per week (no work, 1–14 hours, 15–33 hours, and 34 or more hours), students who borrowed were more likely than those who did not borrow to attend exclusively full time (table 7).
• How students combined work, borrowing, and attendance varied by institution type. Among students who attended exclusively full time, between 25 and 29 percent at each type of institution neither worked nor borrowed (table 8). At public 2-year institutions, another approximately 65 percent relied on work without borrowing. At public 4-year institutions, 27 percent worked 15-33 hours and did not borrow (more than any other
iii
HIGHLIGHTS
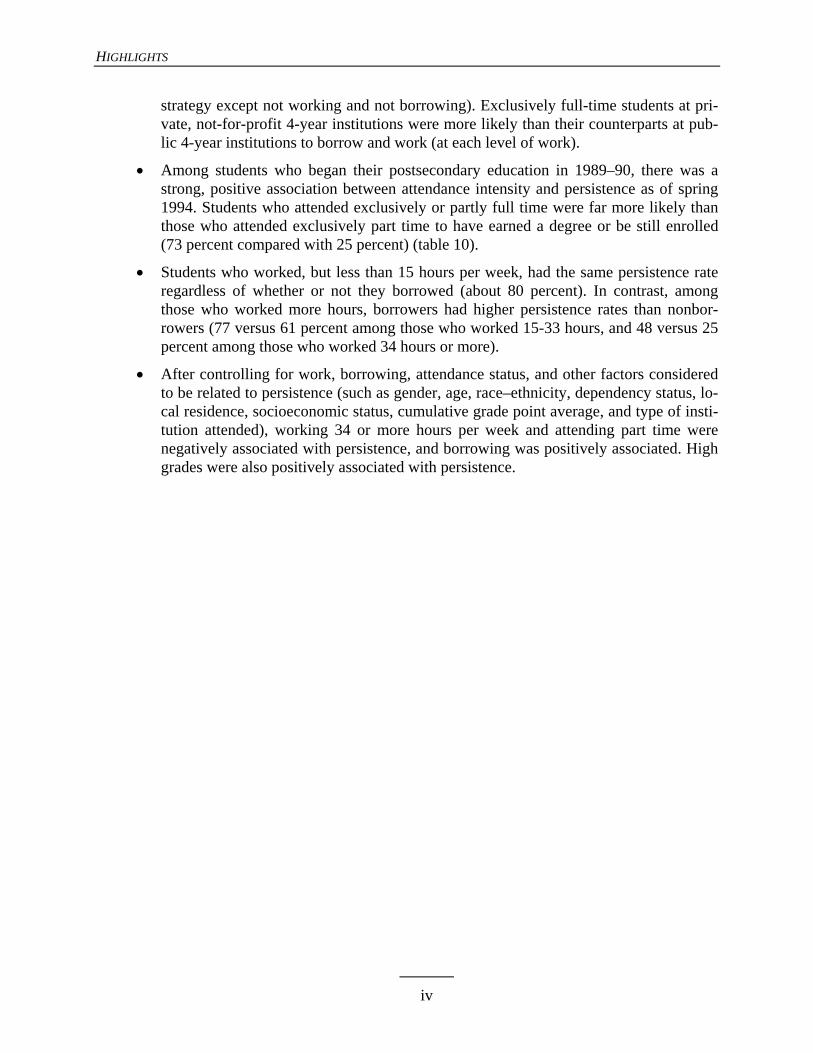
strategy except not working and not borrowing). Exclusively full-time students at pri-vate, not-for-profit 4-year institutions were more likely than their counterparts at pub-lic 4-year institutions to borrow and work (at each level of work).
• Among students who began their postsecondary education in 1989–90, there was a strong, positive association between attendance intensity and persistence as of spring 1994. Students who attended exclusively or partly full time were far more likely than those who attended exclusively part time to have earned a degree or be still enrolled (73 percent compared with 25 percent) (table 10).
• Students who worked, but less than 15 hours per week, had the same persistence rate regardless of whether or not they borrowed (about 80 percent). In contrast, among those who worked more hours, borrowers had higher persistence rates than nonbor-rowers (77 versus 61 percent among those who worked 15-33 hours, and 48 versus 25 percent among those who worked 34 hours or more).
• After controlling for work, borrowing, attendance status, and other factors considered to be related to persistence (such as gender, age, race–ethnicity, dependency status, lo-cal residence, socioeconomic status, cumulative grade point average, and type of insti-tution attended), working 34 or more hours per week and attending part time were negatively associated with persistence, and borrowing was positively associated. High grades were also positively associated with persistence.
iv
FOREWORD
This report examines the postsecondary financing strategies of undergraduates. Specifi-cally, it describes how undergraduates combine work, borrowing, and attendance to support their postsecondary enrollment, and examines the relationship between various financing strategies and students’ persistence in postsecondary education.
The report uses data from the 1992–93 National Postsecondary Student Aid Study (NPSAS:93) and the Beginning Postsecondary Student Longitudinal Study (BPS:90/94). NPSAS:93 represents students of all ages and backgrounds at all types of postsecondary institu-tions (from less-than-2-year institutions that provide short-term vocational training to 4-year col-leges and universities) who were enrolled during the 1992–93 academic year. BPS:90/94 represents students who began postsecondary education for the first time in 1989–90. This group was followed up in 1992 and 1994 and thus can be used to study persistence.
The percentages and means presented in this report were produced using the NPSAS:93 and BPS:90/94 Data Analysis Systems (DAS). The DAS is a microcomputer application that al-lows users to specify and generate their own tables from the NPSAS and BPS data. It produces the design-adjusted standard errors that are necessary for testing the statistical significance of differences shown in the tables. For more information about the DAS and directions for obtain-ing access through the Internet, see appendix C.
v

ACKNOWLEDGMENTS
The authors wish to thank all those who contributed to this report. At MPR Associates, Laura Horn and Lutz Berkner reviewed the analysis at various stages and provided many helpful comments. Thanks also go to Barbara Kridl, who supervised the production of the report; Andrea Livingston and Karyn Madden, who edited it; Leslie Retallick, who prepared the graphics; Mary Sukkestad, who formatted the tables, and Francesca Tussing, who assembled the final report.
We would also like to acknowledge the careful review and thoughtful comments of the fol-lowing reviewers: Dennis Carroll, Robert Burton, and Shelley Burns at NCES; Ellen Bradburn from the Education Statistics Services Institute; Jennifer Kron from the Office of Postsecondary Education; and Beth Felsen from the National Association of Student Financial Aid Administra-tors (NASFAA).
vi

TABLE OF CONTENTS
Page
Highlights.................................................................................................................................... iii Foreword..................................................................................................................................... v Acknowledgments ...................................................................................................................... vi List of Tables .............................................................................................................................. viii List of Figures............................................................................................................................. x
Introduction................................................................................................................................ 1 Choosing a Strategy to Finance Postsecondary Education.................................................... 1 Data and Variable Definitions ............................................................................................... 3
Work, Borrowing, and Attendance Patterns........................................................................... 9 Work ...................................................................................................................................... 9 Borrowing .............................................................................................................................. 13 Attendance Patterns ............................................................................................................... 15 Summary by Institution Type ............................................................................................... 20 Relationship Between Work, Borrowing, and Attendance ................................................... 21 Work and Borrowing Patterns of Full- and Part-Time Students .......................................... 25
Financing Strategies and Persistence ....................................................................................... 29 Persistence and Attendance Status......................................................................................... 31 Persistence, Borrowing, and Work ........................................................................................ 31 Other Factors Associated With Persistence. .......................................................................... 34 Multivariate Analysis of the Relationship Between Persistence and Work, Borrowing
and Attendance ................................................................................................................... 37
Summary and Conclusion ......................................................................................................... 41
Appendix A—Glossary .............................................................................................................. 43 Appendix B—Notes on the Definition of the Analysis Sample .............................................. 55 Appendix C—Technical Notes and Methodology ................................................................... 59
vii

LIST OF TABLES
Table Page
1 Percentage distribution of 1989–90 first-time beginning postsecondary students according to cumulative work status through 1994, by work status in 1989–90............. 5
2 Percentage of undergraduates who worked while enrolled and, for those who worked, selected employment characteristics, by selected student and institutional characteristics: 1992–93 .................................................................................................. 10
3 Percentage of undergraduates who borrowed and, for those who borrowed, the average amount borrowed according to the type of institution, by selected demographic and institutional characteristics: 1992–93.................................................. 16
4 Percentage distribution of undergraduates according to attendance status by selected demographic and institutional characteristics: 1992–93.................................................. 18
5 Percentage distribution of undergraduates according to number of months enrolled in 1992–93, by attendance status in 1992–93 ...................................................................... 20
6 Percentage distribution of undergraduates according to work, borrowing, attendance status, and institution type, by work, borrowing, attendance status, and institution type: 1992–93 ................................................................................................. 22
7 Percentage distribution of undergraduates according to attendance status by borrowing and working status, by institution type: 1992–93 .......................................... 24
8 Percentage distribution of undergraduates according to borrowing and working status, by institution type and attendance status: 1992–93 .............................................. 26
9 Percentage distribution of NPSAS:93 and BPS:90/94 samples according to working and borrowing status ........................................................................................................ 30
10 Percentage of 1989–90 first-time beginning postsecondary students who had attained a degree or were still enrolled as of spring 1994 according to type of first institution, by work, borrowing, and attendance status: 1989–94 ..................................................... 32
viii
LIST OF TABLES
Table Page
11 Percentage distribution of first-time beginning postsecondary students according to work, borrowing, and attendance status, by measures of academic ability and potential: 1989–94 ........................................................................................................... 36
12 Percentage of 1989–90 first-time beginning postsecondary students who attained a degree or were still enrolled as of spring 1994, and the adjusted percentage after taking into account the covariation among row variables ............................................... 38
B1 Percentage of NPSAS:93 and BPS:90/94 undergraduates meeting criteria for sample exclusion .......................................................................................................................... 55
B2 Percentage distribution of NPSAS:93 and BPS:90/94 students according to study inclusion status, by selected characteristics..................................................................... 56
B3 Percentage distribution of NPSAS:93 and BPS:90/94 students according to attendance status by selected demographic characteristics ............................................. 58
C1 Standard errors for table 4: Percentage distribution of undergraduates according to attendance status, by selected demographic and institutional characteristics: 1992–93 ................................................................................................. 62
ix
LIST OF FIGURES
Figure Page
1 Percentage of undergraduates who worked and for those who worked, the average hours worked per week while enrolled, by institution type: 1992–93............................. 12
2 Percentage of undergraduates who borrowed to finance their postsecondary education and for those who borrowed, the average amount borrowed, by institution type: 1992–93 .................................................................................................................. 15
3 Percentage distribution of undergraduates according to attendance status, by institution type: 1992–93 ................................................................................................. 19
4 Percentage distribution of undergraduates according to attendance status, by number of hours worked while enrolled and borrowing status: 1992–93..................................... 23
5 Percentage of 1989–90 first-time beginning postsecondary students who attained a degree or were still enrolled as of spring 1994, by attendance status and type of first institution ......................................................................................................................... 33
6 Percentage of 1989–90 first-time beginning postsecondary students who attained a degree or were still enrolled as of spring 1994, according to hours worked while enrolled and borrowing status.......................................................................................... 34
7 Among 1989–90 first-time beginning postsecondary students who attended exclusively or partly full time, percentage who attained a degree or were still enrolled as of spring 1994, by institution type, hours worked while enrolled, and borrowing status............................................................................................................... 35
x
INTRODUCTION
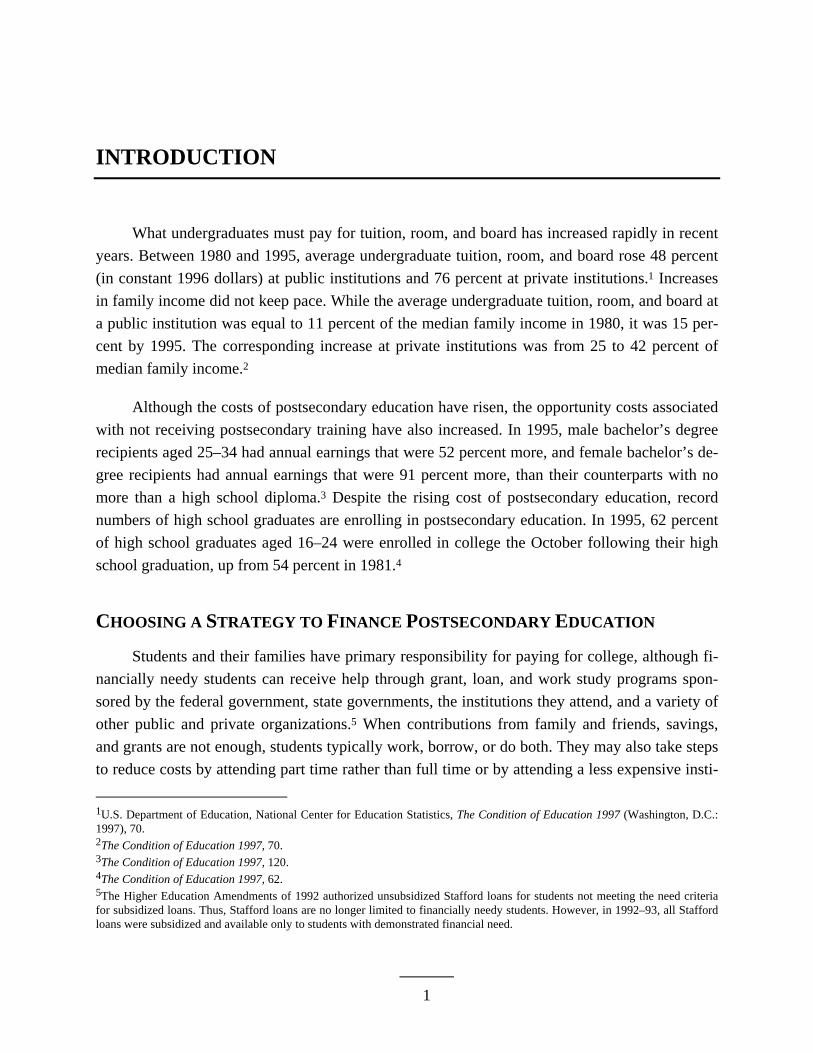
What undergraduates must pay for tuition, room, and board has increased rapidly in recent years. Between 1980 and 1995, average undergraduate tuition, room, and board rose 48 percent (in constant 1996 dollars) at public institutions and 76 percent at private institutions.1 Increases in family income did not keep pace. While the average undergraduate tuition, room, and board at a public institution was equal to 11 percent of the median family income in 1980, it was 15 per-cent by 1995. The corresponding increase at private institutions was from 25 to 42 percent of median family income.2
Although the costs of postsecondary education have risen, the opportunity costs associated with not receiving postsecondary training have also increased. In 1995, male bachelor’s degree recipients aged 25–34 had annual earnings that were 52 percent more, and female bachelor’s de-gree recipients had annual earnings that were 91 percent more, than their counterparts with no more than a high school diploma.3 Despite the rising cost of postsecondary education, record numbers of high school graduates are enrolling in postsecondary education. In 1995, 62 percent of high school graduates aged 16–24 were enrolled in college the October following their high school graduation, up from 54 percent in 1981.4
CHOOSING A STRATEGY TO FINANCE POSTSECONDARY EDUCATION
Students and their families have primary responsibility for paying for college, although fi-nancially needy students can receive help through grant, loan, and work study programs spon-sored by the federal government, state governments, the institutions they attend, and a variety of other public and private organizations.5 When contributions from family and friends, savings, and grants are not enough, students typically work, borrow, or do both. They may also take steps to reduce costs by attending part time rather than full time or by attending a less expensive insti-
1U.S. Department of Education, National Center for Education Statistics, The Condition of Education 1997 (Washington, D.C.: 1997), 70. 2The Condition of Education 1997, 70. 3The Condition of Education 1997, 120. 4The Condition of Education 1997, 62.
5The Higher Education Amendments of 1992 authorized unsubsidized Stafford loans for students not meeting the need criteria for subsidized loans. Thus, Stafford loans are no longer limited to financially needy students. However, in 1992–93, all Stafford loans were subsidized and available only to students with demonstrated financial need.
1

INTRODUCTION
tution. By attending part time, students can reduce the amount of tuition they have to pay and also free up more of their time to work.
While students usually have considerable latitude in selecting a strategy, they face con-straints as well. For instance, some institutions do not permit part-time attendance; class sched-ules may preclude the option of working a large number of hours; suitable jobs may not be available or accessible; loan programs set borrowing limits; and federal financial aid programs have eligibility requirements. Students’ choices of strategies reflect these constraints and also various aspects of their personal circumstances, such as their willingness to borrow, commitment to completing a degree program, confidence in their academic abilities, work and family respon-sibilities, and financial obligations unrelated to the cost of attending.
Since 1970, borrowing, working, and part-time attendance have all increased, in some cases dramatically. For example, while loans made up about 39 percent of federal financial aid (grants, loans, and work study) in 1970–71, they made up 65 percent of federal aid in 1990–91.6 The percentage of college students aged 16–24 working while enrolled increased from 34 per-cent in 1970 to 47 percent in 1995 for full-time students (although it stayed the same for part-time students: 83 percent).7 And, finally, between 1970 and 1994, the part-time fall enrollment in higher education more than doubled, from 2.8 million to 6.1 million, while the number enrolled full time rose 40 percent (5.8 million to 8.1 million).8
Many students use combinations of work, borrowing, and part-time attendance to cover their postsecondary education costs. While the tradeoffs they make may be the best possible fit between their educational goals and their personal and financial circumstances, some choices may be detrimental to their chances for degree attainment. Specifically, evidence suggests that full-time/off-campus work9 and part-time attendance may negatively affect postsecondary persis-tence and attainment.10 In order to assist students in making the best possible choices, it is im-
6L.G. Knapp, Borrowing for College in 1989–90 (Washington, D.C.: The College Board, 1992), 1. 7The Condition of Education 1997, 304–305. 8U.S. Department of Education, Digest of Education Statistics 1996 (Washington, D.C.: 1996), 176. 9A. Astin, Financial Aid and Student Persistence (HERI Research Report. No. 75-2) (Los Angeles: Higher Education Research Institution, 1975); A. Austin, Preventing Students from Dropping Out (San Francisco: Jossey-Bass, 1975); and R. Ehrenberg and D. Sherman, “Employment While in College: Academic Achievement and Post-College Outcomes: A Summary of Results,” Journal of Human Resources 22 (1) (1975): 1–23.
10W. B. Fetters, National Longitudinal Study: Withdrawal From Institutions of Higher Education (Washington, D.C.: U.S. De-partment of Education, National Center for Education Statistics, 1977); A. Astin, Four Critical Years (San Francisco: Jossey-Bass, 1977); R.B. Twedale, The Non-Returning Students: Why They Leave and Will They Return? (Allendale, MI: Grand Valley State Colleges, 1978); C.D. Carroll, College Persistence and Degree Attainment for 1980 High School Graduates: Hazards for Transfers, Stopouts and Part-Timers (Washington, D.C.: U.S. Department of Education, National Center for Education Statistics, 1989); J. Tuma, S. Geis, and C.D. Carroll, High School and Beyond: 1992 Descriptive Summary of 1980 High School Sopho-more’s 12 Years Later (Washington, D.C.: U.S. Government Printing Office, November 1994); and A. McCormick, S. Geis, and
2
INTRODUCTION
portant to understand which, if any, particular strategies/combinations are related to lower per-sistence rates and whether these relationships differ according to the type of institution a student attends.
To address these issues, this analysis examines how students combine work, borrowing, and attendance to finance their postsecondary education. The report begins by describing the dif-ferent working, borrowing, and attendance strategies and how they vary with students’ demo-graphic characteristics and by institutional type. It then examines how these three strategies are used in combination and identifies which strategies are most commonly used at different types of institutions. Finally, it discusses the relationship between these strategies and students’ postsec-ondary outcomes. To measure the independent effects of work, borrowing, and attendance on persistence, a multivariate analysis was conducted to control for covariation.
DATA AND VARIABLE DEFINITIONS
The primary source of data for the analysis was the 1992–93 National Postsecondary Stu-dent Aid Study (NPSAS:93), a nationally representative sample of students enrolled in all types of postsecondary institutions, ranging from less-than-2-year vocational institutions to 4-year col-leges and universities. The NPSAS:93 survey offers comprehensive data on postsecondary fi-nancing, including data reported by institutions, students, and parents.
Data from the 1989–90 Beginning Postsecondary Longitudinal Study Second Follow-up (BPS:90/94) were used to examine whether different postsecondary outcomes were associated with different postsecondary financing strategies. BPS:90/94 is the longitudinal component of the NPSAS:90 survey, and includes students who enrolled in postsecondary education for the first time during the 1989–90 academic year. The BPS cohort was followed up in 1992 and 1994, with the latter follow-up offering a wide range of information regarding the students’ persistence and degree attainment five years after they initially enrolled in postsecondary education.
The data from the two surveys complement each other. The NPSAS:93 data provide infor-mation on a cross-section of students of all ages at various stages of their postsecondary careers, while the BPS:90/94 data focus on a more limited group of students (only those who enrolled for the first time in 1989–90), but provide information over a longer time period.
The analysis focuses on the interrelationship of three variables: work, borrowing, and at-tendance. A composite variable was created that combined students’ status with respect to bor-
R. Vergun, Profile of Part-Time Undergraduates in Postsecondary Education: 1989–90 (Washington, D.C.: U.S. Department of Education, National Center for Education Statistics, 1995).
3
INTRODUCTION
rowing and working. The various combinations of working and borrowing were then examined in conjunction with students’ attendance status.
Work and Borrowing
The composite variable used to classify students according to their work and borrowing status was created for both the NPSAS:93 and the BPS:90/94 populations. First, students were divided into two categories representing their borrowing status: borrowed and did not borrow.11 Then, within each of these categories, students were placed in one of four possible working cate-gories based on the average number of hours they worked per week while enrolled: did not work, worked 1–14 hours, worked 15–33 hours, and worked 34 or more hours.12 Working during the summer, vacation periods, or other times in which the student was not enrolled was not included. Students with missing employment information (19 percent) were given missing values for this variable.
For the NPSAS:93 sample, data for the 1992–93 academic year were used to determine students’ borrowing status and the average number of hours worked while enrolled. For the BPS:90/94 sample, the period used to determine borrowing and working status depended on stu-dents’ degree completion status. For degree completers, the period covered the time between their first enrollment in postsecondary education (1989–90) and their degree attainment. For stu-dents who did not complete a degree, the period ended with their last enrollment. For students who were still enrolled in the spring of 1994, the period extended to spring 1994. Students who completed a degree (an associate’s degree, for example) then transferred were classified only up to their first attainment. While borrowing status has two possible values (borrowed or did not borrow) for both NPSAS:93 and BPS:90/94 students, the period covered for BPS students was longer. The composite variable contains the following eight categories:
Borrowed, did not work while enrolled
Borrowed, worked 1–14 hours/week while enrolled
Borrowed, worked 15–33 hours/week while enrolled
Borrowed, worked 34 or more hours/week while enrolled
Did not borrow, did not work while enrolled
Did not borrow, worked 1–14 hours/week while enrolled
Did not borrow, worked 15–33 hours/week while enrolled
11Borrowing includes loans from federal, state, or institutional sources.
12Work includes jobs for pay, including work-study.
4
INTRODUCTION
Did not borrow, worked 34 or more hours/week while enrolled
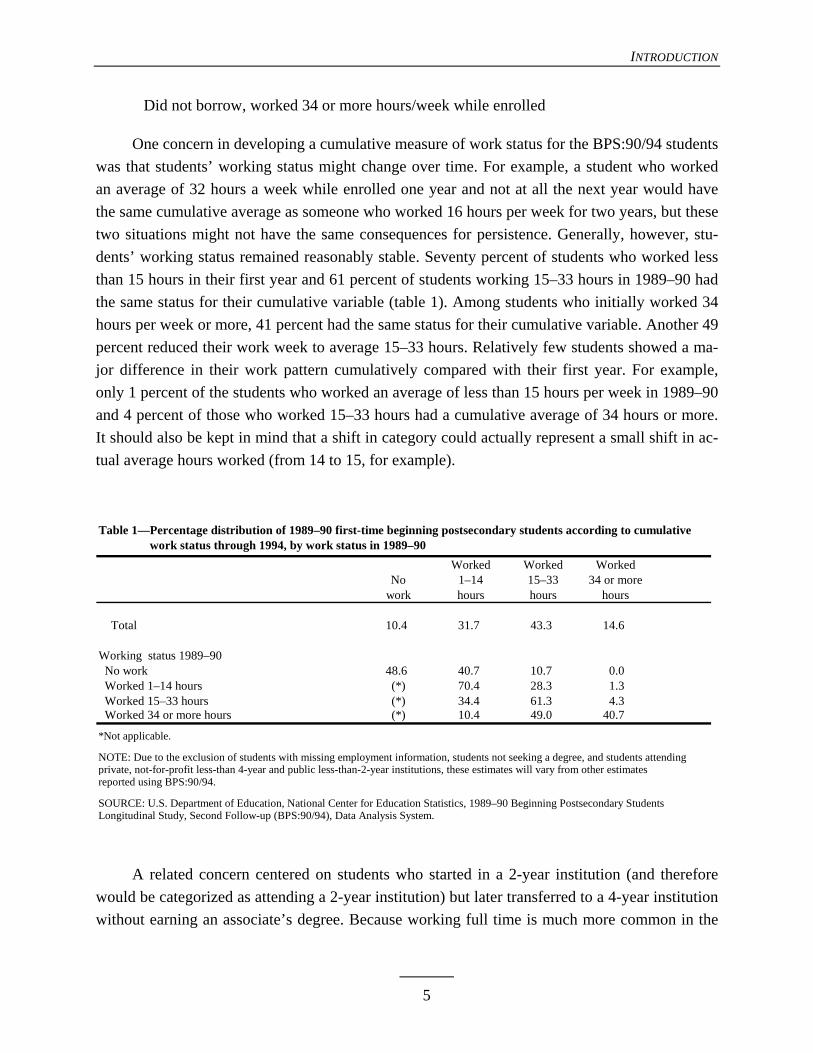
One concern in developing a cumulative measure of work status for the BPS:90/94 students was that students’ working status might change over time. For example, a student who worked an average of 32 hours a week while enrolled one year and not at all the next year would have the same cumulative average as someone who worked 16 hours per week for two years, but these two situations might not have the same consequences for persistence. Generally, however, stu-dents’ working status remained reasonably stable. Seventy percent of students who worked less than 15 hours in their first year and 61 percent of students working 15–33 hours in 1989–90 had the same status for their cumulative variable (table 1). Among students who initially worked 34 hours per week or more, 41 percent had the same status for their cumulative variable. Another 49 percent reduced their work week to average 15–33 hours. Relatively few students showed a ma-jor difference in their work pattern cumulatively compared with their first year. For example, only 1 percent of the students who worked an average of less than 15 hours per week in 1989–90 and 4 percent of those who worked 15–33 hours had a cumulative average of 34 hours or more. It should also be kept in mind that a shift in category could actually represent a small shift in ac-tual average hours worked (from 14 to 15, for example).
Table 1—Percentage distribution of 1989–90 first-time beginning postsecondary students according to cumulative Table 1—work status through 1994, by work status in 1989–90 Worked Worked Worked No 1–14 15–33 34 or more work hours hours hours Total 10.4 31.7 43.3 14.6
Working status 1989–90 No work 48.6 40.7 10.7 0.0 Worked 1–14 hours (*) 70.4 28.3 1.3 Worked 15–33 hours (*) 34.4 61.3 4.3 Worked 34 or more hours (*) 10.4 49.0 40.7
*Not applicable.
NOTE: Due to the exclusion of students with missing employment information, students not seeking a degree, and students attendingprivate, not-for-profit less-than 4-year and public less-than-2-year institutions, these estimates will vary from other estimatesreported using BPS:90/94.
SOURCE: U.S. Department of Education, National Center for Education Statistics, 1989–90 Beginning Postsecondary StudentsLongitudinal Study, Second Follow-up (BPS:90/94), Data Analysis System.
A related concern centered on students who started in a 2-year institution (and therefore would be categorized as attending a 2-year institution) but later transferred to a 4-year institution without earning an associate’s degree. Because working full time is much more common in the 5

INTRODUCTION
2-year than in the 4-year sector (47 percent versus 27 percent),13 such students might have worked a large number of hours while at the 2-year institution and a substantially reduced num-ber at the 4-year institution. Students in this situation would have fewer cumulative average hours worked than the typical 2-year student. Among the BPS students, 3 out of 10 who began their education in public 2-year institutions ever transferred, and of those who transferred, 24 percent completed a degree before doing so, which means that their measure of cumulative aver-age hours worked would be based only on their experience while enrolled at the 2-year institu-tion.14
Attendance Status
Attendance status measures the intensity of students’ enrollment while they were en-rolled.15 Students were classified as either exclusively full time, exclusively part time, or mixed. The measure was based upon the percentage of enrolled months the student attended full time (based on their institutions’ definition of full time). Students with no months’ full time were clas-sified as exclusively part time, those with any months’ full time up to 99 percent were classified as having mixed attendance, and those with 100 percent of months full time were classified as exclusively full time.
Persistence
BPS:90/94 data were used to examine whether postsecondary financing strategies were as-sociated with persistence. Students who began postsecondary education for the first time in 1989–90 were considered to have persisted if they attained a degree or were still enrolled in postsecondary education in spring 1994, five years after their initial enrollment. Because 57 per-cent of 1992–93 bachelor’s degree recipients took more than four years to attain their degree,16 still being enrolled in 1994 was considered persisting.
13L.J. Horn and M.D. Premo, Profile of Undergraduates in U.S. Postsecondary Institutions (Washington, D.C.: U.S. Department of Education, National Center for Education Statistics, 1996). 14U.S. Department of Education, National Center for Education Statistics, 1989–90 Beginning Postsecondary Students Longitu-dinal Study, Second Follow-up (BPS:90/94), Data Analysis System. 15Intensity does not indicate the duration of enrollment; students could be defined as exclusively full-time even if they were enrolled for only 2 months during the academic year.
16A. McCormick and L. Horn, A Descriptive Summary of 1992–93 Bachelor’s Degree Recipients 1 Year Later: With An Essay on Time to Degree (Washington, D.C.: U.S. Department of Education, National Center for Education Statistics, 1996).
6

INTRODUCTION
Institution Type
Students were categorized according to the first type of institution attended. The analysis looked separately at students in the following types of institutions: public 2-year; public 4-year; private, not-for-profit 4-year; and private, for-profit. It excluded students enrolled in public less-than-2-year institutions and private, not-for-profit less-than-4-year institutions, because these groups were too small for analysis. Also excluded were students not seeking a degree or certifi-cate, because persistence is not relevant for this group.
In total, about 26 percent of the NPSAS:93 and 14 percent of the BPS:90/94 students were excluded because they were missing employment information, were not seeking a degree, or at-tended one of the excluded types of institutions. Table B2 compares the characteristics of the in-cluded and excluded students.
7
THIS PAGE INTENTIONALLY LEFT BLANK

WORK, BORROWING, AND ATTENDANCE PATTERNS
Students make decisions about work, borrowing, and attendance status that reflect their as-pirations, preferences, financial situations, and personal circumstances. Those with sufficient fi-nancial resources may be able simply to choose their attendance status and not have to borrow or work (although some may choose to work for nonfinancial reasons). Students with more limited financial resources may decide to attend full time and then use work, borrowing, or a combina-tion of both to help finance their education. If students in this group cannot survive financially with work and borrowing, they may switch to part-time attendance. Still other students may de-cide to work full time, attend part time, and minimize or avoid borrowing. This last group is a varied one and will include, among others, students established in a career who want additional education while holding onto their jobs; older students with family responsibilities who may not have the time, interest, or financial resources to attend full time; students not sure about their commitment to postsecondary education or their academic qualifications who want the security of a job when they first enroll; and students who want to avoid debt.
This section first examines who works, who borrows, and who attends full and part time, and then looks at how work, borrowing, and attendance status are used in combination. It is im-portant to keep in mind that while students can trade off among work, borrowing, and attendance pattern to a certain extent, there are constraints associated with each approach. These constraints are discussed as well.
WORK
The majority of undergraduates work while enrolled, not just during the summer or vaca-tion breaks. In 1992–93, nearly three-quarters (72 percent) of undergraduates in this analysis worked while enrolled, and they worked intensively—an average of 31 hours per week and 88 percent of the months they were enrolled (table 2). Most students (91 percent) worked off cam-pus in their principal job (the one they worked at the longest). This practice, as indicated earlier, may be detrimental to persistence.
9
WORK, BORROWING, AND ATTENDANCE PATTERNS
Table 2—Percentage of undergraduates who worked while enrolled and, for those who worked, selected Table 2—employment characteristics, by selected student and institutional characteristics: 1992–93
Percent Worked months Job location while Average working On Off enrolled hours while enrolled campus campus
Total 72.3 30.5 88.3 8.6 91.4
Type of institution Public 2-year 78.7 33.8 91.0 3.4 96.6 Public 4-year 68.6 26.3 85.3 13.1 86.9 Private, not-for-profit 4-year 67.4 26.6 86.7 17.8 82.2 Private, for-profit 56.5 31.8 84.0 2.4 97.6
Gender Male 74.0 31.7 88.0 8.3 91.7 Female 71.0 29.4 88.7 8.9 91.1
Age as of 12/31/92 Less than 24 69.7 25.1 83.7 11.3 88.7 24–29 78.7 35.3 92.2 5.1 94.9 30 or older 73.9 37.7 94.3 5.3 94.7
Race–ethnicity White, non-Hispanic 73.9 30.5 88.4 8.3 91.7 Black, non-Hispanic 67.1 31.2 88.0 9.3 90.7 Hispanic 72.8 31.6 88.8 7.7 92.3 Asian/Pacific Islander 58.8 24.7 86.0 16.4 83.6 American Indian/Alaskan Native 70.8 32.6 91.4 7.4 92.6
Marital status Not married 71.5 27.8 86.1 10.2 89.8 Married 75.2 37.1 93.9 4.5 95.5 Separated 62.8 32.8 88.7 6.7 93.3
Local residence On campus 51.1 17.5 75.3 23.6 76.4 Off campus 74.1 33.9 90.7 7.5 92.5 With parents or relatives 78.9 27.9 87.8 4.2 95.8
Dependency status for financial aid Dependent 69.9 24.4 83.5 11.7 88.3 Single independent 78.3 34.5 91.1 6.8 93.3 Independent with dependents 72.7 36.8 93.4 4.9 95.1
10

WORK, BORROWING, AND ATTENDANCE PATTERNS
Table 2—Percentage of undergraduates who worked while enrolled and, for those who worked, selected Table 2—employment characteristics, by selected student and institutional characteristics: 1992–93—Continued
Percent Worked months Job location while Average working On Off enrolled hours while enrolled campus campus
Income quartile, dependents Lower quartile 71.1 25.1 83.5 12.6 87.4 Middle quartiles 73.6 25.1 84.7 10.9 89.1 Upper quartile 61.9 22.1 80.9 12.6 87.4
Income quartile, independents Lower quartile 61.2 26.9 85.3 10.2 89.8 Middle quartiles 77.6 36.8 93.1 5.0 95.0 Upper quartile 79.1 39.5 95.3 3.6 96.4
NOTE: Due to the exclusion of students with missing employment information, students not seeking a degree, and students attendingprivate, not-for-profit less-than 4-year and public less-than-2-year institutions, these estimates will vary from other estimates reportedusing NPSAS:93.
SOURCE: U.S. Department of Education, National Center for Education Statistics, 1992–93 National Postsecondary Student Aid Study (NPSAS:93), Data Analysis System.
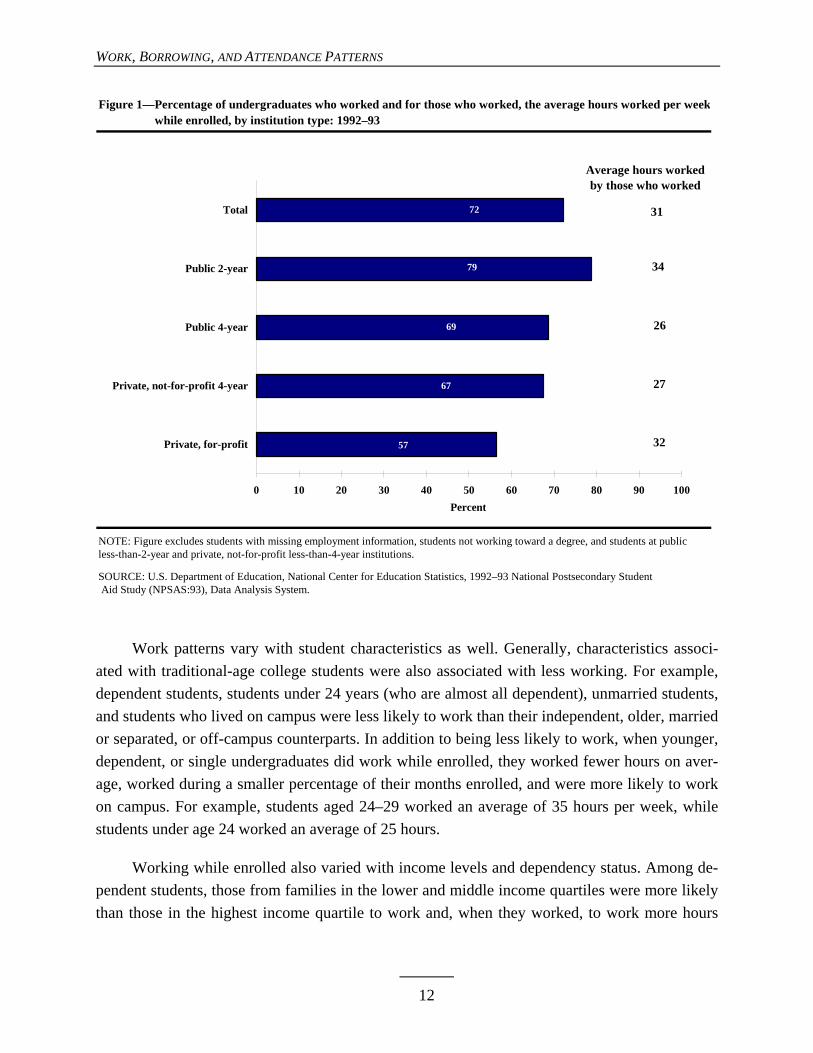
Undergraduates’ work patterns varied according to type of institution (figure 1). Compared with students at other types of institutions, those enrolled in 2-year public institutions were the most likely to work, worked the most hours, and worked over the greatest percentage of their enrollment. Seventy-nine percent of students at public 2-year institutions worked while enrolled, and they worked an average of 34 hours per week for 91 percent of the months they were en-rolled (table 2). Students at public 4-year institutions had a work pattern similar to that of stu-dents at 4-year private, not-for-profit institutions, with about two-thirds working while enrolled, and working an average of about 26–27 hours per week for about 85–87 percent of their months enrolled.
The differences in the work patterns students exhibit reflect, at least in part, the feasibility of combining work and enrollment at the institutions they attend. Some 4-year institutions re-quire full-time attendance or schedule most of their classes during the day, which makes working a large number of hours difficult. Public 2-year institutions, in contrast, typically offer evening classes and flexible programs, which make it much easier for students to work full time while attending. Least likely to work while enrolled were students attending private, for-profit institu-tions (57 percent worked), where the short-term, intensive nature of most programs leaves little time for work.
11
WORK, BORROWING, AND ATTENDANCE PATTERNS
Figure 1—Percentage of undergraduates who worked and for those who worked, the average hours worked per weekFigure 1—while enrolled, by institution type: 1992–93
NOTE: Figure excludes students with missing employment information, students not working toward a degree, and students at publicless-than-2-year and private, not-for-profit less-than-4-year institutions.
SOURCE: U.S. Department of Education, National Center for Education Statistics, 1992–93 National Postsecondary Student Aid Study (NPSAS:93), Data Analysis System.
72
79
69
67
57
0 10 20 30 40 50 60 70 80 90 100
Private, for-profit
Private, not-for-profit 4-year
Public 4-year
Public 2-year
Total 31
34
26
27
32
Average hours worked by those who worked
Percent
Work patterns vary with student characteristics as well. Generally, characteristics associ-ated with traditional-age college students were also associated with less working. For example, dependent students, students under 24 years (who are almost all dependent), unmarried students, and students who lived on campus were less likely to work than their independent, older, married or separated, or off-campus counterparts. In addition to being less likely to work, when younger, dependent, or single undergraduates did work while enrolled, they worked fewer hours on aver-age, worked during a smaller percentage of their months enrolled, and were more likely to work on campus. For example, students aged 24–29 worked an average of 35 hours per week, while students under age 24 worked an average of 25 hours.
Working while enrolled also varied with income levels and dependency status. Among de-pendent students, those from families in the lower and middle income quartiles were more likely than those in the highest income quartile to work and, when they worked, to work more hours
12
WORK, BORROWING, AND ATTENDANCE PATTERNS
per week on average. Among independent students, the reverse was true. Those in the lowest in-come quartile were less likely than those in the middle and higher income quartiles to work and, when they worked, to work fewer hours per week on average. A major reason for the difference between dependent and independent students is that dependent student income refers to the stu-dent’s parents’ income, while independent student income refers to the student’s own income. Thus, independent students who are in the lower income quartile are there at least in part because they do not work as much as students in the higher income quartiles.
Work patterns vary with both institutional and student characteristics, and these two sets of characteristics are themselves interrelated. That is, students with characteristics associated with working less are more likely than other students to attend the types of institutions associated with less work. For example, younger students and students at 4-year institutions are less likely to work than older students and students at 2-year public institutions. However, younger students are also more likely than older students to attend 4-year institutions.17
BORROWING
Borrowing has become an increasingly common way for students to help pay for their un-dergraduate education. However, it was not an option for all students in 1992–93. To participate in federal loan programs in 1992–93, students had to be U.S. citizens or eligible noncitizens (such as permanent residents), academically qualified, enrolled in an eligible program at least half time, and making satisfactory academic progress.18 They also had to have financial need, meaning that cost of attending the institution they selected was greater than their expected family contribution (which is based primarily on income). While students had some choice between borrowing and work, the maximum they could borrow under the Stafford loan program in 1992–93 was $2,625 per year in their first two years and $4,000 in their third year or later, and a total of $17,250 for their undergraduate study.19
Even if eligible to participate in a student loan program, students do not always borrow. Their decisions are based on factors such as the standard of living they want to maintain, how much debt they are willing to assume, alternative sources of funds available to them, and other
17Horn and Premo, Profile of Undergraduates in U.S. Postsecondary Institutions, 59. 18Many institutions and some states have their own loan programs with their own eligibility criteria, but most student borrowing takes place through federal loan programs. The major federal loan programs for undergraduates in 1992–93 were the Stafford, Supplemental Loans for Students (SLS), and Parent Loans for Undergraduate Students (PLUS) programs.
19Office of Student Financial Assistance, The Federal Student Financial Aid Handbook, 1992–93 (Washington, D.C., U.S. De-partment of Education, 1992). As a result of the Higher Education Amendments of 1992, borrowing limits have increased sub-stantially and unsubsidized Stafford loans have been introduced for students not meeting the need criteria for subsidized student loans.
13
WORK, BORROWING, AND ATTENDANCE PATTERNS
aspects of their financial circumstances. Students’ decisions also depend on how much they can and want to work given job demands, time availability, and their programs and class schedules.
Eighteen percent of the undergraduates included in this study borrowed to help pay for their postsecondary education in 1992–93, borrowing an average of $3,300 (figure 2 and table 3). Both the percentage who borrowed and the average amount borrowed varied according to the type of institution attended (which is closely related to cost of attending) and family income.
Private, not-for-profit 4-year institutions and private, for-profit institutions typically have higher tuition and fees than public 4-year and public 2-year institutions.20 This difference in costs may explain why students at the former types of institutions were more likely than those at the latter to borrow (34 and 42 percent versus 23 and 5 percent), and to borrow more, on average ($3,800 and $3,600 versus $3,000 and $2,500). Among students attending public institutions, those attending 4-year institutions were more likely than those in 2-year institutions to borrow (23 versus 5 percent), and to borrow more, on average ($3,000 versus $2,500). The lower rate of borrowing at 2-year institutions reflects their lower cost, but also reflects their large population of less-than-half-time students (38 percent)21 which makes them ineligible for federal loan pro-grams.
Reflecting differences in financial need, the percentage who borrowed as well as the aver-age amount borrowed varied with family income. As family income increased from the lowest to the highest quartile, the percentage who borrowed decreased (32 percent to 8 percent).
Borrowing varies with student demographic characteristics as well, but by law, gender, age, and race–ethnicity are not considered in the award of federal aid. Thus, for the most part, variation in borrowing reflects differences in characteristics that are related to the regulations for awarding financial aid, which are primarily income, dependency status, attendance status, and cost of attending (which, in turn, is related to institution type). Some part of the differences may, however, reflect variation in willingness to borrow or work or parents’ willingness to contribute financially to their children’s education.
20As reported in J. Tuma and S. Geis, Student Financing of Undergraduate Education, 1992–93 (Washington, D.C., U.S. De-partment of Education, National Center for Education Statistics, 1995), the total annual costs (sum of tuition and nontuition costs) for full-time, full-year students at public 4-year institutions were $11,115; at private, not-for-profit 4-year institutions, $19,549; at public 2-year institutions, $9,437; and at private, for-profit institutions, $15,021.
21U.S. Department of Education, National Center for Education Statistics, 1992–93 National Postsecondary Student Aid Study (NPSAS:93), Data Analysis System.
14

WORK, BORROWING, AND ATTENDANCE PATTERNS
Figure 2—Percentage of undergraduates who borrowed to finance their postsecondary education and for those whoFigure 3—borrowed, the average amount borrowed, by institution type: 1992–93
NOTE: Figure excludes students with missing employment information, students not working toward a degree, and students at public less-than-2-year and private, not-for-profit less-than-4-year institutions.
SOURCE: U.S. Department of Education, National Center for Education Statistics, 1992–93 National Postsecondary Student Aid Study (NPSAS:93), Data Analysis System.
42
34
23
5
18
0 5 10 15 20 25 30 35 40 45 50
Private, for-profit
Private, not-for-profit 4-year
Public 4-year
Public 2-year
Total
$3,800
$2,500
$3,600
$3,000
$3,300
5
18
Percent
Average amount borrowed by borrowers
ATTENDANCE PATTERNS
Postsecondary institutions offer students a range of possibilities for full- and part-time at-tendance, although not all institutions offer all options. For example, some 4-year colleges and universities do not offer a part-time alternative, while most 2-year institutions do. Private, for-profit institutions frequently have short-term, intensive programs that require full-time atten-dance. Also, students at 4-year private, not-for-profit institutions have a strong incentive to finish a bachelor’s degree in four years because of the relatively high tuition at this type of institution. Usually students can finish in four years only if they attend full-time throughout most of their time enrolled.
In 1992–93, 41 percent of undergraduates enrolled exclusively full time; 43 percent en-rolled exclusively part time; and 16 percent had mixed enrollment—that is, they enrolled full time for part of the year and part time for part of the year (figure 3 and table 4). The types of in-stitutions students attended and their attendance patterns were related. Students attending
15

Tab
le 3
—P
erce
ntag
e of
und
ergr
adua
tes
who
bor
row
ed*
and
for
thos
e w
ho b
orro
wed
, the
ave
rage
am
ount
bor
row
ed a
ccor
ding
to
the
type
of
inst
itut
ion,
by
Tab
le 3
—se
lect
ed d
emog
raph
ic a
nd in
stit
utio
nal c
hara
cter
isti
cs:
1992
–93
Tot
alPu
blic
2-y
ear
Pub
lic
4-ye
arP
riva
te, n
ot-f
or-p
rofi
t 4-y
ear
Pri
vate
, for
-pro
fit
Ave
rage
A
vera
ge
Ave
rage
A
vera
ge
Ave
rage
Perc
ent
amou
ntPe
rcen
tam
ount
Perc
ent
amou
ntPe
rcen
tam
ount
Perc
ent
amou
nt
T
otal
17
.7
$3
,274
5.4
$2,5
3122
.9
$3
,042
34.4
$3,7
9442
.4$3
,634
Gen
der
Mal
e
16
.9
3,
396
4.4
2,53
422
.1
3,
083
34.4
3,89
143
.64,
137
Fem
ale
18
.4
3,
182
6.1
2,52
923
.6
3,
007
34.3
3,71
841
.63,
323
Age
as
of 1
2/31
/92
Les
s th
an 2
4
21.4
3,06
85.
9
2,
286
23.8
2,83
240
.43,
562
48.5
3,29
1 2
4–29
16
.9
3,
731
5.3
2,52
426
.6
3,
614
30.3
4,79
141
.24,
024
30
or o
lder
10.7
3,68
24.
8
2,
905
15.9
3,55
819
.34,
406
33.5
4,08
6
Rac
e–et
hnic
ity W
hite
, non
-His
pani
c
17.2
3,34
15.
5
2,
613
22.0
3,09
232
.63,
874
46.8
3,83
0 B
lack
, non
-His
pani
c
25.2
3,00
36.
1
2,
345
33.7
2,84
050
.23,
453
36.7
2,99
8 H
ispa
nic
15
.3
3,
133
3.4
—22
.4
2,
881
36.8
3,53
237
.63,
572
Asi
an/P
acif
ic I
slan
der
14.9
3,32
95.
8
—
16.9
2,95
027
.14,
183
33.7
3,67
0 A
mer
ican
Ind
ian/
Ala
skan
Nat
ive
17.1
3,23
08.
3
—
25.4
3,41
639
.3—
34.3
—
Mar
ital s
tatu
s N
ot m
arri
ed
20
.0
3,
203
5.5
2,43
024
.1
2,
965
38.2
3,68
144
.23,
563
Mar
ried
11
.6
3,
634
5.0
2,79
517
.4
3,
518
19.9
4,56
837
.73,
969
Sep
arat
ed
19.0
2,92
67.
5
—
24.2
3,40
836
.44,
324
46.2
2,79
0
Loc
al r
esid
ence
On
cam
pus
36.6
3,12
717
.1
2,
461
31.6
2,70
145
.83,
513
71.5
3,99
7 O
ff c
ampu
s
16
.2
3,
491
5.8
2,73
923
.1
3,
328
26.5
4,33
641
.03,
774
With
par
ents
or
rela
tives
11.9
2,90
23.
8
2,
008
14.2
2,60
630
.93,
476
42.4
3,34
1

Tab
le 3
—P
erce
ntag
e of
und
ergr
adua
tes
who
bor
row
ed*
and
for
thos
e w
ho b
orro
wed
, the
ave
rage
am
ount
bor
row
ed a
ccor
ding
to
the
type
of
inst
itut
ion,
by
Tab
le 3
—se
lect
ed d
emog
raph
ic a
nd in
stit
utio
nal c
hara
cter
isti
cs:
1992
–93—
Con
tinu
ed
Tot
alPu
blic
2-y
ear
Pub
lic
4-ye
arP
riva
te, n
ot-f
or-p
rofi
t 4-y
ear
Pri
vate
, for
-pro
fit
Ave
rage
A
vera
ge
Ave
rage
A
vera
ge
Ave
rage
Perc
ent
amou
ntPe
rcen
tam
ount
Perc
ent
amou
ntPe
rcen
tam
ount
Perc
ent
amou
nt
Dep
ende
ncy
stat
us f
or f
inan
cial
aid
Dep
ende
nt
19.8
3,02
75.
0
2,
303
21.8
2,75
839
.73,
495
43.0
3,26
7 S
ingl
e in
depe
nden
t
19.1
3,68
34.
8
2,
373
29.8
3,45
331
.74,
605
48.9
4,16
2 I
ndep
ende
nt w
ith d
epen
dent
s13
.9
3,
503
6.0
2,75
620
.7
3,
496
22.7
4,44
539
.03,
600
Inco
me
quar
tiles
Low
er q
uart
ile
32
.4
$3
,125
11.2
$2,4
4042
.4
$3
,061
57.0
$3,6
5352
.0$3
,178
Mid
dle
quar
tile
s
16
.8
3,
297
4.9
2,60
122
.1
2,
995
40.7
3,79
140
.03,
888
Upp
er q
uart
ile
8.
3
3,
628
2.2
2,54
28.
1
3,
194
17.6
4,01
429
.54,
303
— T
oo f
ew c
ases
for
a r
elia
ble
esti
mat
e.*B
orro
win
g in
clud
es lo
ans
from
fed
eral
, sta
te, a
nd in
stit
utio
nal s
ourc
es in
199
2–93
.
NO
TE
: Due
to th
e ex
clus
ion
of s
tude
nts
wit
h m
issi
ng e
mpl
oym
ent i
nfor
mat
ion,
stu
dent
s no
t see
king
a d
egre
e, a
nd s
tude
nts
atte
ndin
g pr
ivat
e, n
ot-f
or-p
rofi
t les
s-th
an 4
-yea
r an
d pu
blic
less
-tha
n-2-
year
inst
itut
ions
, the
se e
stim
ates
wil
l var
y fr
om o
ther
est
imat
es r
epor
ted
usin
g N
PSA
S:93
.
SOU
RC
E: U
.S. D
epar
tmen
t of
Edu
cati
on, N
atio
nal C
ente
r fo
r E
duca
tion
Sta
tist
ics,
199
2–93
Nat
iona
l Pos
tsec
onda
ry S
tude
nt A
id S
tudy
(N
PSA
S:93
), D
ata
Ana
lysi
s Sy
stem
.

WORK, BORROWING, AND ATTENDANCE PATTERNS
Table 4—Percentage distribution of undergraduates according to attendance status* by selected demographic Table 4—and institutional characteristics: 1992–93 Exclusively Exclusively full-time Mixed part-time Total 41.1 15.9 43.0
Type of institution Public 2-year 20.3 14.7 65.0 Public 4-year 55.7 20.5 23.8 Private, not-for-profit 4-year 60.7 13.3 26.0 Private, for-profit 72.3 7.4 20.3
Gender Male 43.8 16.3 39.9 Female 38.9 15.6 45.6
Age as of 12/31/92 Less than 24 56.9 19.2 23.9 24–29 26.9 15.2 57.9 30 or older 17.6 9.7 72.7
Race–ethnicity White, non-Hispanic 41.2 15.9 42.9 Black, non-Hispanic 43.4 13.4 43.2 Hispanic 35.9 16.4 47.7 Asian/Pacific Islander 42.8 21.5 35.7 American Indian/Alaskan Native 42.5 13.8 43.7
Marital status Not married 49.4 17.7 32.9 Married 19.5 11.1 69.4 Separated 35.6 15.2 49.2
Local residence On campus 79.8 13.4 6.8 Off campus 31.7 14.4 53.9 With parents or relatives 41.6 20.0 38.4
Dependency status for financial aid Dependent 57.9 19.2 22.9 Single independent 29.6 15.2 55.2 Independent with dependents 22.3 11.5 66.2 Income quartiles Lower quartile 51.7 19.0 29.3 Middle quartiles 38.7 16.0 45.3 Upper quartile 37.5 13.4 49.1
*Attendance status is defined in terms of the percentage of months enrolled in 1992–93 that were full time. Students with zero monthsfull time are categorized as exclusively part-time. Students with 1–99 percent of their months full time are categorized as mixed, and students with 100 percent of their months full time are categorized as exclusively full-time.
NOTE: Due to the exclusion of students with missing employment information, students not seeking a degree, and students attendingprivate, not-for-profit less-than 4-year and public less-than-2-year institutions, these estimates will vary from other estimates reportedusing NPSAS:93.
SOURCE: U.S. Department of Education, National Center for Education Statistics, 1992–93 National Postsecondary Student Aid Study (NPSAS:93), Data Analysis System.
18
WORK, BORROWING, AND ATTENDANCE PATTERNS
Figure 3—Percentage distribution of undergraduates according to attendance status, by institution type: 1992–93
NOTE: Figure excludes students with missing employment information, students not working toward a degree, and students at public less-than-2-year and private, not-for-profit less-than-4-year institutions.
SOURCE: U.S. Department of Education, National Center for Education Statistics, 1992–93 National Postsecondary Student Aid Study(NPSAS:93), Data Analysis System.
20
56 6172
15
21 137
65
24 26 20
41
16
43
Total Public2-year
Public4-year
Private,not-for-profit 4-
year
Private,for-
profit
Exclusively full-time Mixed Exclusively part-timePercent
100
80
60
40
20
0Public 2-year Private, not-for-
profit 4-yearPrivate,
for-profit
public 2-year institutions were the most likely to attend exclusively part time (65 percent versus 20 to 26 percent of students in other types of institutions), and the least likely to attend exclu-sively full time (20 percent versus 56 to 72 percent) (table 4). Students in private, for-profit insti-tutions were the most likely to attend exclusively full time (72 versus 20 to 61 percent of students in other types of institutions). Students attending public 4-year institutions were more likely than those in all other types of institutions to have mixed attendance patterns (21 percent versus 15 percent or less).
Attendance patterns also varied according to students’ demographic characteristics. Exclu-sively part-time attendance was most common among students with demographic characteristics similar to the student population at public 2-year institutions: students who were over age 24, independent (with or without dependents), married or separated, or lived off campus or with their parents were more likely than their counterparts who were younger, dependent, unmarried, or living on campus to attend exclusively part time.
19

WORK, BORROWING, AND ATTENDANCE PATTERNS
Compared with males, female undergraduates were more likely to attend exclusively part time (46 versus 40 percent), and less likely to attend full time (39 versus 44 percent). These gen-der differences may be at least partly related to age, since female students are more likely to be older.22 As age increased, the likelihood of attending exclusively part time increased from 24 percent for students less than 24 years old to 73 percent for those 30 years or older.
In addition to the intensity of enrollment, the duration of enrollment may be a component of students’ postsecondary strategies. That is, some students may choose to attend for only part of the academic year in order to save money or to work. Students who attended less than 8 months are considered part-year students, while those who attended 8 or more months are con-sidered full year. Nearly three-quarters (71 percent) of students who attended exclusively full time attended for the full year (table 5). (Exclusively full-time students who attended less than 8 months would include full-time students who were in short-term programs as well as students who did not enroll each term.) In contrast, exclusively part-time students were considerably less likely than students with mixed or exclusively full-time attendance to attend for the full aca-demic year.
Table 5—Percentage distribution of undergraduates according to number of months enrolled in 1992–93,Table 5—by attendance status* in 1992–93 Less than 8 months 8 or more months
Total 40.3 59.7
Attendance status Exclusively part-time 60.2 39.8 Mixed 13.9 86.1 Exclusively full-time 29.0 71.0
*Attendance status is defined in terms of the percentage of months enrolled in 1992–93 that were full time. Students with zero monthsfull time are categorized as exclusively part-time. Students with 1–99 percent of their months full time are categorized as mixed, and students with 100 percent of their months full time are categorized as exclusively full-time.
NOTE: Due to the exclusion of students with missing employment information, students not seeking a degree, and students attendingprivate, not-for-profit less-than 4-year and public less-than-2-year institutions, these estimates will vary from other estimates reportedusing NPSAS:93.
SOURCE: U.S. Department of Education, National Center for Education Statistics, 1992–93 National Postsecondary StudentAid Study (NPSAS:93), Data Analysis System.
SUMMARY BY INSTITUTION TYPE
Students in different types of institutions work, borrow, and attend differently. As sug-gested above, this variation reflects differences in institutions’ program offerings and in the char-
22Horn and Premo, Profile of Undergraduates in U.S. Postsecondary Institutions. Thirty-two percent of female undergraduates were age 30 or older compared to 23 percent of male undergraduates.
20
WORK, BORROWING, AND ATTENDANCE PATTERNS
acteristics and needs of their student populations, which are interrelated. In 1992–93, among stu-dents at public 2-year institutions, 79 percent worked while enrolled (table 2); almost half (46 percent) worked 34 or more hours per week; 65 percent attended exclusively part-time; and 5 percent borrowed (table 6). In 4-year institutions, about 67–69 percent worked while enrolled (table 2), with 21 to 26 percent working 34 or more hours per week (table 6). The majority at-tended exclusively full time (56 percent in public institutions and 61 percent in private, not-for-profit institutions). Borrowing was more common in private, not-for-profit 4-year institutions than in public ones (34 percent compared with 23 percent), but in both types of 4-year institu-tions borrowing was much more common than in public 2-year institutions. Among students at private, for-profit institutions, 44 percent did not work while enrolled, 72 percent attended exclu-sively full time, and 42 percent borrowed.
RELATIONSHIP BETWEEN WORK, BORROWING, AND ATTENDANCE
While the previous section described patterns of work, borrowing, and attendance sepa-rately, this section examines how students combine the three and how the patterns differ across types of institutions. The focus of the discussion is on patterns that were associated with in-creased full-time attendance, since full-time attendance has been shown to be associated with increased persistence and attainment.
First, among students who work, there is a negative association between hours worked per week while enrolled and full-time attendance. The more students work, the less likely they are to attend full time. However, controlling for hours worked, borrowing was associated with a larger percentage attending full time.
Among both borrowers and nonborrowers who worked, as the number of hours they worked increased, the less likely they were to enroll exclusively full time (figure 4 and table 7).23 However, within each category of hours worked while enrolled (including those who did not work at all), students who borrowed were more likely than those who did not borrow to attend exclusively full time. The difference was particularly large among students who worked 34 or more hours per week: 52 percent of those who borrowed attended exclusively full time compared with 14 percent of those who did not borrow.
Table 7 also shows the work, borrowing, and attendance patterns by type of institution. For students at both public and private, not-for-profit 4-year institutions, there was an association
23Those who did not work at all are not included in this trend.
21

Tab
le 6
—P
erce
ntag
e di
stri
buti
on o
f u
nder
grad
uate
s ac
cord
ing
to w
ork,
bor
row
ing,
att
enda
nce
stat
us, a
nd in
stit
utio
n ty
pe, b
y w
ork,
bor
row
ing,
att
enda
nce
Tab
le 6
—st
atus
, and
inst
itut
ion
type
: 199
2–93
Ave
rage
hou
rs w
orki
ng w
hile
enr
olle
dA
ttend
ance
sta
tus1
Bor
row
ing
stat
us2
Typ
e of
inst
itutio
n W
orke
dPr
ivat
e,
Wor
ked
Wor
ked
34 o
rE
xclu
-
Exc
lu-
Did
no
t-fo
r-
Not
1–14
15–3
3m
ore
sive
lysi
vely
not
Pu
blic
Publ
icpr
ofit
Priv
ate,
wor
king
hour
sho
urs
hour
spa
rt-t
ime
Mix
edfu
ll-tim
ebo
rrow
Bor
row
ed2-
year
4-ye
ar4-
year
for-
prof
it
T
otal
27
.7
8.
9
29.8
33.6
43.0
15.9
41.1
82.3
17.7
46.4
32.6
14.4
6.6
Ave
rage
hou
rs w
orki
ng w
hile
e
nrol
led
Not
wor
king
100.
0
0.0
0.
0
0.0
27
.8
16
.5
55
.8
79
.2
20
.9
35
.7
37
.0
17
.0
10
.4
W
orke
d 1–
14 h
ours
0.0
10
0.0
0.
0
0.0
20
.9
15
.5
63
.6
70
.6
29
.4
30
.2
39
.9
26
.9
3.
0
Wor
ked
15–3
3 ho
urs
0.0
0.
0
100.
0
0.0
29
.6
22
.3
48
.1
78
.1
21
.9
42
.7
39
.9
12
.2
5.
3
Wor
ked
34 o
r m
ore
hour
s0.
0
0.0
0.
0
100.
0
73.3
9.9
16
.8
91
.7
8.
3
62.8
20.7
10.9
5.6
Atte
ndan
ce s
tatu
s E
xclu
sive
ly p
art-
time
17.9
4.4
20
.5
57
.2
10
0.0
0.
0
0.0
94
.7
5.
3
70.0
18.1
8.7
3.
1
Mix
ed
28
.7
8.
8
41.7
20.9
0.0
10
0.0
0.
0
78.7
21.3
42.9
42.0
12.1
3.1
E
xclu
sive
ly fu
ll-tim
e 37
.6
13
.9
34
.8
13
.7
0.
0
0.0
10
0.0
70
.6
29
.4
22
.8
44
.3
21
.3
11
.6
Bor
row
ing
stat
us D
id n
ot b
orro
w
26.6
7.7
28
.2
37
.5
49
.5
15
.2
35
.3
10
0.0
0.
0
53.3
30.6
11.5
4.6
B
orro
wed
32
.6
14
.9
36
.9
15
.7
12
.7
19
.1
68
.2
0.
0
100.
0
14.1
42.2
28.0
15.8
Typ
e of
inst
itutio
n
Pub
lic 2
-yea
r
21.3
5.8
27
.4
45
.5
65
.0
14
.7
20
.3
94
.6
5.
4
100.
0
0.0
0.
0
0.0
P
ublic
4-y
ear
31
.4
10
.9
36
.4
21
.3
23
.8
20
.5
55
.7
77
.1
22
.9
0.
0
100.
0
0.0
0.
0
Pri
vate
, not
-for
-pro
fit 4
-yea
r32
.6
16
.7
25
.1
25
.5
26
.0
13
.3
60
.7
65
.6
34
.4
0.
0
0.0
10
0.0
0.
0
Pri
vate
, for
-pro
fit
43
.5
4.
0
24.0
28.5
20.3
7.4
72
.3
57
.7
42
.4
0.
0
0.0
0.
0
100.
0
1 Atte
ndan
ce s
tatu
s is
def
ined
in te
rms
of th
e pe
rcen
tage
of
mon
ths
enro
lled
in 1
992–
93 th
at w
ere
full
time.
Stu
dent
s w
ith z
ero
mon
ths
full
time
are
cate
gori
zed
as e
xclu
sive
ly p
art-
time.
St
uden
ts w
ith 1
–99
perc
ent o
f th
eir
mon
ths
full
time
are
cate
gori
zed
as m
ixed
, and
stu
dent
s w
ith 1
00 p
erce
nt o
f th
eir
mon
ths
full
time
are
cate
gori
zed
as e
xclu
sive
ly f
ull-t
ime.
2 Bor
row
ing
incl
udes
loan
s fr
om f
eder
al, s
tate
, and
inst
itutio
nal s
ourc
es in
199
2–93
.
NO
TE
: Due
to th
e ex
clus
ion
of s
tude
nts
with
mis
sing
em
ploy
men
t inf
orm
atio
n, s
tude
nts
not s
eeki
ng a
deg
ree,
and
stu
dent
s at
tend
ing
priv
ate,
not
-for
-pro
fit l
ess-
than
4-y
ear
and
publ
icle
ss-t
han-
2-ye
ar in
stitu
tions
, the
se e
stim
ates
will
var
y fr
om o
ther
est
imat
es r
epor
ted
usin
g N
PSA
S:93
.
SOU
RC
E: U
.S. D
epar
tmen
t of
Edu
catio
n, N
atio
nal C
ente
r fo
r E
duca
tion
Stat
istic
s, 1
992–
93 N
atio
nal P
osts
econ
dary
Stu
dent
Aid
Stu
dy (
NPS
AS:
93),
Dat
a A
naly
sis
Syst
em.

WORK, BORROWING, AND ATTENDANCE PATTERNS
Figure 4—Percentage distribution of undergraduates according to attendance status, by number of hours workedFigure 9—while enrolled and borrowing status: 1992–93
No work 1–14 hours 15–33 hours 34 or more hours
NOTE: Figure excludes students with missing employment information, students not working toward a degree, and students at publicless-than-2-year and private, not-for-profit less-than-4-year institutions.
SOURCE: U.S. Department of Education, National Center for Education Statistics, 1992–93 National Postsecondary Student Aid Study(NPSAS:93), Data Analysis System.
73
51
79
5766
4352
14
17
16
15
16
22
22
20
9
9
3327
12
3528
77
7
Borrowed Did notborrow
Borrowed Did notborrow
Borrowed Did notborrow
Borrowed Did notborrow
Exclusively full-time Mixed Exclusively part-timePercent100
80
60
40
20
0
between the number of hours worked and full-time attendance for both borrowers and nonbor-rowers who worked. As the number of hours worked while enrolled increased (excluding those who did not work at all), their likelihood of attending full time decreased.
Among students at 4-year institutions working similar numbers of hours, borrowers were generally more likely than nonborrowers to attend full time.24 The effect was particularly large for those working 34 or more hours: at public 4-year institutions, 51 percent of borrowers who worked 34 or more hours attended full time, compared with 21 percent of non-
24At private, not-for-profit institutions, among students who worked 1–14 hours per week, the percentage of borrowers who attended full time (87 percent) was not significantly different from the percentage of nonborrowers who attended full time (81 percent).
23
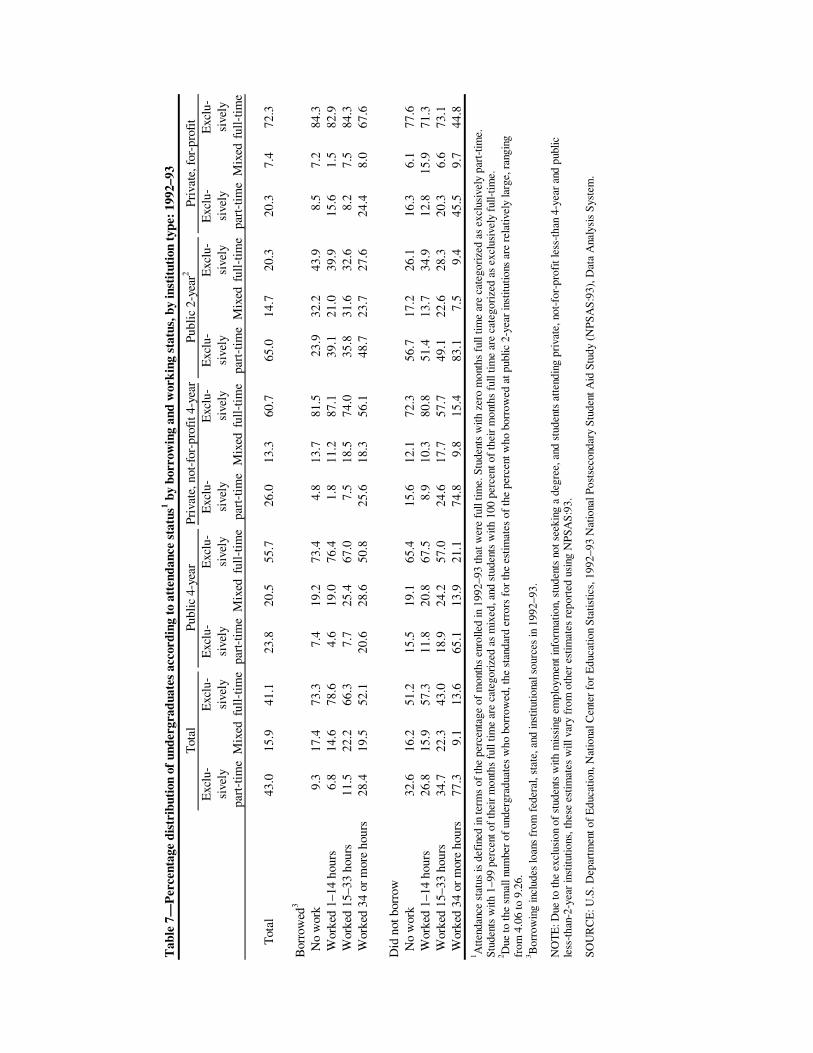
Tab
le 7
—P
erce
ntag
e di
stri
buti
on o
f un
derg
radu
ates
acc
ordi
ng to
att
enda
nce
stat
us1 b
y bo
rrow
ing
and
wor
king
sta
tus,
by
inst
itut
ion
type
: 199
2–93
Tot
alPu
blic
4-y
ear
Priv
ate,
not
-for
-pro
fit 4
-yea
rPu
blic
2-y
ear2
Priv
ate,
for-
prof
itE
xclu
-E
xclu
-E
xclu
-E
xclu
-E
xclu
-E
xclu
-E
xclu
-E
xclu
-E
xclu
-E
xclu
-
si
vely
si
vely
sive
ly
sive
lysi
vely
si
vely
sive
ly
sive
lysi
vely
si
vely
part
-tim
eM
ixed
full-
time
part
-tim
eM
ixed
full-
time
part
-tim
eM
ixed
full-
time
part
-tim
eM
ixed
full-
time
part
-tim
eM
ixed
full-
time
T
otal
43
.0
15
.9
41.1
23.8
20.5
55.7
26.0
13.3
60
.765
.014
.7
20.3
20
.3
7.
4
72.3
Bor
row
ed3
No
wor
k
9.
3
17.4
73
.37.
4
19.2
73.4
4.8
13
.7
81.5
23.
9
32
.2
43.9
8.
5
7.2
84
.3 W
orke
d 1–
14 h
ours
6.8
14
.6
78.6
4.6
19
.076
.41.
8
11.2
87
.139
.1
21.0
39
.9
15.6
1.5
82
.9 W
orke
d 15
–33
hour
s11
.5
22
.2
66.3
7.7
25
.467
.07.
5
18.5
74
.035
.8
31.6
32
.6
8.2
7.
5
84.3
Wor
ked
34 o
r m
ore
hour
s28
.4
19
.5
52.1
20.6
28.6
50.8
25.6
18.3
56
.148
.7
23.7
27
.6
24.4
8.0
67
.6
Did
not
bor
row
No
wor
k
32
.6
16
.2
51.2
15.5
19.1
65.4
15.6
12.1
72
.356
.717
.2
26.1
16
.3
6.
1
77.6
Wor
ked
1–14
hou
rs26
.8
15
.9
57.3
11.8
20.8
67.5
8.9
10
.3
80.8
51.4
13.7
34
.9
12.8
15.9
71
.3 W
orke
d 15
–33
hour
s34
.7
22
.3
43.0
18.9
24.2
57.0
24.6
17.7
57
.749
.122
.6
28.3
20
.3
6.
6
73.1
Wor
ked
34 o
r m
ore
hour
s77
.3
9.
1
13.6
65.1
13.9
21.1
74.8
9.8
15
.483
.17.
5
9.4
45
.5
9.
7
44.8
1 Atte
ndan
ce s
tatu
s is
def
ined
in te
rms
of th
e pe
rcen
tage
of
mon
ths
enro
lled
in 1
992–
93 th
at w
ere
full
time.
Stu
dent
s w
ith z
ero
mon
ths
full
time
are
cate
gori
zed
as e
xclu
sive
ly p
art-
time.
St
uden
ts w
ith 1
–99
perc
ent o
f th
eir
mon
ths
full
time
are
cate
gori
zed
as m
ixed
, and
stu
dent
s w
ith 1
00 p
erce
nt o
f th
eir
mon
ths
full
time
are
cate
gori
zed
as e
xclu
sive
ly f
ull-t
ime.
2 Due
to th
e sm
all n
umbe
r of
und
ergr
adua
tes
who
bor
row
ed, t
he s
tand
ard
erro
rs f
or th
e es
timat
es o
f th
e pe
rcen
t who
bor
row
ed a
t pub
lic 2
-yea
r in
stitu
tions
are
rel
ativ
ely
larg
e, r
angi
ng
from
4.0
6 to
9.2
6.3 B
orro
win
g in
clud
es lo
ans
from
fed
eral
, sta
te, a
nd in
stitu
tiona
l sou
rces
in 1
992–
93.
NO
TE
: Due
to th
e ex
clus
ion
of s
tude
nts
with
mis
sing
em
ploy
men
t inf
orm
atio
n, s
tude
nts
not s
eeki
ng a
deg
ree,
and
stu
dent
s at
tend
ing
priv
ate,
not
-for
-pro
fit l
ess-
than
4-y
ear
and
publ
icle
ss-t
han-
2-ye
ar in
stitu
tions
, the
se e
stim
ates
will
var
y fr
om o
ther
est
imat
es r
epor
ted
usin
g N
PSA
S:93
.
SOU
RC
E: U
.S. D
epar
tmen
t of
Edu
catio
n, N
atio
nal C
ente
r fo
r E
duca
tion
Stat
istic
s, 1
992–
93 N
atio
nal P
osts
econ
dary
Stu
dent
Aid
Stu
dy (
NPS
AS:
93),
Dat
a A
naly
sis
Syst
em.
WORK, BORROWING, AND ATTENDANCE PATTERNS
borrowers. Similarly, 56 percent of borrowers at private, not-for-profit 4-year institutions who worked 34 or more hours attended exclusively full time compared with 15 percent of nonbor-rowers.
The relationship between hours worked and full-time attendance was somewhat different for students at private, for-profit institutions. Among both borrowers and nonborrowers, those who worked 34 or more hours per week while enrolled were less likely than those who worked 15–33 hours to attend exclusively full time. However, those who worked 1–14 hours or 15–33 hours per week while enrolled were about equally likely to do so.
Although a substantial proportion of students at private, for-profit institutions borrowed (42 percent, table 6), only among those who did not work or worked 34 or more hours per week did borrowing appear to be associated with full-time attendance (table 7). For example, among students who did not work, 84 percent of borrowers attended full time compared with 78 percent of nonborrowers, and among students working 34 or more hours, 68 percent of borrowers did so compared with 45 percent of nonborrowers.
Because so many of the students at public 2-year institutions worked 34 hours per week or more (46 percent) and attended exclusively part-time (65 percent), and because they rarely bor-rowed (5 percent, table 6), the estimates for students with other types of work, borrowing, and attendance patterns are based on a small number of cases. Therefore, the relationship between borrowing and full-time attendance could not be determined for these students.
WORK AND BORROWING PATTERNS OF FULL- AND PART-TIME STUDENTS
Table 8 summarizes how students at various types of institutions combined work and bor-rowing, controlling for attendance status. In all types of institutions, between 25 and 29 percent of the students who attended exclusively full time neither worked nor borrowed. In other words, about one-quarter of the students at each type of institution supported their postsecondary educa-tion attendance with their own savings, financial support from relatives or friends, or grants.
The strategies that the rest of the exclusively full-time students used to finance their educa-tion varied by type of institution, however. Among students at 2-year public institutions, 91 per-cent of the students at 2-year public institutions did not borrow, but the majority
25

Tab
le 8
—P
erce
ntag
e di
stri
buti
on o
f un
derg
radu
ates
acc
ordi
ng t
o bo
rrow
ing
and
wor
king
sta
tus,
by
inst
itut
ion
type
and
att
enda
nce
stat
us1 :
1992
–93
Bor
row
ed2
Did
not
bor
row
W
orke
dW
orke
dW
orke
d
Wor
ked
Wor
ked
Wor
ked
No
1–14
15–3
334
or
mor
eN
o1–
1415
–33
34 o
r m
ore
wor
kho
urs
hour
sho
urs
Tot
alw
ork
hour
sho
urs
hour
sT
otal
All
stud
ents
T
otal
5.
8
2.
6
6.
5
2.
8
17
.7
21
.96.
3
23
.330
.9
82.3
Typ
e of
inst
itut
ion
Pub
lic
2-ye
ar
1.8
0.5
1.9
1.2
5.4
19.5
5.3
25.5
44.3
94
.6 P
ubli
c 4-
year
7.
6
3.
2
9.
6
2.
5
22
.9
23
.87.
7
26
.818
.9
77.1
Pri
vate
, not
-for
-pro
fit 4
-yea
r9.
7
8.
5
11
.8
4.
5
34
.4
22
.98.
3
13
.421
.1
65.6
Pri
vate
, for
-pro
fit
16
.4
2.
1
12
.3
11
.6
42
.4
27
.12.
0
11
.716
.9
57.7
Exc
lusi
vely
ful
l-ti
me
T
otal
10.3
5.0
10.5
3.5
29.4
27.3
8.8
24.3
10.2
70
.6
Typ
e of
inst
itut
ion
Pub
lic
2-ye
ar
3.8
1.0
3.1
1.6
9.5
25.3
9.2
35.5
20.5
90
.5 P
ubli
c 4-
year
10
.0
4.
4
11
.5
2.
3
28
.2
27
.99.
4
27
.47.
1
71
.8 P
riva
te, n
ot-f
or-p
rofi
t 4-y
ear
13.1
12.2
14.4
4.1
43.7
27.2
11.0
12
.75.
4
56
.3 P
riva
te, f
or-p
rofi
t
19.2
2.3
14.4
10.9
46.9
29.2
1.9
11.5
10.5
53
.1
Mix
ed
Tot
al6.
3
2.
4
9.
1
3.
4
21
.3
22
.36.
3
32
.517
.5
78.7
Typ
e of
inst
itut
ion
Pub
lic
2-ye
ar
3.8
0.7
4.1
1.9
10.6
22.9
5.0
39.1
22.5
89
.5 P
ubli
c 4-
year
7.
1
3.
0
11
.9
3.
5
25
.5
22
.27.
9
31
.712
.8
74.5
Pri
vate
, not
-for
-pro
fit 4
-yea
r10
.0
7.
1
16
.4
6.
1
39
.6
20
.86.
4
17
.815
.4
60.4
Pri
vate
, for
-pro
fit
15
.9
0.
4
12
.5
12
.6
41
.4
22
.24.
2
10
.122
.1
58.6
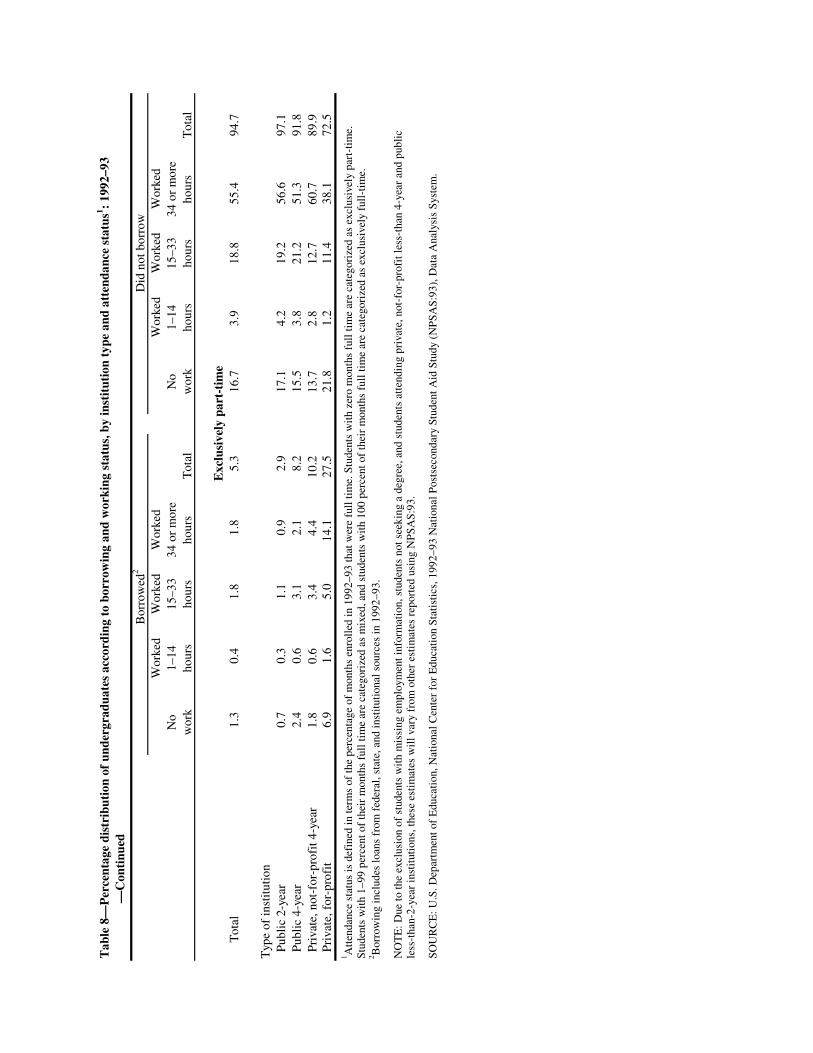
Tab
le 8
—P
erce
ntag
e di
stri
buti
on o
f un
derg
radu
ates
acc
ordi
ng t
o bo
rrow
ing
and
wor
king
sta
tus,
by
inst
itut
ion
type
and
att
enda
nce
stat
us1 :
1992
–93
Tab
le E
——
Con
tinu
ed
Bor
row
ed2
Did
not
bor
row
W
orke
dW
orke
dW
orke
d
Wor
ked
Wor
ked
Wor
ked
No
1–14
15–3
334
or
mor
eN
o1–
1415
–33
34 o
r m
ore
wor
kho
urs
hour
sho
urs
Tot
alw
ork
hour
sho
urs
hour
sT
otal
Exc
lusi
vely
par
t-ti
me
T
otal
1.3
0.4
1.8
1.8
5.3
16.7
3.9
18.8
55.4
94
.7
Typ
e of
inst
itut
ion
Pub
lic
2-ye
ar
0.7
0.3
1.1
0.9
2.9
17.1
4.2
19.2
56.6
97
.1 P
ubli
c 4-
year
2.
4
0.
6
3.
1
2.
1
8.
2
15
.53.
8
21
.251
.3
91.8
Pri
vate
, not
-for
-pro
fit 4
-yea
r1.
8
0.
6
3.
4
4.
4
10
.2
13
.72.
8
12
.760
.7
89.9
Pri
vate
, for
-pro
fit
6.
9
1.
6
5.
0
14
.1
27
.5
21
.81.
2
11
.438
.1
72.5
1 Att
enda
nce
stat
us is
def
ined
in te
rms
of th
e pe
rcen
tage
of
mon
ths
enro
lled
in 1
992–
93 th
at w
ere
full
tim
e. S
tude
nts
wit
h ze
ro m
onth
s fu
ll ti
me
are
cate
gori
zed
as e
xclu
sive
ly p
art-
tim
e.
Stud
ents
wit
h 1–
99 p
erce
nt o
f th
eir
mon
ths
full
tim
e ar
e ca
tego
rize
d as
mix
ed, a
nd s
tude
nts
wit
h 10
0 pe
rcen
t of
thei
r m
onth
s fu
ll ti
me
are
cate
gori
zed
as e
xclu
sive
ly f
ull-
tim
e.2 B
orro
win
g in
clud
es lo
ans
from
fed
eral
, sta
te, a
nd in
stit
utio
nal s
ourc
es in
199
2–93
.
NO
TE
: Due
to th
e ex
clus
ion
of s
tude
nts
wit
h m
issi
ng e
mpl
oym
ent i
nfor
mat
ion,
stu
dent
s no
t see
king
a d
egre
e, a
nd s
tude
nts
atte
ndin
g pr
ivat
e, n
ot-f
or-p
rofi
t les
s-th
an 4
-yea
r an
d pu
blic
le
ss-t
han-
2-ye
ar in
stit
utio
ns, t
hese
est
imat
es w
ill v
ary
from
oth
er e
stim
ates
rep
orte
d us
ing
NP
SAS:
93.
SOU
RC
E: U
.S. D
epar
tmen
t of
Edu
cati
on, N
atio
nal C
ente
r fo
r E
duca
tion
Sta
tist
ics,
199
2–93
Nat
iona
l Pos
tsec
onda
ry S
tude
nt A
id S
tudy
(N
PSA
S:93
), D
ata
Ana
lysi
s Sy
stem
.
WORK, BORROWING, AND ATTENDANCE PATTERNS
worked at least 15 hours per week (36 percent worked 15–33 hours and 21 percent worked 34 hours or more).
At other types of institutions, exclusively full-time students used a greater variety of strate-gies. For example, for students at public 4-year institutions, the most common strategies were not working and not borrowing (28 percent), or working 15–33 hours and not borrowing (27 per-cent). Full-time students at private, not-for-profit 4-year institutions who worked were more likely than their counterparts at public 4-year institutions to borrow and work (at each level of working).
Among exclusively part-time students at all types of institutions except private, for-profit, 90 percent or more did not borrow. Except at private, for-profit institutions, the strategy adopted by at least 50 percent of exclusively part-time students was not to borrow, but to work 34 or more hours per week. Almost all of the rest either worked 15–33 hours or not at all and did not borrow.
28
FINANCING STRATEGIES AND PERSISTENCE
As indicated earlier, a number of studies have suggested that full-time off-campus work has a negative effect on postsecondary persistence, while part-time work—particularly part-time on-campus work—tends to have positive effects. Part-time, on-campus work may facilitate so-cial integration, while working full time or working off campus may interfere with this process by curtailing the time available for school.25 In addition, as also indicated earlier, part-time at-tendance (typically defined as fewer than 12 credit hours) has been found to be associated with lower rates of postsecondary persistence. Part-time attendance may also be associated with other circumstances that reduce a student’s likelihood of persistence, such as work, family responsi-bilities, limited financial resources, or a low level of commitment to completing a program.26
This section examines how postsecondary persistence is related to various combinations of work, borrowing, and attendance. Specifically, it describes the relationship between 1989–90 first-time beginning students’ cumulative working and borrowing status and their persistence five years later in 1994.
The analysis described in this section uses data from BPS:90/94, which includes only stu-dents who enrolled in postsecondary education for the first time in 1989–90. The BPS:90/94 population contains a higher proportion of young, dependent, and single students than the NPSAS:93 population discussed in the previous section. Consequently, work, borrowing, and attendance patterns of these two groups differ. Specifically, BPS:90/94 students were much more likely than NPSAS:93 students to borrow (31 versus 18 percent), and, whether they borrowed or not, they were considerably more likely to work less than 34 hours and less likely not to work at all (table 9). The BPS:90/94 students were about as likely as the NPSAS:93 students to attend exclusively full-time (40 and 41 percent, respectively), but the BPS:90/94 students were much less likely than the NPSAS:93 students to attend exclusively part time (18 percent versus 43 per-cent, table B3).27
25V. Tinto, “Dropouts From Higher Education: A Theoretical Synthesis of Recent Research,” Review of Educational Research (1975): 45; and J.P. Bean and B.S. Metzner, “A Conceptual Model of Nontraditional Undergraduate Student Attrition,” Review of Educational Research, 55 (4) (1985): 485–540. 26J.P. Bean and B.S. Metzner,“A Conceptual Model of Nontraditional Undergraduate Student Attrition.”
27It is logical that BPS students would be more likely than NPSAS:93 students to have mixed attendance because the period covered is longer.
29
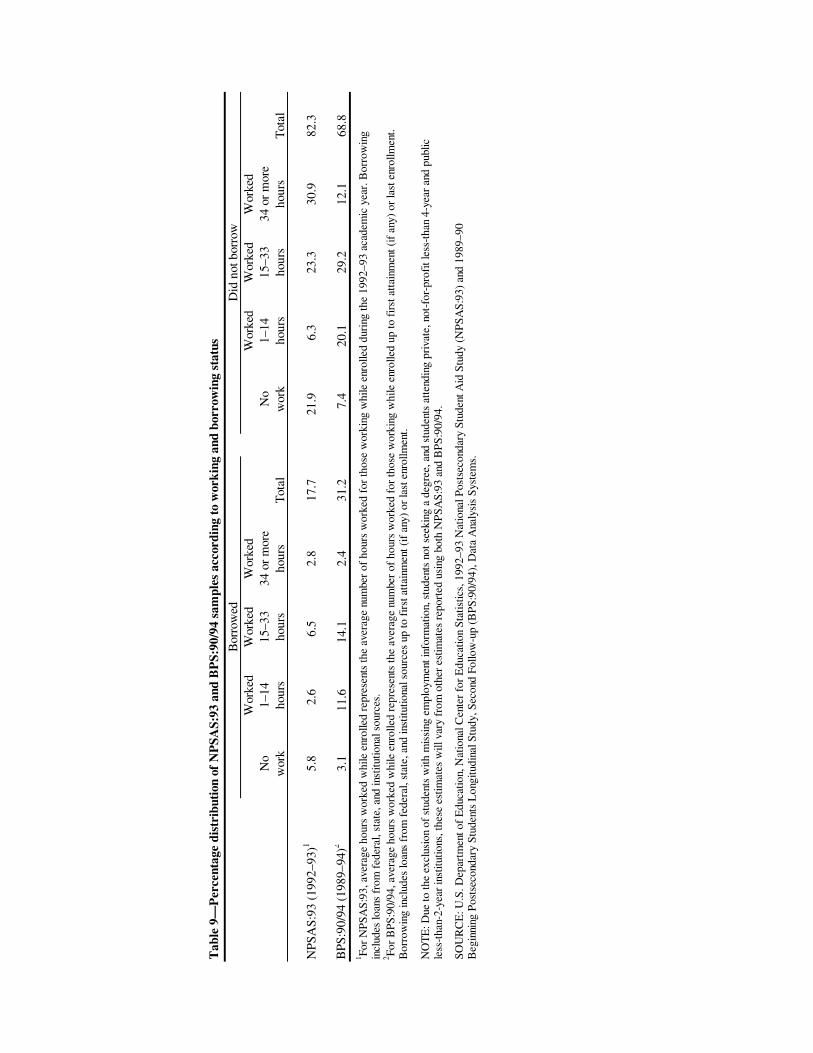
Tab
le 9
—P
erce
ntag
e di
stri
buti
on o
f N
PSA
S:93
and
BP
S:90
/94
sam
ples
acc
ordi
ng to
wor
king
and
bor
row
ing
stat
us
B
orro
wed
Did
not
bor
row
W
orke
dW
orke
dW
orke
d
Wor
ked
Wor
ked
Wor
ked
No
1–14
15–3
334
or
mor
eN
o1–
1415
–33
34 o
r m
ore
wor
kho
urs
hour
sho
urs
Tot
alw
ork
hour
sho
urs
hour
sT
otal
NPS
AS:
93 (
1992
–93)
15.
82.
6
6.5
2.
817
.721
.9
6.3
23
.330
.982
.3
BPS
:90/
94 (
1989
–94)
23.
111
.6
14.1
2.
431
.27.
4
20.1
29
.212
.168
.81 Fo
r N
PSA
S:93
, ave
rage
hou
rs w
orke
d w
hile
enr
olle
d re
pres
ents
the
aver
age
num
ber
of h
ours
wor
ked
for
thos
e w
orki
ng w
hile
enr
olle
d du
ring
the
1992
–93
acad
emic
yea
r. B
orro
win
g in
clud
es lo
ans
from
fed
eral
, sta
te, a
nd in
stitu
tiona
l sou
rces
. 2 Fo
r B
PS:9
0/94
, ave
rage
hou
rs w
orke
d w
hile
enr
olle
d re
pres
ents
the
aver
age
num
ber
of h
ours
wor
ked
for
thos
e w
orki
ng w
hile
enr
olle
d up
to f
irst
atta
inm
ent (
if a
ny)
or la
st e
nrol
lmen
t.B
orro
win
g in
clud
es lo
ans
from
fed
eral
, sta
te, a
nd in
stitu
tiona
l sou
rces
up
to f
irst
atta
inm
ent (
if a
ny)
or la
st e
nrol
lmen
t.
NO
TE
: Due
to th
e ex
clus
ion
of s
tude
nts
with
mis
sing
em
ploy
men
t inf
orm
atio
n, s
tude
nts
not s
eeki
ng a
deg
ree,
and
stu
dent
s at
tend
ing
priv
ate,
not
-for
-pro
fit l
ess-
than
4-y
ear
and
publ
icle
ss-t
han-
2-ye
ar in
stitu
tions
, the
se e
stim
ates
will
var
y fr
om o
ther
est
imat
es r
epor
ted
usin
g bo
th N
PSA
S:93
and
BPS
:90/
94.
SOU
RC
E: U
.S. D
epar
tmen
t of
Edu
catio
n, N
atio
nal C
ente
r fo
r E
duca
tion
Stat
istic
s, 1
992–
93 N
atio
nal P
osts
econ
dary
Stu
dent
Aid
Stu
dy (
NPS
AS:
93)
and
1989
–90
Beg
inni
ng P
osts
econ
dary
Stu
dent
s L
ongi
tudi
nal S
tudy
, Sec
ond
Follo
w-u
p (B
PS:9
0/94
), D
ata
Ana
lysi
s Sy
stem
s.
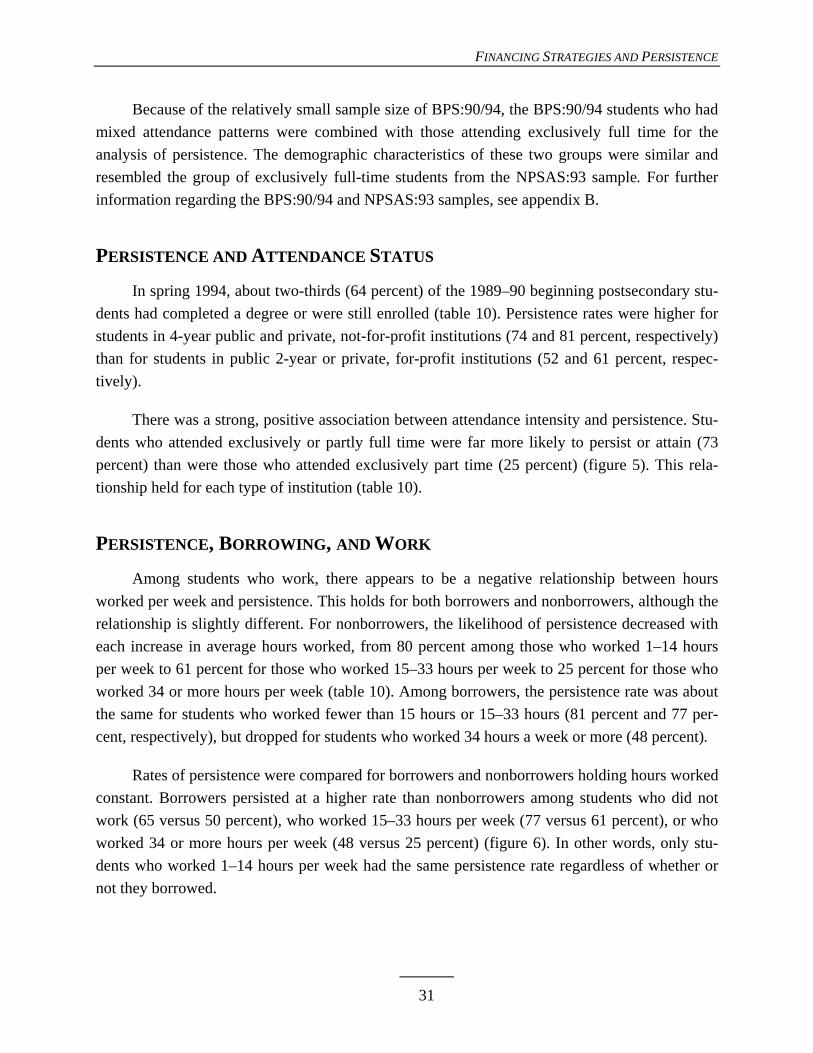
FINANCING STRATEGIES AND PERSISTENCE
Because of the relatively small sample size of BPS:90/94, the BPS:90/94 students who had mixed attendance patterns were combined with those attending exclusively full time for the analysis of persistence. The demographic characteristics of these two groups were similar and resembled the group of exclusively full-time students from the NPSAS:93 sample. For further information regarding the BPS:90/94 and NPSAS:93 samples, see appendix B.
PERSISTENCE AND ATTENDANCE STATUS
In spring 1994, about two-thirds (64 percent) of the 1989–90 beginning postsecondary stu-dents had completed a degree or were still enrolled (table 10). Persistence rates were higher for students in 4-year public and private, not-for-profit institutions (74 and 81 percent, respectively) than for students in public 2-year or private, for-profit institutions (52 and 61 percent, respec-tively).
There was a strong, positive association between attendance intensity and persistence. Stu-dents who attended exclusively or partly full time were far more likely to persist or attain (73 percent) than were those who attended exclusively part time (25 percent) (figure 5). This rela-tionship held for each type of institution (table 10).
PERSISTENCE, BORROWING, AND WORK
Among students who work, there appears to be a negative relationship between hours worked per week and persistence. This holds for both borrowers and nonborrowers, although the relationship is slightly different. For nonborrowers, the likelihood of persistence decreased with each increase in average hours worked, from 80 percent among those who worked 1–14 hours per week to 61 percent for those who worked 15–33 hours per week to 25 percent for those who worked 34 or more hours per week (table 10). Among borrowers, the persistence rate was about the same for students who worked fewer than 15 hours or 15–33 hours (81 percent and 77 per-cent, respectively), but dropped for students who worked 34 hours a week or more (48 percent).
Rates of persistence were compared for borrowers and nonborrowers holding hours worked constant. Borrowers persisted at a higher rate than nonborrowers among students who did not work (65 versus 50 percent), who worked 15–33 hours per week (77 versus 61 percent), or who worked 34 or more hours per week (48 versus 25 percent) (figure 6). In other words, only stu-dents who worked 1–14 hours per week had the same persistence rate regardless of whether or not they borrowed.
31

FINANCING STRATEGIES AND PERSISTENCE
Table 10—Percentage of 1989–90 first-time beginning postsecondary students who had attained a degree or wereTable 11—still enrolled as of spring 1994 according to type of first institution, by work, borrowing, and attendanceTable 11—status1: 1989–94
Attained or still enrolled as of 1994 Private,
Public not-for-profit Public Private, Total 4-year 4-year 2-year for-profit
Total Total 64.0 74.0 81.1 52.0 60.9
Borrowe
d2 74.8 79.0 82.4 67.6 64.3 No work 64.5 — 74.1 — 59.1 Worked 1–14 hours 80.8 80.9 86.4 — 77.4 Worked 15–33 hours 76.7 80.8 80.8 70.1 68.4 Worked 34 or more hours 48.4 — — — 51.4
Did not borrow 59.1 70.9 79.5 50.0 55.1 No work 50.1 55.9 72.7 45.7 47.7 Worked 1–14 hours 80.2 86.4 87.4 72.0 73.2 Worked 15–33 hours 60.9 68.0 76.6 54.3 72.9 Worked 34 or more hours 25.1 28.8 35.1 23.9 26.1
Attended exclusively or partly full time Total 72.5 77.2 84.0 64.3 66.7Borrowed 77.1 80.3 83.4 69.3 67.6 No work 68.2 — 78.5 — 60.3 Worked 1–14 hours 81.9 82.1 84.5 — 79.5 Worked 15–33 hours 77.8 81.6 81.5 70.1 70.5 Worked 34 or more hours 53.9 — — — 58.2
Did not borrow 69.9 75.1 84.8 63.3 64.7 No work 64.4 64.3 83.8 61.7 62.0 Worked 1–14 hours 80.9 86.5 88.2 72.1 — Worked 15–33 hours 68.8 71.1 81.9 65.1 69.0 Worked 34 or more hours 38.7 38.9 — 38.4 31.7
Attended exclusively part time Total 24.9 12.6 22.8 19.5 48.8Borrowed 46.1 — — — 55.0 No work 51.8 — — — 56.1 Worked 1–14 hours — — — — — Worked 15–33 hours 56.3 — — — 62.0 Worked 34 or more hours 31.6 — — — 40.8Did not borrow 21.7 14.4 21.6 19.7 41.8 No work 13.4 — — — 29.1 Worked 1–14 hours — — — — — Worked 15–33 hours 30.0 — — 26.2 — Worked 34 or more hours 15.1 — — 14.8 —— Too few cases for a reliable estimate.1Attendance status is defined as percent of months enrolled full time up to first attainment (if any) or last enrollment. Students withzero percent of months full time are categorized as exclusively part-time. Students with 1–100 percent of months full time (includesboth mixed and exclusively full-time students) are categorized as exclusively or partly full-time.2Borrowing includes loans from federal, state, and institutional sources up to first attainment (if any) or last enrollment.NOTE: Due to the exclusion of students with missing employment information, students not seeking a degree, and students attendingprivate, not-for-profit less-than 4-year and public less-than-2-year institutions, these estimates will vary from other estimates reportedusing BPS:90/94 data.SOURCE: U.S. Department of Education, National Center for Education Statistics, 1989-90 Beginning Postsecondary Students, SecondFollow-up (BPS:90/94), Data Analysis System.
32
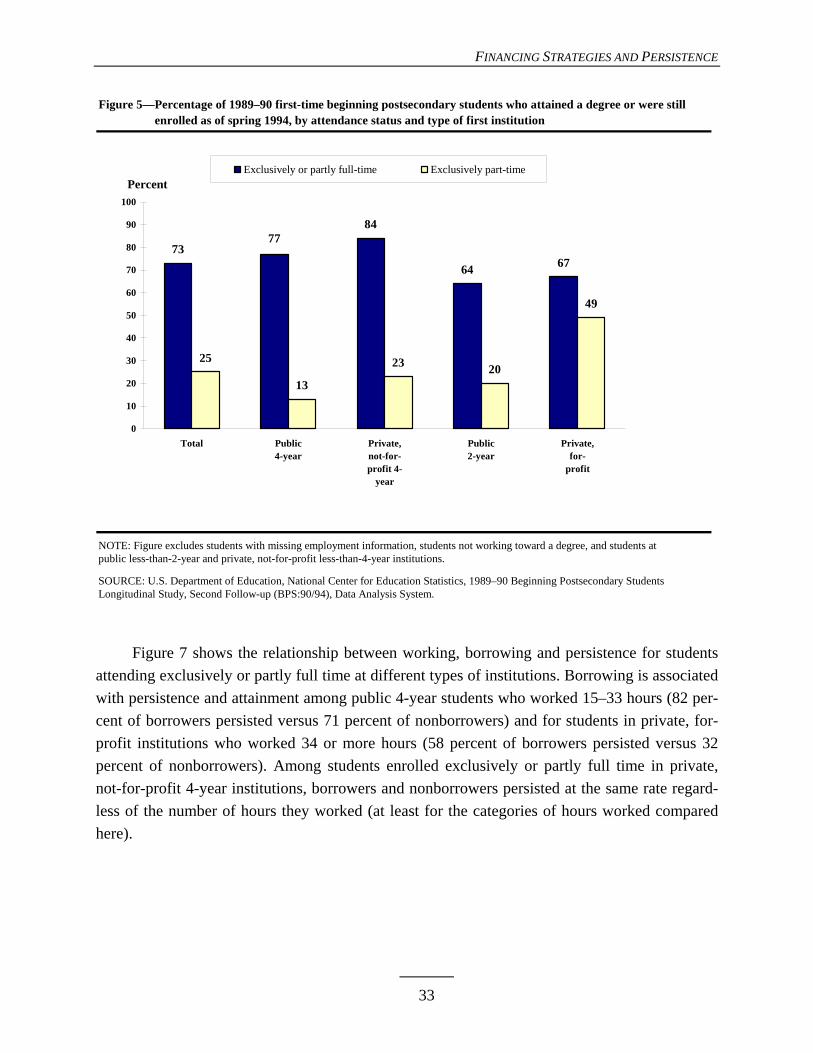
FINANCING STRATEGIES AND PERSISTENCE
Figure 5—Percentage of 1989–90 first-time beginning postsecondary students who attained a degree or were stillFigure 9—enrolled as of spring 1994, by attendance status and type of first institution
Attained a degree
Attained a degree or still enrolled
NOTE: Figure excludes students with missing employment information, students not working toward a degree, and students atpublic less-than-2-year and private, not-for-profit less-than-4-year institutions.
SOURCE: U.S. Department of Education, National Center for Education Statistics, 1989–90 Beginning Postsecondary StudentsLongitudinal Study, Second Follow-up (BPS:90/94), Data Analysis System.
73
84
64 67
25
13
23 20
49
77
0
10
20
30
40
50
60
70
80
90
100
Total Public4-year
Private,not-for-profit 4-
year
Public2-year
Private,for-
profit
Exclusively or partly full-time Exclusively part-timePercent
Figure 7 shows the relationship between working, borrowing and persistence for students attending exclusively or partly full time at different types of institutions. Borrowing is associated with persistence and attainment among public 4-year students who worked 15–33 hours (82 per-cent of borrowers persisted versus 71 percent of nonborrowers) and for students in private, for-profit institutions who worked 34 or more hours (58 percent of borrowers persisted versus 32 percent of nonborrowers). Among students enrolled exclusively or partly full time in private, not-for-profit 4-year institutions, borrowers and nonborrowers persisted at the same rate regard-less of the number of hours they worked (at least for the categories of hours worked compared here).
33
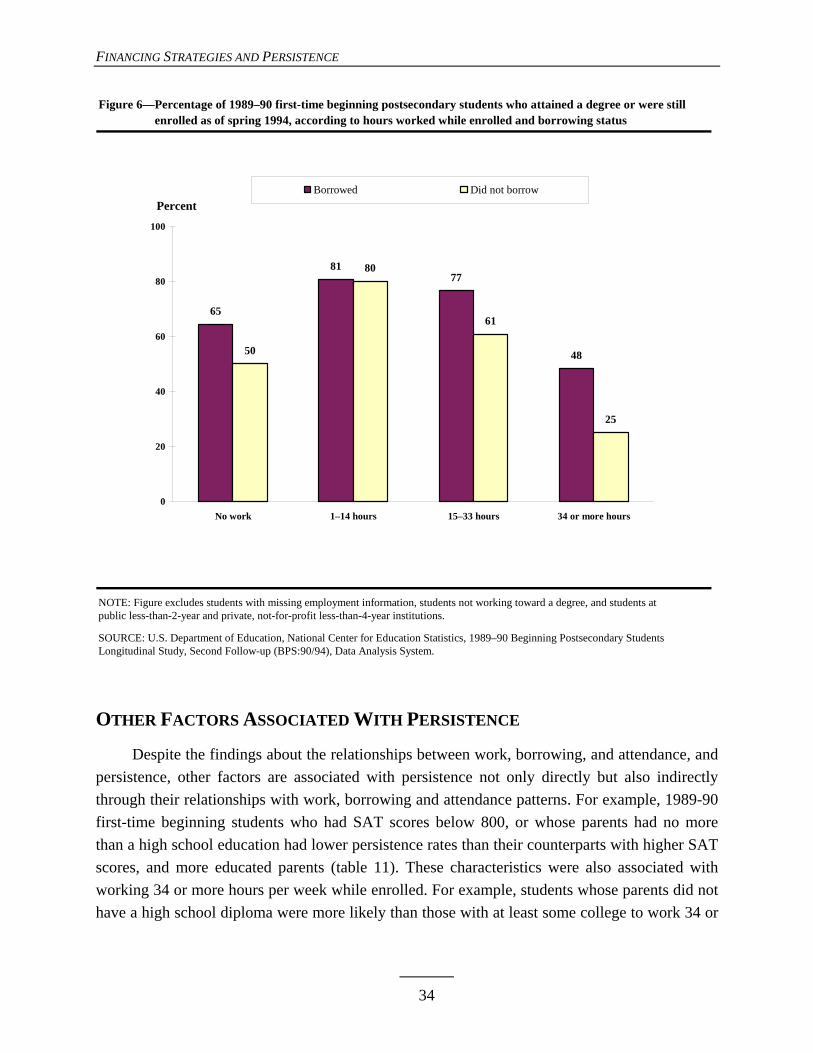
FINANCING STRATEGIES AND PERSISTENCE
Figure 6—Percentage of 1989–90 first-time beginning postsecondary students who attained a degree or were still Figure 1—enrolled as of spring 1994, according to hours worked while enrolled and borrowing status
NOTE: Figure excludes students with missing employment information, students not working toward a degree, and students atpublic less-than-2-year and private, not-for-profit less-than-4-year institutions.
SOURCE: U.S. Department of Education, National Center for Education Statistics, 1989–90 Beginning Postsecondary StudentsLongitudinal Study, Second Follow-up (BPS:90/94), Data Analysis System.
65
8177
4850
80
61
25
0
20
40
60
80
100
No work 1–14 hours 15–33 hours 34 or more hours
Borrowed Did not borrowPercent
OTHER FACTORS ASSOCIATED WITH PERSISTENCE
Despite the findings about the relationships between work, borrowing, and attendance, and persistence, other factors are associated with persistence not only directly but also indirectly through their relationships with work, borrowing and attendance patterns. For example, 1989-90 first-time beginning students who had SAT scores below 800, or whose parents had no more than a high school education had lower persistence rates than their counterparts with higher SAT scores, and more educated parents (table 11). These characteristics were also associated with working 34 or more hours per week while enrolled. For example, students whose parents did not have a high school diploma were more likely than those with at least some college to work 34 or
34
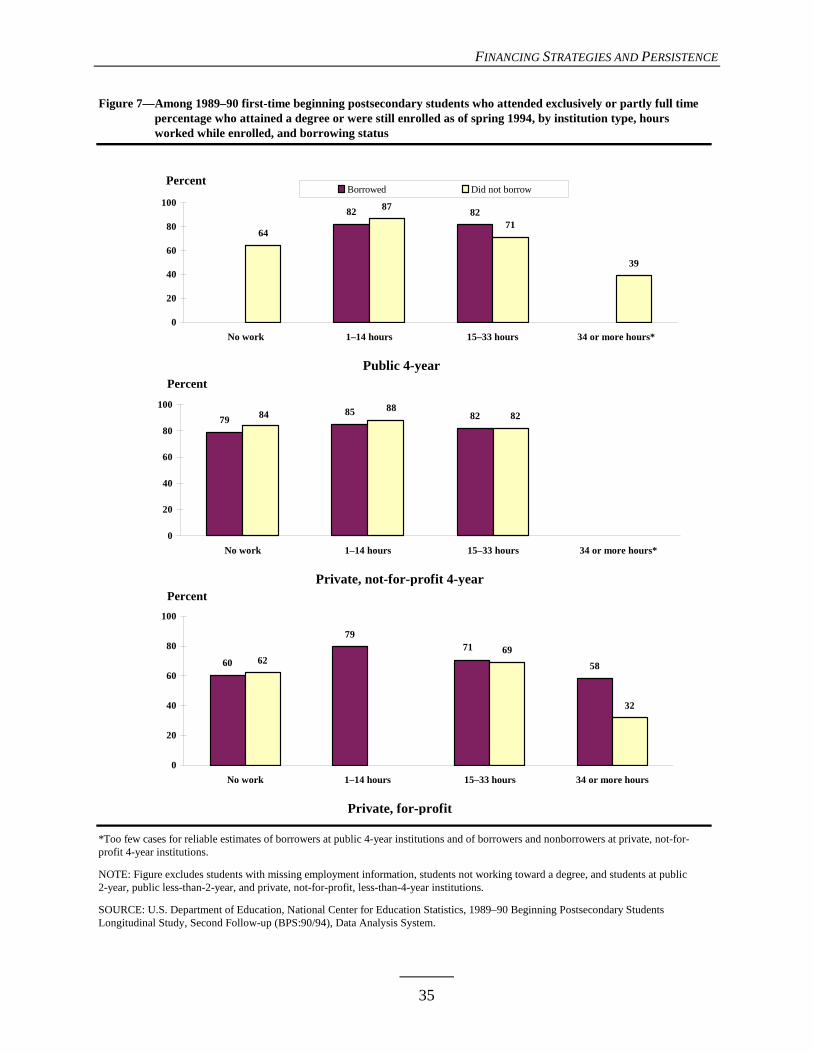
FINANCING STRATEGIES AND PERSISTENCE
Figure 7—Among 1989–90 first-time beginning postsecondary students who attended exclusively or partly full timeFigure 7—percentage who attained a degree or were still enrolled as of spring 1994, by institution type, hours Figure 7—worked while enrolled, and borrowing status
Public 4-year
Private, not-for-profit 4-year
Private, for-profit
*Too few cases for reliable estimates of borrowers at public 4-year institutions and of borrowers and nonborrowers at private, not-for-profit 4-year institutions.
NOTE: Figure excludes students with missing employment information, students not working toward a degree, and students at public 2-year, public less-than-2-year, and private, not-for-profit, less-than-4-year institutions.
SOURCE: U.S. Department of Education, National Center for Education Statistics, 1989–90 Beginning Postsecondary Students Longitudinal Study, Second Follow-up (BPS:90/94), Data Analysis System.
7985 82 82
8884
0
20
40
60
80
100
No work 1–14 hours 15–33 hours 34 or more hours*
60
79
586269
32
71
0
20
40
60
80
100
No work 1–14 hours 15–33 hours 34 or more hours
82 82
64
87
71
39
0
20
40
60
80
100
No work 1–14 hours 15–33 hours 34 or more hours*
Borrowed Did not borrowPercent
Percent
Percent
35
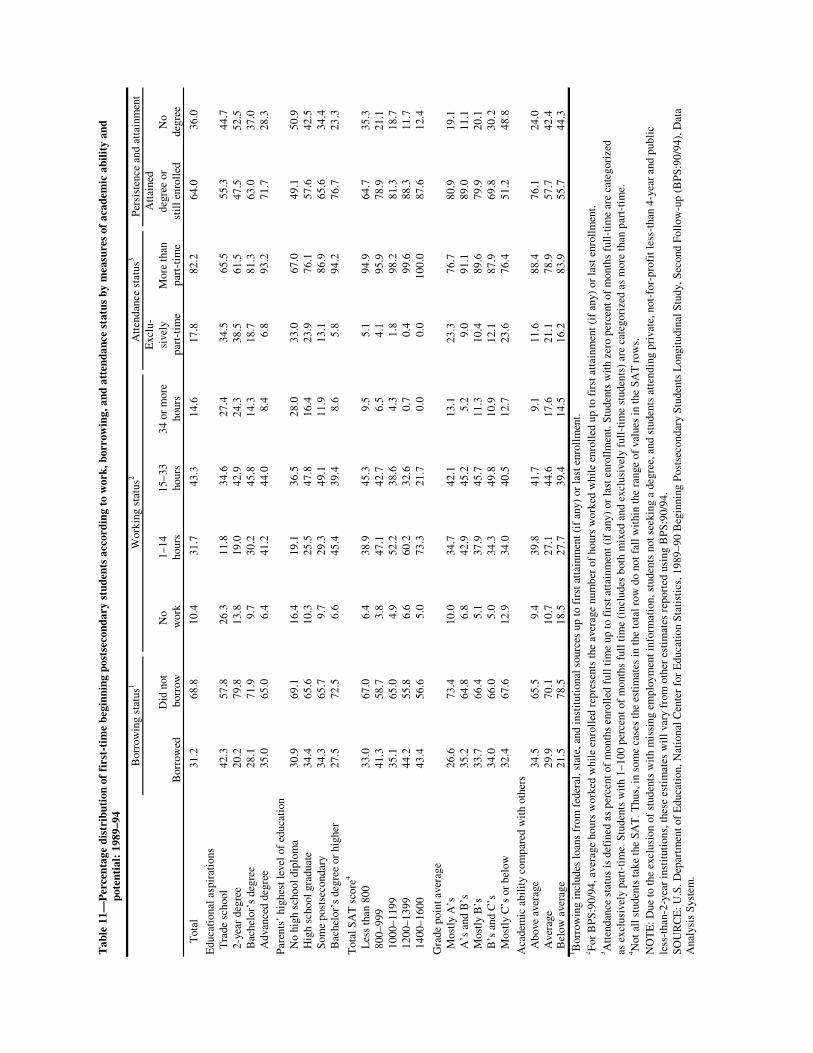
Tab
le 1
1—P
erce
ntag
e di
stri
buti
on o
f fi
rst-
tim
e be
ginn
ing
post
seco
ndar
y st
uden
ts a
ccor
ding
to
wor
k, b
orro
win
g, a
nd a
tten
danc
e st
atus
by
mea
sure
s of
aca
dem
ic a
bilit
y an
dT
able
11—
pote
ntia
l: 1
989–
94
Bor
row
ing
stat
us1
Wor
king
sta
tus2
Att
enda
nce
stat
us3
Per
sist
ence
and
att
ainm
ent
Exc
lu-
Att
aine
d
D
id n
ot
No
1–14
15–3
334
or
mor
esi
vely
Mor
e th
ande
gree
or
No
Bor
row
edbo
rrow
wor
kho
urs
hour
sho
urs
part
-tim
epa
rt-t
ime
stil
l enr
olle
dde
gree
T
otal
31
.2
68.8
10
.4
31.7
43
.3
14.6
17
.8
82.2
64
.0
36.0
Edu
cati
onal
asp
irat
ions
Tra
de s
choo
l
42.3
57
.8
26.3
11
.8
34.6
27
.4
34.5
65
.5
55.3
44
.7
2-y
ear
degr
ee
20.2
79
.8
13.8
19
.0
42.9
24
.3
38.5
61
.5
47.5
52
.5
Bac
helo
r’s
degr
ee
28
.1
71.9
9.
7
30
.2
45.8
14
.3
18.7
81
.3
63.0
37
.0
Adv
ance
d de
gree
35
.0
65.0
6.
4
41
.2
44.0
8.
4
6.
8
93
.2
71.7
28
.3
Par
ents
’ hi
ghes
t lev
el o
f ed
ucat
ion
No
high
sch
ool d
iplo
ma
30.9
69
.1
16.4
19
.1
36.5
28
.0
33.0
67
.0
49.1
50
.9
Hig
h sc
hool
gra
duat
e
34.4
65
.6
10.3
25
.5
47.8
16
.4
23.9
76
.1
57.6
42
.5
Som
e po
stse
cond
ary
34
.3
65.7
9.
7
29
.3
49.1
11
.9
13.1
86
.9
65.6
34
.4
Bac
helo
r’s
degr
ee o
r hi
gher
27.5
72
.5
6.6
45.4
39
.4
8.6
5.8
94.2
76
.7
23.3
Tot
al S
AT
sco
re4
Les
s th
an 8
00
33.0
67
.0
6.4
38.9
45
.3
9.5
5.1
94.9
64
.7
35.3
8
00–9
99
41.3
58
.7
3.8
47.1
42
.7
6.5
4.1
95.9
78
.9
21.1
1
000–
1199
35
.1
65.0
4.
9
52
.2
38.6
4.
3
1.
8
98
.2
81.3
18
.7
120
0–13
99
44.2
55
.8
6.6
60.2
32
.6
0.7
0.4
99.6
88
.3
11.7
1
400–
1600
43
.4
56.6
5.
0
73
.3
21.7
0.
0
0.
0
10
0.0
87.6
12
.4
Gra
de p
oint
ave
rage
Mos
tly
A’s
26.6
73
.4
10.0
34
.7
42.1
13
.1
23.3
76
.7
80.9
19
.1
A’s
and
B’s
35
.2
64.8
6.
8
42
.9
45.2
5.
2
9.
0
91
.1
89.0
11
.1
Mos
tly
B’s
33.7
66
.4
5.1
37.9
45
.7
11.3
10
.4
89.6
79
.9
20.1
B
’s a
nd C
’s
34.0
66
.0
5.0
34.3
49
.8
10.9
12
.1
87.9
69
.8
30.2
M
ostl
y C
’s o
r be
low
32
.4
67.6
12
.9
34.0
40
.5
12.7
23
.6
76.4
51
.2
48.8
Aca
dem
ic a
bili
ty c
ompa
red
wit
h ot
hers
Abo
ve a
vera
ge
34.5
65
.5
9.4
39.8
41
.7
9.1
11.6
88
.4
76.1
24
.0
Ave
rage
29
.9
70.1
10
.7
27.1
44
.6
17.6
21
.1
78.9
57
.7
42.4
B
elow
ave
rage
21
.5
78.5
18
.5
27.7
39
.4
14.5
16
.2
83.9
55
.7
44.3
1 B
orro
win
g in
clud
es lo
ans
from
fed
eral
, sta
te, a
nd in
stit
utio
nal s
ourc
es u
p to
fir
st a
ttai
nmen
t (if
any
) or
last
enr
ollm
ent.
2 For
BP
S:90
/94,
ave
rage
hou
rs w
orke
d w
hile
enr
olle
d re
pres
ents
the
aver
age
num
ber
of h
ours
wor
ked
whi
le e
nrol
led
up to
fir
st a
ttai
nmen
t (if
any
) or
last
enr
ollm
ent.
3 Att
enda
nce
stat
us is
def
ined
as
perc
ent o
f m
onth
s en
roll
ed f
ull t
ime
up to
fir
st a
ttai
nmen
t (if
any
) or
last
enr
ollm
ent.
Stud
ents
wit
h ze
ro p
erce
nt o
f m
onth
s fu
ll-t
ime
are
cate
gori
zed
as e
xclu
sive
ly p
art-
tim
e. S
tude
nts
wit
h 1–
100
perc
ent o
f m
onth
s fu
ll ti
me
(inc
lude
s bo
th m
ixed
and
exc
lusi
vely
ful
l-ti
me
stud
ents
) ar
e ca
tego
rize
d as
mor
e th
an p
art-
tim
e.4 N
ot a
ll s
tude
nts
take
the
SAT
. Thu
s, in
som
e ca
ses
the
esti
mat
es in
the
tota
l row
do
not f
all w
ithi
n th
e ra
nge
of v
alue
s in
the
SAT
row
s.N
OT
E: D
ue to
the
excl
usio
n of
stu
dent
s w
ith
mis
sing
em
ploy
men
t inf
orm
atio
n, s
tude
nts
not s
eeki
ng a
deg
ree,
and
stu
dent
s at
tend
ing
priv
ate,
not
-for
-pro
fit l
ess-
than
4-y
ear
and
publ
icle
ss-t
han-
2-ye
ar in
stit
utio
ns, t
hese
est
imat
es w
ill v
ary
from
oth
er e
stim
ates
rep
orte
d us
ing
BP
S:90
/94.
SOU
RC
E: U
.S. D
epar
tmen
t of
Edu
cati
on, N
atio
nal C
ente
r fo
r E
duca
tion
Sta
tist
ics,
198
9–90
Beg
inni
ng P
osts
econ
dary
Stu
dent
s L
ongi
tudi
nal S
tudy
, Sec
ond
Foll
ow-u
p (B
PS:
90/9
4), D
ata
Ana
lysi
s Sy
stem
.
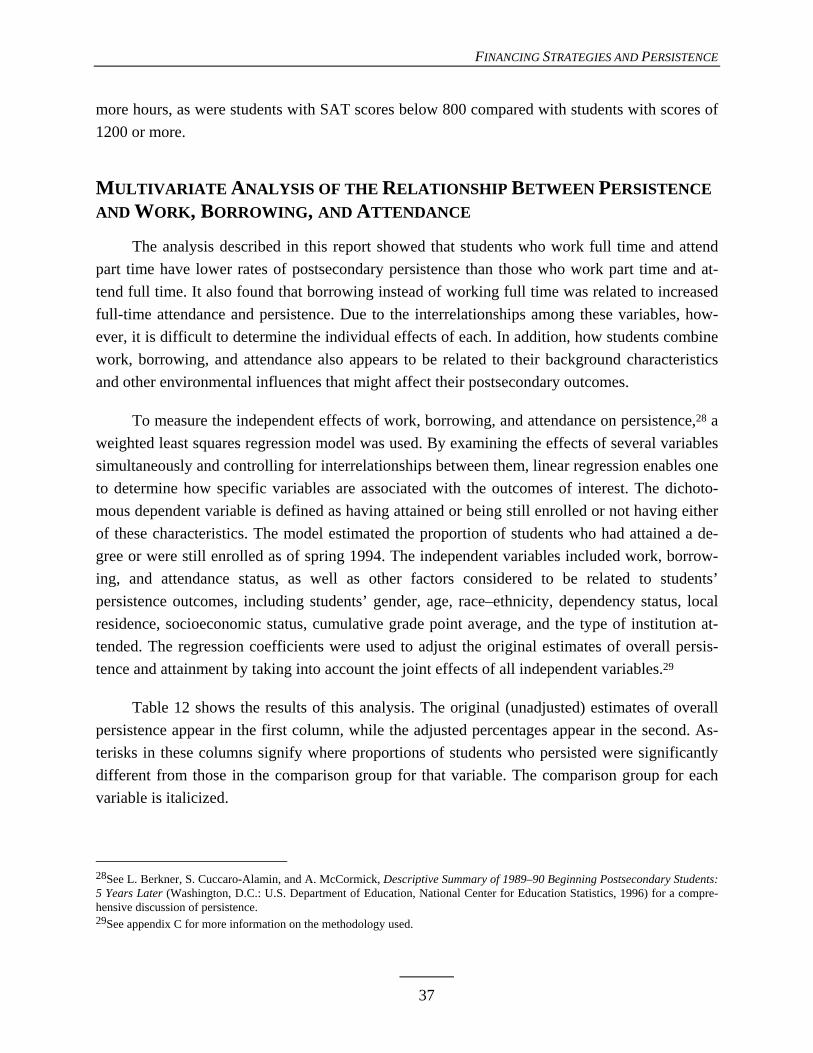
FINANCING STRATEGIES AND PERSISTENCE
more hours, as were students with SAT scores below 800 compared with students with scores of 1200 or more.
MULTIVARIATE ANALYSIS OF THE RELATIONSHIP BETWEEN PERSISTENCE AND WORK, BORROWING, AND ATTENDANCE
The analysis described in this report showed that students who work full time and attend part time have lower rates of postsecondary persistence than those who work part time and at-tend full time. It also found that borrowing instead of working full time was related to increased full-time attendance and persistence. Due to the interrelationships among these variables, how-ever, it is difficult to determine the individual effects of each. In addition, how students combine work, borrowing, and attendance also appears to be related to their background characteristics and other environmental influences that might affect their postsecondary outcomes.
To measure the independent effects of work, borrowing, and attendance on persistence,28 a weighted least squares regression model was used. By examining the effects of several variables simultaneously and controlling for interrelationships between them, linear regression enables one to determine how specific variables are associated with the outcomes of interest. The dichoto-mous dependent variable is defined as having attained or being still enrolled or not having either of these characteristics. The model estimated the proportion of students who had attained a de-gree or were still enrolled as of spring 1994. The independent variables included work, borrow-ing, and attendance status, as well as other factors considered to be related to students’ persistence outcomes, including students’ gender, age, race–ethnicity, dependency status, local residence, socioeconomic status, cumulative grade point average, and the type of institution at-tended. The regression coefficients were used to adjust the original estimates of overall persis-tence and attainment by taking into account the joint effects of all independent variables.29
Table 12 shows the results of this analysis. The original (unadjusted) estimates of overall persistence appear in the first column, while the adjusted percentages appear in the second. As-terisks in these columns signify where proportions of students who persisted were significantly different from those in the comparison group for that variable. The comparison group for each variable is italicized.
28See L. Berkner, S. Cuccaro-Alamin, and A. McCormick, Descriptive Summary of 1989–90 Beginning Postsecondary Students: 5 Years Later (Washington, D.C.: U.S. Department of Education, National Center for Education Statistics, 1996) for a compre-hensive discussion of persistence.
29See appendix C for more information on the methodology used.
37
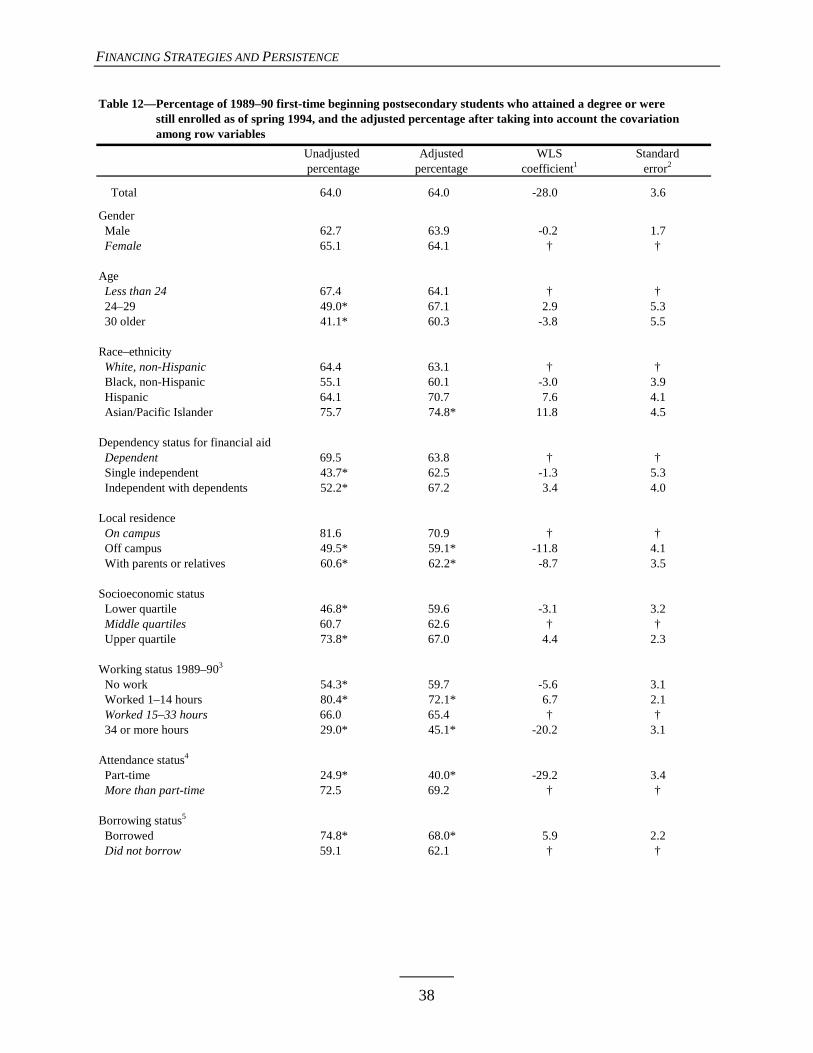
FINANCING STRATEGIES AND PERSISTENCE
Table 12—Percentage of 1989–90 first-time beginning postsecondary students who attained a degree or wereTable 12—still enrolled as of spring 1994, and the adjusted percentage after taking into account the covariationTable 12—among row variables Unadjusted Adjusted WLS Standard
percentage percentage coefficient1 error2
Total 64.0 64.0 -28.0 3.6
Gender Male 62.7 63.9 -0.2 1.7 Female 65.1 64.1 † †
Age Less than 24 67.4 64.1 † † 24–29 49.0* 67.1 2.9 5.3 30 older 41.1* 60.3 -3.8 5.5
Race–ethnicity White, non-Hispanic 64.4 63.1 † † Black, non-Hispanic 55.1 60.1 -3.0 3.9 Hispanic 64.1 70.7 7.6 4.1 Asian/Pacific Islander 75.7 74.8* 11.8 4.5
Dependency status for financial aid Dependent 69.5 63.8 † † Single independent 43.7* 62.5 -1.3 5.3 Independent with dependents 52.2* 67.2 3.4 4.0
Local residence On campus 81.6 70.9 † † Off campus 49.5* 59.1* -11.8 4.1 With parents or relatives 60.6* 62.2* -8.7 3.5
Socioeconomic status Lower quartile 46.8* 59.6 -3.1 3.2 Middle quartiles 60.7 62.6 † † Upper quartile 73.8* 67.0 4.4 2.3
Working status 1989–903
No work 54.3* 59.7 -5.6 3.1 Worked 1–14 hours 80.4* 72.1* 6.7 2.1 Worked 15–33 hours 66.0 65.4 † † 34 or more hours 29.0* 45.1* -20.2 3.1
Attendance status4
Part-time 24.9* 40.0* -29.2 3.4 More than part-time 72.5 69.2 † †
Borrowing status5
Borrowed 74.8* 68.0* 5.9 2.2 Did not borrow 59.1 62.1 † †
38
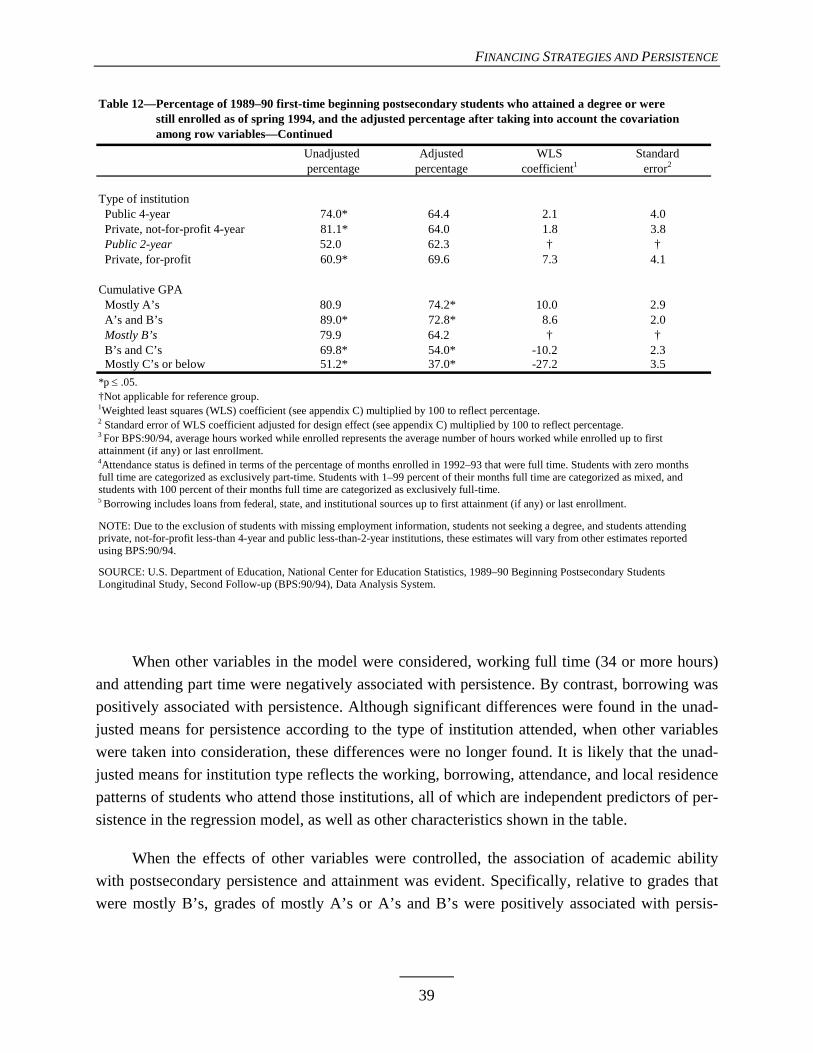
FINANCING STRATEGIES AND PERSISTENCE
Table 12—Percentage of 1989–90 first-time beginning postsecondary students who attained a degree or wereTable 12—still enrolled as of spring 1994, and the adjusted percentage after taking into account the covariationTable 12—among row variables—Continued Unadjusted Adjusted WLS Standard
percentage percentage coefficient1 error2
Type of institution Public 4-year 74.0* 64.4 2.1 4.0 Private, not-for-profit 4-year 81.1* 64.0 1.8 3.8 Public 2-year 52.0 62.3 † † Private, for-profit 60.9* 69.6 7.3 4.1
Cumulative GPA Mostly A’s 80.9 74.2* 10.0 2.9 A’s and B’s 89.0* 72.8* 8.6 2.0 Mostly B’s 79.9 64.2 † † B’s and C’s 69.8* 54.0* -10.2 2.3 Mostly C’s or below 51.2* 37.0* -27.2 3.5 *p ≤ .05.†Not applicable for reference group.1Weighted least squares (WLS) coefficient (see appendix C) multiplied by 100 to reflect percentage.2 Standard error of WLS coefficient adjusted for design effect (see appendix C) multiplied by 100 to reflect percentage.3 For BPS:90/94, average hours worked while enrolled represents the average number of hours worked while enrolled up to firstattainment (if any) or last enrollment.4Attendance status is defined in terms of the percentage of months enrolled in 1992–93 that were full time. Students with zero monthsfull time are categorized as exclusively part-time. Students with 1–99 percent of their months full time are categorized as mixed, and students with 100 percent of their months full time are categorized as exclusively full-time.5 Borrowing includes loans from federal, state, and institutional sources up to first attainment (if any) or last enrollment.
NOTE: Due to the exclusion of students with missing employment information, students not seeking a degree, and students attendingprivate, not-for-profit less-than 4-year and public less-than-2-year institutions, these estimates will vary from other estimates reportedusing BPS:90/94.
SOURCE: U.S. Department of Education, National Center for Education Statistics, 1989–90 Beginning Postsecondary Students Longitudinal Study, Second Follow-up (BPS:90/94), Data Analysis System.
When other variables in the model were considered, working full time (34 or more hours) and attending part time were negatively associated with persistence. By contrast, borrowing was positively associated with persistence. Although significant differences were found in the unad-justed means for persistence according to the type of institution attended, when other variables were taken into consideration, these differences were no longer found. It is likely that the unad-justed means for institution type reflects the working, borrowing, attendance, and local residence patterns of students who attend those institutions, all of which are independent predictors of per-sistence in the regression model, as well as other characteristics shown in the table.
When the effects of other variables were controlled, the association of academic ability with postsecondary persistence and attainment was evident. Specifically, relative to grades that were mostly B’s, grades of mostly A’s or A’s and B’s were positively associated with persis-
39
FINANCING STRATEGIES AND PERSISTENCE
tence and attainment, while grades of B’s and C’s or mostly C’s were negatively associated with persistence. Finally, although there were no differences in the unadjusted rates of persistence be-tween white, non-Hispanic students and Asian/Pacific Islander students, when adjusted for co-variation, Asian students were more likely to persist and attain than their white, non-Hispanic counterparts.
40
SUMMARY AND CONCLUSION
The way in which students combined work and attendance was strongly associated with the type of institution they attended. At public 2-year institutions, most students worked full time and attended part time, whereas the majority of students at 4-year institutions worked part time and attended full time. Students in private, for-profit institutions also attended full time but most either did not work or worked full time. Similarly, whether or not a student borrowed was also related to choice of institution, with students at higher cost institutions more likely to borrow. In general, across all categories of hours worked, if students borrowed, their likelihood of attending full time increased.
In addition to identifying the common combinations of work, borrowing, and attendance among students in different types of institutions, this analysis also focused on how these combi-nations were related to students’ persistence and attainment outcomes. For each institution type, part-time attendance reduced the likelihood of persisting compared with full-time attendance. In addition, full-time work was negatively associated with persistence and attainment, while part-time work (1–14 hours) was positively associated. Students who borrowed were also more likely to persist and attain than were nonborrowers. Although the results differed according to institu-tion type, borrowing might increase students’ likelihood of persistence by reducing their need to work full time, thereby allowing them to attend full time at higher rates.
When the effects of other variables were controlled, borrowing was still related to persis-tence and attainment. Perhaps borrowing in and of itself increases students’ commitment to de-gree completion; that is, they may have more incentive to finish because they will need a higher paying job to meet their debt burden. Alternatively, it may be that students who borrow rather than work are more committed or motivated to completing their postsecondary studies from the outset. Conversely, students who are not as committed to their schooling may choose to finance their education through work instead, thereby avoiding future debt if they decide not to complete their program.
41

THIS PAGE INTENTIONALLY LEFT BLANK
APPENDIX A—GLOSSARY
This glossary describes the variables used in this report. The variables were taken directly from the NCES NPSAS:93 undergraduate and the BPS:90/94 Data Analysis Systems (DAS), which are NCES software applications that generate tables from the NPSAS:93 and BPS:90/94 data. A description of the DAS software can be found in appendix C. The labels are in bold, capital letters and correspond to the names of the variables in the DAS. The glossary is organized into two sections: variable definitions for the NPSAS:93 and BPS:90/94 data sets, respec-tively. In the index below, the variables in each section are listed in order they appear in the report; the glossary is in alphabetical order in each section by variable name (displayed in the right-hand column).
Glossary Index
NPSAS:93
Gender of student ........................................GENDER Age as of 12/31/92 ..............................................AGE Race–ethnicity .................................................. RACE Marital status in 1992 ............................. SMARITAL Housing arrangements ................................LOCRES2 Dependency status for financial aid ............................................. DEPEND2 Income percentile ranking ............................PCTALL Income percentile ranking (dependent students)...................................................... PCTDEP Income percentile ranking (independent students)..................................................PCTINDEP Institutional level and control ..................SECTOR_B Number of months enrolled in 1992–93.........ENLEN Percentage of months enrolled full time 1992–93 .................................... ATTENST Job on or off campus .............................. JOBLOCAT Average number of hours worked per week while enrolled in 1992–93 .....EMWKHR4 Percent of months employed and enrolled ............................................ ENREMPL Amount borrowed ....................................TOTLOAN Work and borrowing status in 1992–93.......................................... WHRSBORR Working, borrowing, part-time attendance global filter .............................. FILTER1
BPS: 90/94
Gender ...................................................... H_GENDR Age ..............................................................AGE8990 Race–ethnicity of student .......................... BPSRACE Marital status ..............................................MAR8990 Local residence in 1989–90.................... LOCALRES Dependency for financial aid, 1989–90..... DEPEND2 Socioeconomic status ................................. SESPERC Educational aspirations in 1989–90............... ASPIRE Parental education ....................................... RPARED Total SAT score...................................... SATTOTAL Cumulative GPA through 1989–94....................................................CUMGPA Academic ability compared to others ...............................................COMPAREA Level and control of first institution................................................ OFCO8990 Work and borrowing status 1989–94.............................................WKBORCUM Work status 1989–90............................. WKBORR89 Intensity of enrollment..............................ATSTCUM Overall persistence and attainment ...............................................PERACUM Working, borrowing, attendance filter—global ............................................. FILTER6
43
APPENDIX A—GLOSSARY
NPSAS:93 Age as of 12/31/92 AGE
Less than 24 Student was 23 years old or younger as of 12/31/92. 24–29 Student was between 24 and 29 years old as of 12/31/92. 30 or older Student was 30 or older as of 12/31/92.
Percentage of months enrolled full time 1992–93 ATTENST This variable was calculated by dividing the number of months the student was enrolled full time by the total num-ber of months that the student was enrolled. This resulting figure was then multiplied by 100 to obtain a percentage. Values are continuous to 100.
Exclusively part-time Student attended zero percent of months full time. Mixed Student attended 1–99 percent of months full time. Exclusively full-time Student attended 100 percent of months full time.
Dependency status for financial aid DEPEND2 This variable was based upon dependency status and number of the student’s dependents, as reported on financial aid forms. After synthesizing this information, students were divided into three categories: dependent, single and without dependents of their own, and independent with dependents of their own. For purposes of this survey, spouses were considered dependents.
Dependent Student was considered financially dependent for financial aid purposes in 1992–93.
Single, independent Student was considered financially independent for financial
aid purposes and had no dependents in 1992–93. Independent with dependents Student was considered financially independent for financial
aid purposes and had dependents in 1992–93. Spouses were considered dependents.
Average number of hours worked per week while enrolled in 1992–93 EMWKHR4 The average number of hours worked per week while enrolled (including work-study). Students reported whether or not they worked while enrolled in school, and if they were employed, the average number of hours they worked per week. This variable represents only the average hours a student worked while enrolled. Thus, if a student worked an average of 20 hours per week while enrolled for 6 months and then did not work for the remaining 3 months of en-rollment, the average hours would still be 20 hours per week. Values are continuous. For this analysis, students were divided into four categories based on the average number of hours they worked while enrolled.
44
APPENDIX A—GLOSSARY
No work Student did not work while enrolled. Worked 1–14 hours Student worked 1–14 hours per week while enrolled. Worked 15–33 hours Student worked 15–33 hours per week while enrolled. Worked 34 or more hours Student worked 34 or more hours per week while enrolled.
Number of months enrolled in 1992–93 ENLEN Number of months (not necessarily full months) enrolled during the 12 months between July 1992 and June 1993. Some students were not enrolled at all during these months; for these students only, ENLEN is equal to the number of months they were enrolled during the two months of May and June 1992. Wherever possible, institution-reported data were used to determine enrollment status for each month. For any months for which institution data could not be used, student-reported data were substituted.
Less than 8 months Student was enrolled for less than 8 months during 1992–93. 8 or more months Student was enrolled for 8 months or more during 1992–93.
Percent of months employed and enrolled ENREMPL This variable was calculated by dividing the number of months during the school year that the student was em-ployed and enrolled by the number of months enrolled. This figure was then multiplied by 100 to obtain a percent-age. Values are continuous to 100. Working, borrowing, part-time attendance global filter FILTER1 This variable filters students who were not working toward a degree, had missing employment information, or were enrolled at a public less-than-2-year institution or a private, not-for-profit less-than-4-year institution and classifies them as “no.” Students with none of these criteria are classified as “yes.” Yes No Gender of student GENDER
Male Student was male.
Female Student was female.
Job on or off campus JOBLOCAT For students who worked while enrolled, indicates whether the student worked on or off campus during 1992–93 for the student’s principal job (the one held the longest).
45
APPENDIX A—GLOSSARY
On campus Student’s job was located on campus. Off campus Student’s job was located off campus.
Housing arrangements LOCRES2 Indicates if student resided in school-owned housing, off campus, or with family.
On campus Institution-owned living quarters for students. These are typi-cally institution-owned dormitories, residence halls, or other facilities.
Off campus Student lived off campus in noninstitution-owned housing but
not with his or her parents or other relatives. With parents or relatives Student lived at home with parents or other relatives.
Income percentile ranking PCTALL, PCTDEP, PCTINDEP Equal to the proportion of the sample that had an income lower than that recorded for the student in question. For PCTDEP, only dependent students are included, and for PCTINDEP, only independent students. For PCTALL, all students are included, but the ranking was calculated separately for dependent and independent students. Thus, each ranking compares the student only with other students of the same dependency status. Uses parents’ income if stu-dent is dependent, and student’s own income (including spouse’s income if married) if student is independent.
Lowest quartile Income falls at or below the lowest 25th percentile of under-
graduates’ income distribution. Middle quartiles Income falls between the 25th percentile and 75th percentile
of undergraduates’ income distribution. Highest quartile Income falls at or above the 75th percentile of undergradu-
ates’ income distribution. Race–ethnicity RACE
White, non-Hispanic A person having origins in any of the original peoples of Europe, North Africa, or the Middle East (except those of His-panic origin).
Black, non-Hispanic A person having origins in any of the black racial groups of
Africa, not of Hispanic origin. Hispanic A person of Mexican, Puerto Rican, Cuban, Central or South
American, or other Spanish culture or origin, regardless of race.
Asian/Pacific Islander A person having origins in any of the peoples of the Far East,
Southeast Asia, the Indian subcontinent, or Pacific Islands.
46
APPENDIX A—GLOSSARY
This includes people from China, Japan, Korea, the Philippine Islands, Samoa, India, and Vietnam.
American Indian/Alaskan Native A person having origins in any of the original peoples of
North America and who maintains cultural identification through tribal affiliation or community recognition.
Institutional level and control SECTOR_B Institution type by level and control. Institution level concerns the institution’s highest offering (duration of pro-gram and type of certificate, degree, or award), and control concerns the source of revenue and control of opera-tions. Note that students in public less-than-2-year and private, not-for-profit, 2- to 3-year and less-than-2-year institutions were not included.
Public 2-year Public 2- to-3-year institution. Public 4-year Public 4-year institution. Private, not-for-profit 4-year Private, independent 4-year institutions. Private, for-profit Private, for-profit less-than-2-year and 2-year or more institu-
tions.
Marital status in 1992 SMARITAL A student’s marital status as of the NPSAS interview date. In the case of this variable, institution-reported data were preferred over student-reported data for two reasons: first, the student-reported data were collected at a later date; thus, the institution-reported data more accurately reflect the student’s status at the time of the financial aid award. Second, the primary concern of the NPSAS data set is student aid, and it was on the basis of the information from the student applications that aid was awarded.
Not married Student was not married. Married Student was married. Separated Student was separated.
Amount borrowed TOTLOAN Total amount of all loans: federal, state, and institutional. This variable does not include PLUS loans. The data were primarily institution-reported, although students’ accounts were used, if institution data were not available. This variable was also used as a percent positive to indicate borrowing. Work and borrowing status in 1992–93 WHRSBORR This variable represents students’ combined work and borrowing status during the 1992–93 academic year. In con-structing the variable, students were first divided into two categories based on their borrowing status (TOTLOAN).
47
APPENDIX A—GLOSSARY
These two categories were then disaggregated according to the average number of hours the student reported work-ing per week while enrolled (EMWKHR4).
Borrowed and working unknown (excluded from this analysis) Borrowed and did not work Borrowed and worked 1–14 hours Borrowed and worked 15–33 hours per week Borrowed and worked 34 or more hours per week Did not borrow and working unknown (excluded from this analysis) Did not borrow and did not work Did not borrow and worked 1–14 hours Did not borrow and worked 15–33 hours per week Did not borrow and worked 34 or more hours per week
48
APPENDIX A—GLOSSARY
BPS: 90/94 Age AGE8990 The student’s age when began at 1989–90 referent institution. Less than 24 Student was 23 years old or younger. 24–29 Student was between 24 and 29 years old. 30 or older Student was 30 years or older. Educational aspirations in 1989–90 ASPIRE Highest level of education that the student expected to complete. Recoded from the student’s reported educational aspirations in the NPSAS survey.
Trade school Student expected to earn a vocational certificate or license, or to attend college, but not to earn a bachelor’s degree.
2-year degree Student expected to earn less than a bachelor’s degree, but
planned to attend at least 2 years. (Includes those who aspired to earn an associate’s degree.)
Bachelor’s degree Student expected to earn a bachelor’s degree, but not an ad-
vanced degree. Advanced degree Student expected to earn a master’s, doctoral, or first-
professional degree. Intensity of enrollment ATSTCUM Calculated as the percentage of months enrolled full time during the period of analysis. For nondegree attainers, this variable represents the percent of months attended full time throughout postsecondary education; for those who did attain a degree, it represents the percent of months attended full time until the first degree was attained.
Exclusively part-time Student attended zero percent of months full time. More than part-time Student attended 1–100 percent of months full time.
Race–ethnicity of student BPSRACE
White, non-Hispanic A person having origins in any of the original peoples of Europe, North Africa, or the Middle East (except those of His-panic origin).
Black, non-Hispanic A person having origins in any of the black racial groups of
Africa, not of Hispanic origin.
49

APPENDIX A—GLOSSARY
Hispanic A person of Mexican, Puerto Rican, Cuban, Central or South American or other Spanish culture or origin, regardless of race.
Asian/Pacific Islander A person having origins in any of the original peoples of the
Far East, Southeast Asia, the Indian subcontinent, or Pacific Islands. This includes people from China, Japan, Korea, the Philippine Islands, Samoa, India, and Vietnam.
American Indian/Alaskan Native A person having origins in any of the original peoples of
North America and who maintains cultural identification through tribal affiliation or community recognition.
Academic ability compared to others COMPAREA Students were asked to compare themselves academically with the average person of their age.
Above average Student considered himself/herself to have above average aca-demic ability.
Average Student considered himself/herself to have average academic
ability. Below average Student considered himself/herself to have below average aca-
demic ability. Cumulative GPA through 1989–94 CUMGPA Overall grades in postsecondary education through 1994.
Mostly A’s Student’s grade point average fell at or above 3.75. Mostly A’s and B’s Student’s grade point average fell between 3.25 and 3.75. Mostly B’s Student’s grade point average fell between 2.75 and 3.25. Mostly B’s and C’s Student’s grade point average fell between 2.25 and 2.75. Mostly C’s or below Student’s grade point average fell at or below 2.25.
Dependency for financial aid, 1989–90 DEPEND2 Categorizes independent students into two groups: those with and without dependents. These are categories that determine the type of need analysis formula used in determining financial aid eligibility. Based on dependency status, marital status, and family size.
Dependent Student was a dependent. Independent without dependents Student reported not being a dependent, and there was
only one person reported in her or his family.
50
APPENDIX A—GLOSSARY
Independent with dependents Student reported not being a dependent, and student was mar-
ried, or there were two or more people in the student’s family.
Working, borrowing, attendance filter—global FILTER6 The variable identifies and filters students from 1989–94 who were enrolled at some time in postsecondary educa-tion but were 1) not working toward a degree, 2) missing employment information, or 3) enrolled at a public less-than-2-year institution or a private, not-for-profit less-than-4-year institution.
No Yes
Gender H_GENDR Male Student was male. Female Student was female. Local residence in 1989–90 LOCALRES The student’s residence in school-owned housing, off campus, or with parents during the 1989–90 academic year. Residence was based on sampled term only.
On campus Student lived in institution-owned living quarters. These are
typically on-campus dormitories, residence halls, or other fa-cilities.
Off campus Student lived off campus in noninstitution-owned housing, but
not with parents or other relatives. With parents or relatives Student lived at home with parents or other relatives.
Marital status MAR8990 Marital status during month when first enrolled.
Never married Student was never married. Married Student was married. Separated, widowed, divorced Student was either married, but separated from his or her
spouse, widowed, or divorced. Level and control of first institution OFCO8990 Level and control of the NPSAS institution in academic year 1989–90. Note that this variable does not include stu-dents enrolled in public less-than-2-year or private, not-for-profit less-than-2-year or 2- to 3-year institutions.
Public 4-year Public 4-year institution. 51
APPENDIX A—GLOSSARY
Private, not-for-profit 4-year Private, not-for-profit 4-year institution.
Public 2-year Public 2- to 3-year institution. Private, for-profit Private, for-profit institution.
Overall persistence and attainment PERACUM Aggregated version of overall persistence and attainment variable. The overall persistence and attainment outcomes were derived by categorizing the students’ persistence paths from initial enrollment until follow-up in 1994. Two categories were used:
Attained or still enrolled Student had attained a degree or was still enrolled as of spring of 1994.
No degree, not enrolled Student had not attained a degree and was no longer enrolled
as of spring 1994. Parental education RPARED Highest level of education completed by either parent.
Less than high school Neither parent graduated from high school or received a GED (General Educational Development) certificate.
High school graduate One or both parents graduated from high school or received a
GED certificate. Some postsecondary One or both parents had some postsecondary education, but
less than a bachelor’s degree, including an associate’s degree. Bachelor’s degree or higher One or both parents earned a bachelor’s degree, or an ad-
vanced degree such as a master’s degree, Ph.D., MD., and so on.
Total SAT score SATTOTAL Represents combined verbal and quantitative SAT scores.
Less than 800 Student scored less than 800 on verbal and quantitative tests, cumulatively.
800–999 Student scored 800–999 on the verbal and quantitative SAT. 1000–1199 Student scored 1000–1199 on the verbal and quantitative
SAT. 1200–1399 Student scored 1200–1399 on the verbal and quantitative
SAT.
52
APPENDIX A—GLOSSARY
1400–1600 Student scored 1400–1600 on the verbal and quantitative SAT.
Socioeconomic status SESPERC Composite variable combining parent’s education and occupation, dependent student’s family income, and the exis-tence of a series of material possessions in respondent’s home. Applies only to first-year freshmen.
Lowest quartile Socioeconomic status fell at or below the lowest 25th percen-tile.
Middle quartiles Socioeconomic status fell between the 25th percentile and the
75th percentile.
Highest quartile Socioeconomic status fell at or above the 75th percentile. Work and borrowing status 1989–94 WKBORCUM For degree attainers, this variable represents the student’s combined working and borrowing status through the first degree and was derived from the number of hours worked per week while enrolled through the first degree and whether they received a nonfamily loan through the first degree. For students who did not attain a degree, the variable represents their combined working and borrowing status through last enrollment and was derived using the average number of hours worked per week while enrolled and whether they received a nonfamily loan while enrolled. Both groups of students were classified as either borrowers or nonborrowers, and then were divided into categories based on the number of hours they worked while enrolled.
Borrowed and working unknown (excluded from this analysis) Borrowed and did not work Borrowed and worked, 1–14 hours Borrowed and worked, 15–33 hours per week Borrowed and worked, 34 or more hours per week Did not borrow and working unknown (excluded from this analysis) Did not borrow and did not work Did not borrow and worked, 1–14 hours Did not borrow and worked, 15–33 hours per week Did not borrow and worked, 34 or more hours per week
Work status 1989–1990 WKBORR89 Work and borrowing status AY 1989–90. The variable represents a student’s combined borrowing and working status using average number of hours worked while enrolled during the 1989–90 academic year. Students were grouped according to borrowing status using the variable NFLOAN89 which indicates whether the student ever received a nonfamily loan at any postsecondary institution they attended during the 1989–90 academic year. Stu-dents were then classified according to working status using the variable HRS8990 which indicates the average number of hours worked while enrolled during the 1989–90 academic year. For this analysis, students who were missing on HRS8990 were classified as working unknown. The others were categorized into the following four groups:
53
APPENDIX A—GLOSSARY
No work Worked, 1–14 hours Worked, 15–33 hours Worked, 34 or more hours
54
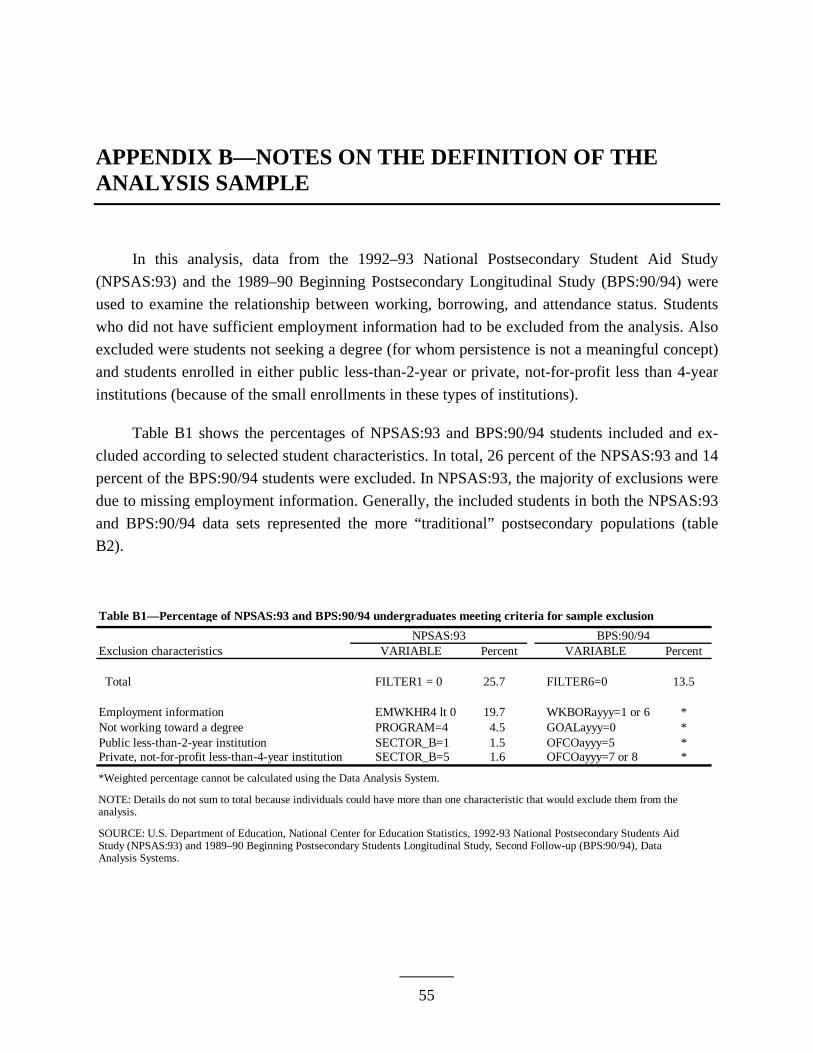
APPENDIX B—NOTES ON THE DEFINITION OF THE ANALYSIS SAMPLE
In this analysis, data from the 1992–93 National Postsecondary Student Aid Study (NPSAS:93) and the 1989–90 Beginning Postsecondary Longitudinal Study (BPS:90/94) were used to examine the relationship between working, borrowing, and attendance status. Students who did not have sufficient employment information had to be excluded from the analysis. Also excluded were students not seeking a degree (for whom persistence is not a meaningful concept) and students enrolled in either public less-than-2-year or private, not-for-profit less than 4-year institutions (because of the small enrollments in these types of institutions).
Table B1 shows the percentages of NPSAS:93 and BPS:90/94 students included and ex-cluded according to selected student characteristics. In total, 26 percent of the NPSAS:93 and 14 percent of the BPS:90/94 students were excluded. In NPSAS:93, the majority of exclusions were due to missing employment information. Generally, the included students in both the NPSAS:93 and BPS:90/94 data sets represented the more “traditional” postsecondary populations (table B2).
Table B1—Percentage of NPSAS:93 and BPS:90/94 undergraduates meeting criteria for sample exclusionNPSAS:93 BPS:90/94
Exclusion characteristics VARIABLE Percent VARIABLE Percent
Total FILTER1 = 0 25.7 FILTER6=0 13.5
Employment information EMWKHR4 lt 0 19.7 WKBORayyy=1 or 6 *Not working toward a degree PROGRAM=4 4.5 GOALayyy=0 *Public less-than-2-year institution SECTOR_B=1 1.5 OFCOayyy=5 *Private, not-for-profit less-than-4-year institution SECTOR_B=5 1.6 OFCOayyy=7 or 8 *
*Weighted percentage cannot be calculated using the Data Analysis System.
NOTE: Details do not sum to total because individuals could have more than one characteristic that would exclude them from theanalysis.
SOURCE: U.S. Department of Education, National Center for Education Statistics, 1992-93 National Postsecondary Students AidStudy (NPSAS:93) and 1989–90 Beginning Postsecondary Students Longitudinal Study, Second Follow-up (BPS:90/94), DataAnalysis Systems.
55
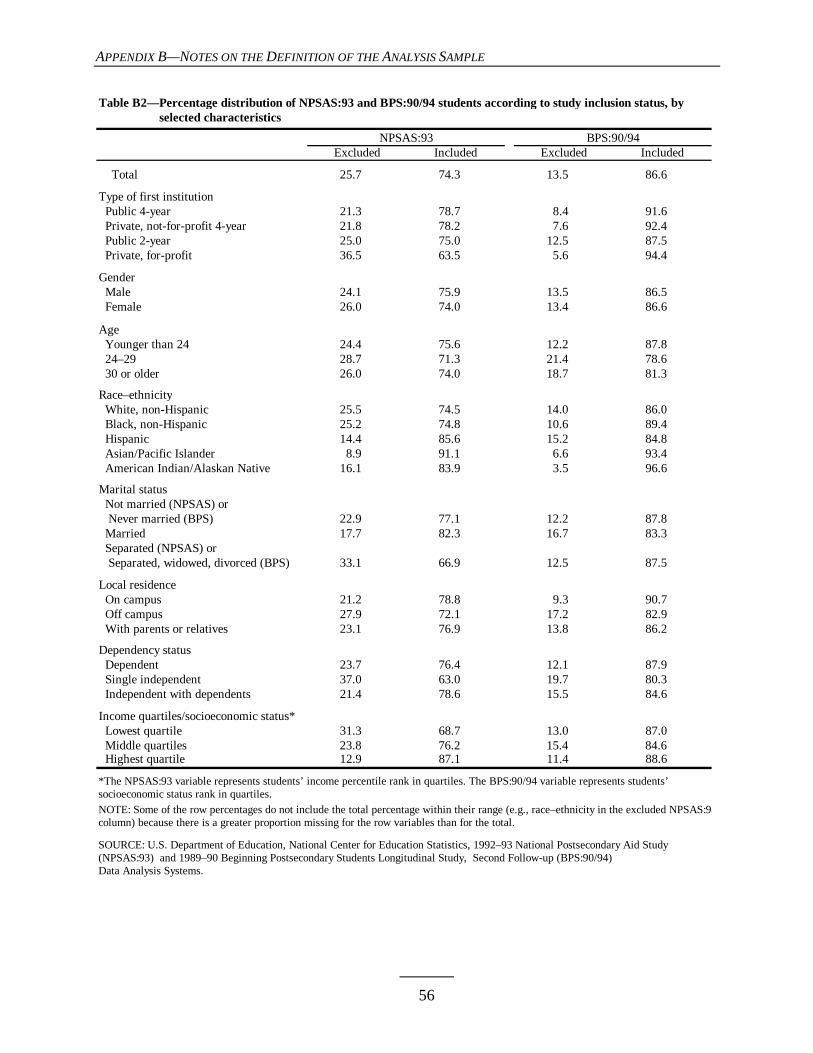
APPENDIX B—NOTES ON THE DEFINITION OF THE ANALYSIS SAMPLE
Table B2—Percentage distribution of NPSAS:93 and BPS:90/94 students according to study inclusion status, byTable B2—selected characteristics
NPSAS:93 BPS:90/94 Excluded Included Excluded Included
Total 25.7 74.3 13.5 86.6
Type of first institution Public 4-year 21.3 78.7 8.4 91.6 Private, not-for-profit 4-year 21.8 78.2 7.6 92.4 Public 2-year 25.0 75.0 12.5 87.5 Private, for-profit 36.5 63.5 5.6 94.4
Gender Male 24.1 75.9 13.5 86.5 Female 26.0 74.0 13.4 86.6
Age Younger than 24 24.4 75.6 12.2 87.8 24–29 28.7 71.3 21.4 78.6 30 or older 26.0 74.0 18.7 81.3
Race–ethnicity White, non-Hispanic 25.5 74.5 14.0 86.0 Black, non-Hispanic 25.2 74.8 10.6 89.4 Hispanic 14.4 85.6 15.2 84.8 Asian/Pacific Islander 8.9 91.1 6.6 93.4 American Indian/Alaskan Native 16.1 83.9 3.5 96.6
Marital status Not married (NPSAS) or Never married (BPS) 22.9 77.1 12.2 87.8 Married 17.7 82.3 16.7 83.3 Separated (NPSAS) or Separated, widowed, divorced (BPS) 33.1 66.9 12.5 87.5
Local residence On campus 21.2 78.8 9.3 90.7 Off campus 27.9 72.1 17.2 82.9 With parents or relatives 23.1 76.9 13.8 86.2
Dependency status Dependent 23.7 76.4 12.1 87.9 Single independent 37.0 63.0 19.7 80.3 Independent with dependents 21.4 78.6 15.5 84.6
Income quartiles/socioeconomic status* Lowest quartile 31.3 68.7 13.0 87.0 Middle quartiles 23.8 76.2 15.4 84.6 Highest quartile 12.9 87.1 11.4 88.6
*The NPSAS:93 variable represents students’ income percentile rank in quartiles. The BPS:90/94 variable represents students’ socioeconomic status rank in quartiles.NOTE: Some of the row percentages do not include the total percentage within their range (e.g., race–ethnicity in the excluded NPSAS:93column) because there is a greater proportion missing for the row variables than for the total.
SOURCE: U.S. Department of Education, National Center for Education Statistics, 1992–93 National Postsecondary Aid Study(NPSAS:93) and 1989–90 Beginning Postsecondary Students Longitudinal Study, Second Follow-up (BPS:90/94) Data Analysis Systems.
56
APPENDIX B—NOTES ON THE DEFINITION OF THE ANALYSIS SAMPLE
57
NPSAS:93
Students from private, for-profit institutions were more likely to be excluded than were stu-dents from any other institution type. White and black students were more likely to be excluded than were Hispanic or Asian/Pacific Islander students. Generally, excluded students tended to be older rather than younger, independent without dependents rather than dependent, or living off rather than on campus. Finally, students from the lowest income categories were most likely to be excluded.
BPS:90/94
In the BPS:90/94 sample, students in public 2-year institutions were more likely than stu-dents in any other type of institution to be excluded. This may reflect the large proportion of nondegree-seeking students who attend community colleges. Unlike students in the NPSAS:93 sample, BPS:90/94 students did not differ in their sample inclusion status on the basis of their age. Similar to those in the NPSAS:93 sample, single independent students were more likely to be excluded than dependent students. Likewise, students who lived off campus or with their par-ents were more likely than students who lived on campus to be excluded. Finally, students from the middle income categories were more likely to be excluded than students from the highest in-come group.
COMPARISON OF ATTENDANCE STATUS
Table B3 presents the distribution of attendance status for the NPSAS:93 and BPS:90/94 samples. For both the NPSAS:93 and BPS:90/94 samples, exclusively part-time attendance was more likely among students age 24 and over than students under age 24, independent students compared with dependent students, married students compared with students who were not mar-ried (NPSAS) or never married (BPS),30 and students who lived off campus or with their parents compared to students who lived on campus.
The 1989–90 first-time beginning students were as likely to have mixed attendance pat-terns as they were to attend exclusively full time (43 percent versus 40 percent), and the demo-graphic characteristics of these groups resembled the group of exclusively full-time students from the NPSAS:93 sample. Specifically, like their NPSAS:93 counterparts who attended exclu-
30Among NPSAS students, married students were more likely than separated students to attend exclusively part-time, but among BPS students, married students attended exclusively part time in about the same proportion as separated, divorced, or widowed students.

APPENDIX B—NOTES ON THE DEFINITION OF THE ANALYSIS SAMPLE
sively full-time, both first-time beginning students with mixed and exclusively full-time atten-dance were more likely to be under age 24 rather than over age 24, dependent than independent, not married rather than married, and more likely to live on campus than off campus. For analysis purposes, therefore, both mixed and full-time attendance were combined for the BPS:90/94 sam-ple and identified as attending exclusively or partly full time.
Table B3—Percentage distribution of NPSAS:93 and BPS:90/94 students according to attendance status* by selectedTable b.4—demographic characteristics
NPSAS:93 BPS:90/94 Exclusively Exclusively Exclusively Exclusively part-time Mixed full-time part-time Mixed full-time Total 43.0 15.9 41.1 17.8 42.7 39.5
Age as of 12/31/92 Less than 24 23.9 19.2 56.9 12.1 46.7 41.2 24–29 57.9 15.2 26.9 47.1 18.1 34.8 30 or older 72.7 9.7 17.6 53.4 20.3 26.4
Dependency status Dependent 22.9 19.2 57.9 9.2 48.3 42.5 Single independent 55.2 15.2 29.6 42.6 32.5 25.0 Independent with dependents 66.2 11.5 22.3 45.2 20.4 34.5
Marital status Not married (NPSAS) or Never married (BPS) 32.9 17.7 49.4 12.4 46.3 41.3 Married 69.4 11.1 19.5 48.6 22.6 28.8 Separated (NPSAS) or Separated, widowed, or divorced (BPS) 49.2 15.2 35.6 45.1 21.0 34.0
Local residence On campus 6.8 13.4 79.8 2.0 47.6 50.4 Off campus 53.9 14.4 31.7 36.8 29.9 33.3 With parents or relatives 38.4 20.0 41.6 16.8 47.7 35.6
*Attendance status is defined in terms of the percentage of months enrolled in 1992–93 that were full time. Students with zero monthsfull time are categorized as exclusively part-time. Students with 1–99 percent of their months full time are categorized as mixed, and students with 100 percent of their months full time are categorized as exclusively full-time.
NOTE: Due to the exclusion of students with missing employment information, students not seeking a degree, and students attendingprivate, not-for-profit less-than 4-year and public less-than-2-year institutions, all estimates will vary from prior estimates reportedusing NPSAS:93 and BPS:90/94.
SOURCE: U.S. Department of Education, National Center for Education Statistics, 1992–93 National Postsecondary Student Aid Study (NPSAS:93), and 1989–90 Beginning Postsecondary Students Longitudinal Study, Second Follow-up (BPS:90/94),Data Analysis Systems.
58
APPENDIX C—TECHNICAL NOTES AND METHODOLOGY
THE 1992–93 NATIONAL POSTSECONDARY STUDENT AID STUDY
The need for a nationally representative database on postsecondary student financial aid prompted the U.S. Department of Education to initiate the National Postsecondary Student Aid Study (NPSAS), a cross-sectional survey conducted every 3 years starting in 1987. The NPSAS sample was designed to include students enrolled in all types of postsecondary education. How-ever, service academies were not included in the institution sample because of their unique fund-ing and tuition base, and certain other institutions were also excluded.31 In addition to a computer-assisted telephone interview (CATI) of students and parents, the NPSAS surveys col-lect students’ registrarial and financial aid information directly from the sampled institutions. To provide the full range of information on financing postsecondary education, NPSAS samples both aided and nonaided students.
NPSAS:93 included a stratified sample of approximately 66,000 eligible students (about 52,000 of whom were undergraduates) from about 1,100 institutions. Students were included in the sample if they attended a NPSAS-eligible institution; were enrolled between July 1, 1992 and June 30, 1993; and were enrolled in one or more courses or programs including courses for credit, a degree or formal award program of at least 3 months’ duration, or an occupationally or vocationally specific program of at least 3 months’ duration. Regardless of their postsecondary status, however, students who were also enrolled in high school were excluded.
The 1992–93 NPSAS survey sample, while representative and statistically accurate, was not a simple random sample. Instead, the survey sample was selected using a more complex three-step procedure with stratified samples and differential probabilities of selection at each level. First, postsecondary institutions were initially selected within geographical strata. Once institutions were organized by zip code and state, they were further stratified by control (i.e., public; private, not-for-profit; or private, for-profit) and offering (less-than-2-year, 2- to 3-year,
31Other excluded institutions were those offering only avocational, recreational, or remedial courses; those offering only in-house business courses; those offering only programs of less than 3 months’ duration; and those offering only correspondence courses.
59

APPENDIX C—TECHNICAL NOTES AND METHODOLOGY
4-year nondoctorate-granting, and 4-year doctorate-granting). Sampling rates for students en-rolled at different institutions and levels (undergraduate or other) varied, resulting in better data for policy purposes, but at a cost to statistical efficiency.
For each student in the NPSAS sample, there were up to three sources of data. First, insti-tution registration and financial aid records were extracted. Second, a Computer-Assisted Tele-phone Interview (CATI) was conducted with each student. Finally, a CATI designed for the parents or guardians of a subsample of students was conducted. Data from these three sources were synthesized into a single system with an overall response rate of about 85 percent.
For more information on the NPSAS survey, consult Methodology Report for the 1993 Na-tional Postsecondary Student Aid (Washington, D.C.: U.S. Department of Education, National Center for Education Statistics, NCES 95-211).
BEGINNING POSTSECONDARY STUDENTS LONGITUDINAL STUDY
The Beginning Postsecondary Students Longitudinal Study (BPS:90/94) followed students from the NPSAS:90 sample who were identified as first-time beginning (FTB) students in aca-demic year 1989–90. A CATI was conducted 2 and 4 years after the base year that collected in-formation concerning enrollment, program completion, education financing, employment, and family formation; graduate school access and enrollment; and civic participation. The data de-rived from this survey permit a variety of analyses concerning postsecondary persistence and completion, entry into the work force, and civic participation.
Unlike other NCES longitudinal surveys based on grade-specific cohorts (such as High School and Beyond), the BPS design allows for the increasing numbers of “nontraditional” post-secondary students, such as those who have delayed their education due to financial needs or family responsibilities. Students who began their postsecondary studies before 1989–90, stopped out, and then returned to their studies in 1989–90 were not included, nor were students who were still enrolled in high school.
The BPS survey sample, while representative and statistically accurate, is also not a simple random sample. Instead, the samples are selected using a more complex three-step procedure with stratified samples and differential probabilities of selection at each level. The same three-stage procedure described for NPSAS applies to BPS.
60
APPENDIX C—TECHNICAL NOTES AND METHODOLOGY
For more information on BPS:90/94, consult Beginning Postsecondary Students Longitudi-nal Study Second Follow-up (BPS:90/94) Final Technical Report (Washington, D.C.: U.S. De-partment of Education, National Center for Education Statistics, NCES 96-153).
ACCURACY OF ESTIMATES
The statistics in this report are estimates derived from a sample. Two broad categories of error occur in such estimates: sampling and nonsampling errors. Sampling errors occur because observations are made only on samples of students, not on entire populations. Nonsampling er-rors occur not only in sample surveys but also in complete censuses of entire populations. Non-sampling errors can be attributed to a number of sources: inability to obtain complete information about all students in all institutions in the sample (some students or institutions re-fused to participate, or students participated but answered only certain items); ambiguous defini-tions; differences in interpreting questions; inability or unwillingness to give correct information; mistakes in recording or coding data; and other errors of collecting, processing, sampling, and imputing missing data.
DATA ANALYSIS SYSTEM
The estimates presented in this report were produced using the NPSAS:93 Undergraduate and BPS:90/94 Data Analysis Systems (DAS). The DAS software makes it possible for users to specify and generate their own tables from the NPSAS and BPS data. With the DAS, users can replicate or expand upon the tables presented in this report. In addition to the table estimates, the DAS calculates proper standard errors32 and weighted sample sizes for these estimates. For ex-ample, table C1 contains standard errors that correspond to table 4 in the text, and was generated by the NPSAS:93 DAS. If the number of valid cases is too small to produce a reliable estimate (fewer than 30 cases), the DAS prints the message “low-N” instead of the estimate.
In addition to tables, the DAS will also produce a correlation matrix of selected variables to be used for linear regression models. Included in the output with the correlation matrix are the de-sign effects (DEFTs) for each variable in the matrix. Since statistical procedures generally
32The NPSAS and BPS samples are not simple random samples and, therefore, simple random sample techniques for estimating sampling error cannot be applied to these data. The DAS takes into account the complexity of the sampling procedures and cal-culates standard errors appropriate for such samples. The method for computing sampling errors used by the DAS involves ap-proximating the estimator by the linear terms of a Taylor series expansion. The procedure is typically referred to as the Taylor series method.
61
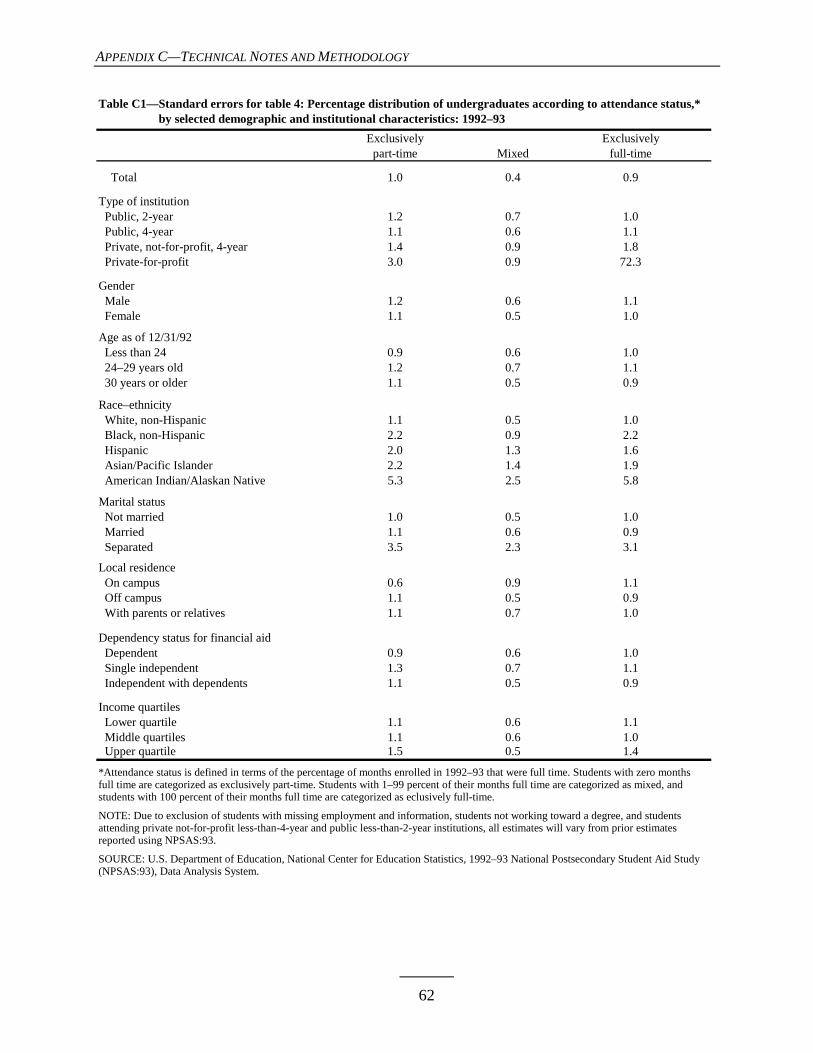
APPENDIX C—TECHNICAL NOTES AND METHODOLOGY
Table C1—Standard errors for table 4: Percentage distribution of undergraduates according to attendance status,* Table C1—by selected demographic and institutional characteristics: 1992–93 Exclusively Exclusively part-time Mixed full-time Total 1.0 0.4 0.9
Type of institution Public, 2-year 1.2 0.7 1.0 Public, 4-year 1.1 0.6 1.1 Private, not-for-profit, 4-year 1.4 0.9 1.8 Private-for-profit 3.0 0.9 72.3
Gender Male 1.2 0.6 1.1 Female 1.1 0.5 1.0
Age as of 12/31/92 Less than 24 0.9 0.6 1.0 24–29 years old 1.2 0.7 1.1 30 years or older 1.1 0.5 0.9
Race–ethnicity White, non-Hispanic 1.1 0.5 1.0 Black, non-Hispanic 2.2 0.9 2.2 Hispanic 2.0 1.3 1.6 Asian/Pacific Islander 2.2 1.4 1.9 American Indian/Alaskan Native 5.3 2.5 5.8
Marital status Not married 1.0 0.5 1.0 Married 1.1 0.6 0.9 Separated 3.5 2.3 3.1
Local residence On campus 0.6 0.9 1.1 Off campus 1.1 0.5 0.9 With parents or relatives 1.1 0.7 1.0
Dependency status for financial aid Dependent 0.9 0.6 1.0 Single independent 1.3 0.7 1.1 Independent with dependents 1.1 0.5 0.9 Income quartiles Lower quartile 1.1 0.6 1.1 Middle quartiles 1.1 0.6 1.0 Upper quartile 1.5 0.5 1.4
*Attendance status is defined in terms of the percentage of months enrolled in 1992–93 that were full time. Students with zero monthsfull time are categorized as exclusively part-time. Students with 1–99 percent of their months full time are categorized as mixed, and students with 100 percent of their months full time are categorized as eclusively full-time.
NOTE: Due to exclusion of students with missing employment and information, students not working toward a degree, and studentsattending private not-for-profit less-than-4-year and public less-than-2-year institutions, all estimates will vary from prior estimatesreported using NPSAS:93.
SOURCE: U.S. Department of Education, National Center for Education Statistics, 1992–93 National Postsecondary Student Aid Study(NPSAS:93), Data Analysis System.
62
APPENDIX C—TECHNICAL NOTES AND METHODOLOGY
compute regression coefficients based on simple random sample assumptions, the standard errors must be adjusted with the design effects to take into account the NPSAS stratified sampling method. (See discussion under “Statistical Procedures” below for the adjustment procedure.)
The DASs can be accessed electronically at www.PEDAR-DAS.org. For more information about the NPSAS:93 and BPS:90/94 Data Analysis Systems, contact:
Aurora D’Amico NCES Postsecondary and Educational Outcomes Longitudinal Studies 555 New Jersey Avenue, NW Washington, DC 20208-5652 (202) 219-1365 Internet address: Aurora_D’[email protected]
STATISTICAL PROCEDURES
Two types of statistical procedures were employed in this report: testing differences be-tween means, and adjustment of means after controlling for covariation among a group of vari-ables. Each procedure is described below.
Differences Between Means
The descriptive comparisons were tested in this report using Student’s t statistic. Differ-ences between estimates are tested against the probability of a Type I error, or significance level. The significance levels were determined by calculating the Student’s t values for the differences between each pair of means or proportions and comparing these with published tables of signifi-cance levels for two-tailed hypothesis testing.
Student’s t values may be computed to test the difference between estimates with the fol-lowing formula:
t = E - E
se +se1 2
12
22
where E1 and E2 are the estimates to be compared and se1 and se2 are their corresponding stan-dard errors. Note that this formula is valid only for independent estimates. When the estimates were not independent (for example, when comparing a total percentage with that for a subgroup that is included in the total), a covariance term was added to the denominator of the t-test for-mula. 63

APPENDIX C—TECHNICAL NOTES AND METHODOLOGY
There are hazards in reporting statistical tests for each comparison. First, comparisons based on large t statistics may appear to merit special attention. This can be misleading, since the magnitude of the t statistic is related not only to the observed differences in means or percent-ages but also to the number of students in the specific categories used for comparison. Hence, a small difference compared across a large number of students would produce a large t statistic.
A second hazard in reporting statistical tests for each comparison occurs when making multiple comparisons among categories of an independent variable. For example, when making paired comparisons among different levels of income, the probability of a Type I error for these comparisons taken as a group is larger than the probability for a single comparison. When more than one difference between groups of related characteristics or “families” are tested for statisti-cal significance, one must apply a standard that assures a level of significance for all of those comparisons taken together.
Comparisons were made in this report only when p ≤ .05/k for a particular pairwise com-parison, where that comparison was one of k tests within a family. This guarantees both that the individual comparison would have p ≤ .05 and that for k comparisons within a family of possible comparisons, the significance level for all the comparisons will sum to p ≤.05.33
For example, in a comparison of the percentages of males and females who enrolled exclu-sively part time in postsecondary education only one comparison is possible (males versus fe-males). In this family, k=1, and the comparison can be evaluated without adjusting the significance level. When students are divided into five racial–ethnic groups and all possible comparisons are made, then k=10 and the significance level of each test must be p ≤.05/10, or p ≤ .005. The formula for calculating family size (k) is as follows:
k =
j(j -1)2
where j is the number of categories for the variable being tested. In the case of race–ethnicity, there are five racial–ethnic groups (American Indian, Asian/Pacific Islander, black non-Hispanic, Hispanic, and white non-Hispanic), so substituting 5 for j in equation 2,
k =
5(5 -1)2
=10
33The standard that p <.05/k for each comparison is more stringent than the criterion that the significance level of the compari-sons should sum to p <.05. For tables showing the t statistic required to ensure that p <.05/k for a particular family size and de-
64

APPENDIX C—TECHNICAL NOTES AND METHODOLOGY
Adjustment of Means to Control for Background Variation
Tabular results are limited by sample size when attempting to control for additional factors that may account for the variation observed between two variables. For example, when examin-ing the percentages of those who completed a degree or were still enrolled in postsecondary edu-cation five years after their initial enrollment, it is impossible to know to what extent the observed variation is due to socioeconomic status (SES) differences and to what extent it is due to differences in other factors related to SES, such as type of institution attended, intensity of en-rollment, and so on. However, if a nested table were produced showing SES within type of insti-tution attended, within enrollment intensity, the cell sizes would be too small to identify the patterns. When the sample size becomes too small to support controls for another level of varia-tion, one must use other methods to take such variation into account.
To overcome this difficulty, multiple linear regression was used to obtain means that were adjusted for covariation among a list of control variables. Adjusted means for subgroups were obtained by regressing the dependent variable on a set of descriptive variables such as gender, race–ethnicity, SES, etc. Substituting ones or zeros for the subgroup characteristic(s) of interest and the mean proportions for the other variables results in an estimate of the adjusted proportion for the specified subgroup, holding all other variables constant. For example, consider a hypo-thetical case in which two variables, age and gender, are used to describe an outcome, Y (such as attaining a degree). The variables age and gender are recoded into a dummy variable represent-ing age, A, and a dummy variable representing gender, G:
Age A 24 years or older 1 Under 24 years old 0
and
Gender G Female 1 Male 0
The following regression equation is then estimated from the correlation matrix output from the DAS:
ˆ Y a b1A b2G
grees of freedom, see Olive Jean Dunn, “Multiple Comparisons Among Means,” Journal of the American Statistical Association 56 (1961): 52–64.
65
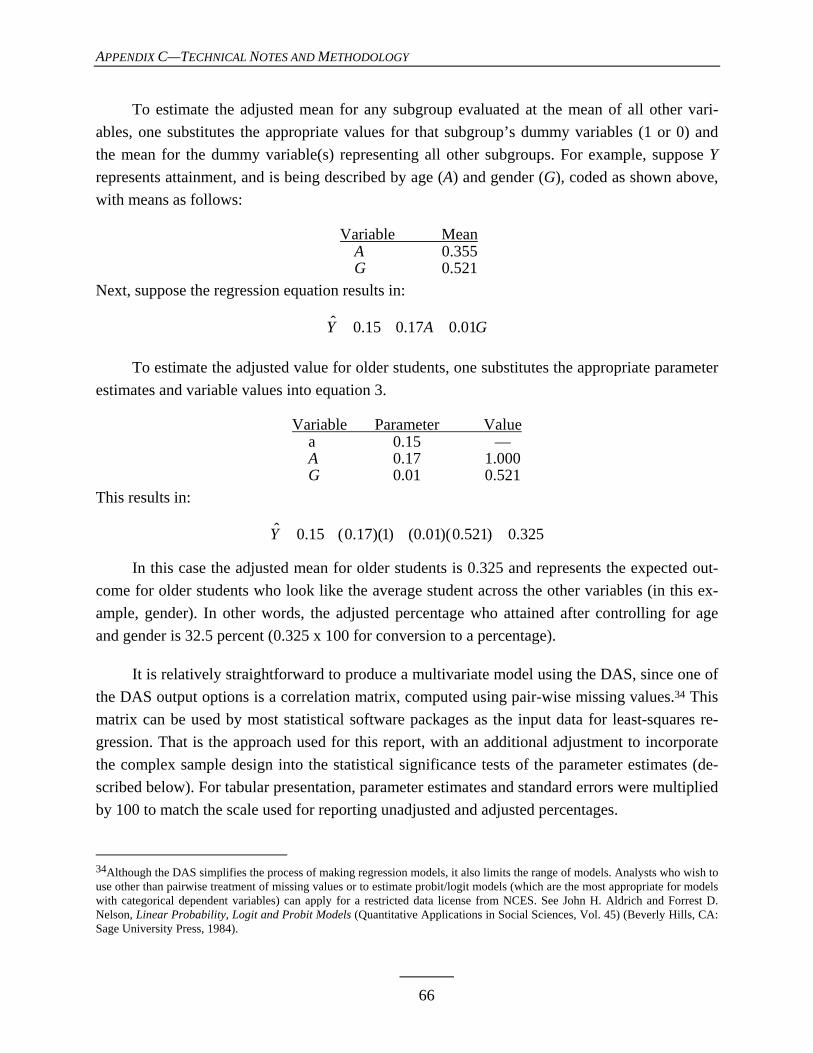
APPENDIX C—TECHNICAL NOTES AND METHODOLOGY
To estimate the adjusted mean for any subgroup evaluated at the mean of all other vari-ables, one substitutes the appropriate values for that subgroup’s dummy variables (1 or 0) and the mean for the dummy variable(s) representing all other subgroups. For example, suppose Y represents attainment, and is being described by age (A) and gender (G), coded as shown above, with means as follows:
Variable Mean A 0.355 G 0.521 Next, suppose the regression equation results in:
ˆ Y 0.15 0.17A 0.01G
To estimate the adjusted value for older students, one substitutes the appropriate parameter estimates and variable values into equation 3.
Variable Parameter Value a 0.15 — A 0.17 1.000 G 0.01 0.521 This results in:
ˆ Y 0.15 (0.17)(1) (0.01)(0.521) 0.325
In this case the adjusted mean for older students is 0.325 and represents the expected out-come for older students who look like the average student across the other variables (in this ex-ample, gender). In other words, the adjusted percentage who attained after controlling for age and gender is 32.5 percent (0.325 x 100 for conversion to a percentage).
It is relatively straightforward to produce a multivariate model using the DAS, since one of the DAS output options is a correlation matrix, computed using pair-wise missing values.34 This matrix can be used by most statistical software packages as the input data for least-squares re-gression. That is the approach used for this report, with an additional adjustment to incorporate the complex sample design into the statistical significance tests of the parameter estimates (de-scribed below). For tabular presentation, parameter estimates and standard errors were multiplied by 100 to match the scale used for reporting unadjusted and adjusted percentages.
34Although the DAS simplifies the process of making regression models, it also limits the range of models. Analysts who wish to use other than pairwise treatment of missing values or to estimate probit/logit models (which are the most appropriate for models with categorical dependent variables) can apply for a restricted data license from NCES. See John H. Aldrich and Forrest D. Nelson, Linear Probability, Logit and Probit Models (Quantitative Applications in Social Sciences, Vol. 45) (Beverly Hills, CA: Sage University Press, 1984).
66

APPENDIX C—TECHNICAL NOTES AND METHODOLOGY
Most statistical software packages assume simple random sampling when computing stan-dard errors of parameter estimates. Because of the complex sampling design used for the BPS surveys, this assumption is incorrect. A better approximation of their standard errors is to multi-ply each standard error by the design effect associated with the independent variable (DEFT),35 where the DEFT is the ratio of the true standard error to the standard error computed under the assumption of simple random sampling. It is calculated by the DAS and produced with the corre-lation matrix.
35The adjustment procedure and its limitations are described in C.J. Skinner, D. Holt, and T.M.F. Smith, eds., Analysis of Com-plex Surveys (New York: John Wiley & Sons, 1989).
67