Statistical Analysis KSE966/986 Seminar Uichin Lee Oct. 19, 2012.
28
Statistical Analysis KSE966/986 Seminar Uichin Lee Oct. 19, 2012
-
Upload
bethanie-kimberly-singleton -
Category
Documents
-
view
216 -
download
2
Transcript of Statistical Analysis KSE966/986 Seminar Uichin Lee Oct. 19, 2012.

Statistical Analysis
KSE966/986 Seminar Uichin Lee
Oct. 19, 2012

Overview
• Preparing data for statistical analysis• Descriptive statistics• Comparing means• T tests• Analysis of variance (ANOVA)• Assumptions of t tests and F tests• Identifying relationships• Regression• Nonparametric statistical tests

Preparing data for analysis
• Cleaning up data– Detect errors– Formatting
• Coding – Types of data that need to be coded– Be consistent
• Organizing the data– Accommodate to the requirements of statistical software

Descriptive statistics
• Measures of central tendency– Mean– Median– Mode
• Measures of spread– Range– Variance– Standard deviations
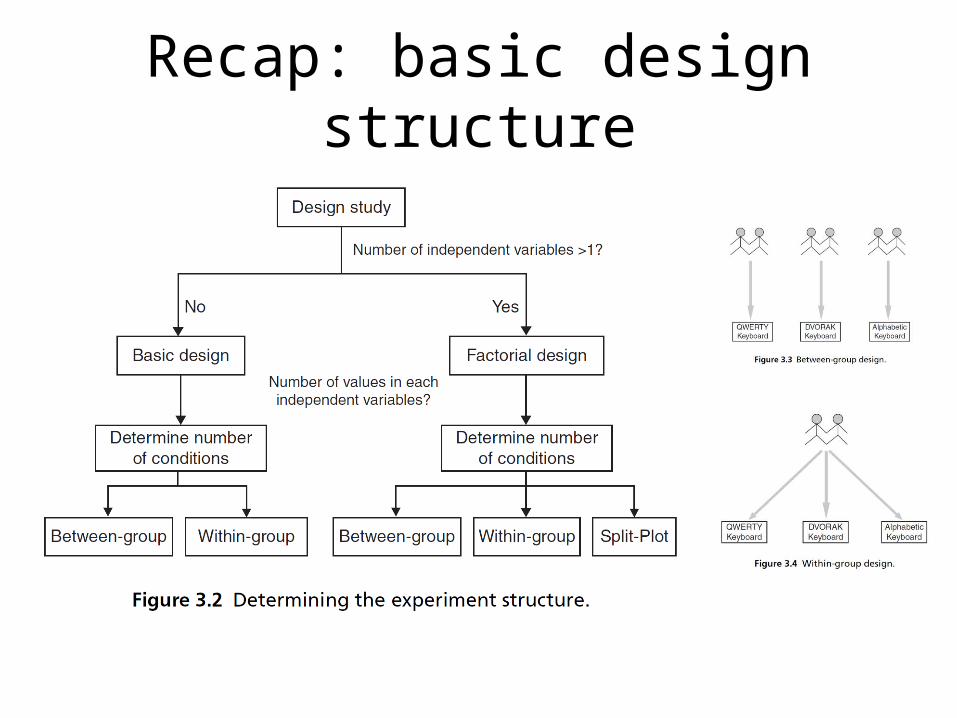
Recap: basic design structure

Comparing means
• Summary of methods

Comparing 2 means: T tests
• Independent-samples t test: between-group design
9101112
13
141516
Results: t = 2.1688, df = 15, p-value = 0.04781
How to report? An independent-samples t test suggests that there is significant difference in the task completion time between the group who used the standard word processing s/w and the group who used the prediction software (t(15) = 2.169, p<0.05)

Comparing 2 means: T tests
• Paired-sample t test: within-group design
Results: t = 2.6313, df = 7, p-value = 0.03385
How to report? A paired t test suggests that there is significant difference in the task completion time between the standard word processing s/w and the prediction software (t(7) = 2.631, p<0.05)

Comparing 2 or more means:Analysis of variance (ANOVA)
• Also called F tests• One-way ANOVA: for between-group design• Data layout: Table 4.6• Results summary:

9101112
13
141516
17181920
21
222324

Factorial ANOVA
• For between-group design• 2 or more independent variables involved• Data layout: table 4.9


Factorial ANOVA
• Summary results

Repeated measures ANOVA
• For within-group design• Can investigate one or more variables• One-way ANOVA

Repeated measures ANOVA
• One way ANOVA summary report:

Repeated measures ANOVA
• Two way ANOVA experiment design:
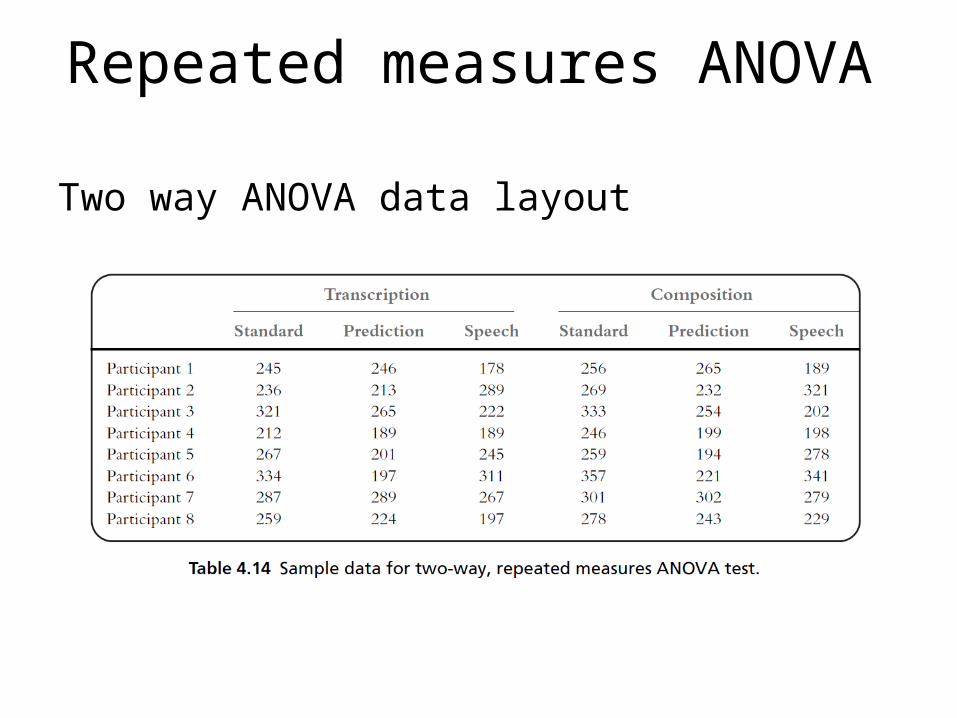
Two way ANOVA data layout
Repeated measures ANOVA

Repeated measures ANOVA
• Two way ANOVA summary report:

Split-plot ANOVA
• Involves both between-group and within-group factors
• Experiment design

Split-plot ANOVA data layout

Split-plot ANOVA summary report

Assumptions of t tests and F tests
• Errors should be independent of each other• Errors should be identically distributed• Errors should be normally distributed

Identify relationships
• Correlation: Two factors are correlated if there is a relationship between them
• Most commonly used test for correlation is the Pearson’s product moment correlation coefficient test
• Pearson’s r: ranges between -1 to 1• Pearson’s r square represents the proportion of the
variance shared by the two variables

Identify relationships
• Correlation does not imply causal relationship

Identify relationships
• Regression: can investigate the relationship between one DV and multiple IVs
• Regression is used for 2 purposes:– Model construction– Prediction
• Different regression procedures– Simultaneous– Hierarchical

Non-parametric tests
• Non-parametric tests are used when:– The error is not normally distributed– The distances between any two data units are not
equal– The variance of error is not equal

Non-parametric tests
• Chi-square test– Used to analyze categorical data– Table of counts (contingency table)– Assumptions of the test• Data points need to be independent • The sample size should not be too small

Non-parametric tests
• Two groups of data– For between-group design: Mann–Whitney U test or
the Wald–Wolfowitz runs test– For within-group design: Wilcoxon signed ranks test
• Three or more groups of data– For between-group design: Kruskal–Wallis one-way
analysis of variance by ranks– For within-group design: Friedman’s two-way
analysis of variance test